Abstract
Cassava (Manihot esculenta Crantz) is mainly cultivated in marginal land in the south of China where seasonal drought stress occurs frequently and the soil becomes more compact year by year. The study aimed to explore the effect of Fenlong tillage (FLT) combined with nitrogen applications on cassava rhizosphere soil particle composition and fungal community diversity. Conventional tillage (CT) was set as the control. The results indicated that the contents of clay and silt of the cassava rhizosphere soil were influenced by the tillage method, nitrogen (N), and their interaction. There was no difference in the richness and diversity of rhizosphere soil fungal communities among all treatments in 2019, while the richness of FLT was lower than that of CT in 2020. FLT caused a stronger influence on the community structure of rhizosphere fungi than N applications in the first year. The differences in the community structure of all treatments were reduced by continuous cropping of cassava in the second year. The top 10 dominant rhizosphere fungi at the class level of cassava found in 2019 and 2020 were Sordariomycetes, Dothideomycetes, Eurotiomycetes, Agaricomycetes, Intramacronucleata, norank_p__Mucoromycota, unclassified_p__Ascomycota, unclassified_k__Fungi, Pezizomycetes, and Glomeromycetes, which had an important relationship with soil pH, activity of urease, available nitrogen, available phosphorus, organic matter, and clay. These results indicated that FLT created a better soil environment for cassava growth than CT, thus promoting the formation of more stable rhizosphere fungal community structures.
1. Introduction
Tillage is an important technical measure in agricultural production. Different tillage methods, that is, the intensity and mode of soil mechanical disturbance, can change the composition and particle size distribution of soil particles [1], thus affecting the physical properties of soil and indirectly affecting crop yield, soil nutrients, enzyme activities, and microbial community changes [2,3,4]. Nowadays, due to the shallow soil layer of traditional tillage plots, fertilizer utilization rate and yield are adversely affected year by year [5,6,7]. To ensure crop yield, farmers have increased the use of chemical fertilizers, resulting in soil acidification, water pollution, and other agricultural non-point source pollution problems [8,9]. Excessive application of nitrogen fertilizer is one of the main reasons for pollution in agricultural production, so rational application of nitrogen fertilizer is particularly important for the sustainable development of agricultural production [10,11,12].
Soil fungi are an important component of the soil microbiome and a momentous indicator of soil health evaluation [13,14,15]. Soil fungal diversity and its community structure have a profound impact on the ecosystem and play an important role in crop production and ecosystem balance, which has become a research hotspot in soil microecology [16,17]. The composition and diversity of crop rhizosphere fungi were affected by different tillage methods. Plough tillage, zero tillage, and chisel plough tillage directly affected soil organic carbon content and the decomposition of crop residues, leading to changes in the temporal and spatial distributions of the rhizosphere fungal community [18]. Cover cropping and no-till also increased diversity and the ratios of symbiotroph: saprotroph of rhizosphere soil fungal communities [19]. However, other studies found that no-till has no significant effect on rhizosphere soil fungal diversity, but promoted a more stable community structure [20,21]. Other agricultural management methods, such as direct sowing, reduced tillage, full tillage, and crop rotation, also influenced rhizosphere soil fungal diversity [22]. In addition, nitrogen application significantly changed the rhizosphere soil fungal community structure. Excessive nitrogen application increased the proportion of pathogen species [23]. Long-term nitrogen application not only reduced the diversity of rhizosphere soil fungi but also changed the composition of the rhizosphere soil fungal community, and the effect of high-concentration fertilizer treatment was greater than that of low-concentration fertilizer treatment [24]. Other studies showed that with the increase in nitrogen fertilizer applications, although the relative abundance of fungi was not significantly changed, the composition of the community was changed, and the soil carbon cycle was negatively affected, which promoted the formation of fungi with pathogenic traits [23,25].
As a new technology for field preparation, Fenlong tillage (粉垄, FLT), which is also called deep vertical rotary tillage [26,27,28], smash ridge tillage [29,30,31], or Fenlong ridging [32], uses spiral drill bits to replace traditional ploughshares with depths up to 30–60 cm according to various requirements. Fenlong has been extensively used in many crops, such as maize [26,27], rice [31], wheat [30], cotton [29], and sugarcane [28,30] in China. Under the same N rate, application of FLT on summer maize could significantly reduce the soil bulk density in the 0–40 cm soil layer and increase water content in the 0–60 cm soil layer, ending up with a significantly higher amount of root dried matter in the 0–30 cm soil layer and a higher grain yield than no tillage and subsoiling tillage [26,27]. Compare to traditional turn-over ploughing, FLT with a 40 cm depth significantly improved soil bulk density, organic carbon, available phosphorus, nitrogen, potassium, and soil oxidation–reduction potential, which substantially improved the growth of rice roots and especially improved root morphology and physiology, ending up with a higher grain yield [31]. FLT was applied on sugarcane and also found to decrease soil bulk density and increase soil water storage to some extent, especially in deep soil, resulting in a well-developed root system and satisfied sugarcane yield [28]. The growth-promoting effects of FLT on sugarcane have been explored by Duan et al. [32], and the results indicated that FLT promoted the activity of endophytic microbes in the roots, which might have an effect on sugarcane yield and soil chemical properties.
Cassava (Manihot esculenta Crantz) is mostly grown in tropical and subtropical climates. In China, cassava is grown under the traditional tillage method with a single-share plough and a pair of rakes. With the conventional tillage method applied for years, a shallow plough layer about 20 cm depth is shaped and very easy to compact, leading to decreasing fertilizer utilization efficiency and a decline in field productivity [33,34,35]. Moreover, the phenomenon of cassava continuous cropping is prevalent in China [36], which results in the continuous deterioration of the soil’s physical and chemical properties and hinders the growth and development of crops [37,38]. Our previous results showed that FLT had significant effects on increasing cassava yields, and the yield was guaranteed even with reduced fertilization [39]. However, the mechanism behind this relationship was still unknown and it would be very interesting to find the optimal fertilizer traits for application of FLT on cassava production, especially considering the N application. It has been proved that N loss from fields on sloping landscapes, where cassava is commonly cultivated, was far more severe than from flat fields, which could cause agricultural non-point source pollution [40]. Thus, the current study aimed to reveal the mechanism of how FLT, combined with optimal nitrogen application, benefits both the soil environment and cassava from the rhizosphere soil fungal community aspect.
2. Materials and Methods
2.1. Experiment Site
The experiment was conducted from April 2019 to December 2020 in Wuming Lijian, Guangxi province, China (22°59′58′′ N, 107°49′26′′ E). The climate data are shown in Figure S1. In the arable layer (0–20 cm), the soil pH value was 5.65, and the contents of organic matter (OM), available nitrogen (AN), available phosphorus (AP), and available potassium (AK) were 17.23 g·kg−1, 60.38 mg·kg−1, 45.09 mg·kg−1, and 42.17 mg·kg−1, respectively.
2.2. Experimental Design
The most popular cassava cultivar in China, ‘South China 205’, was selected as the plant material. A split-plot design was used for the field experiment. In addition, two tillage methods were set as the main factor, while four nitrogen application rates were treated as the secondary factor. Two blocks were split along the long dimension for the tillage treatments: conventional tillage (CT, ploughed once at 30–35 cm depth and then raked twice at 18 cm depth) and Fenlong tillage (FLT, deep vertically rotated once at 35 cm depth). Two tillage treatments were applied in 2019 and only raked twice at 18 cm depth without mixing the plough layer and the plough pan in 2020. Nitrogen rate treatments have been maintained on the same plots for the duration of the experiment. The four nitrogen application levels were 0, 25, 50, and 100% N, respectively. Among them, 100% N is used as routine cassava fertilizer application (N: 358.80 kg·ha−1, P2O5: 89.10 kg·ha−1, K2O: 187.50 kg·ha−1). Phosphorus and potassium fertilizers were applied according to the conventional amounts.
In the field, the second factor was randomly grouped into the primary factor. In total, there were eight treatments with three replicates each, ending up with 24 plots. Each plot was 14 m long and 5 m wide, with a total of 70 m2 and a row spacing of 1 m × 1 m, ending up with 70 cassava plants in each plot. The cassava was planted from April 16 to 18 in 2019 and 2020, respectively. No base fertilizer was applied before planting. The first top dressing was carried out 60 days after planting, accounting for 60% of the total amount of fertilizer application. The second time was 120 days after planting, accounting for 40% of the total amount of fertilizer applied. Top dressing was carried out by spreading the fertilizer and forming small ridges covered with a thin layer of soil after fertilization. No artificial irrigation was applied during the experiment period. The harvest of cassava root was on 16 and 17 December in 2019 and 2020, respectively.
2.3. Sampling
Three plants were destructively sampled in each plot on 15 December in 2019 and 2020, and the details of cassava rhizosphere soil sampling are as follows. After removing the topsoil, the whole root system, including tuberous roots, was carefully taken out and the bulk soil was removed by careful shaking. We then put the roots in plastic film and used sterile brushes and tweezers to collect the soil attached to the root surface. The rhizosphere soil was then divided into two portions by the quartering method after removing debris and plant residue and mixing the rhizosphere soil on plastic film. One portion was further divided into two parts: one part (about 50–100 g) was immediately frozen with liquid nitrogen and stored at –80 °C for the determination of rhizosphere soil fungi. The other one was labelled and stored at 4 °C for the determination of urease activity as soon as possible. This second portion was air dried at room temperature, ground, and screened for the determination of soil particle composition, pH, OM, AN, AP, and AK.
2.4. Determination of Soil Physicochemical Properties and Enzyme Activity
Gravel (>2 mm particle diameter) was screened out during soil sample preparation, and the composition of soil particles ≤ 2 mm was measured. To remove organic matter, 10 mL of 10% H2O2 was added to each 0.5 g soil sample. Then 10% HCl solution was added to remove carbonate salts. After that, about 80 mL of deionized water was added and stabilized for 24 h. The supernatant liquid was then removed on the second day. Subsequently, the pH of the suspension was adjusted to 6.5–7.0 with 0.1 mol/L sodium hexametaphosphate. Ultrasonic vibration for 10 min was operated, and the percentage volume of soil particles in the range of 0.02–2000 μm was measured using a laser particle analyzer (Mastersizer 2000, Malvern Company, UK). The rhizosphere soil particle composition proportions of different treatments were classified according to the US standard for soil texture particle size classification. Soil pH was measured by an acidity meter (the soil–water ratio was 1:2.5); OM was measured by the potassium dichromate method; AN was measured by the alkali-hydrolyzed diffusion method; AP was measured by a spectrophotometer after leaching; and AK was measured by a flame photometer after leaching [41]. The activity of urease was analyzed by the phenol-sodium hypochlorite colorimetric method [42].
2.5. MiSeq High-Throughput Sequencing
The DNA of cassava rhizosphere fungus was extracted using the E.Z.N.A.® Soil DNA Kit (Omega Bio-Tek, Norcross, GA, USA). Its concentration and purity were measured using NanoDrop2000. The DNA integrity was detected by 1% agarose gel electrophoresis. Primers SSU0817F (5′-TTAGCATGGaATaATRRaATAGGA-3′) and 1196R (5′-TCTGGACCTGGTGAGTTTCC-3′) were used to amplify the target fragment of the 18S rRNA sequence SSU0817F_1196R region [43]. The region was amplified using polymerase chain reaction (PCR) analysis (95 °C for 3 min, followed by 35 cycles at 95 °C for 30 s, 55 °C for 30 s, and 72 °C for 45 s, with a final extension of 72 °C for 10 min). The PCR reactions were performed in triplicate in a 20 μL mixture, containing 4 μL of 5 × FastPfu Bufer, 2 μL of 2.5 mM dNTPs, 0.8 μL of each primer (5 μM), 0.4 μL of FastPfu Polymerase, 10 ng of template DNA, and deionized distilled water for a total volume of 20 μL. Three duplicate PCR products were mixed and then detected by 2% agarose gel electrophoresis. Purification and quantification of the PCR products were performed by using the AxyPrep DNA Gel Extraction Kit (Axygen Biosciences, Union City, CA, USA) and Quantus™ Fluorometer (Promega, Madison, WI, USA), respectively. The NEXTFLEX Rapid DNA-Seq Kit was used for constructing the library. Purified amplicons were paired-end sequenced (2 × 300) using the Illumina MiSeq PE300 platform (Illumina, San Diego, CA, USA) at Shanghai Majorbio Bio-pharm Technology Co., Ltd., Shanghai, China.
2.6. Statistical and Bioinformatics Analysis
The acquired raw sequences in 2019 and 2020 were 977,406 and 1,128,074, respectively, and 94,846 and 109,591 chimera sequences were identified and then removed. Trimmomatic software was used for quality control of the original sequencing, and Flash (http://www.cbcb.umd.edu/software/flash, version 1.2.11, accessed on 17 July 2021) was used for splicing with the following criteria: (1) the reads were truncated at any site receiving an average quality score < 20 over a 50-bp sliding window; (2) sequences whose overlap was longer than 10 bp were merged according to their overlap with mismatch no more than 2 bp; (3) sequences of each sample were separated according to barcodes (exactly matching) and primers (allowing two nucleotide mismatching), and reads containing ambiguous bases were removed. UPARSE software (http://drive5.com/uparse/, version 7.0.1090, accessed on 17 July 2021) was used to perform OTU clustering on the sequences based on 97% similarity. Chimeric sequences were removed by using USEARCH (http://www.drive5.com/usearch/, version 11, accessed on 17 July 2021). The RDP classifier (http://rdp.cme.msu.edu, accessed on 17 July 2021) was used to annotate each sequence for species classification, and the Silva database (SSU138) was compared with the threshold of 70%. There were 3388 OTUs and 4873 OTUs that were found to not belong to the fungal kingdom and discarded in 2019 and 2020, respectively. Mothur software was used for alpha diversity analysis (https://www.mothur.org/wiki/Download_mothur, version 1.30.2, accessed on 17 July 2021). The Qiime distance matrix was used to calculate the beta diversity (http://qiime.org/install/index.html, version 1.9.1, accessed on 17 July 2021). Principal coordinate analysis (PCoA) is a non-binding method for the dimensionality reduction of data, which can reflect the similarity and difference of community composition among different samples. Non-metric multidimensional scaling (NMDS) is a data analysis method that can simplify the research objects (samples or variables) in multidimensional space to low-dimensional space for positioning, analysis, and classification while preserving the original relationships between objects. In addition, the R language (Version 3.3.1) was used to analyze and draw community bar plots, PCoA, NMDS, analysis of redundancy (RDA), and correlation heatmaps. All raw reads obtained from this study were uploaded to the National Center for Biotechnology Information (NCBI) and can be accessed by the login number PRJNA853910.
Microsoft Excel 2016 was used for data sorting. IBM SPSS Statistics 25.0 software was used for analysis of variance (ANOVA), paired t-test, and multiple comparisons. Principal component analysis (PCA) was calculated with the software SIMCA 14.0 (Umetrics AB, Umeå, Sweden).
3. Results
3.1. Tillage and Nitrogen Application Influenced Particle Composition and Chemical Properties of Cassava Rhizosphere Soil
ANOVA and multiple comparisons of the relative content of soil particle size composition under different treatments in 2019 and 2020 were calculated, respectively (Table S1 and Table 1). Both tillage and nitrogen application rates caused significant effects on the contents of rhizosphere soil clay and silt among all treatments in 2019, and these effects lasted until 2020. The relative content of sand in the cassava rhizosphere soil was only influenced by the N application rate in both 2019 and 2020 (Table S1).

Table 1.
Multiple comparisons and paired t-test of the cassava rhizosphere soil particle compositions under different treatments.
In 2019, the rhizosphere soil clay content of the 100% N treatment was higher than other N applications among FLT and CT treatments. Under the same N treatment, the rhizosphere soil clay content of FLT was higher than that of CT, and paired t-tests of the rhizosphere soil clay content between the two tillage methods in 2019 showed a similar trend (Table 1). The rhizosphere soil clay content of FLT was significantly higher than that of CT in 2019, but the rhizosphere soil clay content of FLT was lower than that of CT in 2020. The rhizosphere soil clay content of CT in 2019 was significantly lower than that of CT in 2020, while FLT in 2019 and FLT in 2020 showed no significant differences, indicating that CT increased rhizosphere soil clay content in the second year and that FLT could better maintain the loose soil structure (Figure S3).
The paired t-tests of the silt content in the rhizosphere soil showed that CT was significantly higher than that of FLT in 2019, but the opposite is true in 2020. The silt content in the rhizosphere soil of CT in 2019 was significantly higher than CT in 2020. For the paired t-tests of the sand content in the rhizosphere soil, there was no significant effect between tillage methods in either 2019 or 2020. The sand content in the rhizosphere soil of FLT in 2019 was significantly higher than that of FLT in 2020.
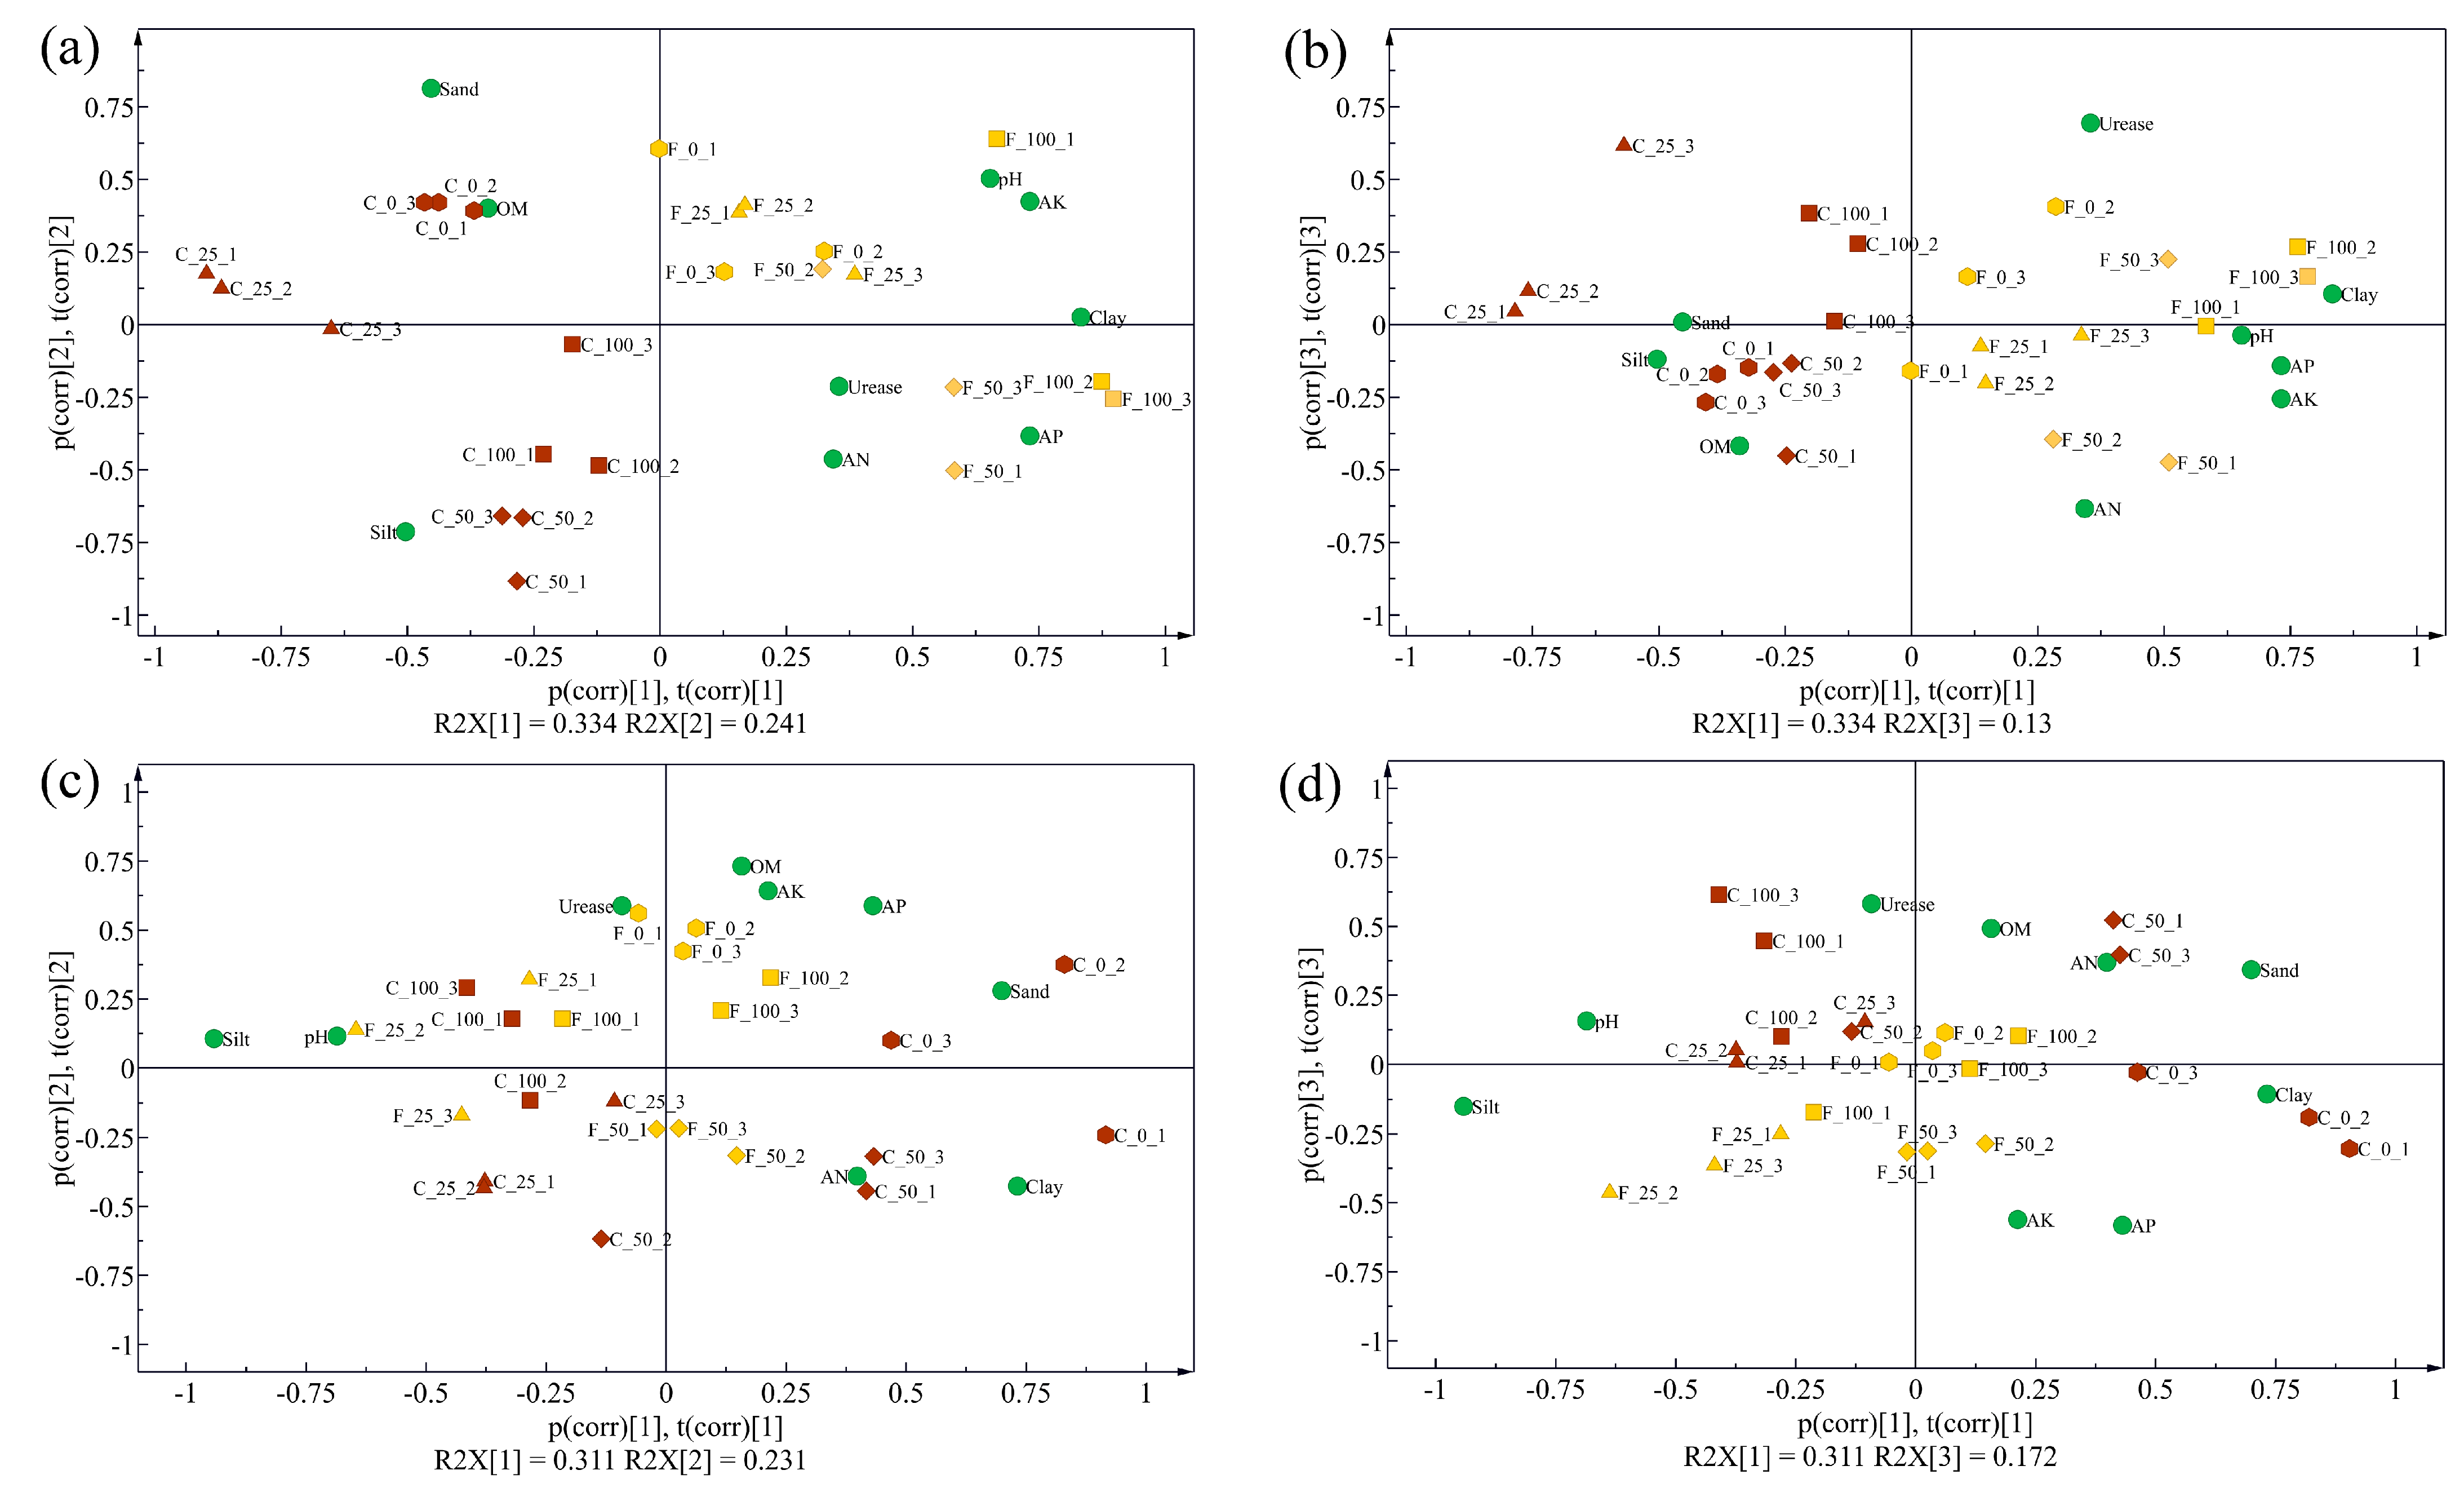
Furthermore, PCA models were calculated based on rhizosphere soil physical and chemical properties collected in 2019 and 2020, respectively. According to the PCA biplots for 2019, two tillage methods were separated clearly by the first component, which explained 33.4% of the total variance, while the second component mainly indicated the difference caused by N application rates (Figure 1a,b). In addition, the FLT group was close to clay, AN, AP, AK, pH, and activities of urease, which indicated that FLT treatment caused positive effects on those parameters. In 2020, the two tillage treatments were separated into two groups with slight overlaps by the first two components, which explained 31.1% and 23.1% of the total variance, respectively (Figure 1c,d). The 100% N treatment in the CT group merged with the FLT group, which indicated that influences caused by FLT decreased while influences caused by N increased.
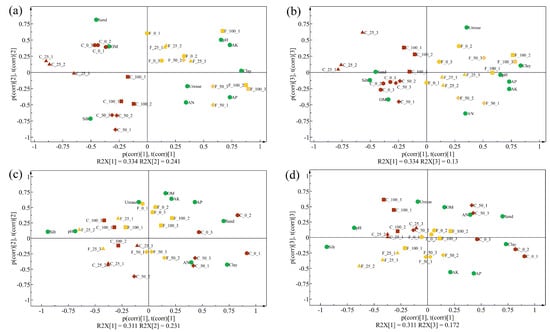
Figure 1.
Biplots of the principal component analysis models of the physical and chemical properties of cassava rhizosphere soil samples collected in 2019 (a,b) and 2020 (c,d), respectively. The sample ID was named ‘tillage_N rates_replicate’, and C and F represent conventional tillage and Fenlong tillage, respectively. OM, organic matter; AN, available nitrogen; AP, available phosphorus; AK, available potassium.
3.2. Alpha Diversity of Cassava Rhizosphere Soil Fungi
DNA was extracted from 48 soil samples. The MiSeq platform was used for 18S rRNA gene sequencing. The lengths of 18S rRNA gene sequences obtained in each sample of 2019 and 2020 ranged from 228 to 434 bp and 253 to 434 bp, respectively. The average sequence lengths of each sample collected in 2019 and 2020 were 381.07 bp and 381.24 bp, respectively.
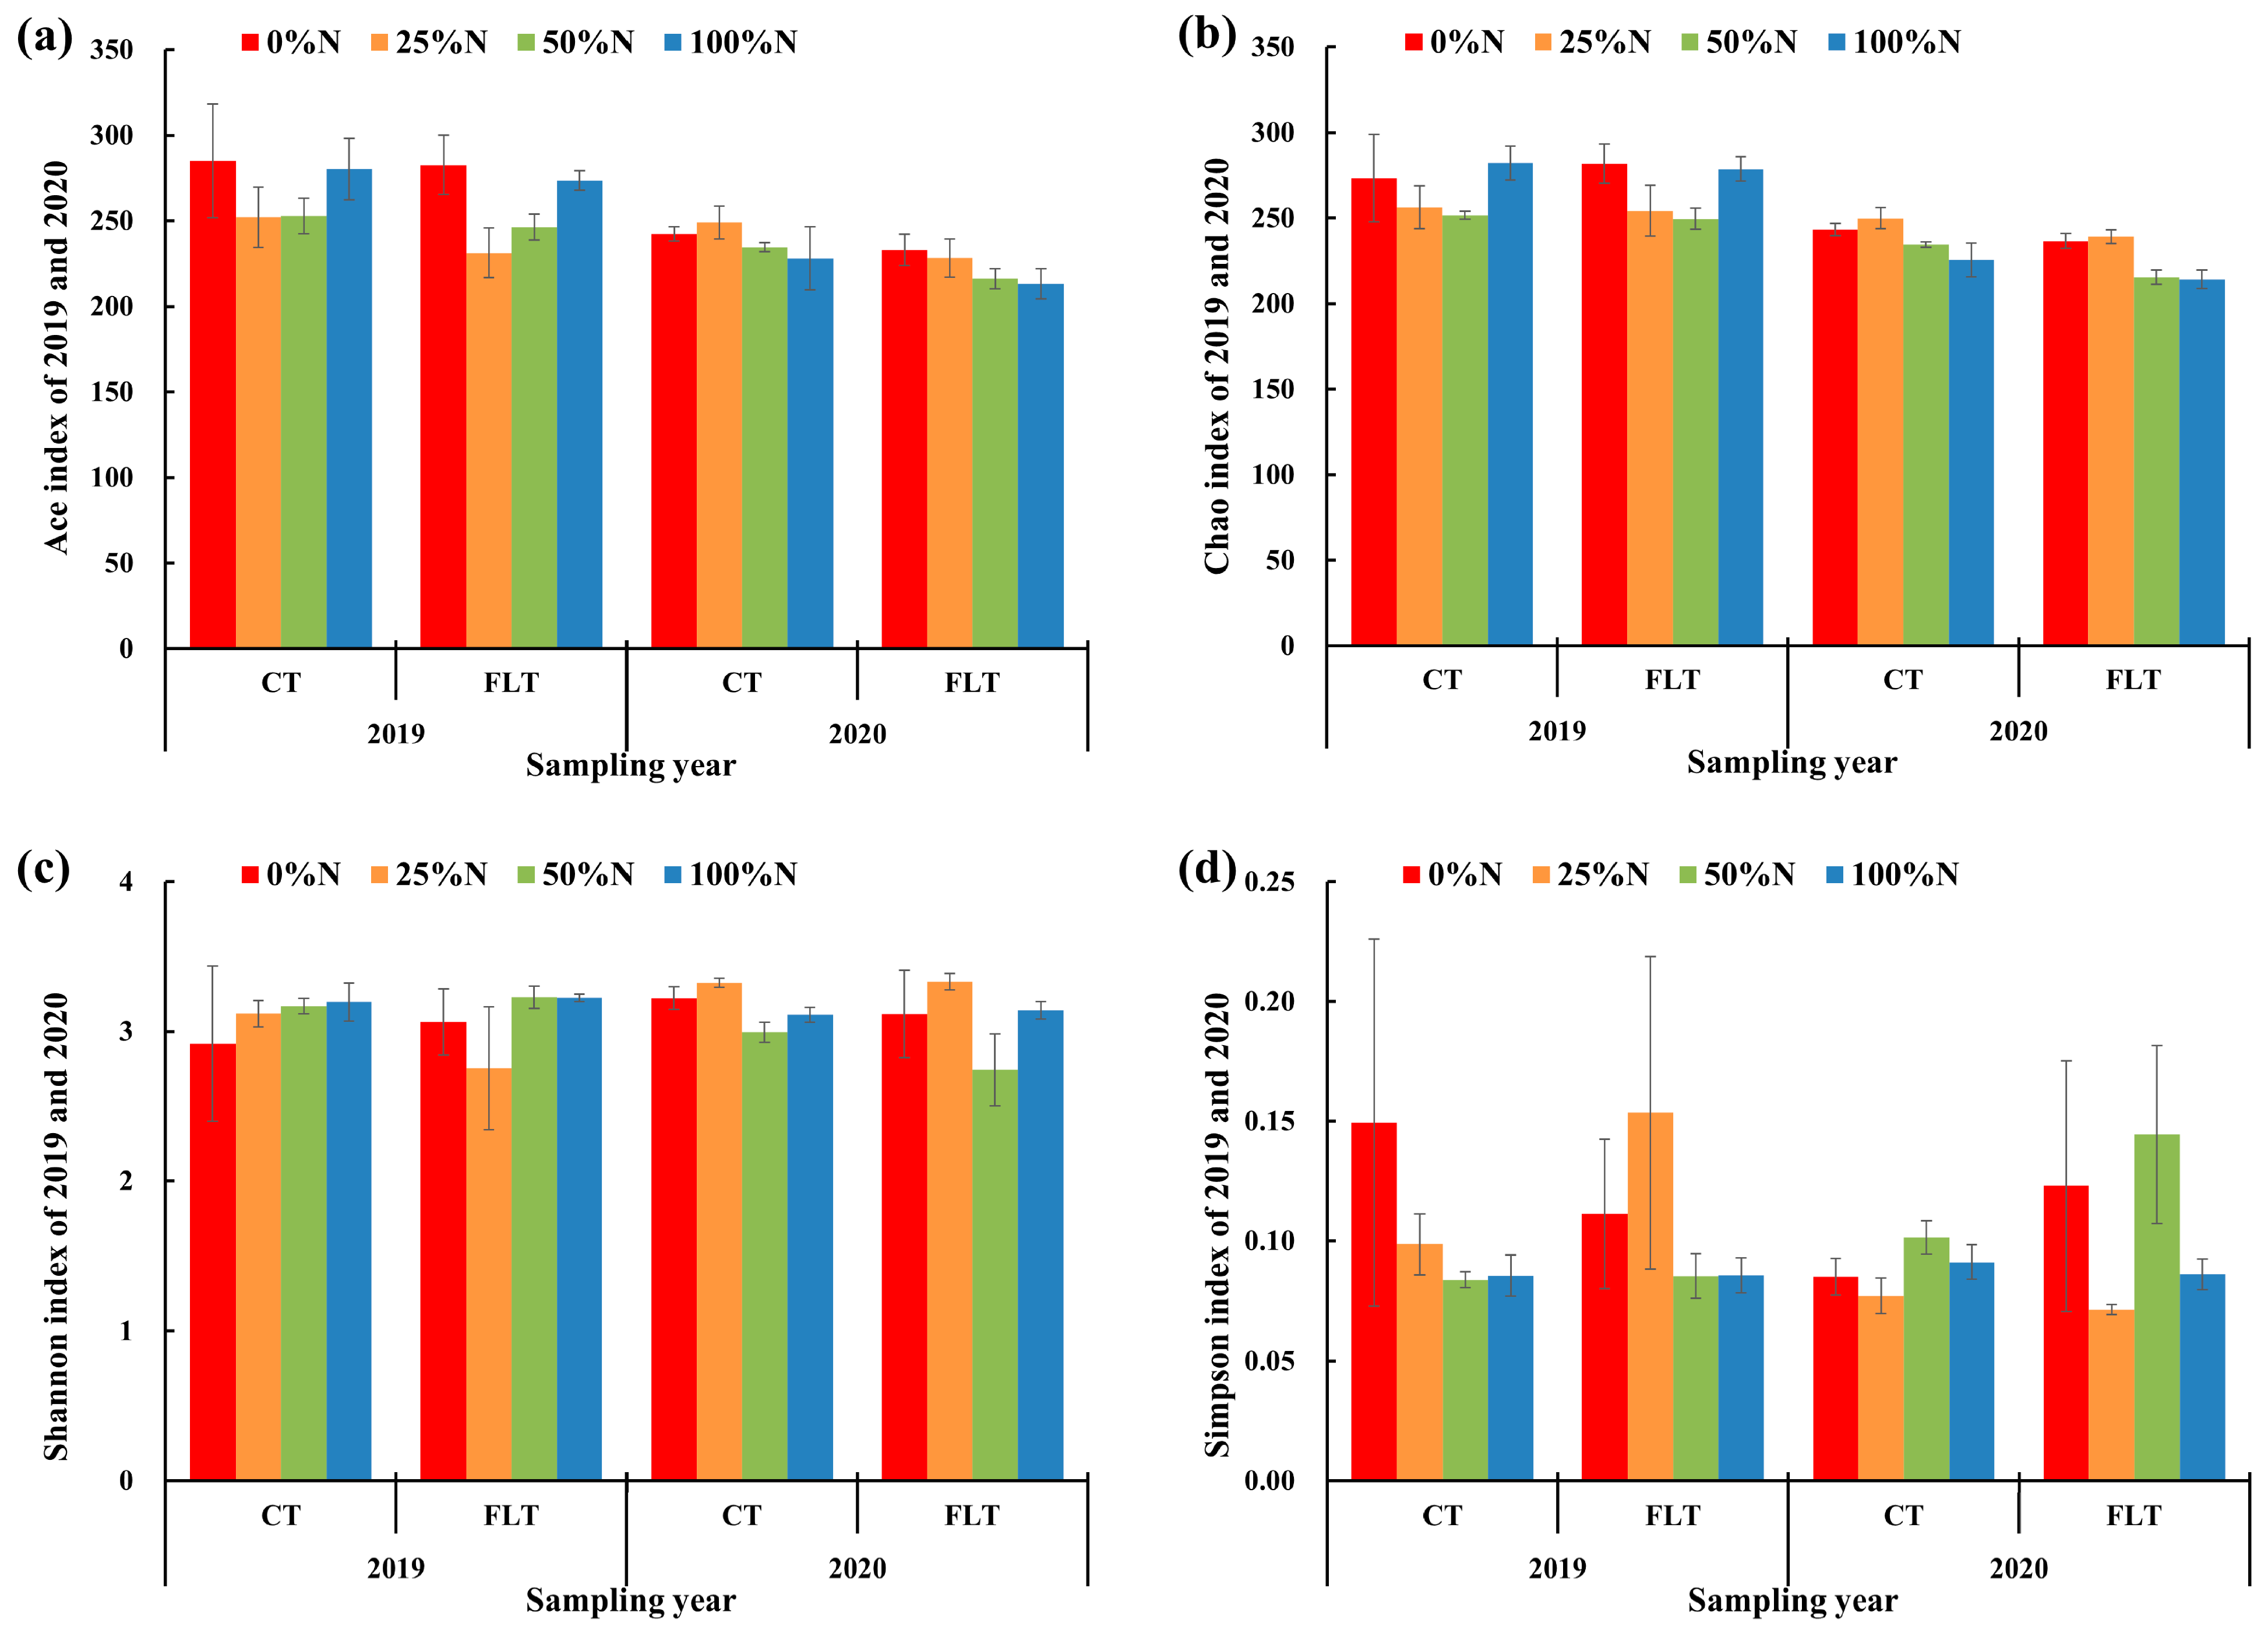
The richness and diversity of the rhizosphere soil fungal community were analyzed (Table 2 and Figure 2). Tillage and nitrogen application rates had no significant effect on the richness and diversity of each treatment in 2019 (Table 2). In 2020, tillage had significant effects on the Ace indices of cassava rhizosphere soil fungi (Table 2). Paired t-tests showed that the Ace and Chao indices of CT were higher than those of FLT, indicating that continuous conventional tillage could maintain the richness of the rhizosphere soil fungal community to a certain level. The nitrogen application rate had a significant impact on the Shannon index, and the Shannon index of the 25% N treatment under two tillage methods was the highest among other treatments in 2020 (Table 2 and Figure 2c).

Table 2.
ANOVA and paired t-test of the fungal richness and diversity indices of cassava rhizosphere soil collected in 2019 and 2020, respectively.
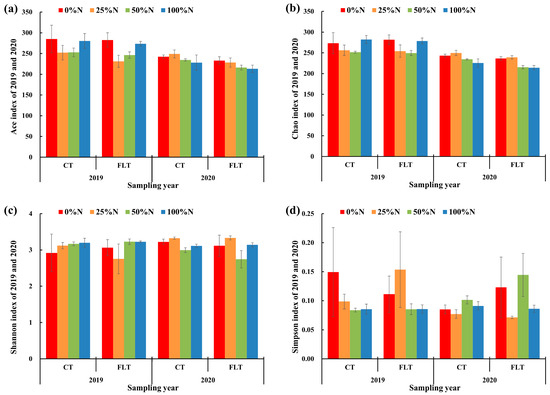
Figure 2.
Fungal alpha diversity indices of cassava rhizosphere soil collected in 2019 and 2020, respectively. Error bars of each column diagram represent standard error. CT, conventional tillage; FLT, Fenlong tillage. The meaning of (a–d) is explained in the legends of the y-axis.
3.3. Fungal Community Structure and Composition in Cassava Rhizosphere Soil
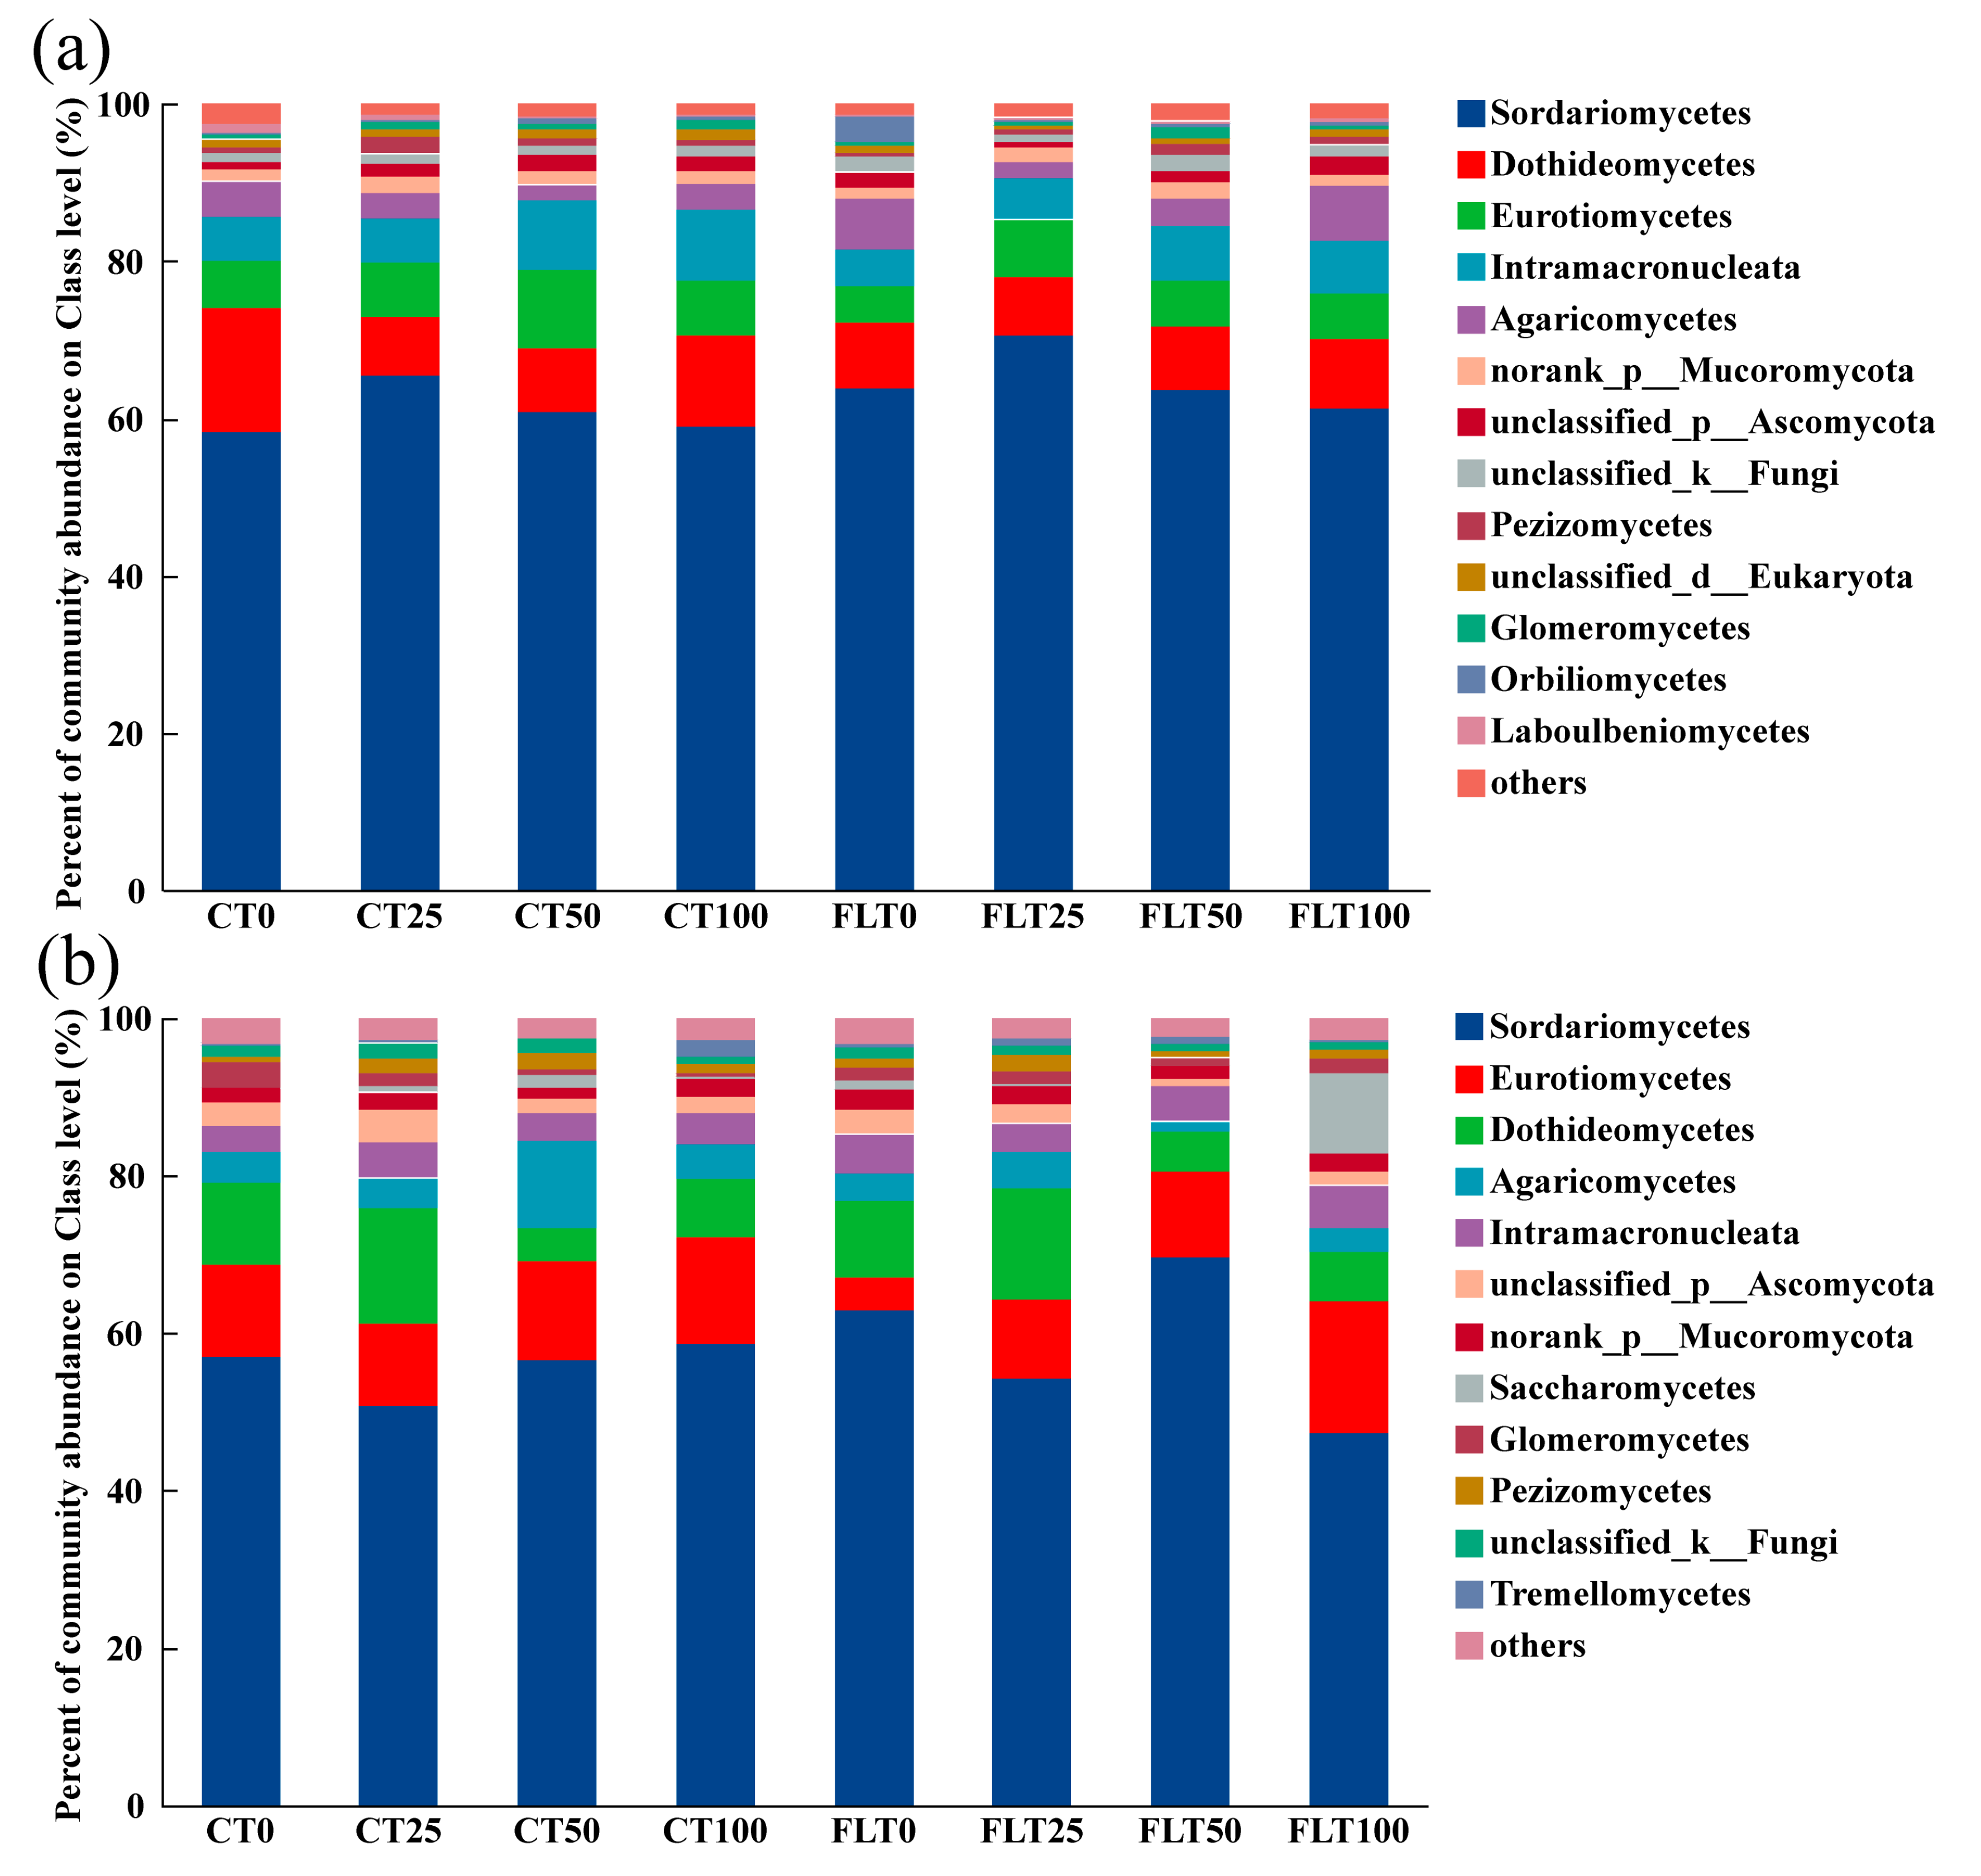
To understand the community composition of cassava in rhizosphere soil at different tillage and nitrogen application levels, fungal community composition and relative abundance were analyzed at the class classification level (Figure 3). There were 468 OTUs that could be identified at the species level, but there was some overlap in species identities among all treatments in 2019, ending up with 210 species that belong to 158 genera, 132 families, 92 orders, 54 classes, and 17 phyla (Figure 3a). The top five dominant fungi at the class level were Sordariomycetes (relative abundances ranged 58.28–70.48%), Dothideomycetes (7.48–15.73%), Eurotiomycetes (4.71–9.90%), Intramacronucleata (4.60–9.01%), and Agaricomycetes (1.93–6.90%). In addition, the other fungi with relatively low abundances (where one of the samples was greater than 1%) were norank_p_Mucoromycota (1.46–2.11%), unclassified_p_Ascomycota (0.65–2.26%), unclassified_k_Fungi (1.00–2.23%), Pezizomycetes (0.55–2.20%), unclassified_d_Eukaryota (0.70–1.29%), Glomeromycetes (0.35–1.44%), Orbiliomycetes (0.22–3.19%), and Laboulbeniomycetes (0.19–1.14%). According to the ANOVA of the relative abundance of all the listed fungi at class level, neither tillage nor N application treatments had an impact on these fungi in 2019.
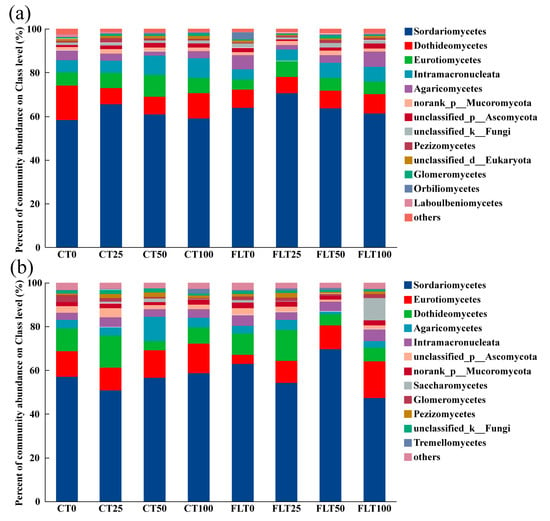
Figure 3.
Relative abundances of the dominant fungal classes of cassava rhizosphere soil collected in 2019 (a) and 2020 (b), respectively. Different colors are used to represent the fungal classes with a relative abundance greater than 1%. “CT0, 25, 50, and 100” represent “0, 25%, 50%, and 100% N of conventional tillage”, respectively. “FLT0, 25, 50, and 100” represent “0, 25%, 50%, and 100% N of Fenlong tillage”, respectively.
There were 443 OTUs that could be identified at the species level, but there was some overlap in species identities among all treatments in 2020, ending up with 202 species that belong to 154 genera, 130 families, 90 orders, 53 classes, and 16 phyla (Figure 3b). The top five fungi at the class level were the same as in 2019, i.e., Sordariomycetes (47.40–69.52%), Eurotiomycetes (4.10–16.61%), Dothideomycetes (4.06–14.66%), Agaricomycetes (1.09–11.07%), and Intramacronucleata (3.33–5.35%). Other fungal classes with a relative abundance > 1% were unclassified_p_Ascomycota (1.09–4.27%), norank_p_Mucoromycota (1.35–2.77%), Saccharomycetes (0.05–10.13%), Glomeromycetes (0.57–3.24%), Pezizomycetes (0.72–2.03%), unclassified_k_Fungi (0.85–1.92%), and Tremellomycetes (0.25–2.14%). The relative abundance of Dothideomycetes and unclassified_p_Ascomycota was affected by the nitrogen application rate (ANOVA, p < 0.05). Under the different tillage methods in 2020, the relative abundances of Dothideomycetes and unclassified_p_Ascomycota in 50% N and 100% N treatments were higher than that in 0% N and 25% N treatments. The relative abundance of Intramacronucleata in 2019 was significantly higher than that in 2020 under CT (paired t-test of CT between 2019 and 2020, t = 3.207, df = 11, p < 0.01). The relative abundance of unclassified_p_Ascomycota in 2019 was significantly lower than that in 2020 under CT (paired t-test of CT between 2019 and 2020, t = −2.422, df = 11, p < 0.05).
3.4. Beta Diversity Analysis of Cassava Rhizosphere Soil Fungi
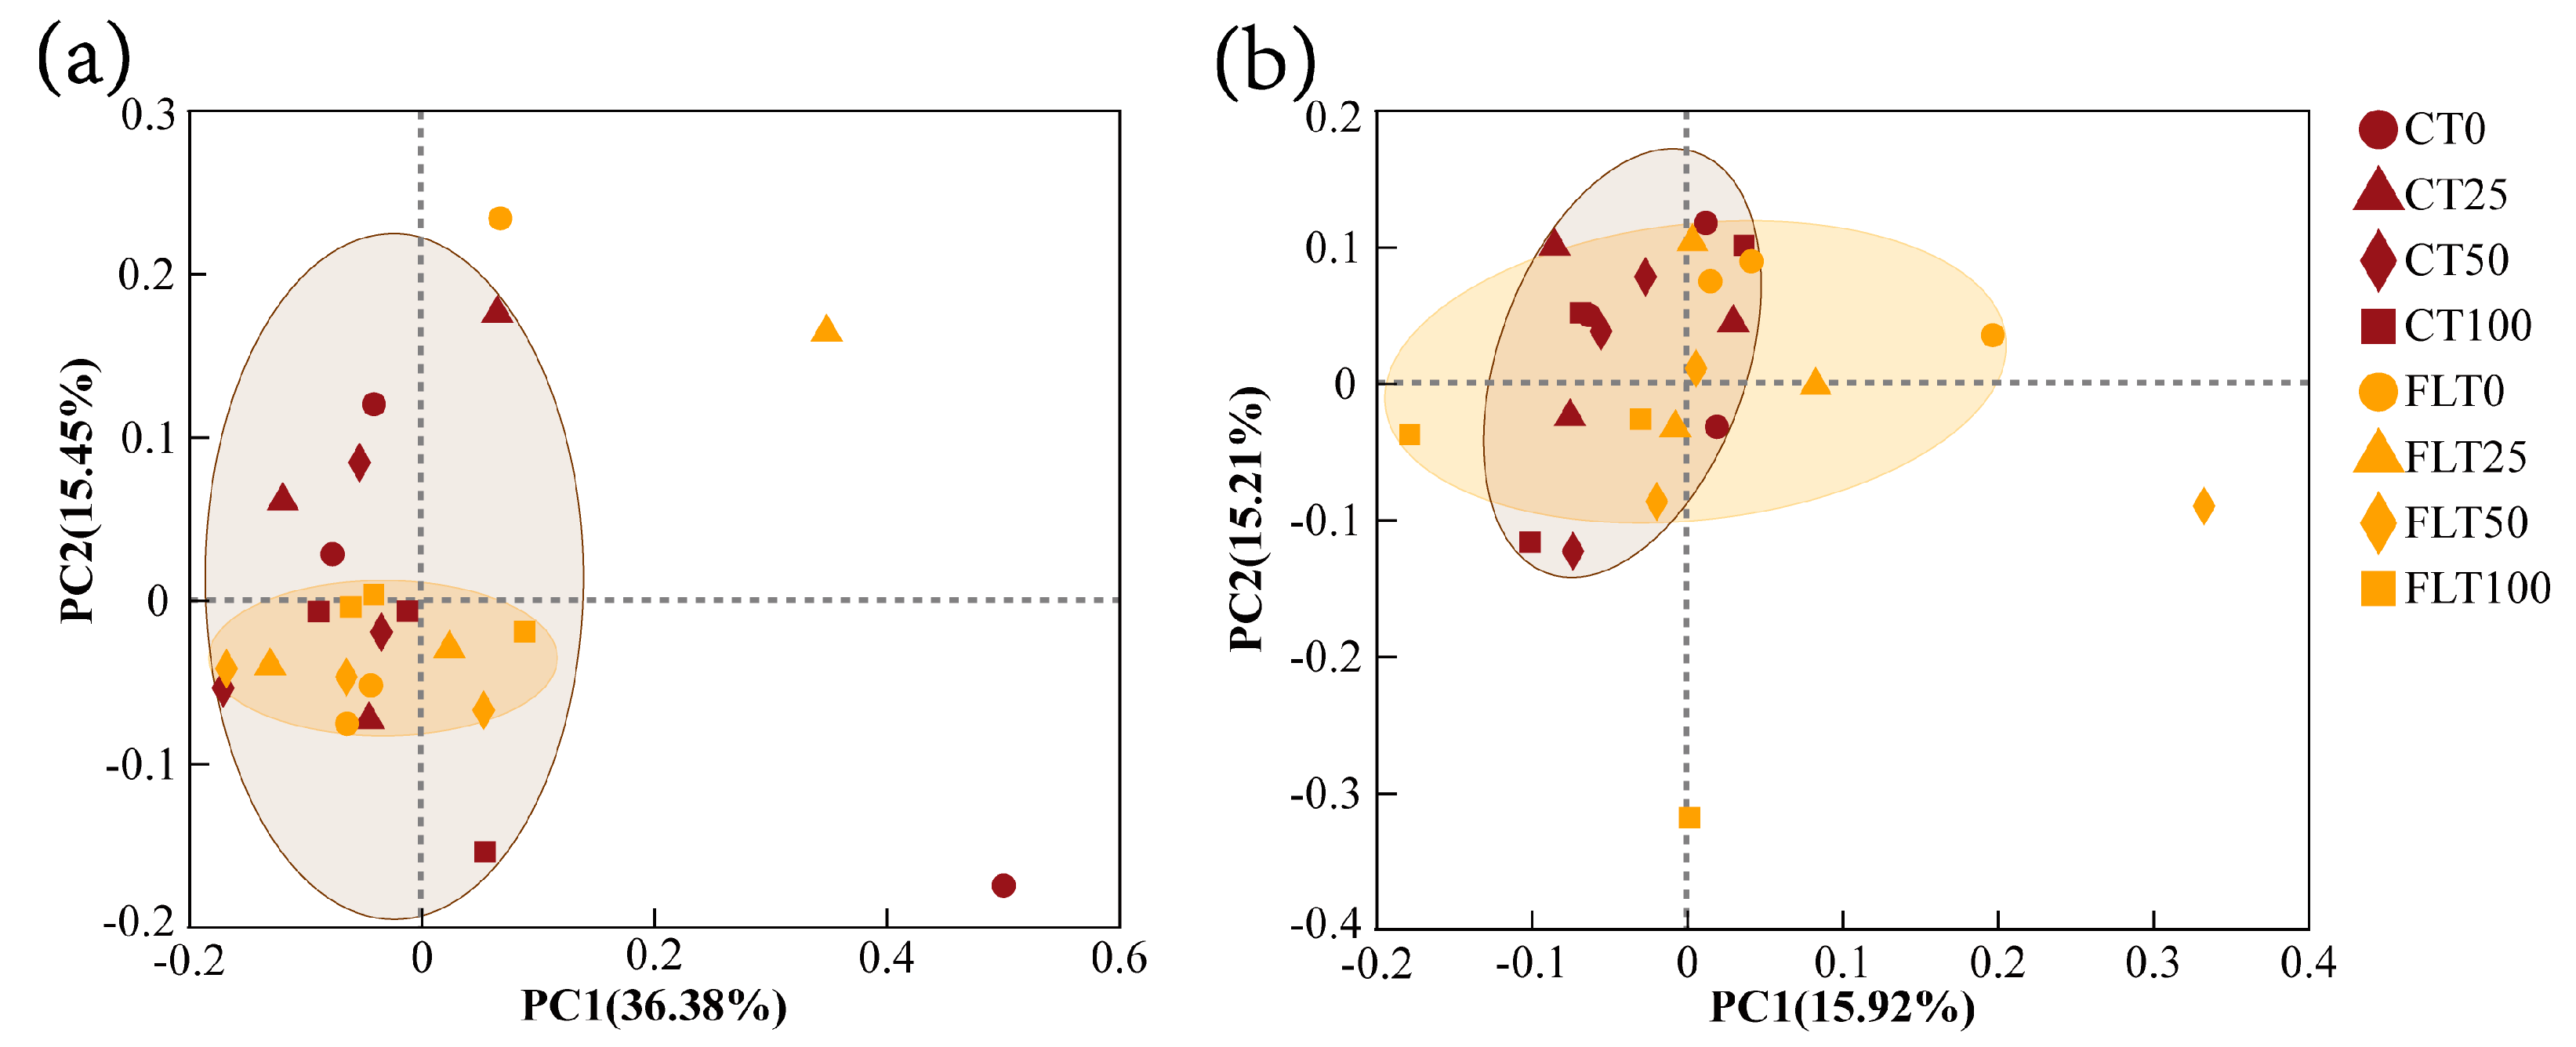
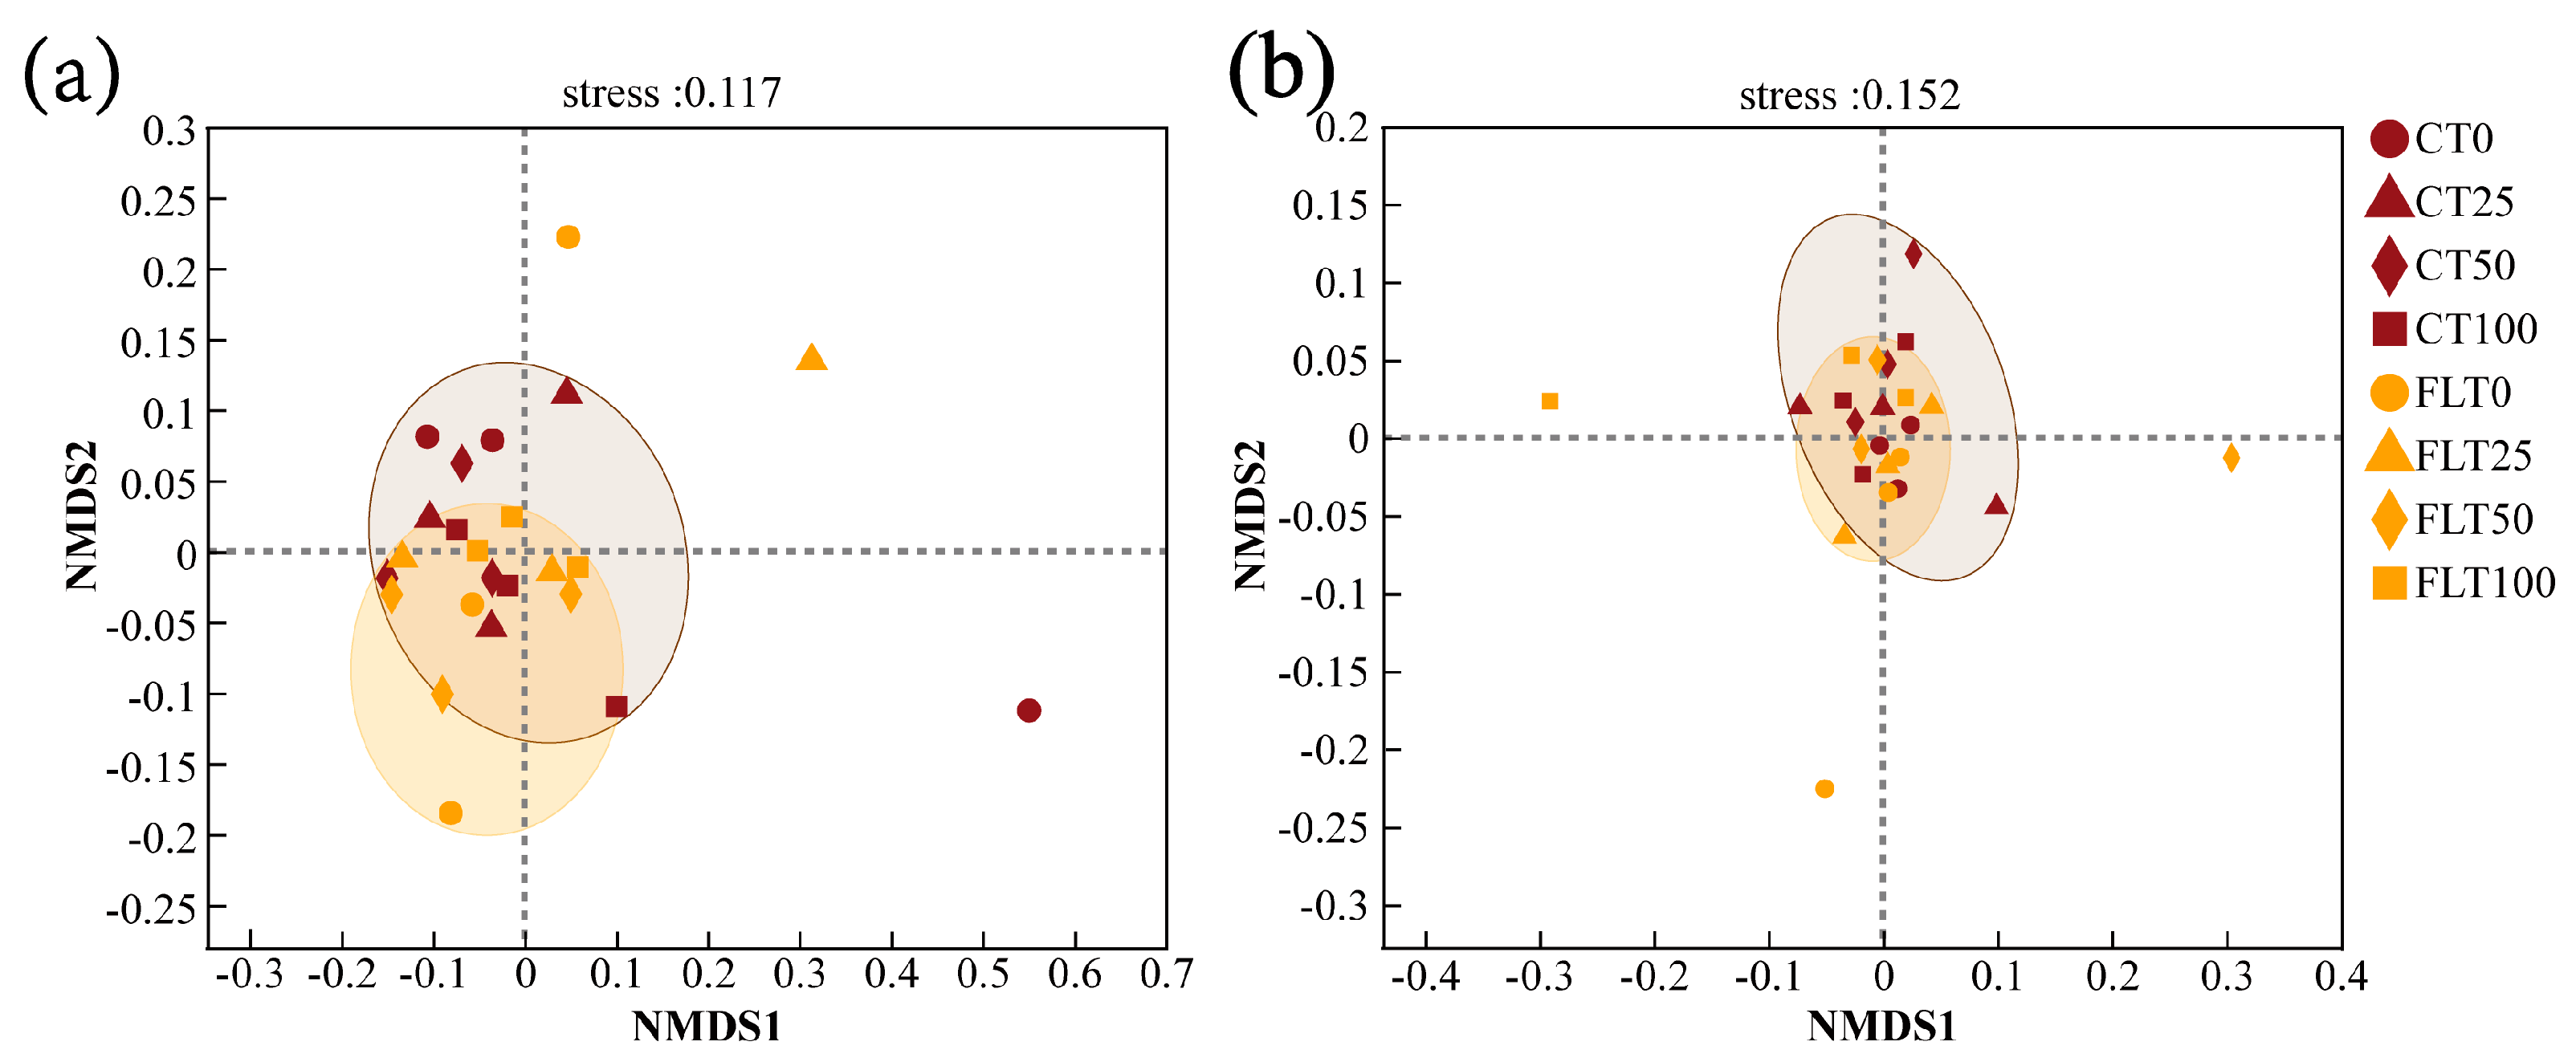
PCoA modelling and NMDS modelling based on Bray–Curtis distance were all calculated for analyzing the β diversity of cassava rhizosphere soil fungal communities (Figure 4 and Figure 5). The NMDS analysis in 2019 and 2020 showed that the stress value was less than 0.2, indicating the analysis had explanatory significance (Figure 5). In the first year, the first two axes of PCoA modelling explained 36.38% and 15.45% of the total variance in the species of rhizosphere soil fungi in 2019, respectively. All observations within the FLT group spread narrower than the CT group, and they were all close to the 50% N and 100% N treatments of the CT group (Figure 4a). The NMDS modelling showed a similar trend as the PCoA modelling (Figure 5a). Thus, these results revealed that FLT caused stronger influence on fungal communities than nitrogen applications and that it played a more important role in the soil than CT in the first year.
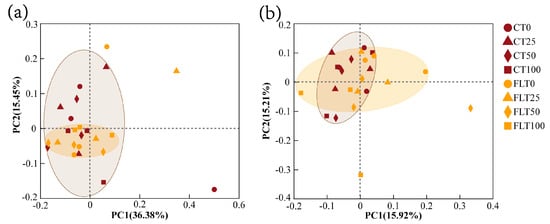
Figure 4.
Scatter plots of principal coordinate analysis (PCoA) ordering of cassava rhizosphere soil fungal communities at OUT level based on Bray–Curtis phylogenetic distance ((a) 2019; (b) 2020).
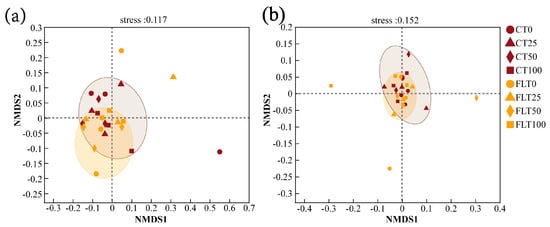
Figure 5.
Biplot ordination of non-metric multidimensional scaling (NMDS) of cassava rhizosphere soil fungal communities at OUT level based on Bray–Curtis distance ((a) 2019; (b) 2020).
In the second year, the first two axes of PCoA modelling explained 31.13% of the variance, and the 0% N and 25% N treatments were separated from the 50% N and 100% N treatments within the FLT group by the second axis, which indicated that the influence caused by FLT (15.92%) on fungal communities decreased but was still slightly higher than N applications (15.21%) (Figure 4b). The NMDS showed that all treatments of CT and FLT in 2020 were concentrated near the origin with a relatively close distance (Figure 5b), which also suggested that the differences in soil fungal community structure between the two tillage treatments were diminishing.
3.5. Association Analysis of Soil Fungi Community and Environmental Factors in Cassava Rhizosphere
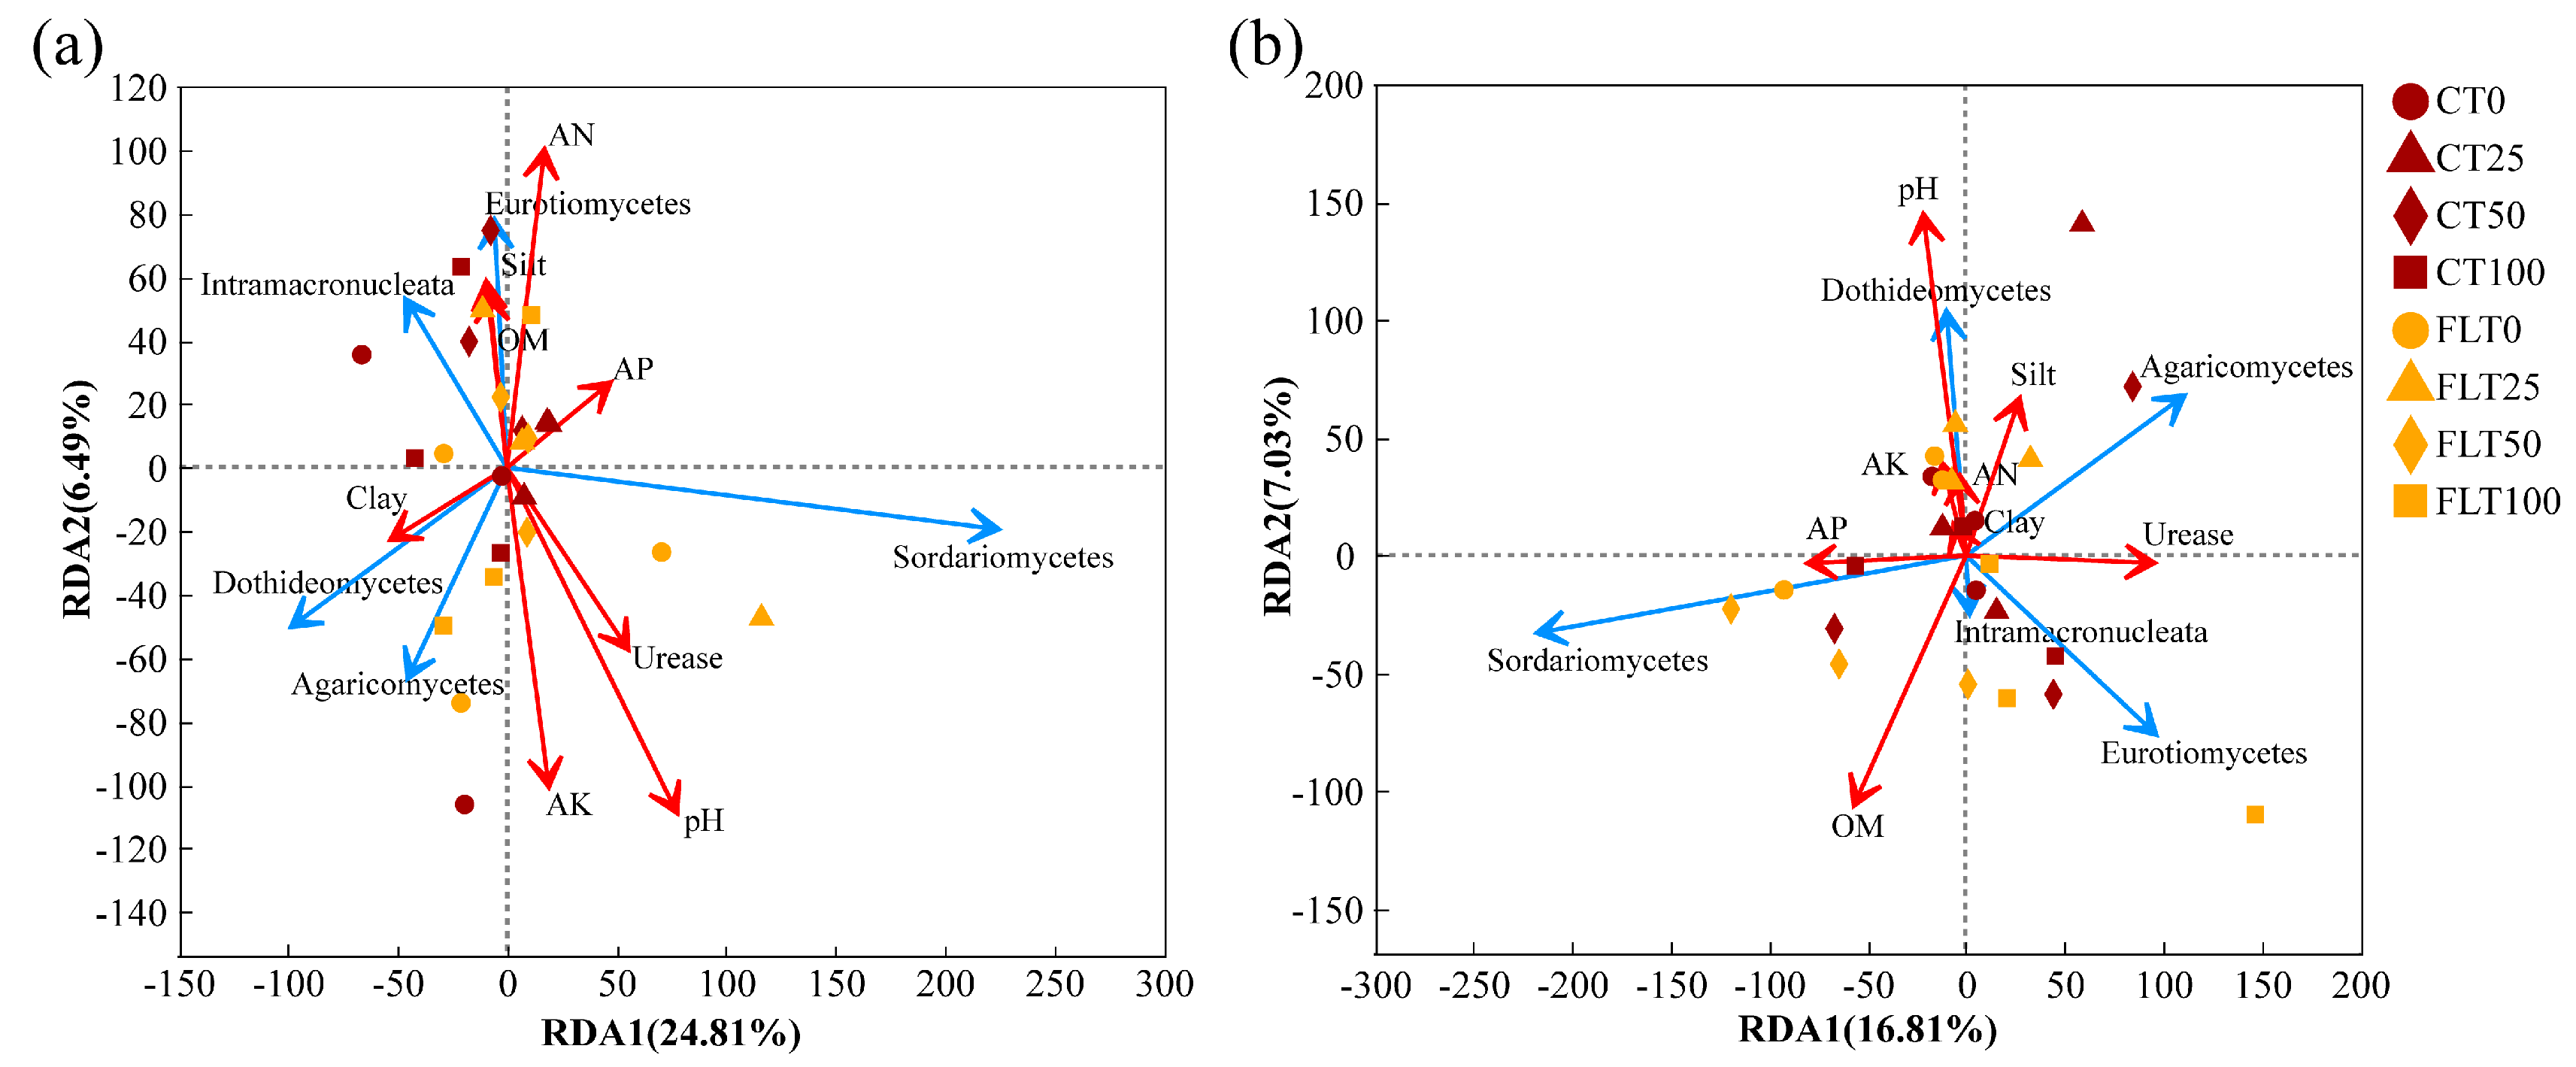
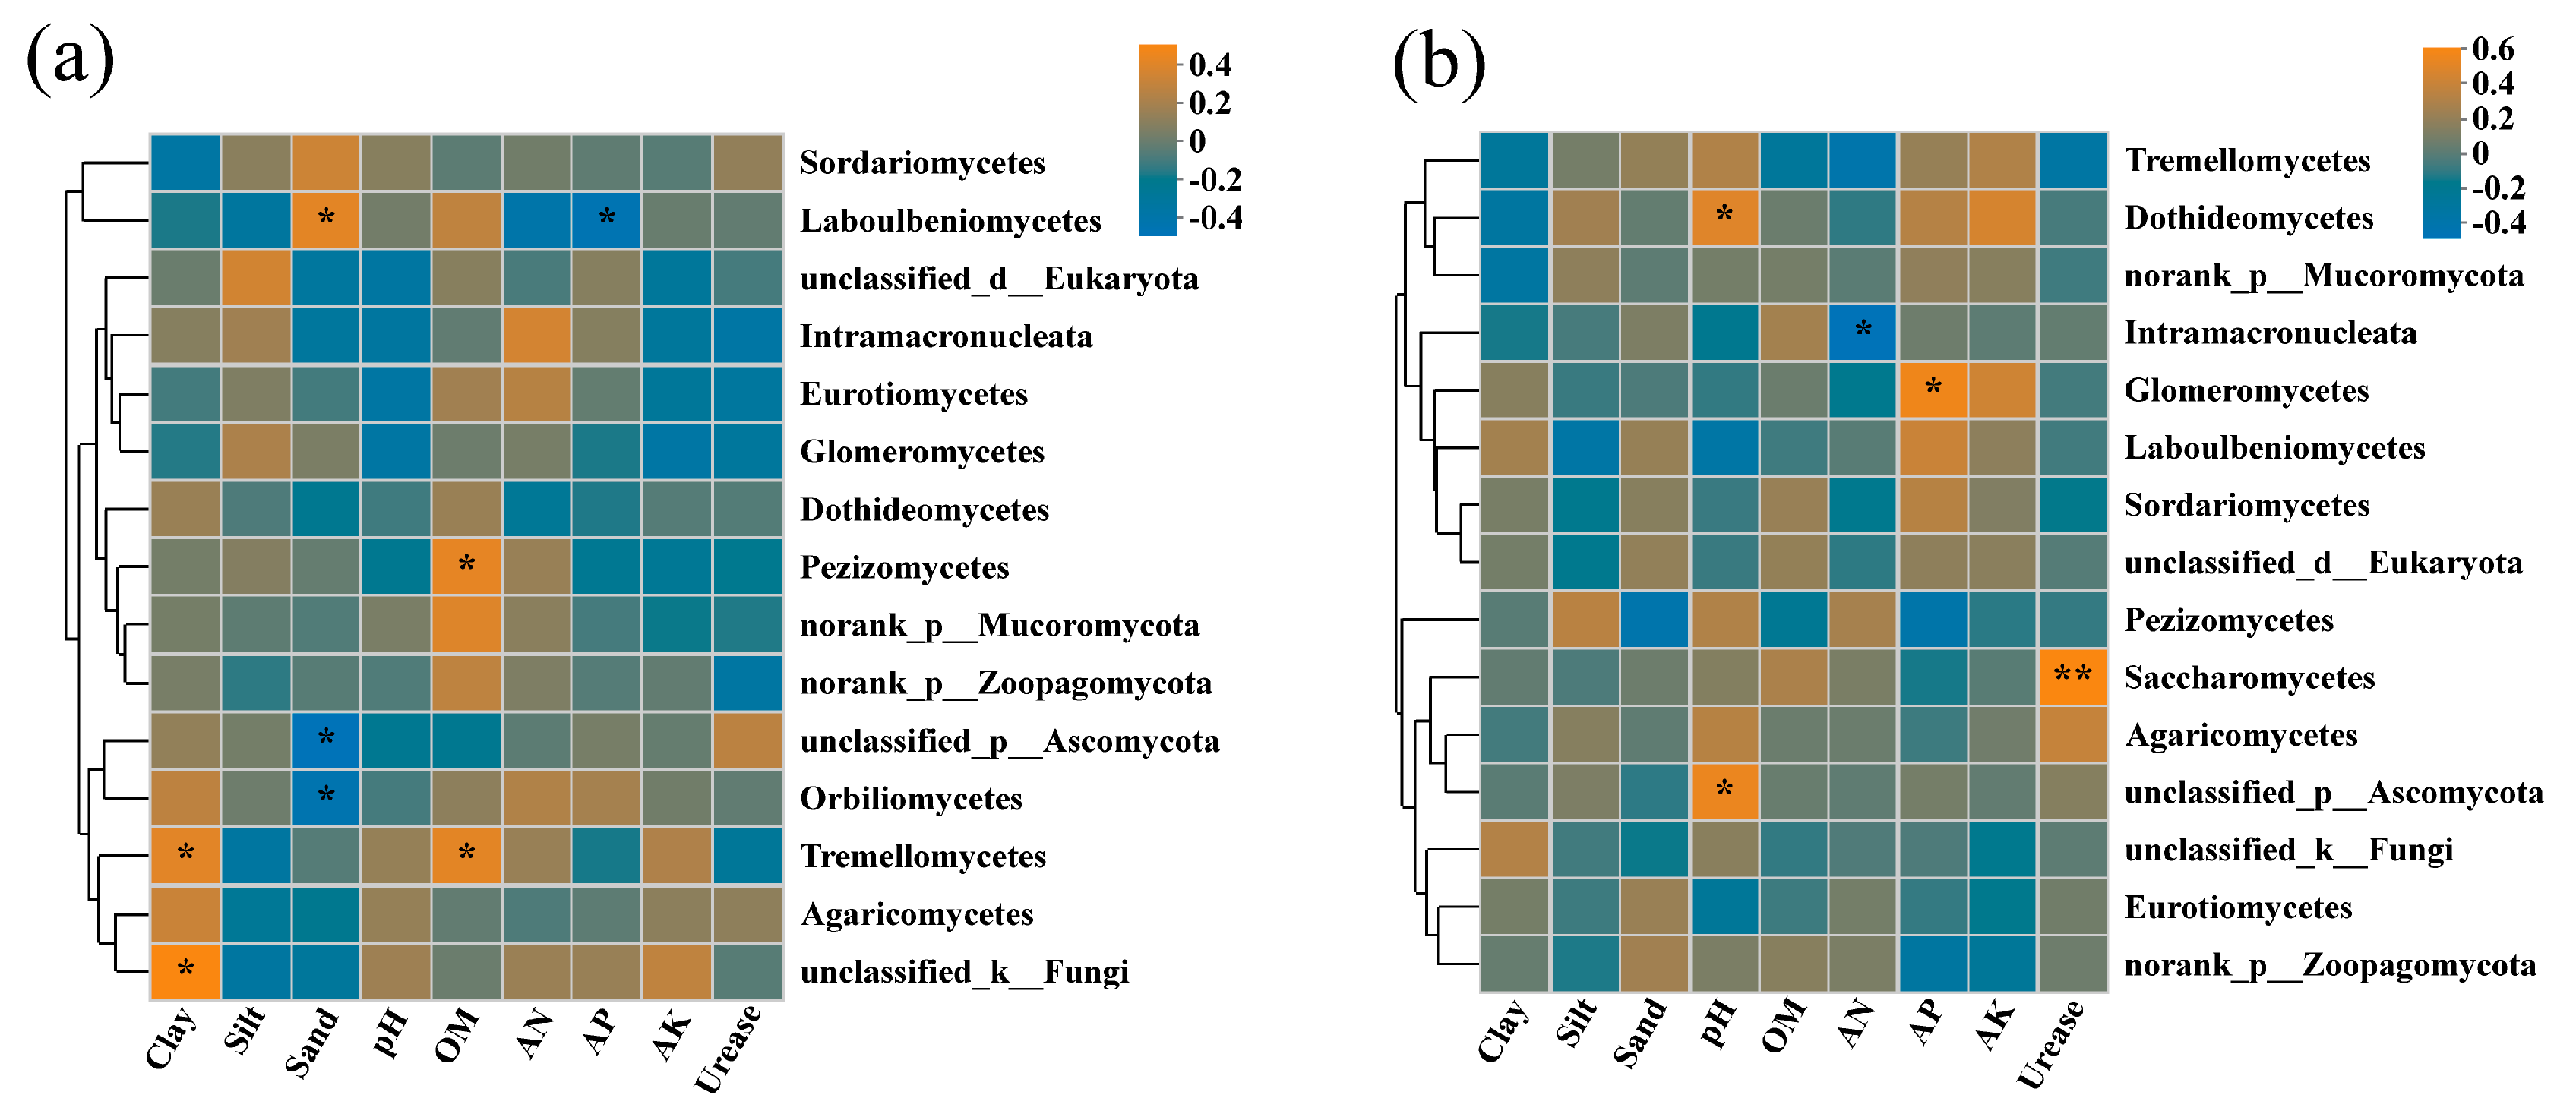
Analysis of redundancy was performed on rhizosphere soil fungi at the class level, and soil physicochemical factors included pH, OM, AN, AP, AK, urease, clay, silt, and sand. The characteristic values of the RDA1 axis and RDA2 axis in 2019 were 24.81% and 6.49%, respectively (Figure 6a). Soil pH, AK, AN, and urease showed strong impacts on the rhizosphere soil fungal community structure. The abundance of Sordariomycetes was mainly affected by AP, urease, and pH. The abundance of Dothideomycetes and Agaricomycetes was positively correlated with clay and AK, while Eurotiomycetes and Intramacronucleata were positively affected by OM, clay, and AN. Furthermore, a Spearman correlation heatmap analysis was also conducted for the top 15 fungal communities in relative abundance and soil physicochemical factors under class classification level. The correlation heatmap in 2019 showed that the relationship between fungal class and environmental factors was different (Figure 7a). Pezizomycetes and unclassified_k_Fungi had significant positive correlations with OM (correlation coefficient, r = 0.419, p < 0.05) and clay (r = 0.494, p < 0.05), respectively. Tremellomycetes was positively correlated with OM (r = 0.412, p < 0.05) and clay (r = 0.409, p < 0.05). Laboulbeniomycetes showed a significant positive correlation with sand (r = 0.413, p < 0.05) and a significant negative correlation with AP (r = −0.426, p < 0.05). Unclassified_p_Ascomycota and Orbilionmycetes were all negatively correlated with sand (r = −0.466 and −0.413, p < 0.05).
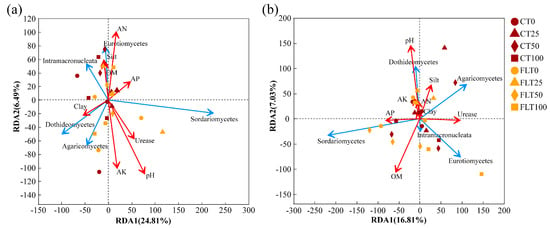
Figure 6.
Redundancy analysis (RDA) of the fungal community structure at the class level associated with the physicochemical properties of cassava rhizosphere soil collected in 2019 (a) and 2020 (b), respectively. The direction of the red arrow indicated the soil factors associated with changes in the community structure, and the length of the arrow indicates the magnitude of the association. The blue arrows were the top five fungi at the class level. OM, organic matter; AN, available nitrogen; AP, available phosphorus; AK, available potassium.
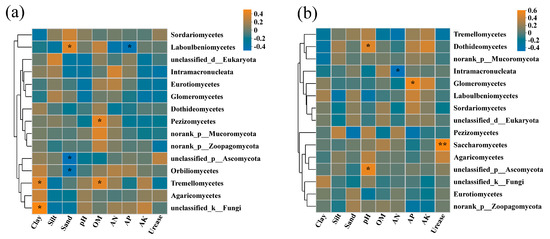
Figure 7.
Correlation heatmaps between the fungal community at the class level and the physicochemical properties of cassava rhizosphere soil collected in 2019 (a) and 2020 (b), respectively. OM, organic matter; AN, available nitrogen; AP, available phosphorus; AK, available potassium. * p < 0.05, ** p < 0.01.
In 2020, the first two components of RDA explained 23.84% of the total variance (Figure 6b). The 0% N and the 25% N treatments were also separated from the 50% N and the 100% N treatments within the FLT group by the second axis (7.05%). The abundance of Sordariomycetes was mainly affected by AP and OM, while Eurotiomycetes was positively correlated with urease within the higher N application rate group. The abundance of Agaricomycetes was positively correlated with silt and urease. The abundance of Dothideomycetes was closely related to clay, silt, AN, AK, and pH. In addition, the correlation heatmap in 2020 revealed that Saccharomycetes showed a significantly positive correlation with urease (r = 0.530, p < 0.01) (Figure 7b). Unclassified_p_Ascomycota and Dothideomycetes were all positively correlated with pH (r = 0.473 and 0.426, p < 0.05). Glomeromycetes was significantly positively correlated with AP (r = 0.492, p < 0.05). Intramacronucleata showed a negative correlation with AN (r = −0.470, p < 0.05).
4. Discussion
4.1. Effects of Tillage Method and Nitrogen Application Rate on Rhizosphere Soil Particle Composition
The rhizosphere is a part of the soil that is under the influence of plant root activity and hence differs from bulk soil in physical, chemical, and biological properties [44,45]. Soil particles play an important role in soil hydraulic capabilities, fertility, and nutrient status and directly connect to soil erosion and degradation [46,47]. Studies have shown that the amount of clay and silt in rhizosphere soil might vary depending on the ploughing technique used [1]. Additionally, continuous use of fertilization might affect the physical structure of the soil [48]. In this study, rhizosphere soil clay and silt were influenced by the tillage method, fertilization, and their interaction (Table S1). The rhizosphere soil clay content of FLT in 2019 was significantly higher than that of CT in 2019, but the rhizosphere soil clay content of FLT in 2020 was lower than that of CT in 2020. The rhizosphere soil clay content of CT in 2020 was significantly higher than that in 2019, while there was no significant difference between 2019 and 2020 FLT. When taking rainfall into account, the rainfall in June of 2020 reached 509 mm, and waterlogging stress occurred, leading to a more compact texture of the soil in 2020 than in 2019 (Figure S1). Comparing the soil bulk density and porosity of different layers between CT and FLT, the bulk density of the plough pan (20–30 cm) of CT after harvesting in 2019 was higher than that of FLT, while its porosity showed a contrariwise trend (Figure S3). This would lead to stronger waterlogging stress in the CT group than in FLT. Thus, these results indicated that soil structure was prone to be more compact in CT and to be loose and porous by FLT during the study period (Table 1), which confirmed that FLT can better maintain soil particle structure and keep the soil in a relatively loose and porous state for a longer time than CT [27,32]. Meanwhile, the rhizosphere soil clay content of the 100% N treatment of FLT and CT in 2019 was significantly higher than that of other N treatments (Table 1), indicating that nitrogen application can increase rhizosphere soil clay content. However, the rhizosphere soil clay content of 100% N treatments in 2020 decreased and was significantly lower than other treatments (excluding FLT25) in the CT and FLT groups, respectively. The main reason might be that the 100% N treatment offered more N for cassava and produced a higher biomass (5.84 t/ha of dry stem harvested in FLT100 in 2020) than other treatments (5.00–5.47 t/ha in FLT0, 25 and 50), especially fallen leaves and root residues left in the soil after harvesting tuberous roots and stems. The higher residue left in the soil increased the content of OM in the next season, thus leading to higher clay content (Table S2).
4.2. Effects of Tillage and Nitrogen Application Rate on Soil Fungal Diversity
The richness and diversity of microbial communities are frequently assessed using the soil microbial community alpha diversity index. The richness of fungal microorganisms increases with the Chao and Ace indices. The diversity of the fungal community increases with the Shannon index and decreases with an increasing Simpson index. Tillage influences the physical and chemical characteristics of soil, hence altering the variety of soil microbial communities [49]. Altering the soil fungal biodiversity using various tillage techniques is a key component in preserving soil health [15]. Moreover, previous studies have shown that soil microorganisms have certain resistance and resilience to environmental changes, especially the changes of soil microorganisms at community richness and diversity levels, which need to go through a certain period [50]. In the current study, the field had been abandoned for years before the experiment, and the soil fungal species were rich and diverse. The fungal alpha diversity indices in 2019 were not affected by tillage methods and nitrogen application rates, while the fungal richness indices decreased in 2020. CT had higher richness than that of FLT (Table 2 and Figure 2), showing that conventional tillage could still maintain the richness of a rhizosphere soil fungal community to a certain level after growing cassava for two years. Furthermore, PCoA revealed that all observations within the FLT group spread narrower than the CT group and they were all close to 50% N and 100% N treatments of the CT group in 2019 (Figure 4a). This indicated that FLT caused a stronger influence on fungal communities than did N applications and that it also played a more important role in the soil than CT in the first year. The influence on the soil fungal community structure caused by the two tillage treatments was diminishing in the second year (Figure 4b and Figure 5b). With the increase of cassava planting cycles, cassava root exudates accumulated continuously, and dominant fungal groups gradually formed. FLT has the advantage of deep tillage and loose soil without mixing the plough layer and plough pan, maintaining the original soil layer structure as much as possible (Figures S2 and S3) and promoting the formation of a more stable fungal community structure (Figure 4a). In addition, cassava was under drought stress during the maturity stage (Figures S1 and S2), and the soil moisture in the FLT group was higher than the CT group when the dry season came. Combined with other positive effects of FLT on soil chemical parameters (Table 2, Table S1 and Table S2), the cassava root system of the FLT treatments was well developed according to its dry stem biomass yield (5.00–5.84 t/ha of FLT vs. 3.76–5.22 t/ha among CT), and it released massive amounts of sugar and amino acids for the rhizosphere decomposers, accelerating the formation of dominant fungal groups. Thus, the richness of rhizosphere soil fungal communities in the second year of FLT was less than that of CT.
4.3. Dominant Rhizosphere Fungi of Cassava under Different Tillage Methods and N Application Rates
Soil fungi are decomposers of organic matter and serve as an important metric for evaluating soil ecology [17,51]. Cultivation practices, planting strategies, fertilization, and plant species all have a substantial impact on the microbial ecology in farmland soil [52]. Soil characteristics have a certain impact on the species and composition of soil fungi [53], among which soil pH can directly or indirectly affect the community structure and diversity of fungi [54]. Both tillage method and fertilization benefit cassava to different levels and shape different microbial ecology in the rhizosphere. The tillage effect was quite strong on the plants and soil in the first year, and thus the nitrogen application rate showed little impact on the fungal community composition. In 2020, the tillage influence decreased while continuous cropping and the fertilization impact were reinforced (Figure 4b and Figure 5b). With continuous cropping of cassava, the root exudates accumulated continuously, and residue left from the previous cycle all accelerated the formation of dominant fungal groups. The top 10 dominant rhizosphere fungi at the class level of cassava found in 2019 and 2020 were Sordariomycetes, Dothideomycetes, Eurotiomycetes, Agaricomycetes, Intramacronucleata, norank_p_Mucoromycota, unclassified_p_Ascomycota, unclassified_k_Fungi, Pezizomycetes, and Glomeromycetes. The relative abundances of Dothideomycetes, which is involved in the cell wall breakdown process and vital to maintain ecosystem health and global carbon cycling [55], was found higher in 0 N and 25% N treatments than in 50% N and 100% N treatments in 2020. This is similar to the result of Freedman et al. [56] and Zhou et al. [24], which indicated that sufficient fertilizer might reduce the microbial contribution to litter decomposition in the soil. The relative abundances of Eurotiomycetes, unclassified_p_Ascomycota, and Glomeromycetes increased significantly in 2020 (paired t-test of treatments in 2019 and 2020, t = −2.968, −2.63, and −2.472, respectively, df = 23, p < 0.05), which could be due to root excretion produced by continuous cropping of cassava or the degradation of the soil environment brought on by continuous cropping.
Arbuscular mycorrhizal fungi (AMF) belong to Glomeromycota, which includes Glomeromycetes, and can be affected by soil characteristics and agricultural practices [57]. Previously, AMF has shown positive effects on cassava growth by improving its nutrient uptake and drought-resistant ability [57,58,59,60]. The relative abundance of Glomeromycota was found to decrease after fertilization [61], and a similar trend can be found in the CT group in 2020 in the current study (Figure 3b). When we take the primer pair nu-SSU-0817 and nu-SSU-1196 into account, although the usefulness in assessing the biodiversity of fungal communities in complex environmental samples had been demonstrated, the primer pair used in the current study might be biased towards certain fungal taxonomic groups and an underestimation of the abundance of Glomeromycetes [62], thus reduced the ability of the data to explain the relationship between ploughing technique and cassava growth as driven by AMF communities.
Previous studies showed that with the increase of nitrogen fertilizer application, the soil carbon cycle was negatively affected, which promoted the formation of pathogenic fungi [23,25]. In the current study, Ascomycota and Basidiomycota were found as the main rhizosphere fungal communities in cassava rhizosphere. We also identified fungi at the genus level to analyze the response of pathogenic fungi to the N dosage; the results showed that the relative abundance of Verticillium in high N treatments (the average of 50% N and 100% N of CT was 8.43% in 2019 and 3.52% in 2020, respectively) was higher than in low N treatments (the average of 0% N and 25% N was 5.58% in 2019 and 1.64% of CT in 2020, respectively) (Figure S4). In agreement with our results, increased N application could also increase Verticillium pathogens in the sugarcane rhizosphere [23,63].
It is known that soil microbial residues account for the majority of stabilized soil organic matter and that carbon, nitrogen, and phosphorus cycle together [64,65,66]. Thus, soil pH, urease, AP, AN, OM, and clay showed strong impacts on the relative abundance of the top 5 dominant rhizosphere soil fungal communities at the class level: Sordariomycetes, Dothideomycetes, Agaricomycetes, Eurotiomycetes, and Intramacronucleata (Figure 3, Figure 6 and Figure 7). Furthermore, Pezizomycetes in 2019 was positively correlated with OM. Saccharomycetes in 2020 showed a significantly positive correlation with urease, while Intramacronucleata showed a negative correlation with AN. Laboulbeniomycetes in 2019 and Glomeromycetes in 2020 showed significant negative correlations with AP. Unclassified_k_Fungi in 2019 demonstrated a significant positive correlation with clay.
Furthermore, a previous study indicated that soil organic carbon decomposition rates are more sensitive to temperature changes in rhizosphere soils than in bulk soils in the subtropical area [55]. Compared with CT, FLT effectively reduced soil temperature by 1.35 °C (Figure S2) and maintained higher N and P in rhizosphere soils (Table S2), which may reduce the microbial contribution to the litter decomposition in the soil, leading to a higher soil carbon sequestration [67].
5. Conclusions
In the current study, we focused on the effects of different tillage (FLT and CT) and nitrogen application levels (0, 25%, 50%, and 100% N) on particle composition and fungal community diversity in cassava rhizosphere soil. The results showed that the contents of clay and silt in the cassava rhizosphere soil were influenced by the tillage method, fertilization, and their interaction. Compared to CT, the content of clay in rhizosphere soil was reduced by the legacy effect of FLT, which indicated that soil structure was prone to more compaction in CT and maintained looseness and porosity with FLT during the study period. The richness of the rhizosphere soil fungal communities decreased among all treatments due to root excretion produced by continuous cropping of cassava or the degradation of the soil environment brought on by continuous cropping. There was no difference in the richness and diversity of rhizosphere soil fungal communities among all treatments in 2019, while the richness of FLT was lower than that of CT in 2020. PCoA revealed that all observations within the FLT group were close to the high N applications of the CT group in 2019, which indicated that FLT caused a stronger influence on the community structure of rhizosphere fungi than N applications in the first year. Moreover, the differences in the community structure of all treatments were reduced by continuous cropping of cassava in the second year. The top 10 dominant rhizosphere fungi at the class level of cassava found in 2019 and 2020 were Sordariomycetes, Dothideomycetes, Eurotiomycetes, Agaricomycetes, Intramacronucleata, norank_p_Mucoromycota, unclassified_p_Ascomycota, unclassified_k_Fungi, Pezizomycetes, and Glomeromycetes, which had important relationships with soil pH, urease, AP, AN, OM, and clay. Compared to CT, FLT created a better soil environment for cassava growth, thus promoting the formation of a more stable rhizosphere fungal community structure.
Supplementary Materials
The following supporting information can be downloaded at: https://www.mdpi.com/article/10.3390/agronomy13010237/s1, Figure S1: Monthly rainfall and average air temperature in 2019 (a) and 2020 (b); Figure S2: Soil moisture and temperature in 2019 (a) and 2020 (b); Figure S3: Soil bulk density (a) and porosity (b) at different sampling times; Figure S4: Relative abundances of the dominant fungal genera of cassava rhizosphere soil collected in 2019 (a) and 2020 (b), respectively; Table S1: ANOVA of the particle compositions of cassava rhizosphere soil collected in 2019 and 2020, respectively; Table S2: Characterization of rhizosphere soil physicochemical properties in 2019 and 2020.
Author Contributions
Conceptualization, investigation, formal analysis, writing—review and editing, L.L., Z.S. and M.W.; writing—original draft preparation, L.L.; funding acquisition, supervision, Z.S. and M.W.; project administration, F.Q., W.Y., Z.S. and M.W.; writing—review, J.Z., T.Y., X.H. and Z.W. All authors have read and agreed to the published version of the manuscript.
Funding
Financial support was provided by the National Natural Science Foundation of China (31960389, 31860347).
Data Availability Statement
Raw data can be provided to researchers on request by corresponding with the first author or corresponding author.
Acknowledgments
We would like to acknowledge lab work assistance from Jinheng Xin, Dan Lu, and Xiaosu Fan at the College of Agronomy, Guangxi University.
Conflicts of Interest
The authors declare no conflict of interest.
Abbreviations
| FLT | Fenlong tillage |
| CT | conventional tillage |
| OM | organic matter |
| AN | available nitrogen |
| AP | available phosphorus |
| AK | available potassium |
| PCoA | principal coordinate analysis |
| NMDS | non-metric multidimensional scaling |
| RDA | analysis of redundancy |
| PCA | principal component analysis |
References
- Wang, Z.; Li, T.; Li, Y.; Zhao, D.; Han, J.; Liu, Y.; Liao, Y. Relationship between the microbial community and catabolic diversity in response to conservation tillage. Soil Tillage Res. 2020, 196, 104431. [Google Scholar] [CrossRef]
- González-Figueroa, S.S.; Covarrubias-Prieto, J.; Aguirre-Mancilla, C.L.; Raya-Pérez, J.C.; Gámez-Vázquez, A.J.; Grageda-Cabrera, O.A. Time-course of soil microbial communities in different tillage and crop rotation systems. Chil. J. Agric. Res. 2020, 80, 650–660. [Google Scholar] [CrossRef]
- Kobierski, M.; Lemanowicz, J.; Wojewódzki, P.; Kondratowicz-Maciejewska, K. The Effect of Organic and Conventional Farming Systems with Different Tillage on Soil Properties and Enzymatic Activity. Agronomy 2020, 10, 1809. [Google Scholar] [CrossRef]
- Li, Y.; Wang, Z.; Li, T.; Zhao, D.; Han, J.; Liao, Y. Wheat rhizosphere fungal community is affected by tillage and plant growth. Agric. Ecosyst. Environ. 2021, 317, 107475. [Google Scholar] [CrossRef]
- Allah, W. Improving maize productivity through tillage and nitrogen management. Afr. J. Biotechnol. 2011, 10, 19025–19034. [Google Scholar] [CrossRef]
- Shahzad, M.; Farooq, M.; Jabran, K.; Yasir, T.A.; Hussain, M. Influence of Various Tillage Practices on Soil Physical Properties and Wheat Performance in Different Wheat-Based Cropping Systems. Int. J. Agric. Biol. 2016, 18, 821–829. [Google Scholar] [CrossRef]
- Zhang, W.F.; Yang, S.Q.; Jin, Y.H.; Liu, P.; Lou, S. The effects of straw mulching combined with nitrogen applications on the root distributions and nitrogen utilization efficiency of summer maize. Sci. Rep. 2020, 10, 21082. [Google Scholar] [CrossRef]
- Cui, N.; Cai, M.; Zhang, X.; Abdelhafez, A.A.; Zhou, L.; Sun, H.; Chen, G.; Zou, G.; Zhou, S. Runoff loss of nitrogen and phosphorus from a rice paddy field in the east of China: Effects of long-term chemical N fertilizer and organic manure applications. Glob. Ecol. Conserv. 2020, 22, e01011. [Google Scholar] [CrossRef]
- Sanaullah, M.; Usman, M.; Wakeel, A.; Cheema, S.A.; Ashraf, I.; Farooq, M. Terrestrial ecosystem functioning affected by agricultural management systems: A review. Soil Tillage Res. 2020, 196, 104464. [Google Scholar] [CrossRef]
- Brussaard, L.; de Ruiter, P.C.; Brown, G.G. Soil biodiversity for agricultural sustainability. Agric. Ecosyst. Environ. 2007, 121, 233–244. [Google Scholar] [CrossRef]
- Sun, B.; Zhang, L.; Yang, L.; Zhang, F.; Norse, D.; Zhu, Z. Agricultural non-point source pollution in China: Causes and mitigation measures. Ambio 2012, 41, 370–379. [Google Scholar] [CrossRef]
- Qu, Z.-m.; Qi, X.-c.; Wang, J.; Chen, Q.; Li, C.-l. Effects of nitrogen application rate and topdressing times on yield and quality of Chinese cabbage and soil nitrogen dynamics. Env. Pollut. Bioavail. 2018, 31, 1–8. [Google Scholar] [CrossRef]
- Joergensen, R.; Wichern, F. Quantitative assessment of the fungal contribution to microbial tissue in soil. Soil Biol. Biochem. 2008, 40, 2977–2991. [Google Scholar] [CrossRef]
- Wood, J.R.; Dickie, I.A.; Moeller, H.V.; Peltzer, D.A.; Bonner, K.I.; Rattray, G.; Wilmshurst, J.M.; Gibson, D. Novel interactions between non-native mammals and fungi facilitate establishment of invasive pines. J. Ecol. 2015, 103, 121–129. [Google Scholar] [CrossRef]
- Frac, M.; Hannula, S.E.; Belka, M.; Jedryczka, M. Fungal Biodiversity and Their Role in Soil Health. Front. Microbiol. 2018, 9, 707. [Google Scholar] [CrossRef]
- Bani, A.; Pioli, S.; Ventura, M.; Panzacchi, P.; Borruso, L.; Tognetti, R.; Tonon, G.; Brusetti, L. The role of microbial community in the decomposition of leaf litter and deadwood. Appl. Soil Ecol. 2018, 126, 75–84. [Google Scholar] [CrossRef]
- Li, X.; Qu, Z.; Zhang, Y.; Ge, Y.; Sun, H. Soil Fungal Community and Potential Function in Different Forest Ecosystems. Diversity 2022, 14, 520. [Google Scholar] [CrossRef]
- Wang, Z.; Chen, Q.; Liu, L.; Wen, X.; Liao, Y. Responses of soil fungi to 5-year conservation tillage treatments in the drylands of northern China. Appl. Soil Ecol. 2016, 101, 132–140. [Google Scholar] [CrossRef]
- Schmidt, R.; Mitchell, J.; Scow, K. Cover cropping and no-till increase diversity and symbiotroph: Saprotroph ratios of soil fungal communities. Soil Biol. Biochem. 2019, 129, 99–109. [Google Scholar] [CrossRef]
- Wang, Z.; Li, T.; Wen, X.; Liu, Y.; Han, J.; Liao, Y.; DeBruyn, J.M. Fungal Communities in Rhizosphere Soil under Conservation Tillage Shift in Response to Plant Growth. Front. Microbiol. 2017, 8, 1301. [Google Scholar] [CrossRef]
- Li, Y.; Song, D.; Liang, S.; Dang, P.; Qin, X.; Liao, Y.; Siddique, K.H.M. Effect of no-tillage on soil bacterial and fungal community diversity: A meta-analysis. Soil Tillage Res. 2020, 204, 104721. [Google Scholar] [CrossRef]
- Galazka, A.; Grzadziel, J. Fungal Genetics and Functional Diversity of Microbial Communities in the Soil under Long-Term Monoculture of Maize Using Different Cultivation Techniques. Front. Microbiol. 2018, 9, 76. [Google Scholar] [CrossRef] [PubMed]
- Paungfoo-Lonhienne, C.; Yeoh, Y.K.; Kasinadhuni, N.R.; Lonhienne, T.G.; Robinson, N.; Hugenholtz, P.; Ragan, M.A.; Schmidt, S. Nitrogen fertilizer dose alters fungal communities in sugarcane soil and rhizosphere. Sci. Rep. 2015, 5, 8678. [Google Scholar] [CrossRef]
- Zhou, J.; Jiang, X.; Zhou, B.; Zhao, B.; Ma, M.; Guan, D.; Li, J.; Chen, S.; Cao, F.; Shen, D.; et al. Thirty four years of nitrogen fertilization decreases fungal diversity and alters fungal community composition in black soil in northeast China. Soil Biol. Biochem. 2016, 95, 135–143. [Google Scholar] [CrossRef]
- Li, Y.N.; Wang, T.Y.; Wang, C.Y.; Li, M.S.; Wang, Y.; Liu, S.X. Responses of Soil Rhizosphere Fungi to N Application Levels in Different Types of Soil. Appl. Ecol. Environ. Res. 2021, 19, 1645–1659. [Google Scholar] [CrossRef]
- Zhai, L.; Xu, P.; Zhang, Z.; Wei, B.; Jia, X.; Zhang, L. Improvements in Grain Yield and Nitrogen Use Efficiency of Summer Maize by Optimizing Tillage Practice and Nitrogen Application Rate. Agron. J. 2019, 111, 666–676. [Google Scholar] [CrossRef]
- Zhai, L.; Xu, P.; Zhang, Z.; Li, S.; Xie, R.; Zhai, L.; Wei, B. Effects of deep vertical rotary tillage on dry matter accumulation and grain yield of summer maize in the Huang-Huai-Hai Plain of China. Soil Tillage Res. 2017, 170, 167–174. [Google Scholar] [CrossRef]
- Li, X.; Wei, B.; Xu, X.; Zhou, J. Effect of Deep Vertical Rotary Tillage on Soil Properties and Sugarcane Biomass in Rainfed Dry-Land Regions of Southern China. Sustainability 2020, 12, 10199. [Google Scholar] [CrossRef]
- Bai, Z.; Liu, H.; Wang, T.; Gong, P.; Li, H.; Li, L.; Xue, B.; Cao, M.; Feng, J.; Xu, Y. Effect of Smashing Ridge Tillage Depth on Soil Water, Salinity, and Yield in Saline Cotton Fields in South Xinjiang, China. Water 2021, 13, 3592. [Google Scholar] [CrossRef]
- Nie, S.; Egrinya, E.A.; Huang, S.; Zhang, S.; Zhang, Q.; Zhang, Y.; Wei, B. Smash-ridging tillage increases wheat yield and yield components in the Huai-He valley, China. J. Food Agric. Environ. 2013, 11, 453–455. [Google Scholar]
- Zhang, J.; Li, F.; Liao, P.; Khan, A.; Hussain, I.; Iqbal, A.; Ali, I.; Wei, B.; Jiang, L. Smash ridge tillage strongly influence soil functionality, physiology and rice yield. Saudi J. Biol. Sci. 2021, 28, 1297–1307. [Google Scholar] [CrossRef] [PubMed]
- Duan, M.; Long, Y.; Fan, H.; Ma, L.; Han, S.; Li, S.; Wei, B.; Wang, L. Fenlong-Ridging Promotes Microbial Activity in Sugarcane: A Soil and Root Metabarcoding Survey. Agriculture 2022, 12, 244. [Google Scholar] [CrossRef]
- Liu, H.; Pan, F.-j.; Han, X.-z.; Song, F.-b.; Zhang, Z.-m.; Yan, J.; Xu, Y.-l. A comprehensive analysis of the response of the fungal community structure to long-term continuous cropping in three typical upland crops. J. Integr. Agric. 2020, 19, 866–880. [Google Scholar] [CrossRef]
- Yu, X.; Keitel, C.; Zhang, Y.; Wangeci, A.N.; Dijkstra, F.A. Global meta-analysis of nitrogen fertilizer use efficiency in rice, wheat and maize. Agric. Ecosyst. Environ. 2022, 338, 108089. [Google Scholar] [CrossRef]
- Zhang, B.; He, H.; Ding, X.; Zhang, X.; Zhang, X.; Yang, X.; Filley, T.R. Soil microbial community dynamics over a maize (Zea mays L.) growing season under conventional-and no-tillage practices in a rainfed agroecosystem. Soil Tillage Res. 2012, 124, 153–160. [Google Scholar] [CrossRef]
- Tan, G.; Liu, Y.; Peng, S.; Yin, H.; Meng, D.; Tao, J.; Gu, Y.; Li, J.; Yang, S.; Xiao, N.; et al. Soil potentials to resist continuous cropping obstacle: Three field cases. Environ. Res. 2021, 200, 111319. [Google Scholar] [CrossRef] [PubMed]
- Qin, S.; Yeboah, S.; Cao, L.; Zhang, J.; Shi, S.; Liu, Y. Breaking continuous potato cropping with legumes improves soil microbial communities, enzyme activities and tuber yield. PLoS ONE 2017, 12, e0175934. [Google Scholar] [CrossRef]
- She, S.; Niu, J.; Zhang, C.; Xiao, Y.; Chen, W.; Dai, L.; Liu, X.; Yin, H. Significant relationship between soil bacterial community structure and incidence of bacterial wilt disease under continuous cropping system. Arch. Microbiol. 2016, 199, 267–275. [Google Scholar] [CrossRef]
- Shen, Z.; Li, Y.; Zhou, J.; Lao, C.; Zhou, L.; Wei, B.; Huang, J.; Wei, Y. Effect of fertiliser reduction on cassava yield and quality under Fenlong tillage. Soil Fertil. Sci. China 2022, 2, 99–105. [Google Scholar] [CrossRef]
- Wang, M.; Pendall, E.; Fang, C.M.; Li, B.; Nie, M. A global perspective on agroecosystem nitrogen cycles after returning crop residue. Agric. Ecosyst. Environ. 2018, 266, 49–54. [Google Scholar] [CrossRef]
- Bao, S. Soil and Agricultural Chemistry Analysis, 3rd ed.; China Agriculture Press: Beijing, China, 2000. [Google Scholar]
- Qin, S.-H.; Cao, L.; Zhang, J.-L.; Wang, D.; Wang, D. Soil nutrient availability and microbial properties of a potato field under ridge-furrow and plastic mulch. Arid Land Res. Manag. 2016, 30, 181–192. [Google Scholar] [CrossRef]
- Borneman, J.; Hartin, R. PCR primers that amplify fungal rRNA genes from environmental samples. Appl. Environ. Microbiol. 2000, 66, 4356–4360. [Google Scholar] [CrossRef] [PubMed]
- Hinsinger, P.; Bengough, A.G.; Vetterlein, D.; Young, I.M. Rhizosphere: Biophysics, biogeochemistry and ecological relevance. Plant Soil 2009, 321, 117–152. [Google Scholar] [CrossRef]
- Lambers, H.; Mougel, C.; Jaillard, B.; Hinsinger, P. Plant-microbe-soil interactions in the rhizosphere: An evolutionary perspective. Plant Soil 2009, 321, 83–115. [Google Scholar] [CrossRef]
- Hwang, S.I.; Powers, S.E. Using particle-size distribution models to estimate soil hydraulic properties. Soil Sci. Soc. Am. J. 2003, 67, 1103–1112. [Google Scholar] [CrossRef]
- Wang, D.; Fu, B.; Zhao, W.; Hu, H.; Wang, Y. Multifractal characteristics of soil particle size distribution under different land-use types on the Loess Plateau, China. Catena 2008, 72, 29–36. [Google Scholar] [CrossRef]
- Ruan, R.; Zhang, Z.; Tu, R.; Wang, Y.; Xiong, P.; Li, W.; Chen, H. Variable responses of soil pore structure to organic and inorganic fertilization in a Vertisol. Int. Agrophys. 2021, 35, 221–225. [Google Scholar] [CrossRef]
- Jiang, Y.; Liang, Y.; Li, C.; Wang, F.; Sui, Y.; Suvannang, N.; Zhou, J.; Sun, B. Crop rotations alter bacterial and fungal diversity in paddy soils across East Asia. Soil Biol. Biochem. 2016, 95, 250–261. [Google Scholar] [CrossRef]
- Griffiths, B.S.; Philippot, L. Insights into the resistance and resilience of the soil microbial community. FEMS Microbiol. Rev. 2013, 37, 112–129. [Google Scholar] [CrossRef]
- Zhang, K.; Adams, J.M.; Shi, Y.; Yang, T.; Sun, R.; He, D.; Ni, Y.; Chu, H. Environment and geographic distance differ in relative importance for determining fungal community of rhizosphere and bulk soil. Environ. Microbiol. 2017, 19, 3649–3659. [Google Scholar] [CrossRef]
- Li, T.; Li, Y.; Wang, S.; Wang, Z.; Liu, Y.; Wen, X.; Mo, F.; Han, J.; Liao, Y. Assessing synergistic effects of crop rotation pattern, tillage practice, and rhizosphere effect on soil bacterial community structure and assembly in China’s Loess Plateau farmlands. Appl. Soil Ecol. 2022, 174, 104411. [Google Scholar] [CrossRef]
- Hazard, C.; Gosling, P.; van der Gast, C.J.; Mitchell, D.T.; Doohan, F.M.; Bending, G.D. The role of local environment and geographical distance in determining community composition of arbuscular mycorrhizal fungi at the landscape scale. ISME J. 2013, 7, 498–508. [Google Scholar] [CrossRef] [PubMed]
- Zhang, Y.; Dai, S.; Huang, X.; Zhao, Y.; Zhao, J.; Cheng, Y.; Cai, Z.; Zhang, J. pH-induced changes in fungal abundance and composition affects soil heterotrophic nitrification after 30 days of artificial pH manipulation. Geoderma 2020, 366, 114255. [Google Scholar] [CrossRef]
- Zhao, X.; Tian, P.; Liu, S.; Sun, Z.; Zeng, Z.; Wang, Q. Cunninghamia lanceolata and understory ferns had positive rhizosphere effects on the temperature sensitivity of soil microbial respiration in a subtropical forest. Geoderma 2022, 408, 115593. [Google Scholar] [CrossRef]
- Freedman, Z.B.; Romanowicz, K.J.; Upchurch, R.A.; Zak, D.R. Differential responses of total and active soil microbial communities to long-term experimental N deposition. Soil Biol. Biochem. 2015, 90, 275–282. [Google Scholar] [CrossRef]
- Thanni, B.; Merckx, R.; De Bauw, P.; Boeraeve, M.; Peeters, G.; Hauser, S.; Honnay, O. Spatial variability and environmental drivers of cassava-arbuscular mycorrhiza fungi (AMF) associations across Southern Nigeria. Mycorrhiza 2022, 32, 1–13. [Google Scholar] [CrossRef] [PubMed]
- Carretero, C.L.; Cantos, M.; García, J.L.; Azcón, R.; Troncoso, A. Growth Responses of Micropropagated Cassava Clones as Affected by Glomus Intraradices Colonization. J. Plant Nutr. 2009, 32, 261–273. [Google Scholar] [CrossRef]
- Sieverding, E.; Toro, S.T. Effect of mixing VAM inoculum with fertilizers on cassava nutrition and VAM fungal association. Agric. Ecosyst. Environ. 1990, 29, 397–401. [Google Scholar] [CrossRef]
- De Bauw, P.; Birindwa, D.; Merckx, R.; Boeraeve, M.; Munyahali, W.; Peeters, G.; Bolaji, T.; Honnay, O. Improved genotypes and fertilizers, not fallow duration, increase cassava yields without compromising arbuscular mycorrhizal fungus richness or diversity. Mycorrhiza 2021, 31, 483–496. [Google Scholar] [CrossRef]
- Cai, J.; Zhang, J.; Ding, Y.; Yu, S.; Lin, H.; Yuan, Z.; Li, K.; Ou, W.; Chen, S. Different Fertilizers Applied Alter Fungal Community Structure in Rhizospheric Soil of Cassava (Manihot esculenta Crantz) and Increase Crop Yield. Front. Microbiol. 2021, 12, 663781. [Google Scholar] [CrossRef]
- Anderson, I.C.; Campbell, C.D.; Prosser, J.I. Potential bias of fungal 18S rDNA and internal transcribed spacer polymerase chain reaction primers for estimating fungal biodiversity in soil. Environ. Microbiol. 2003, 5, 36–47. [Google Scholar] [CrossRef]
- Barbara, D.J.; Clewes, E. Plant pathogenic Verticillium species: How many of them are there? Mol. Plant Pathol. 2003, 4, 297–305. [Google Scholar] [CrossRef] [PubMed]
- Daly, A.B.; Jilling, A.; Bowles, T.M.; Buchkowski, R.W.; Frey, S.D.; Kallenbach, C.M.; Keiluweit, M.; Mooshammer, M.; Schimel, J.P.; Grandy, A.S. A holistic framework integrating plant-microbe-mineral regulation of soil bioavailable nitrogen. Biogeochemistry 2021, 154, 211–229. [Google Scholar] [CrossRef] [PubMed]
- Huang, R.; Zhang, Z.; Xiao, X.; Zhang, N.; Wang, X.; Yang, Z.; Xu, K.; Liang, Y. Structural changes of soil organic matter and the linkage to rhizosphere bacterial communities with biochar amendment in manure fertilized soils. Sci. Total Environ. 2019, 692, 333–343. [Google Scholar] [CrossRef] [PubMed]
- Yan, M.; Pan, G.; Lavallee, J.M.; Conant, R.T. Rethinking sources of nitrogen to cereal crops. Glob. Chang. Biol. 2020, 26, 191–199. [Google Scholar] [CrossRef]
- Yang, W.; Qin, F.; Liu, Y.; Han, X.; Zhou, Z.; Wei, M.; Shen, Z.; Wei, B. Effects of Fenlong Tillage and Reducing Nitrogen Treatment on Soil Greenhouse Gas Emissions and Soil Enzyme Activities in Cassava Field. J. South. Agric. 2021, 52, pp. 2426–2437. Available online: https://kns.cnki.net/kcms/detail/45.1381.S.20210510.1322.002.html (accessed on 10 May 2021).
Disclaimer/Publisher’s Note: The statements, opinions and data contained in all publications are solely those of the individual author(s) and contributor(s) and not of MDPI and/or the editor(s). MDPI and/or the editor(s) disclaim responsibility for any injury to people or property resulting from any ideas, methods, instructions or products referred to in the content. |
© 2023 by the authors. Licensee MDPI, Basel, Switzerland. This article is an open access article distributed under the terms and conditions of the Creative Commons Attribution (CC BY) license (https://creativecommons.org/licenses/by/4.0/).

