Article

Forest Gaps Modulate the Composition and Co-Occurrence Network of Soil Bacterial Community in Larix principis-rupprechtii Mayr Plantation

1
College of Forestry, Shanxi Agricultural University, Taigu 030801, China
2
Life Sciences Department, Yuncheng University, Yuncheng 044000, China
*
Author to whom correspondence should be addressed.
Agronomy 2023, 13(1), 38; https://doi.org/10.3390/agronomy13010038
Submission received: 22 November 2022 / Revised: 18 December 2022 / Accepted: 19 December 2022 / Published: 22 December 2022
(This article belongs to the Special Issue Soil Microorganisms Dynamics under Different Cropping Systems)

Abstract

:
Forest gaps create a favorable microenvironment for the growth of the soil microbial community. This study aimed to explore the effects of gap-related microenvironmental heterogeneity on soil bacterial communities in Larix principis-rupprechtii Mayr forest gaps. Therefore, the redundancy analysis (RDA) and structure equations modeling (SEM) of affecting elements were further used to test the significance of forest gaps’ effect on soil bacterial community composition and co-occurrence structure complexity. The formation of forest gaps increased canopy opening (CO) and significantly increased soil moisture content (SW), soil temperature (ST) and the accumulation of acid phosphatase (PHO) and sucrase (INV) in the soil, and the G250 (forest gap size: >250 m2) was most conductive to the accumulation of light and soil total nutrient. G50, G70, and G100 (forest gap size: 50–70 m2, 70–100 m2, 100–125 m2) were most favorable for the natural regeneration of the L. principis-rupprechtii Mayr plantation. The light properties under the forest gaps were the most significant factor that influenced the soil bacterial community composition, followed by the size of the forest gap, with standard path coefficients (Std. PCs) of 0.45 and −0.37, respectively. The canopy opening (CO), relative light intensity (RLA) and leaf area index (LAI) were considered to be the most important environmental factors affecting bacterial community composition (Std. PCs: 0.97, 0.99, and −0.93, respectively). The natural regeneration density under the forest gap was the most significant factor influencing the complexity of the soil bacterial community co-occurrence network, followed by soil nutrients (Std. PCs: 0.87 and −0.76, respectively).

1. Introduction

As the drivers of spatiotemporal patterns, forest gaps (hereafter referred to as gaps) play an essential role in forest ecology [1]. The formation and size of forest gaps, which influence environmental heterogeneity, including soil temperature, soil moisture, light intensity, and soil nutrients, maintain the complex structure of late-successional forests and affect the vegetative regeneration [2,3], pedo-diversity, and microbial diversity [4,5,6].
Gap cultivation systems (i.e., by removing one or more upper-layer trees in a depressed stand) directly increase solar radiation and rain flushing in the understory and further impact certain aspects of micro-environmental heterogeneity, such as soil temperature, humidity, and physicochemical properties [7,8,9,10]. Micro-environmental changes in forest gap formation can affect the structure and function of soil microbial communities [4,5]. Compared with closed forests, forest gaps with elevated soil temperature, moisture, and available nitrogen promote the aggregation of soil microbial communities [5]. Small gaps can increase the activity of soil phosphatase and urease and the effectiveness of soil nutrients, which can, in turn, increase the soil microbial biomass [3]. Schlieamnn et al. (2014) reported that vegetation restoration and reduced microbial biomass limited the impact of larger gaps on nutrient cycling in boreal broadleaf forests [8]. Yang et al. (2017) reported that small forest gaps were beneficial for soil microbial communities and soil enzyme activity in oleander forests [9]. In their study on oil pine plantation regeneration, Yu et al. (2018) reported that small forest gaps had higher microbial phospholipid fatty acid (PLFA) levels, enzyme activity, and soil nutrient effectiveness [11]. However, the micro-environmental factors that play an important role in the diversity, composition, and co-occurrence network structure of soil bacterial communities in the forest gaps remain unknown.
L. principis-rupprechtii Mayr, as a dominant tree species endemic in northern China, is commonly found in plantations which exist in substantial forest gaps with different sizes. In mature forests, the number and size of forest gaps are increased due to competitive exclusion and anthropogenic disturbance [4]. In the context of near-natural management theory, L. principis-rupprechtii Mayr plantations can be used as a reasonable natural model to study plant species distribution patterns affected by changes in forest gap area. It is necessary to investigate whether forest gaps can be used as a means of disturbance to promote L. principis-rupprechtii plantations to the natural constant forest stage. In recent decades, based on the theory of forest gap delineation (GPH) [12], it has been further proposed that forest gap disturbance can alter stand structure and provide opportunities for the natural regeneration of vegetation [13,14,15]. Considering the changes in solar radiation, soil environment, and stand structure after forest gap formation, we hypothesized that the soil bacterial community composition and co-occurrence network structure would also change after forest gap formation. Moreover, the range of forest gap sizes addressed in previous studies varied widely across different forest ecosystems [3,9,10,11]. Therefore, it is necessary to study the effects of forest gap size and environmental heterogeneity on soil bacterial communities in L. principis-rupprechtii plantations.
The objective of this study was to investigate the effects of different-sized forest gaps on soil bacterial community composition and co-occurrence network structure in L. principis-rupprechtii plantations based on the following hypotheses: (1) after the formation of a forest gap, the light properties and soil characteristics would change in forest gaps compared to closed forests; (2) changes in soil bacterial community composition and structure would be closely related to gap-altered microenvironments with different-sized forest gaps; and (3) changes in soil bacterial community structure would be closely related to L. principis-rupprechtii regeneration.

2. Materials and Methods

2.1. Study Area

This study was located in the Guandi Mountain Nature Reserve (37°45′−37°55′ N, 111°22′−111°33′ E) in Shanxi province, China. In the study area, the native dominant vegetation was mostly naturally regenerated L. principis-rupprechtii (80–90%), accompanied by a small proportion of Picea asperata Mast and Betula platyphylla Suk plantations. In the late 1960s, a pure stand with an initial density of 4000–5000 stems/ha was formed after afforestation. The stand density was adjusted to 1000–2000 stems/ha by manual thinning at the 25th and 40th years after planting. The stand canopy cover was approximately 0.6–0.7, and the average tree height was approximately 19.71 m. The soil is classified as brown soil (Chinese classification) with an average thickness of 70–80 cm, including a 10 cm humus layer. Most forest gaps in the study area were formed by thinning, and only a few were formed by root-digging windfall and dead standing trees. All the selected gaps in this study had already been forming for 10 years by 2021 (age of forest gap = age of forest–age of logging; the age error for all loggings in the gaps was controlled at 1–2 years).

2.2. Experimental Design

The survey was conducted from June to August 2021. A total of 25 gaps with similar elevations, slope, and slope aspects were selected in the study area, which were divided into seven classes: G250: >250 m2 (n = 3); G150: 150–250 m2 (n = 3); G125: 125–150 m2 (n = 4); G100: 100–125 m2 (n = 4); G70: 70–100 m2 (n = 4); G50: 50–70 m2 (n = 4); and G0 (n = 3): 10 m × 10 m closed forest. For each gap size gradient, 3–4 replicates were created (Table 1). The location of each gap was recorded using GPS tracking (TX35-S300, Beijing, China). Based on field surveys, regenerated plants were classified according to height (H) and diameter at breast height (DBH): seedlings (0.1 m ≤ H < 1 m), saplings (H ≥ 1 m, DBH ≤ 5 cm), adult trees (DBH > 5 cm). The total regenerated individuals were calculated as the sum of seedlings and saplings. The variables measured in each gap were as follows: regeneration density (ReD) (the number of regenerated individuals per square meter (stems—m2), H, DBH, and the age of the regenerated individuals (a). The age of all surveyed regenerated individuals was <10 years, indicating that the plants were regenerated after forest gap creation.
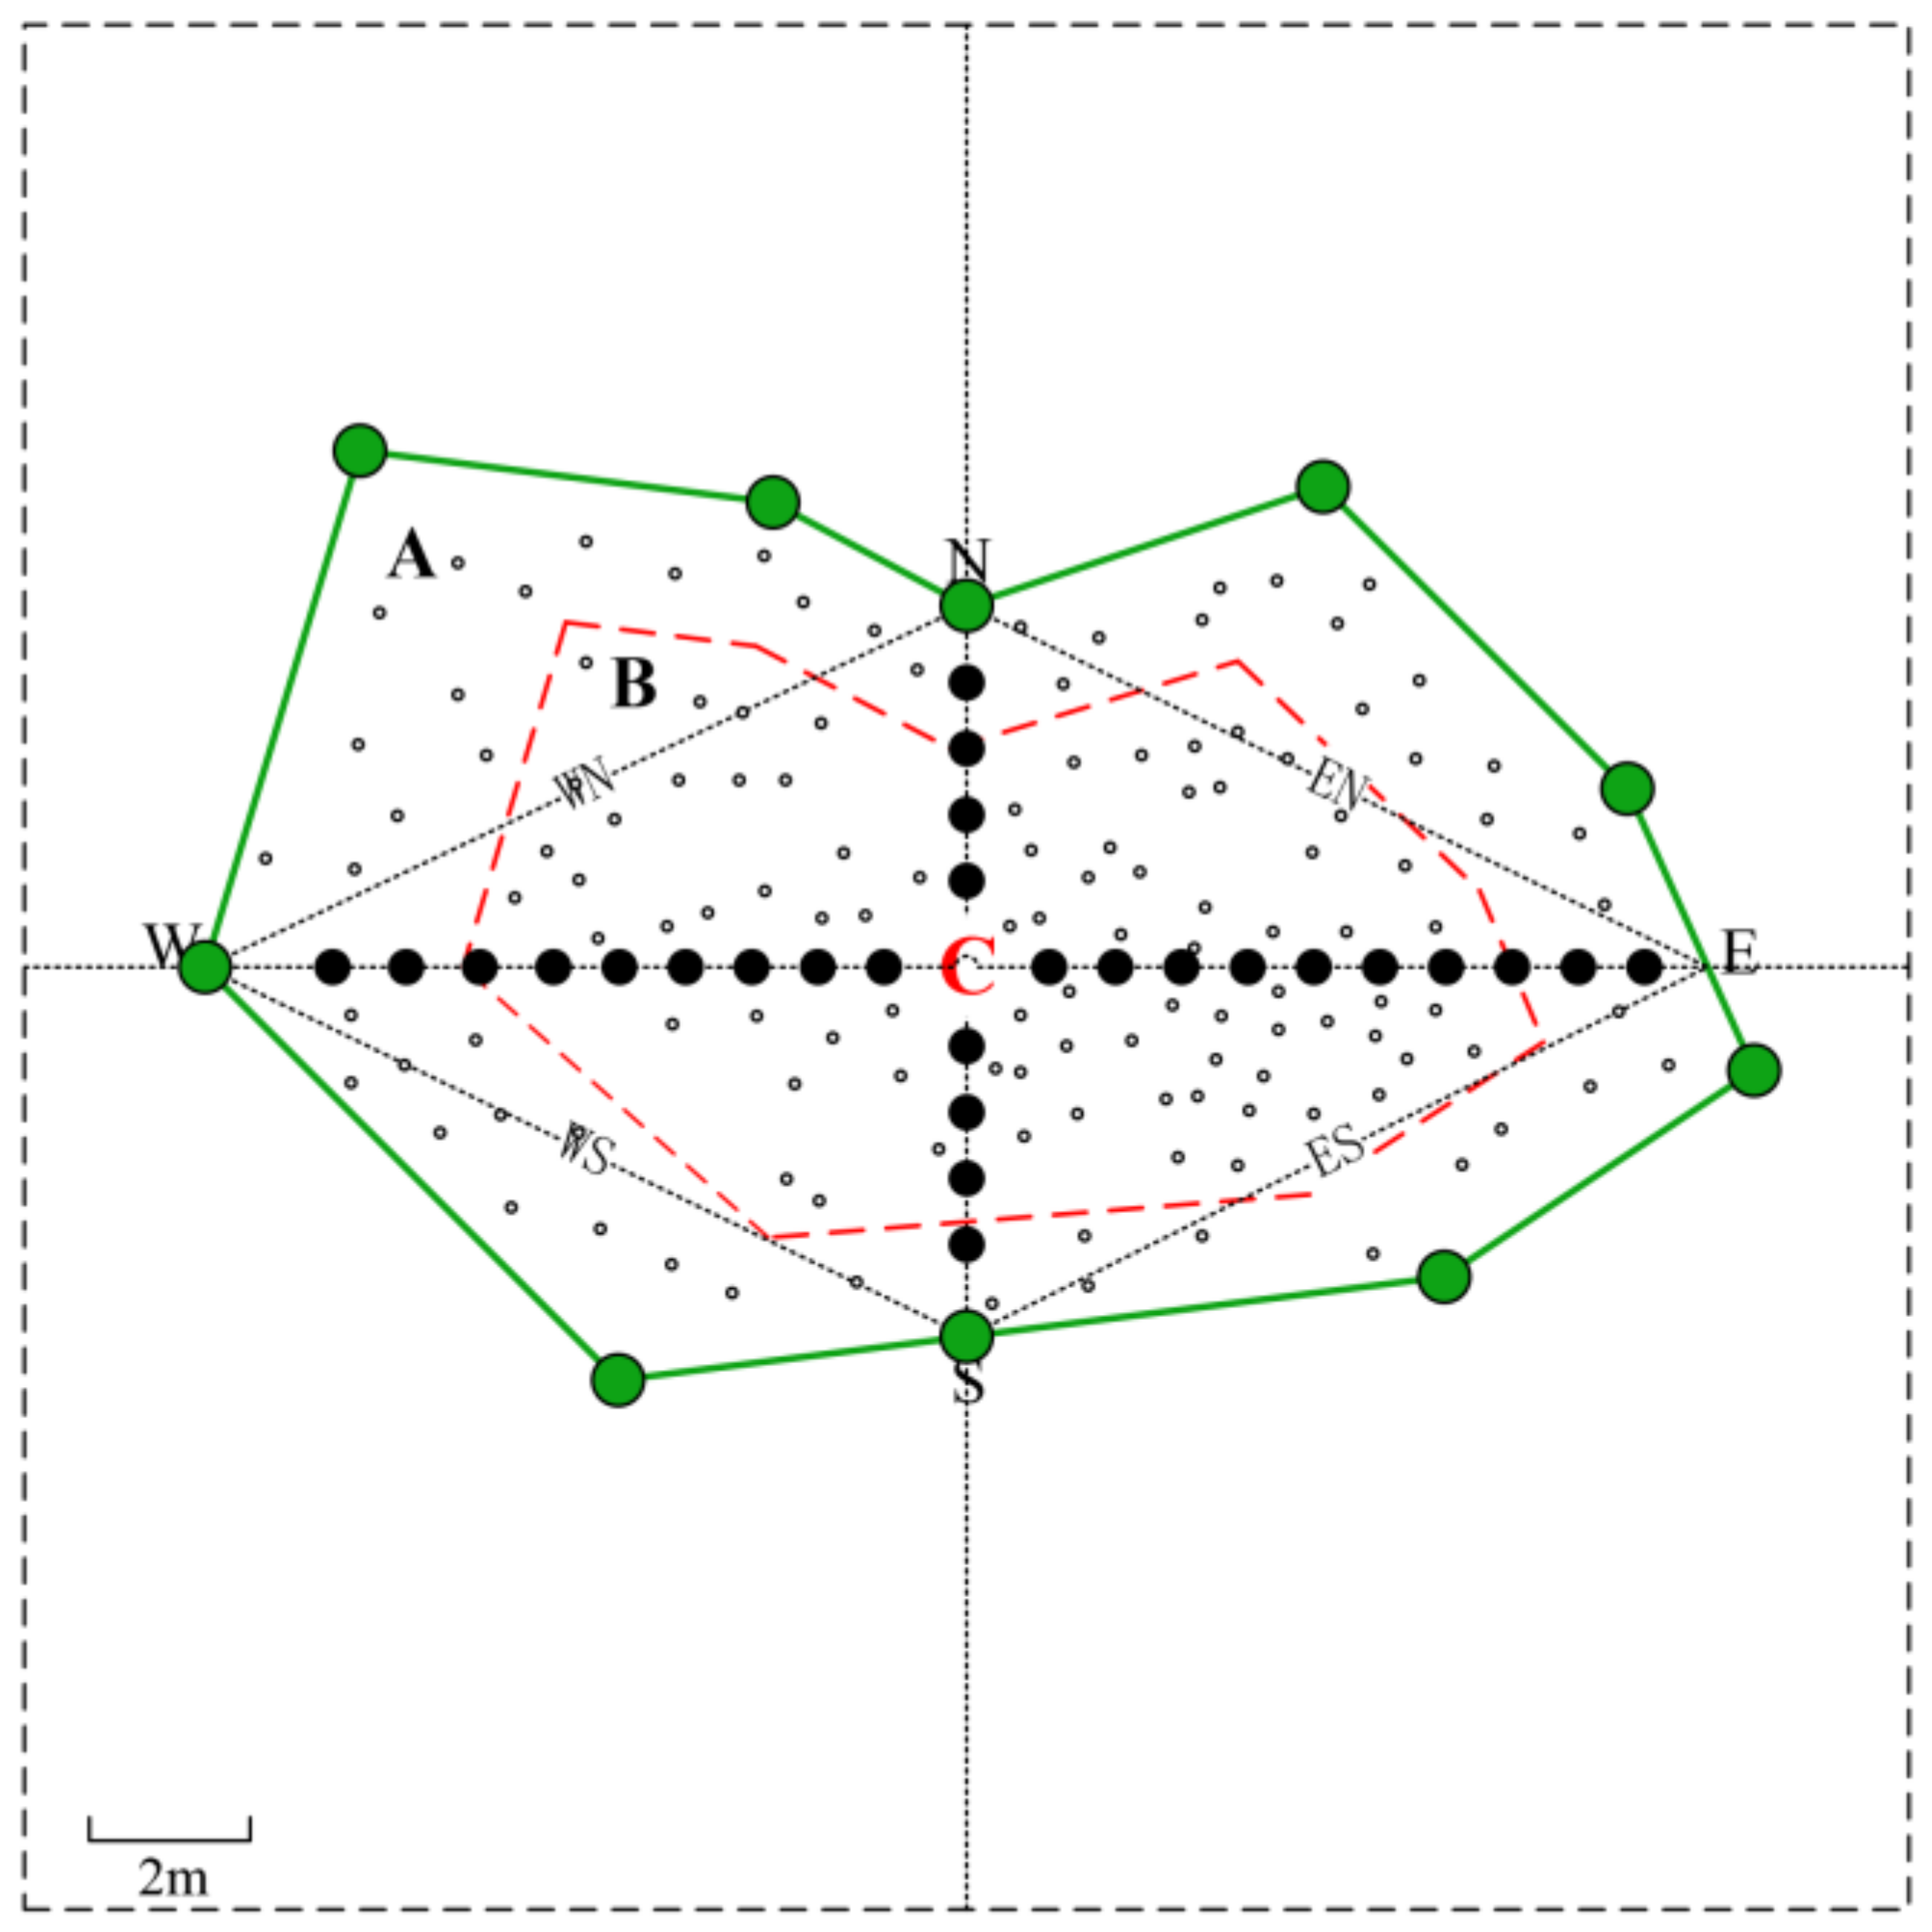
In this study, the forest gap represents extended forest gaps (Figure 1). An extended forest gap resembles a polygon enclosed by all border trees, and the center of gravity of the polygon is used as the center of the gap to establish a coordinate system. The forest gap size was calculated using the Helen formula because the gaps were almost polygonal. The total triangular area formed by the center of the gap and the border trees was used for calculation. The gap size was calculated using Formulas (1) and (2):
A = s ( s a )   ( s b )   ( s c )
In Formula (1), A is the area of the triangle; s is the half circumference; and a, b, and c are the lengths of each side.
The area of the forest gap was calculated as follows:
A = A 1 + A 2 + A 3 + + A n

2.3. Data Collection

2.3.1. Soil Bacterial Community

Bulk soil was collected in July 2021 in order to understand the soil bacterial community composition (i.e., microbiota) and physical–chemical changes that occurred during gap development. Two composite soil samples were collected from a depth of 0–10 cm in each gap and closed forests using a 5.0 cm diameter ring cutter soil drill, consisting of a mixture of non-rhizosphere soil from the points of C, E, S, W, and N using an “X”-shaped collection scheme and the points of C, NW, SE, NE, and SW, respectively (Figure 1). The soil drill was disinfected and wiped with ethanol and distilled water in between the samplings.
A total of 150 composite soil samples (25 gaps × 2 composite soil samples × 3 replicates) were collected. Large stones and roots were removed, and the samples were air-dried, homogenized, and sieved (<2 mm) for a 16S rRNA analysis. All the soil samples were stored in sterilized plastic bags, placed in coolers filled with dry ice, shipped back to the laboratory within 3 days, and stored in a cryogenic freezer at –80 °C until genomic DNA extraction.

2.3.2. Gap-Related Microenvironmental Monitoring

The primary variables measured in each gap were as follows: (1) light properties including canopy openness (CO), relative light intensity (RLA), total solar radiation under the canopy (Utot), direct solar radiation under the canopy (Udir), diffuse solar radiation under the canopy (Udif), and leaf area index (LAI); (2) soil physical–chemical characteristics including soil moisture content (SW), soil temperature (ST), electrical conductivity (EC), soil organic matter (SOM), available nitrogen (AN), available phosphorus (AP), available potassium (AK), soil urease activity (URE), soil phosphatase activity (PHO), and soil invertase activity (INV).
The scale of the forest gaps was estimated using the hemispherical photograph method, using a digital camera (Canon EOS-1D Mark IV, Canon Inc., Japan) fitted with an EF 8–15-mm f/4 L USM fisheye lens, on cloudy days during the growing season (Figure 1). The light properties in each gap and closed forests (e.g., CO, RLA, Utot, Udir, Udif, and LAI) were calculated using an imaging software (Gap Light Analyzer v.2.0) [2]. ST and EC were measured using a multi-parameter WET sensor (WET-2, Delta-T Devices Ltd., Cambridge, UK) [16]. The ST and EC was tested at each sub-sampling site under each forest gap, respectively. All composite soil samples were used to determine the soil moisture and soil nutrients. SW was measured gravimetrically by drying the soil at 105 °C for 24 h [17]. SOM content was determined by the potassium dichromate-concentrated sulfuric acid-dilution heat method [18]. AP was extracted using 0.5 M of NaHCO3 and determined using the molybdenum blue colorimetric method [19]. AN was measured using the alkaline permanganate method [20]. URE activity was assessed using the sodium phenol hypochlorite colorimetric method, with 10% urea solution as a substrate [21]. PHO activity was measured using the phenyl phosphate sodium colorimetric method. INV activity was directly measured using the 3,5-dinitro-salicylic acid colorimetric method [22].

2.3.3. DNA Extraction and 16S rRNA Gene Amplicon Sequencing

Total genomic DNA was extracted from the soil samples using the OMEGA Soil DNA Kit (M5635-02) (Omega Bio-Tek, Norcross, GA, USA) and stored at −20 °C prior to further analysis. The quantity and quality of the extracted DNA were measured using a NanoDrop NC2000 spectrophotometer (Thermo Fisher Scientific, Waltham, MA, USA) and agarose gel electrophoresis, respectively.
PCR amplification of the bacterial 16S rRNA genes V3–V4 region was performed using the forward primer 338F (5′-ACTCCTACGGGAGGCAGCA-3′) and reverse primer 806R (5′-GGACTACHVGGGTWTCTAAT-3′). Sample-specific 7-bp barcodes were incorporated into the primers for multiplex sequencing. The PCR components contained 5 μL of buffer (5×); 0.25 μL of Fast pfu DNA Polymerase (5 U/μL); 2 μL (2.5 mM) of dNTPs; 1 μL (10 uM) of each Forward and Reverse primer; 1 μL of DNA Template; and 14.75 μL of ddH2O. Thermal cycling consisted of initial denaturation at 98 °C for 5 min, followed by 25 cycles consisting of denaturation at 98 °C for 30 s, annealing at 53 °C for 30 s, and extension at 72 °C for 45 s, with a final extension of 5 min at 72 °C. PCR amplicons were purified with V azyme V AHTSTM DNA Clean Beads (V azyme, Nanjing, China) and quantified using the Quant-iT PicoGreen dsDNA Assay Kit (Invitrogen, Carlsbad, CA, USA).

2.4. High-Throughput Analysis

After the individual quantification step, the amplicons were pooled in equal amounts, and pair-end 2 × 250 bp sequencing was performed using the Illlumina NovaSeq platform with the NovaSeq 6000 SP Reagent Kit (500 cycles) at Shanghai Personal Biotechnology Co., Ltd. (Shanghai, China). Using QIIME2 software (version 2019.4, https://qiime2.org/, accessed on 1 October 2022), the microbiome bioinformatics of each sample was performed [23]. The raw sequence data were demultiplexed using the demux plugin, followed by primers cutting with the cutadapt plugin [24]. Our raw data were uploaded to NCBI database (serial number: PRJNA792800). The high-quality tag data (clean tags) were obtained using the DADA2 method when the raw sequences were quality filtered, denoised, merged, and the chimera removed [25]. Assemblages were clustered at a 100% similarity level and defined as amplicon sequence variants (ASVs) using DADA2 [26]. The ASVs were taxonomically annotated based on the Greengenes (bacteria) taxonomic databases [27]. Rarefaction curves were constructed using the number of sequences drawn and the number of ASVs they represented. The sparsity curve entered a plateau (Figure S1), indicating that the sequencing depth was sufficient to reflect the actual soil microbiota.

2.5. Statistical Analysis

The Shapiro-Wilk test and Levene’s test were used to assess the normality and chi-square of the relative abundance of the major taxa of soil bacteria, diversity indices, light factors, and soil factors. A one-way ANOVA with Tukey’s HSD test (p < 0.05) was performed for the light factor, soil physicochemical factors, and dominant bacterial phyla, between different forest gap size classes using SPSS 23.0 (IBM SPSS Statistics, Chicago, IL, USA).
For all sequencing data, bacterial alpha diversity indices were analyzed using QIIME 2 software (version 2019.4). Wilcoxon test and Dunn’s test as a post hoc test was used to compare different-sized gaps on soil bacterial alpha diversity. The species diversity inside the single sample was studied using an alpha diversity analysis. The observed species richness and Chao1 indices of each sample were counted at the 100% similarity level [28]. A principal coordinate analysis (PCoA) based on Bray–Curtis distances was performed to compare differences in bacterial communities between samples through the “vegan” package of the R language (version 4.2.0, http://www.R-project.org/, accessed on 5 October 2022) software. Subsequently, an analysis of similarity (ANOSIM) and a non-parametric multivariate analysis of variance (PERMANOVA) were used to compare the similarity of bacterial communities among different forest gap sizes.
A co-occurrence network analysis was performed using Spar CC. The pseudocount value in Spar CC was set to 10−6. The R package “RM Threshold” was used to determine the cutoff of correlation coefficients as 70 based on random matrix theory. Additionally, the average degree (AD), the negative and positive connection proportions (N/P cohesion), the number of modules (No. Modules), and the modularity were calculated to predict the co-occurrence network complexity (the higher of them indicates a more complex microbial network) [29,30,31,32,33,34]. The network was visualized using Gephi (version 0.9.2 for Mac OS X).
A redundancy analysis of forest gap factor, light factor, and soil factor with bacterial communities was performed using the CANOCO 5.0 software package. We further identified gap-related micro-environmental factors significantly associated with community composition using the Mantal test based on Bray–Curtis similarity distance, with 999 Monte Carlo tests [27]. The environmental factors were divided into four categories: gap size, light properties, soil physicochemical characteristics, and regeneration factors (regeneration density, average diameter at breast height of regeneration individuals, average height of regeneration individuals). All these data were square root varied to ensure that the variance was homogeneous prior to the statistical analysis.
Based on the RDA, structural equation models were developed for all factors that contributed more than 10% and were highly correlated. Factors that did not have a significant effect on the bacterial community were removed according to the model fitting criteria. All parameters of the fit index between the model and the sample data satisfied the minimum fitting criterion. The chi-square-to-degrees of freedom (Chi/DF) ratio was <5, the p-value was >0.05, and the root mean squared error of approximation (RMSEA < 0.05) was within the desired range. In the baseline comparison, the goodness-of-fit index (GFI), normed fit index (NFI), relative fit index (RFI), incremental fit index (IFI), nonconstant fit index (TLI), and comparative fit index (CFI) were considered “best” within the range of 0.9–1.0 [35]. Therefore, conclusions drawn from the modified model were considered reasonable. The standardized path coefficients (Std. PCs) were calculated, and the effects of gap size on the soil bacterial communities were determined. The Amos Graphics 24 software (IBM/International Business Machines Corporation, Armonk, NY, USA) was used to perform structural equation modeling (SEM) to examine the relationship between multiple dependent and independent variables.

3. Results

3.1. Light Properties of Forest Gaps

The light properties of forest gaps are shown in Table 2. Significant differences were detected among the light characteristics (including CO, Utot, Udir, Udif, RLA) under forest gaps (p < 0.05), with the exception of LAI. The CO, Utot, Udir, Udif, RLA, and LAI were significantly different between forest gaps (G50, G70, G100, G125, G150, G250) and closed forests (G0). In the G50, G70, G100, G125 groups, the CO, Utot, Udir, Udif, and RLA gradually increased with the increase in gap size.

3.2. Soil Physicochemical Properties of Forest Gaps

The nonparametric tests showed that the significant differences were detected among the soil physicochemical properties, including SW, SOM, AK, PHO, and INV (p < 0.05) among the forest gaps and closed gaps, with the exception of ST, EC, AN, AP, and URE (Table 3). Soil SW, ST, EC, AN, PHO, and INV in the G250 group were the highest among all forest gaps. Soil AN favored an increase with the increase in forest gap size. In the G50, G70, G100, and G125 groups, soil enzyme activities (including PHO, URE, and INV) and SOM gradually increased with the increase in gap size. The soil SW, EC, SOM, AK, and soil enzyme activities (including PHO, URE, and INV) were lowest in the G150 group.

3.3. The Composition of Soil Bacterial Communities in Forest Gaps

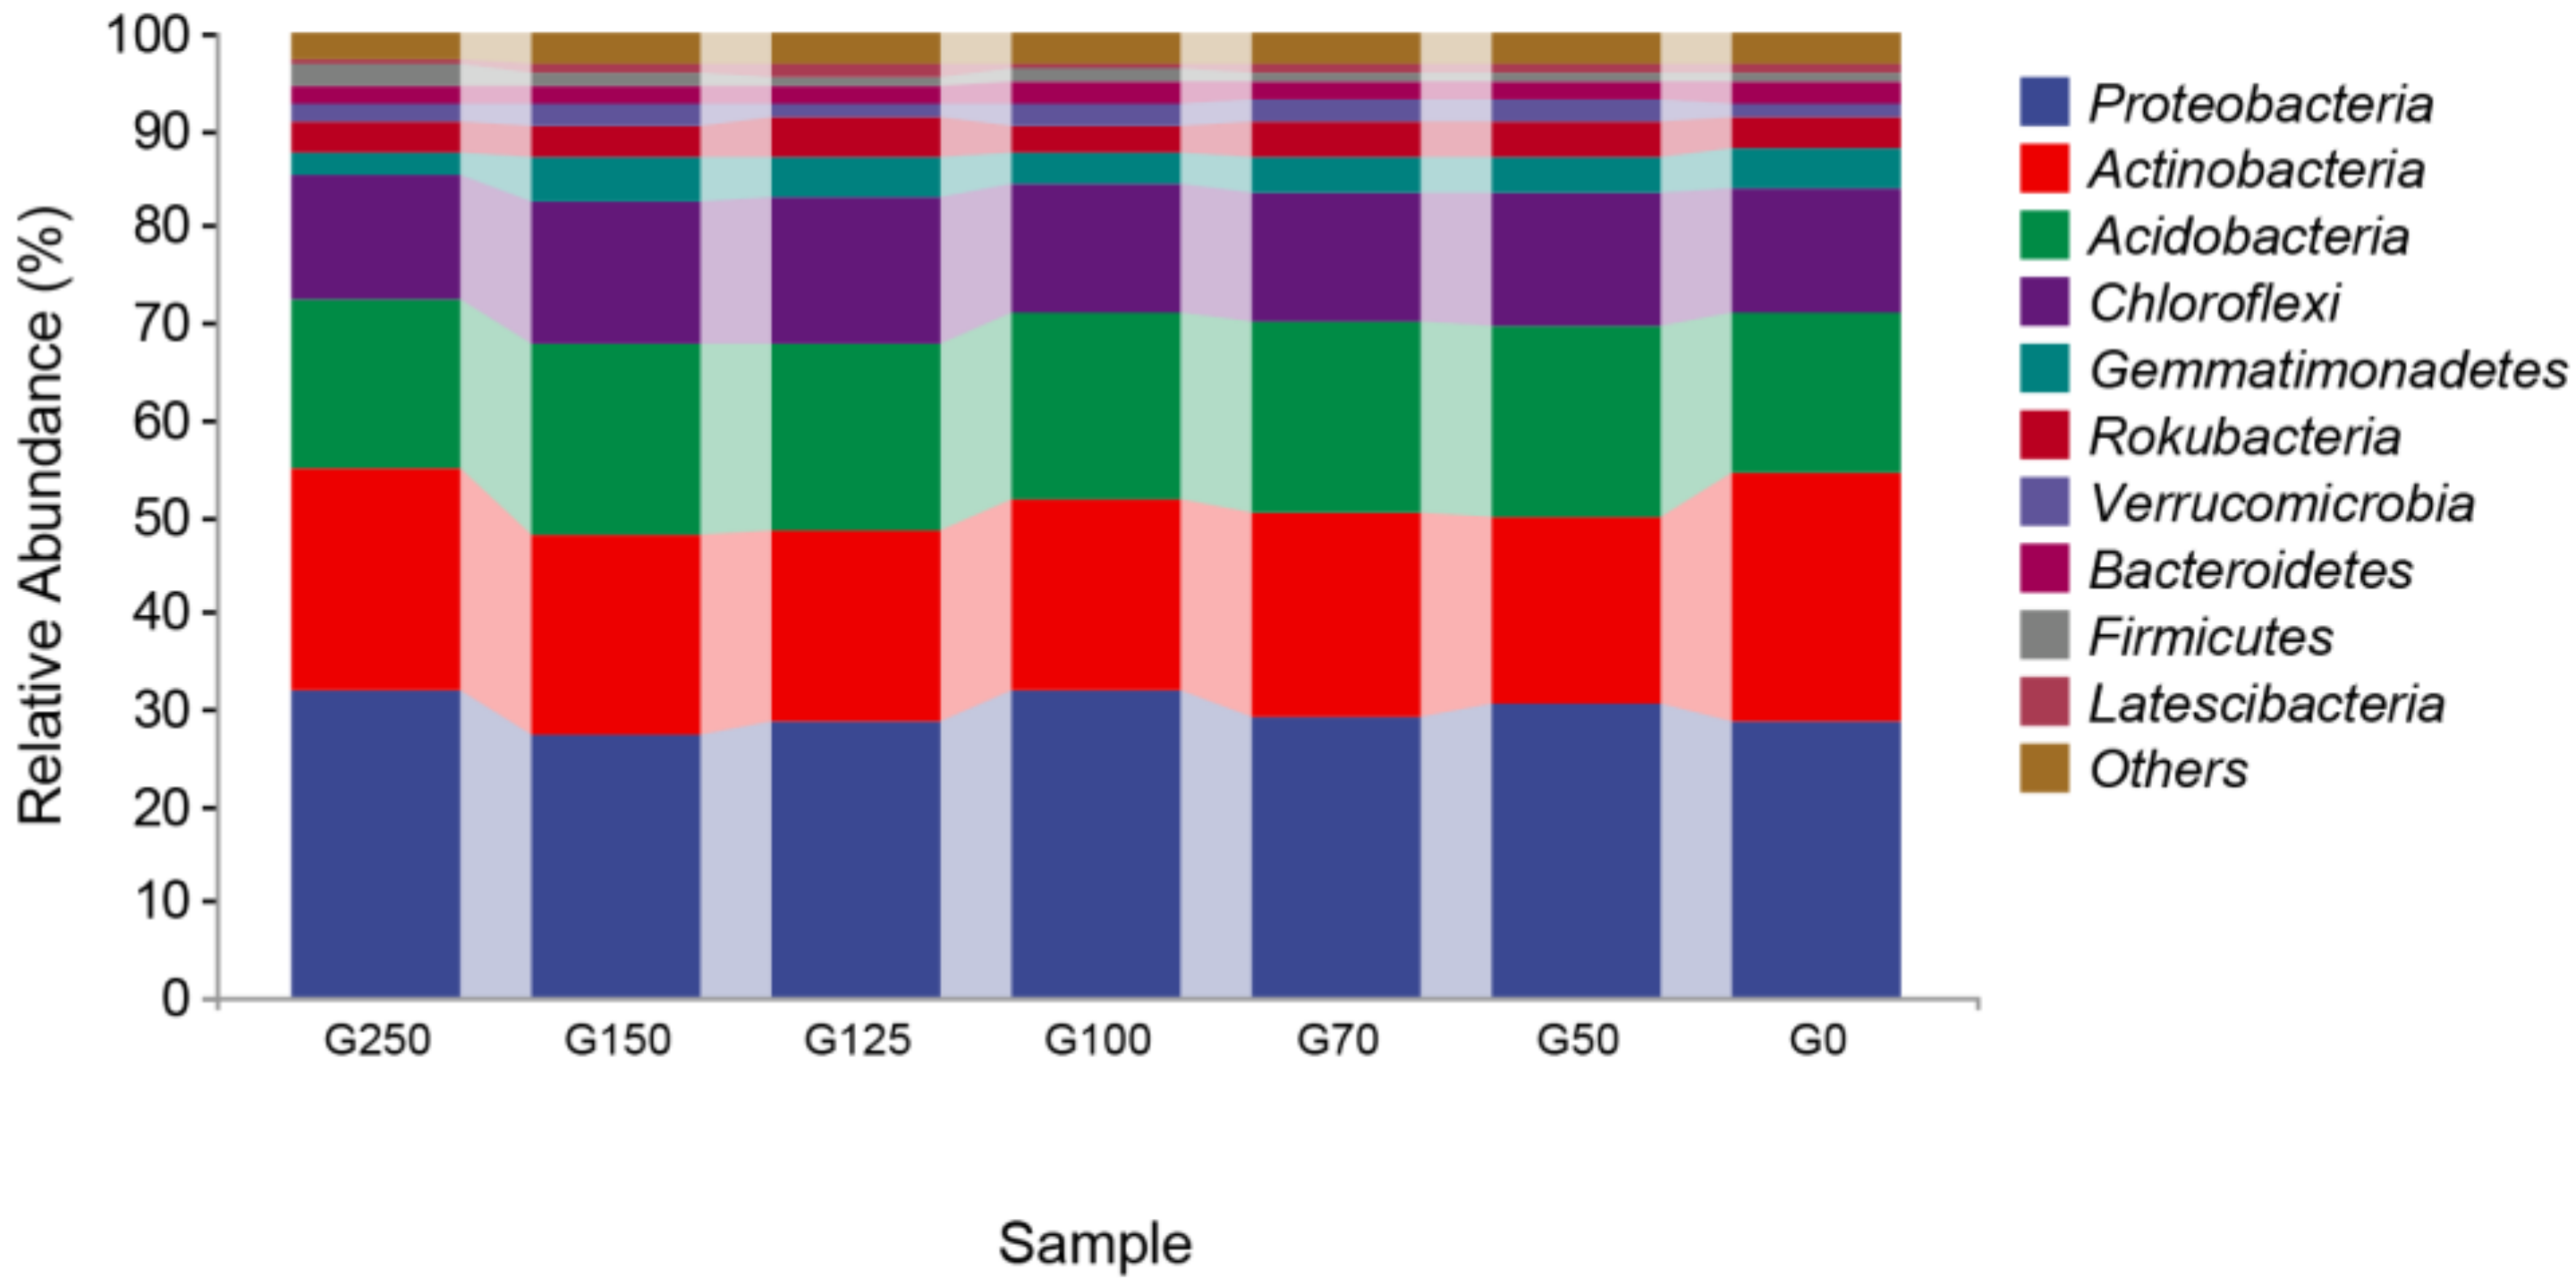
A total of 1,740,200 sequences were divided into 72,987 ASVs, which included 1119 genera, 525 families, and 41 phyla. The dominant bacterial community in soil was mainly affiliated with Proteobacteria (29.73%), Actinobacteria (21.36%), Acidobacteria (18.89%), and Chloroflexi (13.76%) (relative abundance > 10%) (Figure 2). Overall, there were no significant differences at the phylum level in soil bacteria among different-sized forest gaps.

3.4. Soil Bacterial Community Diversity in Forest Gaps

Significant differences were detected in the Shannon, Chao1, observed species richness, and Faith PD indices in the soil bacterial community among different-sized forest gaps (p < 0.05), which initially increased and subsequently decreased with the increasing gap size. The highest Shannon, Chao1, observed species richness, and Faith PD indices were found in the G100 group (Figure 3a). The Venn diagram indicated that the G100 group contained more unique ASVs (8827), as compared with other groups (Figure S2). Based on weighted UniFrac distance, PCoA revealed 25.6% variation along the first axis and 13.7% variation along the second axis. The results are shown in Figure 3b and Table S1. All the samples were clustered, and compositional differences were evident among different groups (ANOSIM R = 0.173, p < 0.001; ADONIS R2 = 0.195, p < 0.001), which indicated that the grouping was reasonable.

3.5. Co-Occurrence Network Structure of Soil Bacterial Community in Forest Gaps

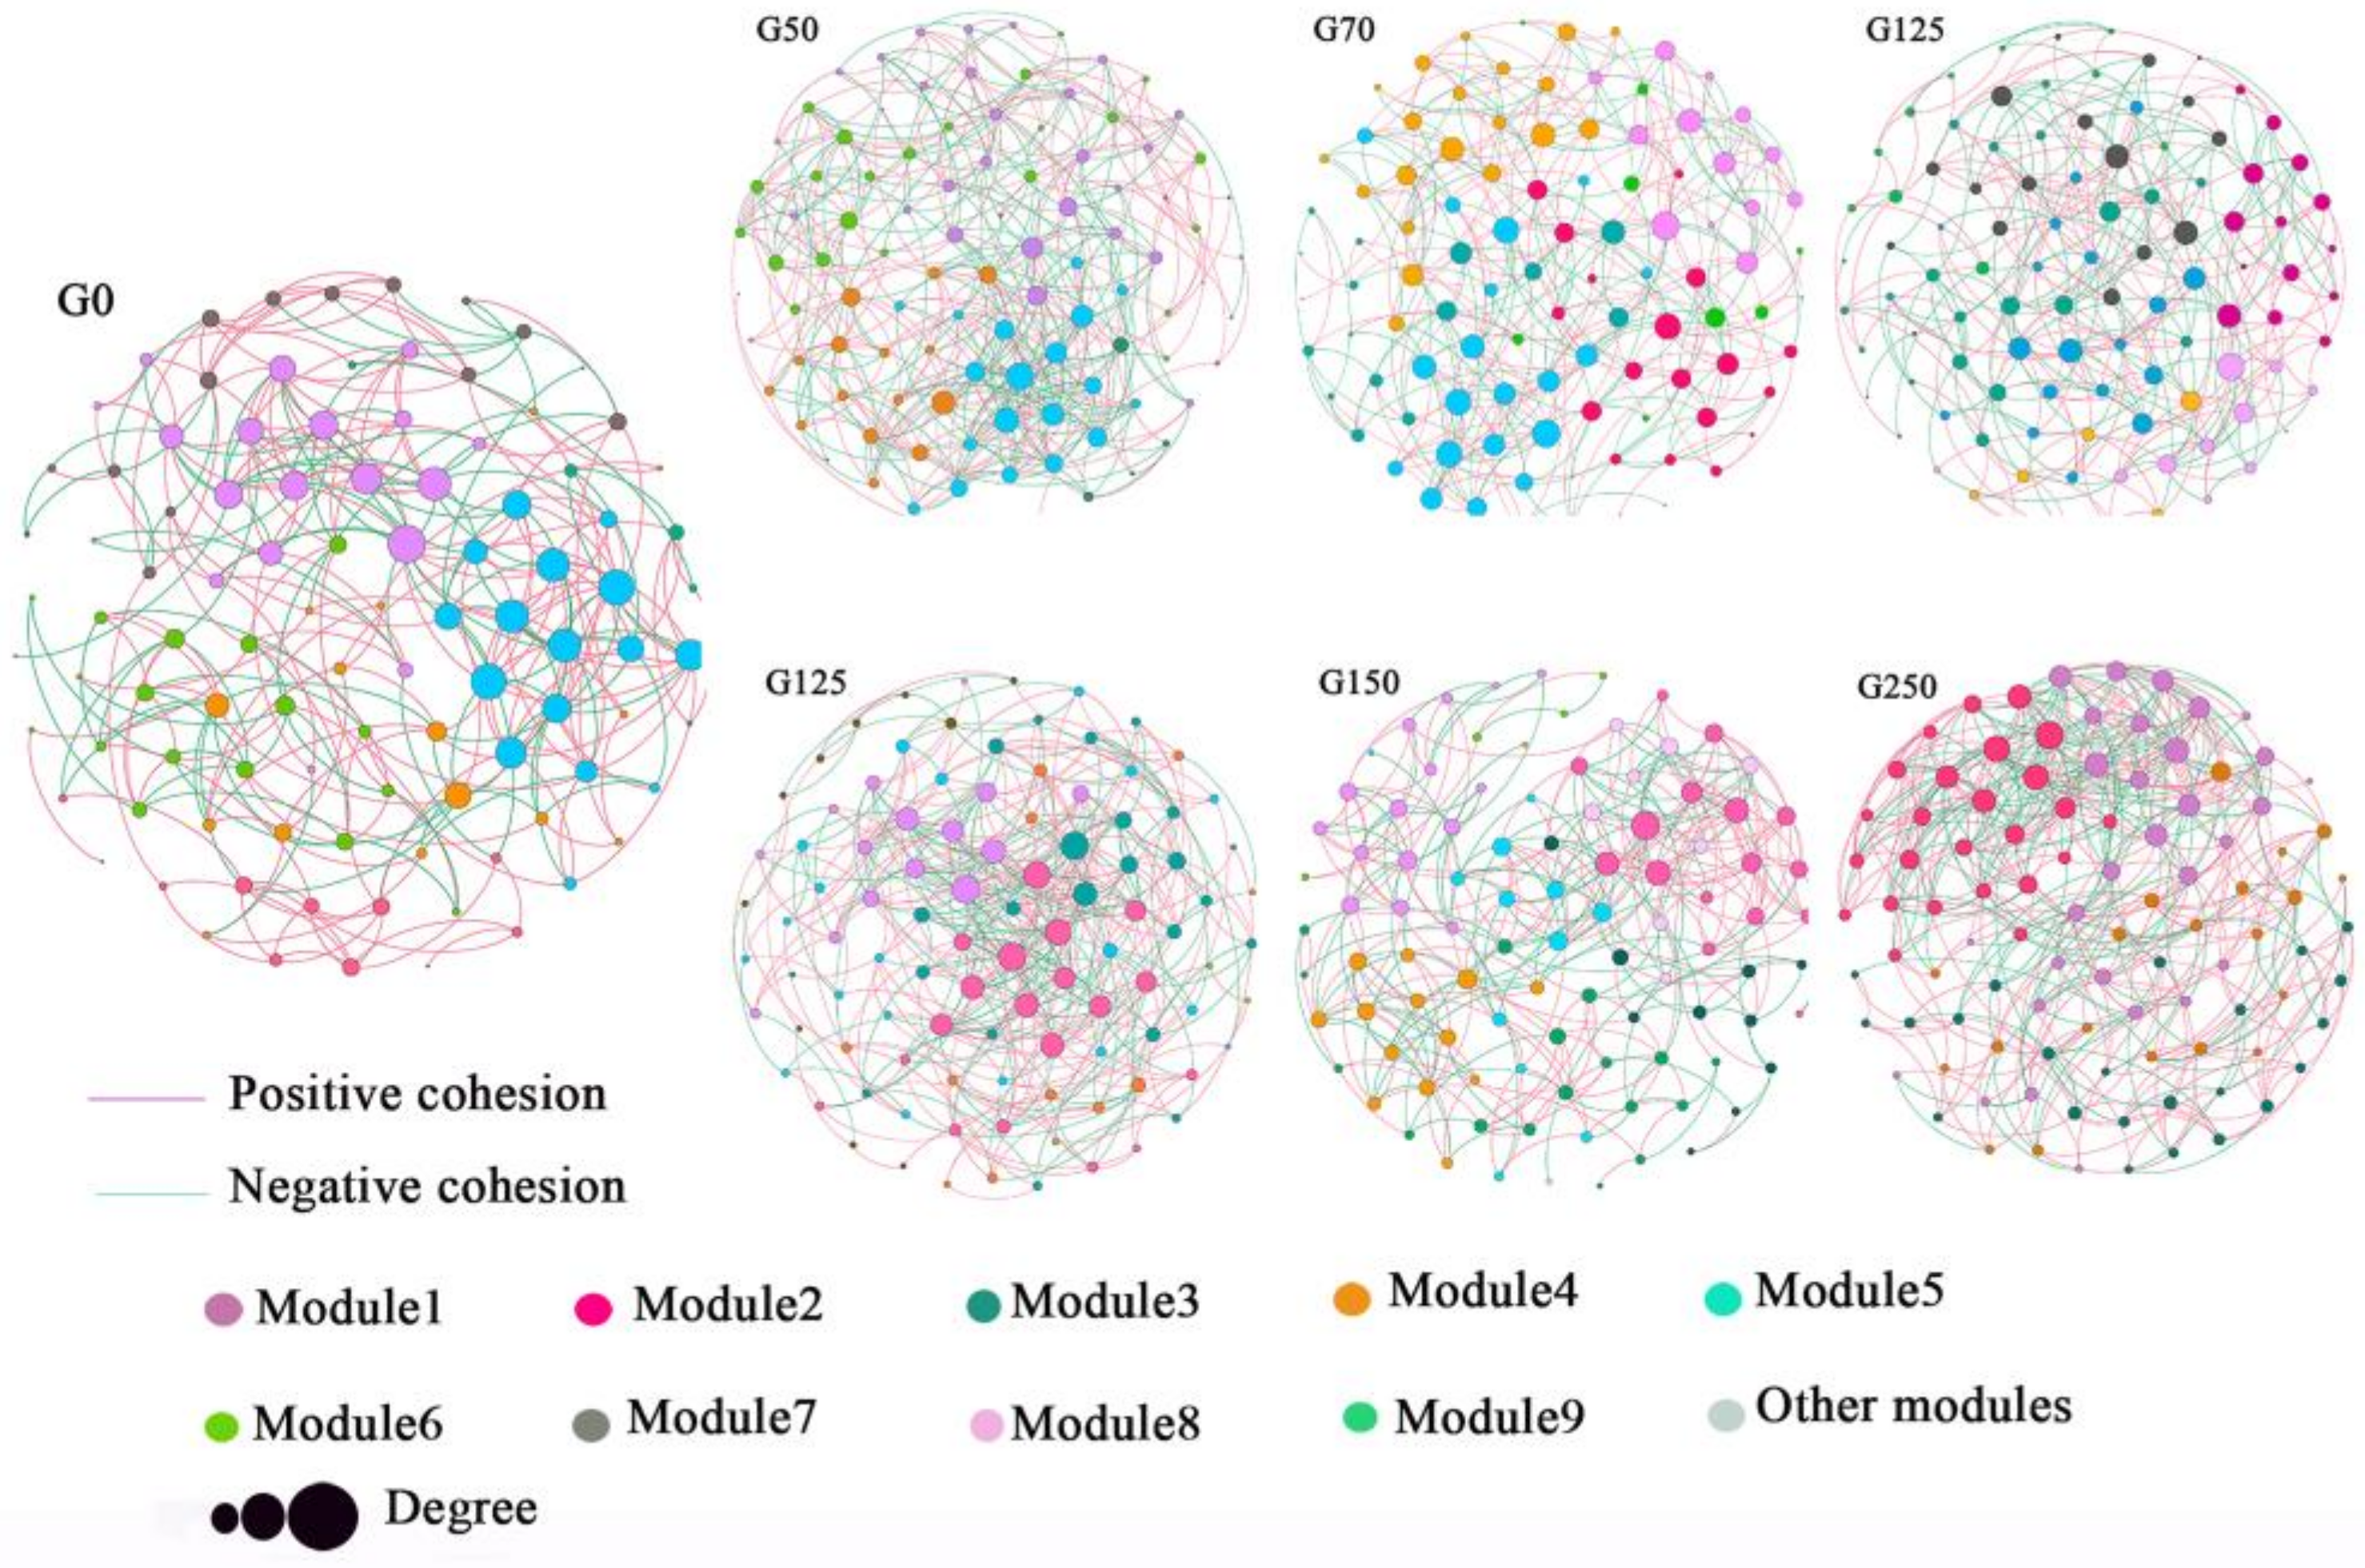
Soil bacterial co-occurrence networks were constructed for seven gap size classes (Figure 4 and Table S2). Differences in the network structure complexity of soil bacterial communities were observed among different-sized gaps, and the trend of the network average degree (AD) of the symbiotic network was G0 < G100 < G70 < G150 < G125 < G50 < G250 group. The trend of negatively correlated connections proportions (N/P cohesion) was G0 < G250 < G150 < G125 < G100 < G50 < G70 group. The G0 group had the highest average path distance (APL) and modularity degree and the lowest AD and N/P cohesion. The G250 group had the highest AD, density, and average clustering coefficient (ACC) and the lowest APL and N/P cohesion. The trend of modularity degree was G125 < G50 < G250 < G100 < G70 < G150 < G0 group. In the G0 group, one module accounted for more than 20% of the overall network, including Module1 (20.2%). Among the G50 group, two modules accounted for more than 20% of the overall network, including Module 3 (30%) and Module 2 (25%). Module 4 (22%) and Module 2 (20%) became the main modules in the G70 group network. In the G100 and G125 groups, one module accounted for more than 20% of the overall network, including Module 5 (20%) and Module 3 (23%), respectively. The G150 group contained eight modules in the network, but none of the modules accounted for more than 20%. However, the G250 group contained only four modules in total, including Module 1 (30.61%), Module 2 (25.51%), Module 3 (23.47%), and Module 4 (20.41%). The above indicated that the co-occurrence network of soil bacteria in forest gaps had significant variation.

3.6. Correlation between Gap-Related Microenvironmental Factors and Soil Bacterial Community Composition and Network Structure

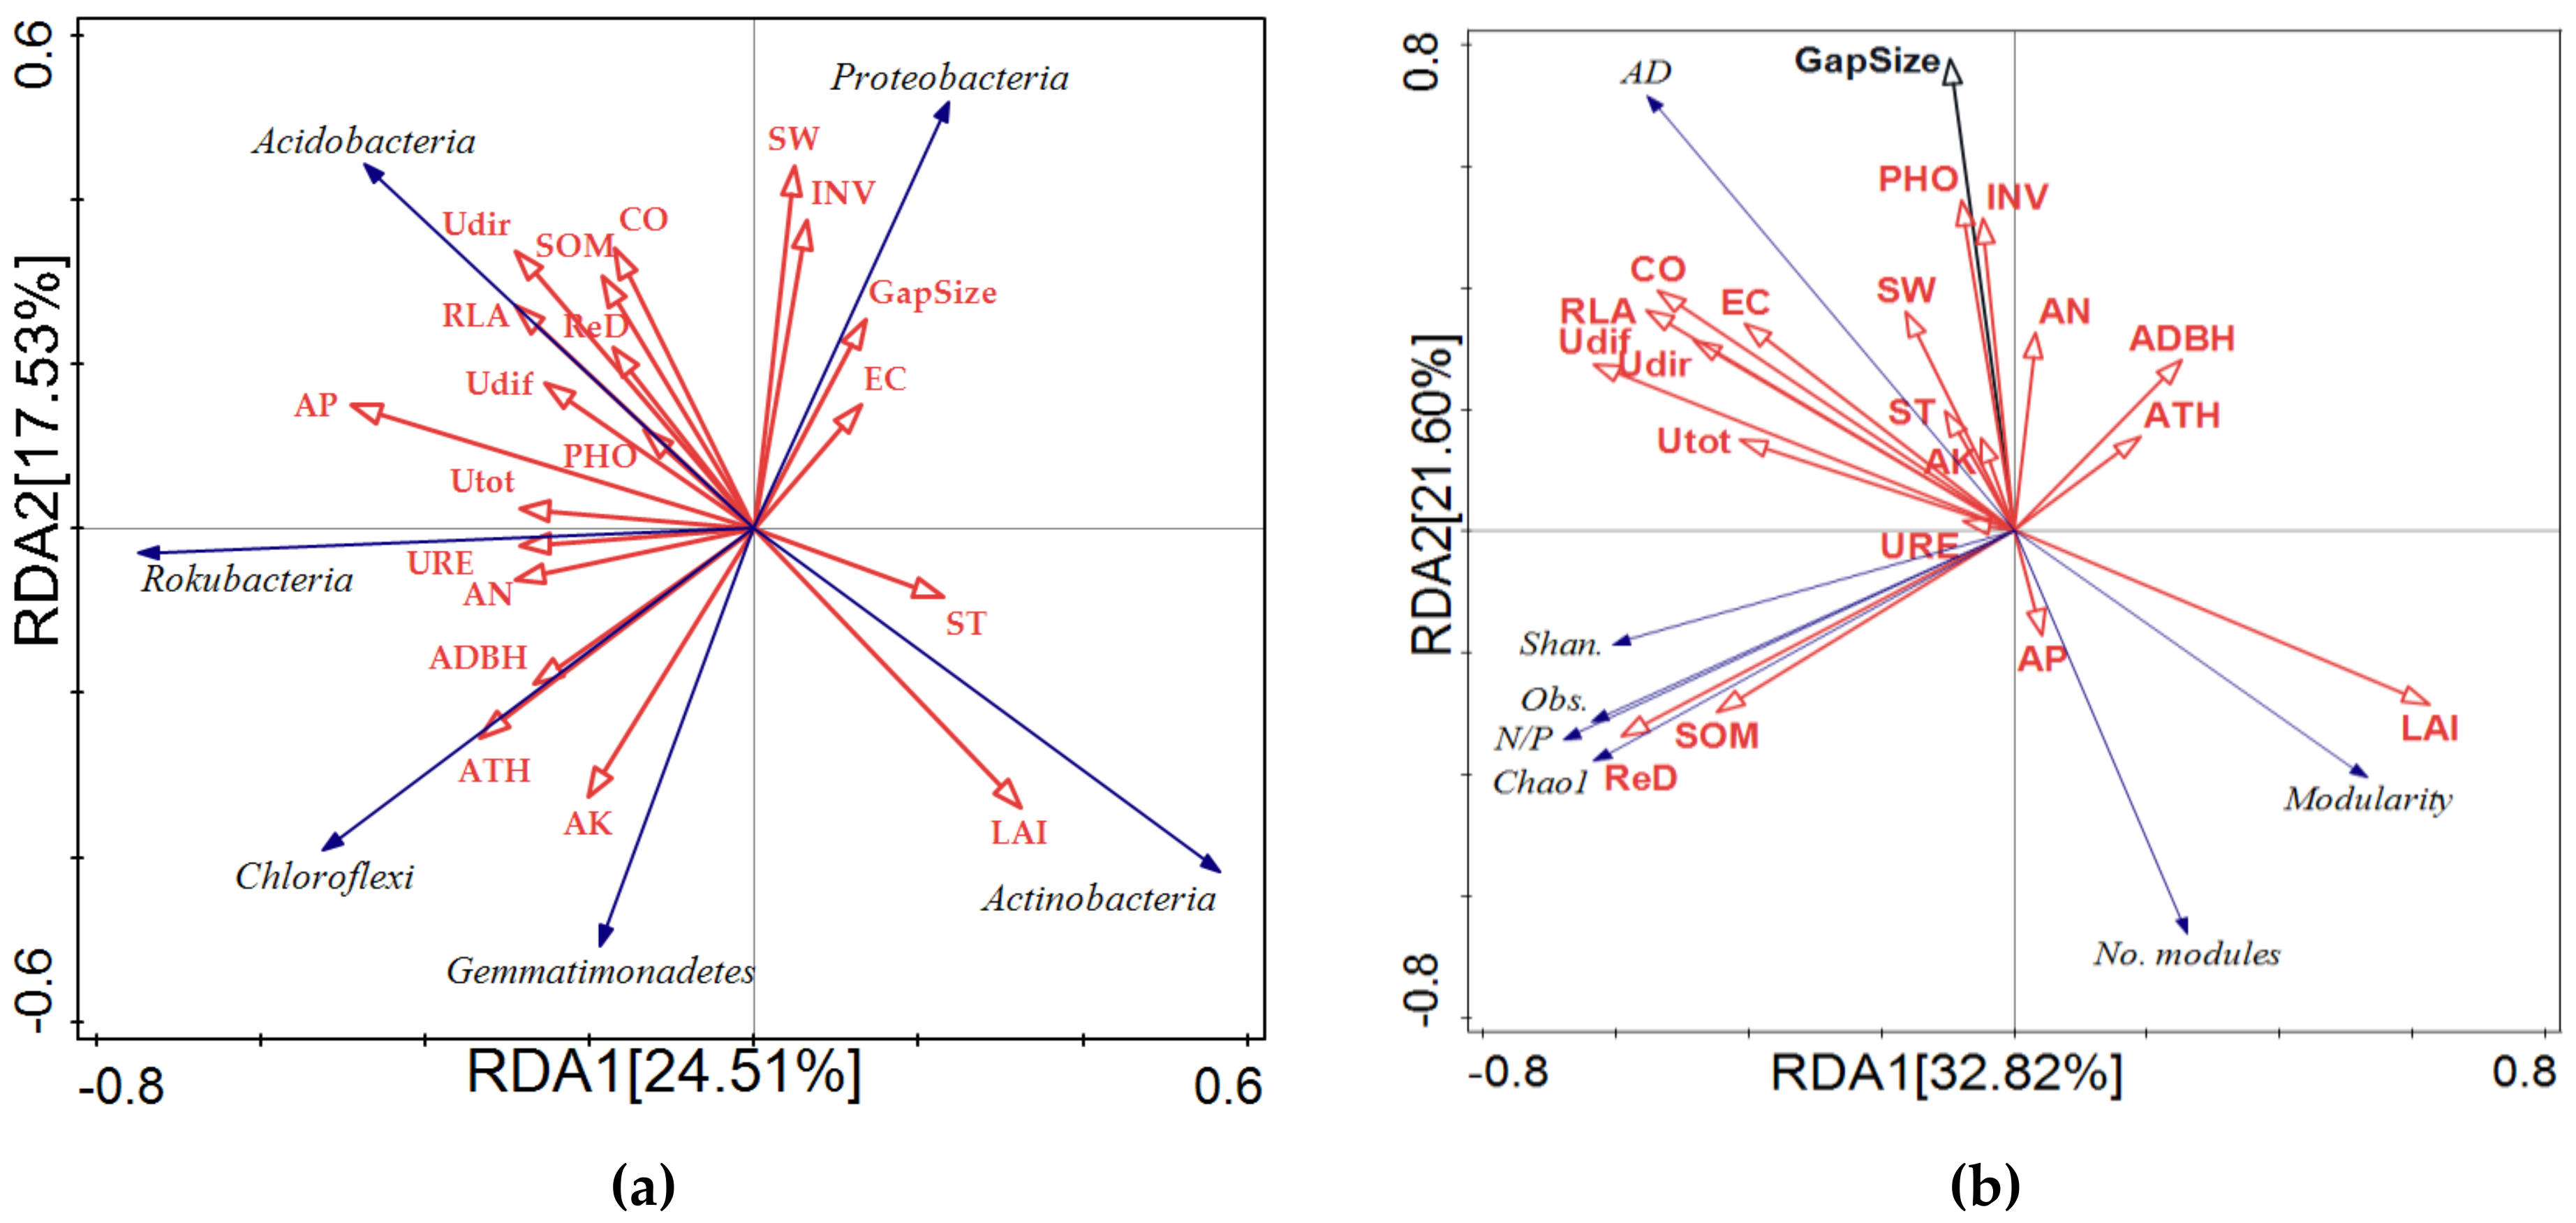
The results of the redundancy analysis showed that the first two axes explained 42.03% of the variation in the bacterial community. Soil AP, ATH, LAI, and Utot were the main environmental factors affecting the soil bacterial community composition under forest gaps (p < 0.05) (Table S3). Soil AP was the most critical factor driving bacterial community variation under the forest gap (Figure 5a).
It can be seen from Table S4 that gap size, ReD, LAI, RLA, and ATH were significantly correlated with the soil bacterial diversity and network structure (p < 0.05), whose contribution rates reached 32.82% and 21.60%, respectively. Gap size, LAI, RLA, and ReD were the main environmental factors that influenced the soil bacterial community diversity and co-occurrence network structure (p < 0.05) (Figure 5b).

3.7. Linkages of Soil Bacterial Composition and Co-Occurrence Network Complexity to Forest Gap Sizes

Based on the results of RDA, the structure equation model was performed for all factors that had a contribution rate greater than 10% and were significantly related. Factors that did not have a significant effect on the bacterial community were removed according to the model-fitting criteria. The model was then corrected several times. Finally, all parameters of the fit index between the model and the sample data satisfied the minimum fitting criterion (Table S5).
The forest gap size negatively impacted on the soil bacterial community composition and significantly positively impacted on the soil bacterial community co-occurrence network complexity. Their Std. PCs were −0.37 and 0.67, respectively. Studying the relationship between observed and latent variables should help to identify some easily adjustable drivers that control the development of forest gaps-soil bacteria. For indicators of bacterial composition, the correct models showed that the Chao1 index and observed species richness were the most significant, with path coefficients of 0.96 and 0.99, respectively. For indicators of bacterial network structure, N/P cohesion was the most significant, with path coefficients of 0.98. Meanwhile, the CO, RLA, and LAI were the most significant observed variables for indicators of light properties, with path coefficients of 0.97, 0.99, and −0.93, respectively. These light factors in forest gaps were significantly and positively correlated on the composition of bacterial communities, with total effects of 0.45. In contrast, soil nutrients were highly significantly negatively correlated with the complexity of the bacterial co-occurrence network, with total effects of −0.76. Forest gap size significantly reduced regeneration density in the stand, with path coefficients of −0.56. However, regeneration density was highly significantly and positively correlated with soil bacterial community complexity, with path coefficients of 0.87 (Figure 6).
In summary, the light factor under the forest gaps was the most significant factor influencing soil bacterial community composition, followed by the size of the forest gap. Among them, CO and RLA were considered to be the most important factors affecting soil bacterial community composition. The regeneration density under the forest gap was the most significant factor affecting the complexity of the soil bacterial community co-occurrence network, followed by soil nutrients (SW, PHO, and AP).

4. Discussion

4.1. Gap-Related Microenvironments

In this study, we found that light properties varied significantly among forest gaps and closed forests. Gap formation increased the light characteristics, including CO, RLA, Utot, Udir, and Udif, while LAI showed the opposite trend with the above light indicators. The increase in total leaf area reduced the amount of solar radiation reaching the ground. Light properties, including CO, RLA, Udir, and Udif, were lowest in the G0 group, indicating that the closed forests lead to the lowest light radiation intensity. The G250 group, which represented the maturity stage of the forest gap or a large disruption of the forest canopy, revealed the most intensive light properties. Therefore, the light properties—except for LAI in the G250 group—were highest in all groups. The formation of forest gaps leads to an increase in light, causing an increase in soil moisture and temperature, which in turn affects soil nutrient content through decomposition and mineralization processes [2,36,37,38].
Except for soil AP and URE, soil AK, AN, PHO, and INV showed an increasing trend with the increase in gap size. Among them, soil AK, PHO, and INV varied significantly among forest gaps and closed forests. Soil nutrients, including AK, SOM, PHO, URE, and INV in the G150 group, were the lowest among all groups, indicating that 150–250 m2 of forest canopy disturbance leads to the lowest soil nutrients. G250, which represented the maturity stage of a gap or a large disruption of the forest canopy, revealed the most intensive soil nutrients. Soil AN, AK, PHO, and INV in the G250 group were higher than the other groups, which was closely related to the increase in soil moisture, temperature, and electrical conductivity in the G250 group. Soil bacteria require suitable soil properties for growth, and changes in soil properties can affect soil bacterial communities [19,20]. Forest gaps may influence the soil bacterial community diversity and co-occurrence network structure due to changes in their light properties and soil physical–chemical characteristics.

4.2. Effects of Gap-Related Microenvironments on Soil Bacterial Composition and Co-Occurrence Network Structure

Gap-related microenvironments have different effects on soil bacterial composition. CO and RLA were found to be the main environmental factors that promoted changes in the relative abundance of bacterial phyla. Being the dominant soil bacteria of L. principis-rupprechtii plantations, Proteobacteria, Actinobacteria, Acidobacteria, and Chloroflexi can be used to predict the indicator’s status [39]. Acidobacteria is an eosinophilic bacterium that is widely distributed in various environments [40]. The increase in CO, soil AP, and ReD had a positive effect on the relative abundance of Acidobacteria, whereas increasing ST and LAI had a negative effect. A higher abundance of Proteobacteria in the soil can promote the cycling of essential soil nutrients, thereby enhancing soil fertility and sustainable use [20,41,42]. In this study, Proteobacteria is an eosinophilic bacterium that grows well in L. principis-rupprechtii plantations. The relative abundance of Proteobacteria was highest in the G250 group. The RDA analysis showed that the increased gap size, soil SW, INV, and EC had positive effects on the relative abundance of Proteobacteria, which suggested that the increased gap size, soil SW, INV, and EC could improve its relative abundance.
In addition, CO and RLA were found to be the main environmental factors that promoted changes in the diversity of soil bacteria. The formation of forest gaps increased solar radiation, which contributed to the soil bacteria diversity and network complexity [40,41]. If G50 was considered to be an initial stage of gap opening in L. principis-rupprechtii plantations, the bacterial Shannon and Chao1 indices should have been higher than closed forests due to the recent disturbance [42]. Soil bacterial richness increased and then decreased along with the gap area, and the lowest richness was found in the G0 group. This was probably due to decreased light and soil nutrient input under the closed forests. The reduction in light and soil nutrients leads to a reduction in complex kinds of bacterial substrates, which is detrimental to the composition and metabolism of microorganisms [2,22,23,43,44,45]. The maximum values of the Shannon, observed species richness, Chao1, and Faith pd indices were obtained in the G100 group, indicating that soil bacteria in the G100 group had the highest overall diversity and richness.
Gap size and soil nutrients, including SW, PHO, and AP, were significantly correlated with the complexity of soil bacterial community, with both having opposite effects. However, higher bacterial diversity and network complexity were observed in the G250 group, which possessed the higher abundance of bacterial phyla, mainly including Proteobacteria and Actinobacteria. However, such a bacterial community is monolithic. The relative abundance of other major phyla, including Acidobacteria, Chloroflexi, Rokubacteria, and Gemmatimonadetes, decreased significantly in the G250 group, resulting in a decrease in the richness of bacterial communities and a consequent decrease in the potential competition among them. In addition, as the most significant factor affecting the soil bacteria complexity, soil AP was the lowest in the G250 gap size gradient. This is consistent with the minimum number of network modules in the G250 group for our study and may also be related to the decrease in vegetation regeneration. Thus, the G250 gap size gradient represents a considerable disturbance or long-term blanket phenotype in L. principis-rupprechtii plantations in northern China. The soil microbiota may have reached a steady state due to the redistribution of light intensity and other biotic and abiotic factors [4,6,46,47]. In contrast, the G70 and G100 groups were in a state of substantial disequilibrium due to suitable light intensity, moisture and temperature, and soil nutrient content, which imported more substrate for soil bacteria and provided continuous succession and competitive exclusion among soil microorganisms [20,48,49,50]. We suggest that changes in bacterial composition under forest gaps are also related, to some extent, to vegetation regeneration.
However, the soil nutrients, including AN, PHO, and INV, that were highly positively related to gap size also had negative impacts on bacteria complexity in our study. Soil nitrogen can drive the diversity of bacterial communities through intentional specific selection for copiotroph or oligotrophic bacteria [11,16,17]. Alternatively, the high levels of soil nitrogen can acidify the soil and consequently decrease the soil bacteria richness and potential competition among soil bacterial communities, thus, increasing system stability and limiting the growth of soil microorganisms to resist unfavorable environmental conditions [51,52,53,54,55]. Soil enzymes play a crucial role in the nutrient cycling of forest soils and are closely related to soil microbial metabolism and soil function [10]. The RDA result in our study demonstrated that the activity of PHO—an important extracellular enzyme—and INV were significantly positively correlated with the gap size and complexity of soil bacterial communities and negatively related to the number of network modules and modularity degree for soil bacteria. In addition, an increase in the activity of PHO and INV significantly improved soil soluble nitrogen levels and soil moisture. The above would be beneficial to the mineralization of both N and P, which in turn, further catalyze the hydrolysis of orthophosphate from organic molecules and plant absorption [56,57]. Bacterial growth is dependent on nutrient availability. Increased bacterial abundance increases nutrient consumption, and the release of ions from decomposition increases EC in the soil [58]. Therefore, the highest SW, EC, AN, PHO, and INV contents in the G250 group instead reduced the community complexity.

4.3. Effects of Regeneration in L. principis-rupprechtii Plantations on the Soil Bacterial Communities under Forest Gaps

Forest gaps play an essential role in tree growth and promote tree regeneration at a certain size level [2,3]. Tree regeneration is an important indicator when studying the sustainability of forest development, which could affect the bacteria living in the soil [5]; therefore, it is very important to understand how soil bacteria composition and network structure are shaped by tree regeneration in L. principis-rupprechtii plantations. Our study showed that regeneration density under forest gaps positively affects the composition and network complexity of soil bacterial communities. Further, the effect of regeneration density on bacterial network complexity was more significant than the bacteria composition. The natural regeneration density under forest gaps was the most significantly positive factor influencing the complexity of the soil bacterial community co-occurrence network, followed by soil nutrients, which verified our third hypothesis. This is attributed to vegetation regeneration promoting resource input and providing additional substrate for bacteria in soil [34], which led to an increase in bacterial community diversity and a more complex community structure. Tree regeneration in L. principis-rupprechtii plantations had a positive effect on the presence of the dominant microbial phyla, except for Actinobacteria. According to our results, tree regeneration density was greatest under the G50, G70, and G100 forest gap size classes compared to the others, including the G0, G125, G150, and G250 groups. Meanwhile, the bacteria richness and N/P cohesion were higher under the G50, G70, and G100 forest gap size classes than the G0, G125, and G150 groups. The micro-environments of the G50, G70, and G100 forest gap size classes provided more substrate for soil bacteria to compete for resources, which in turn, promoted tree regeneration [32,59].

5. Conclusions

In this study, the gap-related microenvironments (including gap size, canopy openness, relative light intensity, and soil phosphatase activity) were highest in the G250 gap size gradient, followed by the G100 and G125 classes, and lowest in G0 (closed forests). The tree regeneration density in the G50 gradient was the highest, followed by G70, G100, and the lowest in G250. The dominant bacterial phyla in the soil were the Proteobacteria, Actinobacteria, Acidobacteria, and Chloroflexi. Forest gaps govern the composition and co-occurrence network structure of soil bacterial communities by regulating the gap-related microenvironment, including light properties and soil physicochemical characteristics. Meanwhile, the regeneration density under forest gaps positively affects the composition and network complexity of soil bacterial communities. The soil physical–chemical properties and bacteria diversity in G0 and G150 gap size classes were relatively low, and thus, influenced its soil function, leading to lower tree regeneration in the G150 groups. G250 may require increased canopy coverage to promote soil quality and bacteria diversity and complexity.

Supplementary Materials

The following supporting information can be downloaded at: https://www.mdpi.com/article/10.3390/agronomy13010038/s1, Figure S1: Rarefaction curves of ASVs. (A–E) Rarefaction curves at Good’s coverage, Shannon, observed species richness, Chao1 and Faith PD indicis level, respectively; Figure S2: The Venn diagram of ASVs at different gap size levels; Table S1: Analysis of similarities (ANOSIM) and permutational multivariate analysis of variance (PERMANOVA) based on weighted UniFrac distance at different gap size levels; Table S2: Topological characteristics of co-occurrence networks of soil bacteria community in forest gaps and closed forests; Table S3: Percent variance explained of the composition of soil bacterial community by each gap-related microenvironmental factor; Table S4: Percent variance explained of the diversity and network structure of soil bacterial community by each gap-related microenvironmental factor; Table S5: The SEM’s fitting parameters of forest gaps and closed forests for L. principis-rupprechtii Mayr plantations after modification.

Author Contributions

Y.N. and W.L. conceived and designed the experimental procedures; Y.N., W.L. and X.W. conducted the experiments; Y.N. wrote the original manuscript; Y.N., W.L. and Y.H. revised the manuscript. All authors have read and agreed to the published version of the manuscript.

Funding

The National Key R & D Program of China (2022YFF1300401); National Natural Science Youth Foundation of China (31971725, 31971644); National Natural Science Youth Foundation of China (31901365); Science and Technology Innovation Project of Shanxi Higher Education Institution (2021L105); Science and Technology Innovation Project of Shanxi University (2021L105); Science and Technology Innovation Fund Grant of Shanxi Agricultural University (2018YJ09); Scientific Research Start-up Project for Introducing Talents to Shanxi Agricultural University (2014YJ19). This research received no external funding.

Data Availability Statement

The data and results are available to every reader upon reasonable request.

Acknowledgments

We thank all the co-workers from Shanxi Agricultural University for the assistance during field samplings, as well as the anonymous reviewers and editors for their valuable comments and revisions to improve the manuscript.

Conflicts of Interest

The authors declare no conflict of interest.

References

  1. Muscolo, A.; Bagnato, S.; Sidari, M.; Mercurio, R. A review of the roles of forest canopy gaps. J. For. Res. 2014, 25, 725–736. [Google Scholar] [CrossRef]
  2. Lu, D.; Zhu, J.; Wang, X.; Hao, G.; Wang, G.G. A systematic evaluation of gap size and within-gap position effects on seedling regeneration in a temperate secondary forest, Northeast China. For. Ecol. Manag. 2021, 490, 119140. [Google Scholar] [CrossRef]
  3. Muscolo, A.; Sidari, M.; Mercurio, R. Influence of gap size on organic matter decomposition, microbial biomass and nutrient cycle in Calabrian pine (Pinus laricio, Poiret) stands. For. Ecol. Manag. 2007, 242, 412–418. [Google Scholar] [CrossRef]
  4. Wang, X.; Liu, J.; He, Z.; Xing, C.; Zhu, J.; Gu, X.; Lan, Y.; Wu, Z.; Liao, P.; Zhu, D. Forest gaps mediate the structure and function of the soil microbial community in a Castanopsis kawakamii forest. Ecol. Indic. 2021, 122, 107288. [Google Scholar] [CrossRef]
  5. Li, D.; Li, X.; Su, Y.; Li, X.; Yin, H.; Li, X.; Guo, M.; He, Y. Forest gaps influence fungal community assembly in a weeping cypress forest. Appl. Microbiol. Biotechnol. 2019, 103, 3215–3224. [Google Scholar] [CrossRef] [PubMed]
  6. Han, M.; Tang, M.; Shi, B.; Jin, G. Effect of canopy gap size on soil respiration in a mixed broadleaved-Korean pine forest: Evidence from biotic and abiotic factors. Eur. J. Soil Biol. 2020, 99, 103194. [Google Scholar] [CrossRef]
  7. Dupuy, J.M.; Chazdon, R. Interacting effects of canopy gap, understory vegetation and leaf litter on tree seedling recruitment and composition in tropical secondary forests. For. Ecol. Manag. 2008, 255, 3716–3725. [Google Scholar] [CrossRef]
  8. Schliemann, S.A.; Bockheim, J.G. Influence of gap size on carbon and nitrogen biogeochemical cycling in Northern hardwood forests of the Upper Peninsula, Michigan. Plant Soil 2014, 377, 323–335. [Google Scholar] [CrossRef]
  9. Yang, Y.; Geng, Y.; Zhou, H.; Zhao, G.; Wang, L. Effects of gaps in the forest canopy on soil microbial communities and enzyme activity in a Chinese pine forest. Pedobiologia 2017, 61, 51–60. [Google Scholar] [CrossRef]
  10. Xu, Z.; Yu, G.; Zhang, X.; He, N.; Wang, Q.; Wang, S.; Wang, R.; Zhao, N.; Jia, Y.; Wang, C. Soil enzyme activity and stoichiometry in forest ecosystems along the North-South Transect in eastern China (NSTEC). Soil Biol. Biochem. 2017, 104, 152–163. [Google Scholar] [CrossRef]
  11. Yu, X.; Yang, L.; Fei, S.; Ma, Z.; Hao, R.; Zhao, Z. Effect of Soil Layer and Plant–Soil Interaction on Soil Microbial Diversity and Function after Canopy Gap Disturbance. Forests 2018, 9, 680. [Google Scholar] [CrossRef] [Green Version]
  12. Julie, S.D. Supplement: Tropical Succession || Gap Partitioning among Tropical Rainforest Trees. Biotropica 1980, 12, 47–55. [Google Scholar] [CrossRef]
  13. Brokaw, N.; Busing, R.T. Niche versus chance and tree diversity in forest gaps. Trends Ecol. Evol. 2000, 15, 183–188. [Google Scholar] [CrossRef] [PubMed]
  14. McClure, J.W.; Lee, T.D.; Leak, W.B. Gap capture in northern hardwoods: Patterns of establishment and height growth in four species. For. Ecol. Manag. 2000, 127, 181–189. [Google Scholar] [CrossRef]
  15. Webster, C.R.; Lorimer, C.G. Minimum opening sizes for canopy recruitment of mid-tolerant tree species: A retrospective approach. Ecol. Appl. 2005, 15, 1245–1262. [Google Scholar] [CrossRef]
  16. Stavridou, E.; Webster, R.J.; Robson, P.R.H. Novel Miscanthus genotypes selected for different drought tolerance phenotypes show enhanced tolerance across combinations of salinity and drought treatments. Ann. Bot. 2019, 124, 653–674. [Google Scholar] [CrossRef]
  17. Li, S.; Wu, F. Diversity and Co-occurrence Patterns of Soil Bacterial and Fungal Communities in Seven Intercropping Systems. Front. Microbiol. 2018, 9, 1521. [Google Scholar] [CrossRef]
  18. Olsen, S.R.; Sommers, L.E. Phosphorus. In Methods of Soil Analysis: Part 2 Chemical and Microbiological Properties; Page, A.L., Ed.; Soil Science Society of America Inc.: Madison, WI, USA, 1982; pp. 403–430. [Google Scholar]
  19. Shi, Y.; Li, Y.; Xiang, X.; Sun, R.; Yang, T.; He, D.; Zhang, K.; Ni, Y.; Zhu, Y.-G.; Adams, J.; et al. Spatial scale affects the relative role of stochasticity versus determinism in soil bacterial communities in wheat fields across the North China Plain. Microbiome 2018, 6, 27. [Google Scholar] [CrossRef] [Green Version]
  20. Gianello, C.; Bremner, J.M. Comparison of chemical methods of assessing potentially available organic nitrogen in soil. Commun. Soil Sci. Plant Anal. 1986, 17, 215–236. [Google Scholar] [CrossRef]
  21. Guan, Y.S. Soil Enzyme and Its Study Method; China Agriculture Press: Beijing, China, 1986; pp. 274–320. (In Chinese) [Google Scholar]
  22. Zhou, L.K. Soil Enzymology; Science Press: Beijing, China, 1987. [Google Scholar]
  23. Bolyen, E.; Rideout, J.R.; Dillon, M.R.; Bokulich, N.A.; Abnet, C.C.; Al-Ghalith, G.A.; Alexander, H.; Alm, E.J.; Arumugam, M.; Asnicar, F.; et al. Reproducible, Interactive, Scalable and Extensible Microbiome Data Science using QIIME 2. Nat. Biotechnol. 2019, 37, 852–857. [Google Scholar] [CrossRef]
  24. Martin, M. Cutadapt removes adapter sequences from high-throughput sequencing reads. EMBnet. J. 2011, 17, 10–12. [Google Scholar] [CrossRef]
  25. Callahan, B.J.; Mcmurdie, P.J.; Rosen, M.J.; Han, A.W.; Johnson, A.J.A.; Holmes, S.P. DADA2: High-resolution sample inference from Illumina amplicon data. Nat. Methods 2016, 13, 581–583. [Google Scholar] [CrossRef] [PubMed] [Green Version]
  26. Kazutaka, K.; Misakwa, K.; Kei-ichi, K.; Miyata, T. MAFFT: A novel method for rapid multiple sequence alignment based on fast Fourier transform. Nucleic Acids Res. 2002, 30, 3059–3066. [Google Scholar] [CrossRef] [Green Version]
  27. Price, M.N.; Dehal, P.S.; Arkin, A.P. FastTree: Computing Large Minimum Evolution Trees with Profiles instead of a Distance Matrix. Mol. Biol. Evol. 2009, 26, 1641–1650. [Google Scholar] [CrossRef]
  28. Ma, J.; Lu, Y.; Chen, F.; Li, X.; Xiao, D.; Wang, H. Molecular Ecological Network Complexity Drives Stand Resilience of Soil Bacteria to Mining Disturbances among Typical Damaged Ecosystems in China. Microorganisms 2020, 8, 433. [Google Scholar] [CrossRef] [PubMed] [Green Version]
  29. Hernandez, D.J.; David, A.S.; Menges, E.S.; Searcy, C.A.; Afkhami, M.E. Environmental stress destabilizes microbial networks. ISME J. 2021, 15, 1722–1734. [Google Scholar] [CrossRef]
  30. Herren, C.M.; McMahon, K.D. Cohesion: A method for quantifying the connectivity of microbial communities. ISME J. 2017, 11, 2426–2438. [Google Scholar] [CrossRef] [Green Version]
  31. Zhang, S.; Kong, J.; Chen, L.; Guo, K.; Zhou, X. Increased Tea Saponin Content Influences the Diversity and Function of Plantation Soil Microbiomes. Microbiol. Spectr. 2022, 10, e02324-21. [Google Scholar] [CrossRef]
  32. Upton, R.N.; Sielaff, A.C.; Hofmockel, K.S.; Xu, X.; Polley, H.W.; Wilsey, B.J. Soil depth and grassland origin cooperatively shape microbial community co-occurrence and function. Ecosphere 2020, 11, e02973. [Google Scholar] [CrossRef] [Green Version]
  33. Yuan, M.M.; Guo, X.; Wu, L.; Zhang, Y.; Xiao, N.; Ning, D.; Shi, Z.; Zhou, X.; Wu, L.; Yang, Y.; et al. Climate warming enhances microbial network complexity and stability. Nat. Clim. Chang. 2021, 11, 343–348. [Google Scholar] [CrossRef]
  34. Fahey, C.; Koyama, A.; Antunes, P.M.; Dunfield, K.; Flory, S.L. Plant communities mediate the interactive effects of invasion and drought on soil microbial communities. ISME J. 2020, 14, 1396–1409. [Google Scholar] [CrossRef] [PubMed]
  35. Zhou, J.P.; Wang, S.L. Coupling relationship of structure and tree diversity between upper and lower canopy layer based on structural equation model. J. Beijing For. Univ. 2015, 37, 9–16. [Google Scholar] [CrossRef]
  36. Muscolo, A.; Sidari, M.; Bagnato, S.; Mallamaci, C.; Mercurio, R. Gap size effects on above- and below-ground processes in a silver fir stand. Eur. J. For. Res. 2009, 129, 355–365. [Google Scholar] [CrossRef]
  37. Lu, X.; Xu, N.; Chen, Y.; Li, Y.; Gan, X. Effects of Light Intensity and Ground Cover on Seedling Regeneration of Tetracentron sinense Oliv. J. Plant Growth Regul. 2020, 40, 736–748. [Google Scholar] [CrossRef]
  38. Abebe, A. Effect of soil factors on net N-mineralization and decomposition rate of organic nutrient sources. J. Soil Sci. Environ. Manag. 2018, 9, 59–67. [Google Scholar] [CrossRef] [Green Version]
  39. Hartman, W.H.; Richardson, C.J.; Vilgalys, R.; Bruland, G.L. Environmental and anthropogenic controls over bacterial communities in wetland soils. Proc. Natl. Acad. Sci. USA 2008, 105, 17842–17847. [Google Scholar] [CrossRef] [Green Version]
  40. Kuramae, E.E.; Yergeau, E.; Wong, L.C.; Pijl, A.S.; Van Veen, J.A.; Kowalchuk, G.A. Soil characteristics more strongly influence soil bacterial communities than land-use type. FEMS Microbiol. Ecol. 2011, 79, 12–24. [Google Scholar] [CrossRef] [Green Version]
  41. Ugarelli, K.; Laas, P.; Stingl, U. The Microbial Communities of Leaves and Roots Associated with Turtle Grass (Thalassia testudinum) and Manatee Grass (Syringodium filliforme) are Distinct from Seawater and Sediment Communities, but Are Similar between Species and Sampling Sites. Microorganisms 2018, 7, 4. [Google Scholar] [CrossRef] [Green Version]
  42. Zhang, X.; Johnston, E.R.; Barberán, A.; Ren, Y.; Wang, Z.; Han, X. Effect of intermediate disturbance on soil microbial functional diversity depends on the amount of effective resources. Environ. Microbiol. 2018, 20, 3862–3875. [Google Scholar] [CrossRef]
  43. Piwosz, K.; Vrdoljak, A.; Frenken, T.; González-Olalla, J.M.; Šantić, D.; McKay, R.M.; Spilling, K.; Guttman, L.; Znachor, P.; Mujakić, I.; et al. Light and Primary Production Shape Bacterial Activity and Community Composition of Aerobic Anoxygenic Phototrophic Bacteria in a Microcosm Experiment. mSphere 2020, 5, e00354-20. [Google Scholar] [CrossRef]
  44. Ali, R.S.; Poll, C.; Kandeler, E. Dynamics of soil respiration and microbial communities: Interactive controls of temperature and substrate quality. Soil Biol. Biochem. 2018, 127, 60–70. [Google Scholar] [CrossRef]
  45. Latif, Z.A.; Blackburn, G.A. The effects of gap size on some microclimate variables during late summer and autumn in a temperate broadleaved deciduous forest. Int. J. Biometeorol. 2009, 54, 119–129. [Google Scholar] [CrossRef] [PubMed]
  46. O’Brien, S.L.; Gibbons, S.; Owens, S.M.; Hampton-Marcell, J.; Johnston, E.; Jastrow, J.; Gilbert, J.A.; Meyer, F.; Antonopoulos, D.A. Spatial scale drives patterns in soil bacterial diversity. Environ. Microbiol. 2016, 18, 2039–2051. [Google Scholar] [CrossRef] [PubMed] [Green Version]
  47. Xu, J.; Xue, L.; Su, Z. Impacts of Forest Gaps on Soil Properties after a Severe Ice Storm in a Cunninghamia lanceolata Stand. Pedosphere 2016, 26, 408–416. [Google Scholar] [CrossRef]
  48. Eichorst, S.A.; Trojan, D.; Roux, S.; Herbold, C.; Rattei, T.; Woebken, D. Genomic insights into the Acidobacteria reveal strategies for their success in terrestrial environments. Environ. Microbiol. 2018, 20, 1041–1063. [Google Scholar] [CrossRef] [Green Version]
  49. Yuste, J.C.; Barba, J.; Fernandez-Gonzalez, A.J.; Fernandez-Lopez, M.; Mattana, S.; Martinez-Vilalta, J.; Nolis, P.; Lloret, F. Changes in soil bacterial community triggered by drought-induced gap succession preceded changes in soil C stocks and quality. Ecol. Evol. 2012, 2, 3016–3031. [Google Scholar] [CrossRef] [Green Version]
  50. Banerjee, S.; Walder, F.; Büchi, L.; Meyer, M.; Held, A.Y.; Gattinger, A.; Keller, T.; Charles, R.; van der Heijden, M.G.A. Agricultural intensification reduces microbial network complexity and the abundance of keystone taxa in roots. ISME J. 2019, 13, 1722–1736. [Google Scholar] [CrossRef] [Green Version]
  51. Guo, J.H.; Liu, X.J.; Zhang, Y.; Shen, J.L.; Han, W.X.; Zhang, W.F.; Christie, P.; Goulding, K.W.T.; Vitousek, P.M.; Zhang, F.S. Significant Acidification in Major Chinese Croplands. Science 2010, 327, 1008–1010. [Google Scholar] [CrossRef] [Green Version]
  52. Ullah, S.; He, P.; Ai, C.; Zhao, S.; Ding, W.; Song, D.; Zhang, J.; Huang, S.; Abbas, T.; Zhou, W. How Do Soil Bacterial Diversity and Community Composition Respond under Recommended and Conventional Nitrogen Fertilization Regimes? Microorganisms 2020, 8, 1193. [Google Scholar] [CrossRef]
  53. Zhao, H.; Li, X.; Zhang, Z.; Yang, J.; Zhao, Y.; Yang, Z.; Hu, Q. Effects of natural vegetative restoration on soil fungal and bacterial communities in bare patches of the southern Taihang Mountains. Ecol. Evol. 2019, 9, 10432–10441. [Google Scholar] [CrossRef]
  54. Ramirez, K.S.; Craine, J.M.; Fierer, N. Consistent effects of nitrogen amendments on soil microbial communities and processes across biomes. Glob. Chang. Biol. 2012, 18, 1918–1927. [Google Scholar] [CrossRef]
  55. Ling, N.; Chen, D.; Guo, H.; Wei, J.; Bai, Y.; Shen, Q.; Hu, S. Differential responses of soil bacterial communities to long-term N and P inputs in a semi-arid steppe. Geoderma 2017, 292, 25–33. [Google Scholar] [CrossRef]
  56. Turner, B.L.; Engelbrecht, B.M.J. Soil organic phosphorus in lowland tropical rain forests. Biogeochemistry 2010, 103, 297–315. [Google Scholar] [CrossRef]
  57. Jankowiak, J.G.; Gobler, C.J. The Composition and Function of Microbiomes Within Microcystis Colonies Are Significantly Different Than Native Bacterial Assemblages in Two North American Lakes. Front. Microbiol. 2020, 11, 1016. [Google Scholar] [CrossRef]
  58. Dahroug, Z.; Santana, N.F.; Pagioro, T.A. Eichhornia azurea decomposition and the bacterial dynamic: An experimental research. Braz. J. Microbiol. 2016, 47, 279–286. [Google Scholar] [CrossRef] [Green Version]
  59. Ji, L.; Shen, F.; Liu, Y.; Yang, Y.; Wang, J.; Purahong, W.; Yang, L. Contrasting altitudinal patterns and co-occurrence networks of soil bacterial and fungal communities along soil depths in the cold-temperate montane forests of China. Catena 2021, 209, 105844. [Google Scholar] [CrossRef]
Figure 1. Sketch of regeneration individual plot distribution within a large, expanded forest gap. Agronomy 13 00038 i001: Gap border trees Agronomy 13 00038 i002: Regeneration individual in L. principis-rupprechtii plantations Agronomy 13 00038 i003: Acquisition points for hemispherical photographs. Abbreviations: A, expanded gap: crown projection of border trees. B, canopy gap: vertical projection of the canopy opening. C = center point of the gap; N = northern transition; E = eastern transition; S = southern transition; W = western transition; NE = northeast; SE = southeast; NW = northwest; SW = southwest.
Agronomy 13 00038 g001
Figure 2. Phylum distribution of soil bacteria in different-sized forest gaps.
Agronomy 13 00038 g002
Figure 3. Diversity of soil bacteria between different forest gap sizes. (a) Alpha diversity of soil bacteria among different-sized forest gaps; (b) PCoA based on weighted UniFrac distance among different-sized forest gaps.
Agronomy 13 00038 g003
Figure 4. The co-occurrence networks of soil bacterial modularity in different-sized forest gaps.
Agronomy 13 00038 g004
Figure 5. (a) Constrained ordination analysis of bacterial community composition with gap-related microenvironmental factors; (b) constrained ordination analysis of bacterial community diversity, and network structure with gap-related microenvironmental factors. Notes: (a) the relationships between gap-related microenvironmental factors (red arrows) and dominant phyla (blue arrows); (b) the relationships between gap-related microenvironmental factors (red arrows) and alpha diversity indices and network topological characteristics indices (blue arrows). Note: AD, average degree; N/P cohesion, negative and positive connection proportions; No. modules, number of modules; Shan., Shannon index; Obs., number of observed species; ReD, regeneration density; ADBH, average diameter at breast height of regeneration individuals; ATH, average height of regeneration individuals.
Agronomy 13 00038 g005
Figure 6. A structural equation model was established to explore the significant effects of gap size; soil physicochemical index (SW, PHO, AP); light properties (RLA, CO, LAI); soil bacteria composition (first axis of principal coordinate analysis, Shannon, observed species richness, and Chao1 indices); network complexity (Modularity, AD, N/P cohesion); and tree regeneration (regeneration density). Significant codes “***” indicate the p value < 0.001, “*” indicates the p value < 0.05.
Agronomy 13 00038 g006
Table 1. Basic information of the L. principis-rupprechtii plantation along seven forest gap classes in the Luliang Mountains of China (n = 25).
Type of GapExpand Gap Size
(m2)
Altitude
(m)
Slope
(°)
Number of Gap Border TreesMean DBH of Border TreesMean Age of
Regenerated Individuals(a)
Number of Regenerated Individuals (Stems per Gap/Closed Forest)Regenerated Individual Density (Stems per ha)
G50 (50–70 m2)63.2 ± 7.7 a2053 ± 15.020–226 ± 1 a26.5 ± 7.93 ab4.6 ± 2.5 ab115 c18,367 d
G70 (70–100 m2)73.4 ± 3.2 ab2042 ± 11.020–239 ± 2 ab21.2 ± 10.24 a4.4 ± 2.5 a91 bc12,354 c
G100 (100–125 m2)115.7 ± 8.1 ab2066 ± 3.919–216 ± 1 a33.5 ± 1.83 b4.9 ± 3.4 ab164 d14,302 c
G125 (125–150 m2)137.7 ± 6.3 c2056 ± 18.519–2311 ± 2 c19.4 ± 6.79 a8.0 ± 0.5 c74 ab5405 b
G150 (150–250 m2)173.5 ± 21.6 d2061 ± 10.619–227 ± 2 a34.2 ± 2.3 b4.8 ± 1.9 ab77 b4009 ab
G250 (>250 m2)330.6 ± 29.6 e2066 ± 24.922–2610 ± 3 ab32.9 ± 3.9 b6.5 ± 0.3 c49 a1463 a
G0 (10 m × 10 m)-2032 ± 5.921–24--7.1 ± 1.0 c141 cd3533 ab
Notes: Only trees with a height ≥ 15 m and DBH ≥ 10 cm were counted as border trees. Only stems with a DBH ≤ 5 cm and age < 10 were counted as regenerated individuals. The slope aspect of all gaps was northwest. Different letters represent a significant difference at p < 0.05.
Table 2. Light properties of forest gaps and closed forests (Data are mean ± standard deviation (n = 25)).
GroupCO (%)Utot (W/m2)Udir (W/m2)Udif (W/m2)LAIRLA (%)
G022.45 ± 2.69 a3.19 ± 0.66 a2.9 ± 0.57 a6.1 ± 1.35 a2.30 ± 0.09 a19.68 ± 3.86 a
G5043.16 ± 2.32 b5.79 ± 0.57 b8.22 ± 0.49 b14.01 ± 1.17 bc1.01 ± 0.07 b47.98 ± 3.34 b
G7048.54 ± 2.33 bc7.41 ± 0.54 bc8.92 ± 0.48 bc16.34 ± 1.16 bcd0.79 ± 0.07 bc57.5 ± 3.3 bc
G10052.01 ± 2.69 c7.59 ± 0.57 bc9.64 ± 0.49 bc17.24 ± 1.17 cd0.71 ± 0.06 cd60.62 ± 3.1 c
G12551.55 ± 2.33 c8.01 ± 0.53 c10.13 ± 0.49 cd18.15 ± 1.16 d0.66 ± 0.09 cd63.49 ± 3.2 c
G15048.19 ± 2.69 bc6.68 ± 0.65 bc10.31 ± 0.57 cd13.27 ± 1.35 b0.81 ± 0.08 bc55.21 ± 3.86 bc
G25062.16 ± 2.69 d7.66 ± 0.68 bc11.56 ± 0.57 d19.21 ± 1.35 d0.47 ± 0.08 d74.36 ± 3.8 d
p value0.005 **0.02 *0.024 *0.037 *0.0780.026 *
Note: CO: canopy openness, Utot: total solar radiation under the canopy, Udir: direct solar radiation under the canopy, Udif: diffuse solar radiation under the canopy, LAI: leaf area index, RLA: relative light intensity. Different letters represent a significant difference at p < 0.05. Significant codes “**” indicate the p value < 0.01, “*” indicates the p value < 0.05.
Table 3. Soil physicochemical properties of forest gaps and closed forests (Data are mean ± standard deviation (n = 25)).
GroupSW (%)ST (°C)EC (mS/m)SOM (g/kg)AN (mg/kg)AP (mg/kg)AK (mg/kg)PHO (mg)URE (mg)INV (mg)
G013.95 ± 1.39 ab17.06 ± 0.98 a69.15 ± 4.76 ab18.66 ± 1.23 ab60.9 ± 11.63 a5.13 ± 0.38 a138.24 ± 36.65 ab29.59 ± 9.71 a151.41 ± 35.03 ab2.93 ± 0.74 a
G5013.78 ± 1.2 ab17.73 ± 0.85 a82.12 ± 4.12 bc19.89 ± 1.19 ab59.85 ± 10.07 a4.93 ± 0.33 a106.51 ± 31.74 a27.12 ± 8.41 a110.77 ± 32.94 ab2.36 ± 0.64 a
G7014.86 ± 1.3 ab17.41 ± 0.81 a76.29 ± 4.03 abc22.12 ± 1.03 bc60.55 ± 10.01 a5.09 ± 0.31 a138.36 ± 31.62 ab26.44 ± 8.44 a124.12 ± 29.65 ab2.96 ± 0.64 a
G10016.12 ± 1.22 bc17.24 ± 0.8 a75.31 ± 4.09 abc24.46 ± 1.16 c69.3 ± 9.06 a5.11 ± 0.33 a147.7 ± 31.74 ab34.11 ± 8.6 a151.26 ± 30.87 ab2.26 ± 0.63 a
G12512.47 ± 1.17 ab16.48 ± 0.86 a76.34 ± 4.23 abc20.66 ± 1.07 b76.65 ± 10.03 ab5.63 ± 0.34 a244.16 ± 30.28 b43.88 ± 9.03 a194.34 ± 38.22 b2.75 ± 0.52 a
G15011.66 ± 1.39 a17.18 ± 0.98 a66.5 ± 4.76 a16.47 ± 1.37 a85.87 ± 11.63 ab5.43 ± 0.39 a84.79 ± 26.65 a23.16 ± 9.7 a87.27 ± 28.42 a2.35 ± 0.73 a
G25018.55 ± 1.4 c18.9 ± 0.99 a84.47 ± 4.86 c18.12 ± 1.21 ab104.3 ± 11.51 b4.75 ± 0.41 a148.16 ± 36.65 ab71.28 ± 9.73 b133.72 ± 22.41 ab5.05 ± 0.74 b
p value0.002 **0.6950.1010.016 *0.0640.6610.037 *0.004 **0.2830.031 *
Note: SW: soil moisture content, ST: soil temperature, EC: electrical conductivity, SOM: soil organic matter, AN: available nitrogen, AP: available phosphorus, AK: available potassium, URE: soil urease activity, PHO: soil phosphatase activity, and INV: soil invertase activity. Different letters represent a significant difference at p < 0.05. Significant codes “**” indicate the p value < 0.01, “*” indicates the p value < 0.05.
Disclaimer/Publisher’s Note: The statements, opinions and data contained in all publications are solely those of the individual author(s) and contributor(s) and not of MDPI and/or the editor(s). MDPI and/or the editor(s) disclaim responsibility for any injury to people or property resulting from any ideas, methods, instructions or products referred to in the content.