Article

Evaluation of Agricultural Water Resources Allocation Efficiency and Its Influencing Factors in the Yellow River Basin

1
Farmland Irrigation Research Institute, Chinese Academy of Agricultural Sciences, Xinxiang 453002, China
2
Center for Water Research, Advanced Institute of Natural Sciences, Beijing Normal University at Zhuhai, Zhuhai 519087, China
3
Key Laboratory of Water Cycle and Related Land Surface Processes, Institute of Geographic Sciences and Natural Resources Research, Chinese Academy of Sciences, Beijing 100101, China
4
Guangdong Research Institute of Water Resources and Hydropower, Guangzhou 510610, China
*
Authors to whom correspondence should be addressed.
Agronomy 2023, 13(10), 2449; https://doi.org/10.3390/agronomy13102449
Submission received: 2 August 2023 / Revised: 12 September 2023 / Accepted: 21 September 2023 / Published: 22 September 2023
(This article belongs to the Section Water Use and Irrigation)

Abstract

:
Improving the agricultural water resources allocation efficiency (AWRAE) and promoting the efficient and intensive utilization of agricultural water resources and high-quality development is an effective path to alleviate the water scarcity in one basin. In this study, the AWRAE and its influencing factors were measured and evaluated by constructing the evaluation system of the AWRAE in nine provinces (autonomous regions) of the Yellow River Basin, which consists of the super-efficiency slacks-based model (SBM), standard deviation ellipse (SDE), spatial autocorrelation analysis, Malmquist index and Tobit regression model. The results show that the value of AWRAE is 0.768 and it is at the medium level in the whole Yellow River Basin. The AWRAE values in the nine provinces (autonomous regions) ranking from large to small are Sichuan > Shaanxi > Ningxia > Henan > Inner Mongolia > Shanxi > Qinghai > Shandong > Gansu, and the AWRAE values show a significant increasing trend in Shanxi, Henan, Inner Mongolia and Shandong. The gravity center of the AWRAE keeps wandering along the provincial boundaries of Gansu and Shaanxi, which presents a counterclockwise rotation trend; the AWRAE of Shaanxi exhibits significant H-H aggregation in 2000, 2005, 2010, and 2015 (p < 0.05) while the agglomeration is not significant in 2020. The AWRAE has been continuously improved in which the technological progress change (Techch) and technical efficiency change (Effch) play an important positive role while the pure technical efficiency change (Pech) acts as the negative role in the Yellow River Basin. Moreover, the key influencing factors on the AWRAE in different provinces and autonomous regions are significantly different; for example, the total power of agricultural machinery (AMTP) has a significant positive effect on AWRAE in most provinces, but the annual average precipitation (AAP), agricultural water (AW), water saving irrigated area (WIA) and water saving irrigation machinery (WIM) have significant negative effects on the efficiency of AWRAE in Qinghai. The research results can provide quantitative support for agricultural water-saving and stable grain yield increase in the Yellow River Basin.

1. Introduction

Water is an important basic resource for the sustainable development of economic society and the ecological environment, and it is also the lifeblood of agricultural development. However, the water resources waste is very serious in some areas with the increasing agricultural water use proportion, and where the agricultural water use efficiency is poor [1]. Therefore, improving the efficiency of agricultural water resource utilization is not only one of the important ways to solve the problem of water resources shortage, but also a necessary prerequisite to ensure the sustainable development of water resources and food safety in river basins.
At present, there are many research methods on agricultural water utilization efficiency, such as the projection pursuit technology [2,3], stochastic frontier production function (SFA) [4,5] and data envelopment analysis (DEA) [6,7], etc. The DEA model is the most widely used method, and based on it, multiple methods like the DEA-BCC model [8], super-efficiency DEA model [9] and super-efficiency SBM model [10] are developed and are further combined with the Malmquist index and Tobit regression [11]. For example, relevant studies on the efficiency of agricultural water resources utilization using the above approaches have been carried out in different basins or regions, such as the Yangtze River basin [12], the Yellow River Basin [13], Tumen River Basin [14], Hubei [15], Gansu [16], Shaanxi [17], Shandong [18] and Jiangsu Province [19] in China. Although there are already many relatively comprehensive studies on the efficiency of agricultural water resources utilization, there are still some deficiencies: (1) the existing studies always focus on the use efficiency of agricultural water resources in fixed areas, but they ignore the similarities and differences between different regions; (2) the traditional DEA model is often used, and the unexpected output in the input process is often omitted, thus affecting the accuracy of efficiency. In addition, a large number of studies only consider a single static analysis of data envelope, with a lack of consideration of the reflection of its dynamic differentiation characteristics.
As for the efficiency of agricultural water resources utilization, they are influenced by multiple factors. For instance, relevant scholars have shown that the water use efficiency in China is greatly affected by the economic development level and technical level, and their relationship is non-linear [20]; the water resource endowment and education level of rural labor forces have positive effects on the total factor productivity of agricultural water resources, while water conservancy facilities and agricultural planting structure have negative effect in the Yellow River Basin [21]; the crop planting structure reduces the Chinese agricultural water resources environmental efficiency and the influence of water-saving technology factors is slight, but the open degree to the outside world and environmental regulations have significantly positive impacts [22]; the agricultural economic level, water-saving agricultural level and the proportion of animal husbandry and fishery in the total agricultural output value of Hebei Province play positive roles in promoting the efficiency of agricultural water resources utilization, while the water resources endowment, mechanization degree and the ratio of grain and vegetable planted areas in water resources structure hinder the improvement of the agricultural water use efficiency, in which the crop planting structure and water resources structure play a main guiding role [9]. Wang et al. (2019) showed that the proportion of high school education or above, the per capita disposable income of rural households, the sown area of crops, the number of water-saving machinery and the total storage capacity of reservoirs, electric motors and diesel engines are also related to the efficiency of agricultural water resources utilization [23]. Hao et al. (2022) showed that the factors affecting the growth of agricultural water resources utilization efficiency are quite different between the Yangtze River basin and the Yellow River basin, and the reasons are closely associated with the natural geographical environment and the level of economic development [1].
In addition, the agricultural water resources optimal allocation is an important aspect of the water resources rational allocation and is also an effective regulation measure for the sustainable utilization of water resources. Therefore, the agricultural water resources rational allocation and improvement of the AWRAE are of great practical significance to alleviate the contradiction between the supply and demand of water resources in river basins and the agricultural water pressure [24]. Relevant studies have shown that the water and soil resources allocation efficiency are greatly driven by the regional economic development level and government behavior [25], the adjustment of grain planting structure [26,27], the change in cultivated land structure, and the actual water requirement of cultivated land utilization under climate change, agricultural irrigation conditions and other factors [28]. Kuang et al., measured the comprehensive allocation efficiency of land and water resource allocation for grain production using the DEA model based on the panel data of thirty provinces in China from 2005 to 2020, and explored the impact of agricultural land transfer on land and water resource allocation [29].
On the whole, the evaluation of water resource efficiency mainly focuses on water resource utilization efficiency and the matching efficiency of soil and water resources, and there are few input indicators and relatively single output indicators in the selection of input and output indicators, which are rarely involved in the evaluation of AWRAE in river basins. In this study, to evaluate the AWRAE of the Yellow River Basin, the appropriate input and output indicators of AWRAE were selected based on the collection of relevant data and data sorting, and then the evaluation system of the AWRAE was constructed. The main objectives of this study is (1) to evaluate the AWRAE using the super-efficiency slacks-based model (SBM) in the Yellow River Basin; (2) to investigate the spatial distribution and evolution characteristics of the AWRAE by using the SDE and spatial autocorrelation analysis; (3) to analyze the evolution path and trend of the AWRAE by combining the Malmquist index method; and (4) to identify the main affecting factors of the AWRAE through the Tobit regression model in the Yellow River Basin. The research results could provide quantitative support for saving agricultural water and stably increasing grain yield in the Yellow River basin.

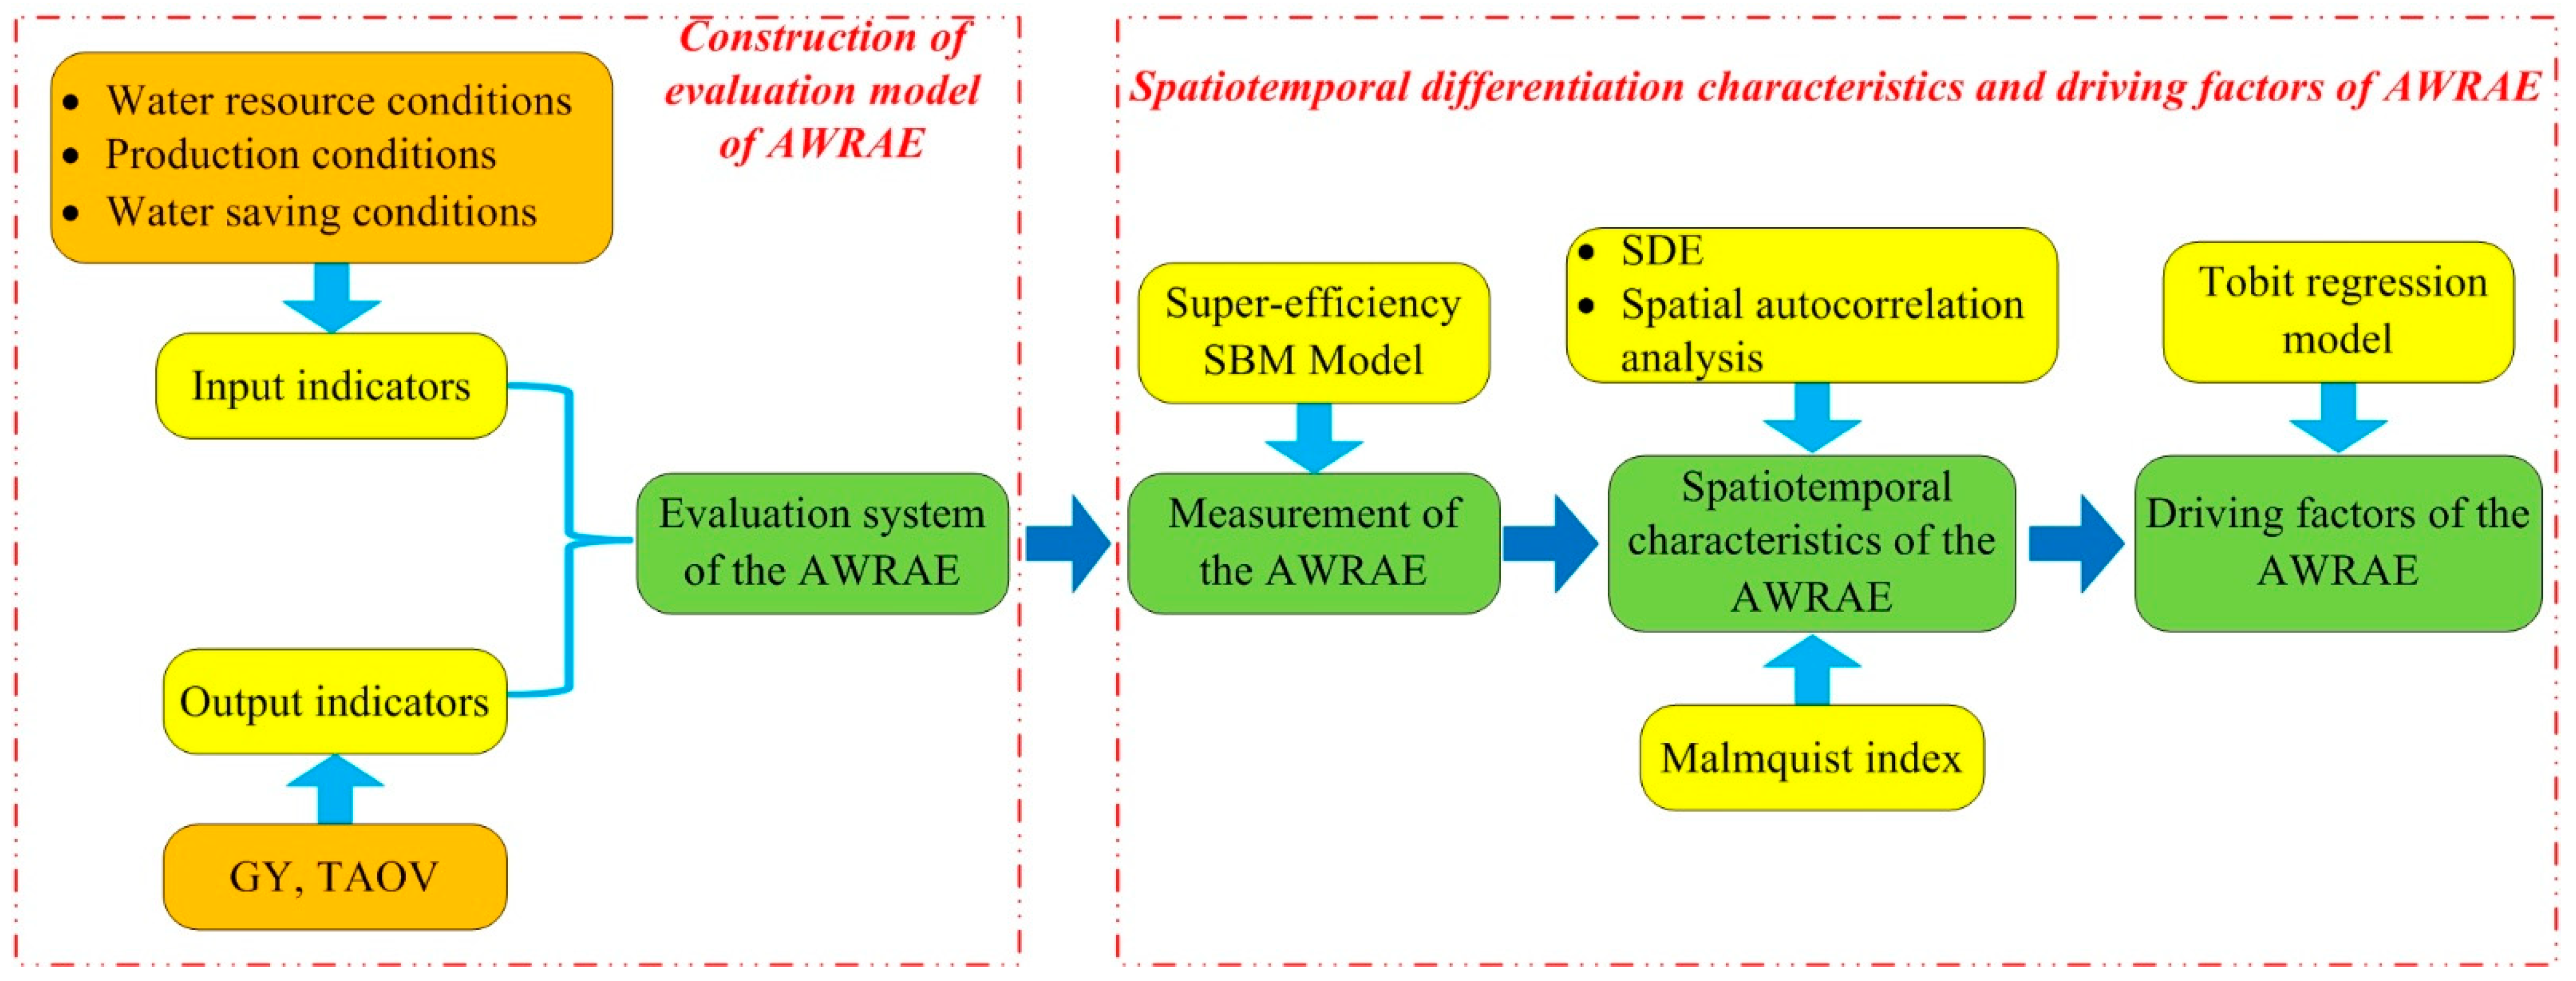
2. Materials and Methods
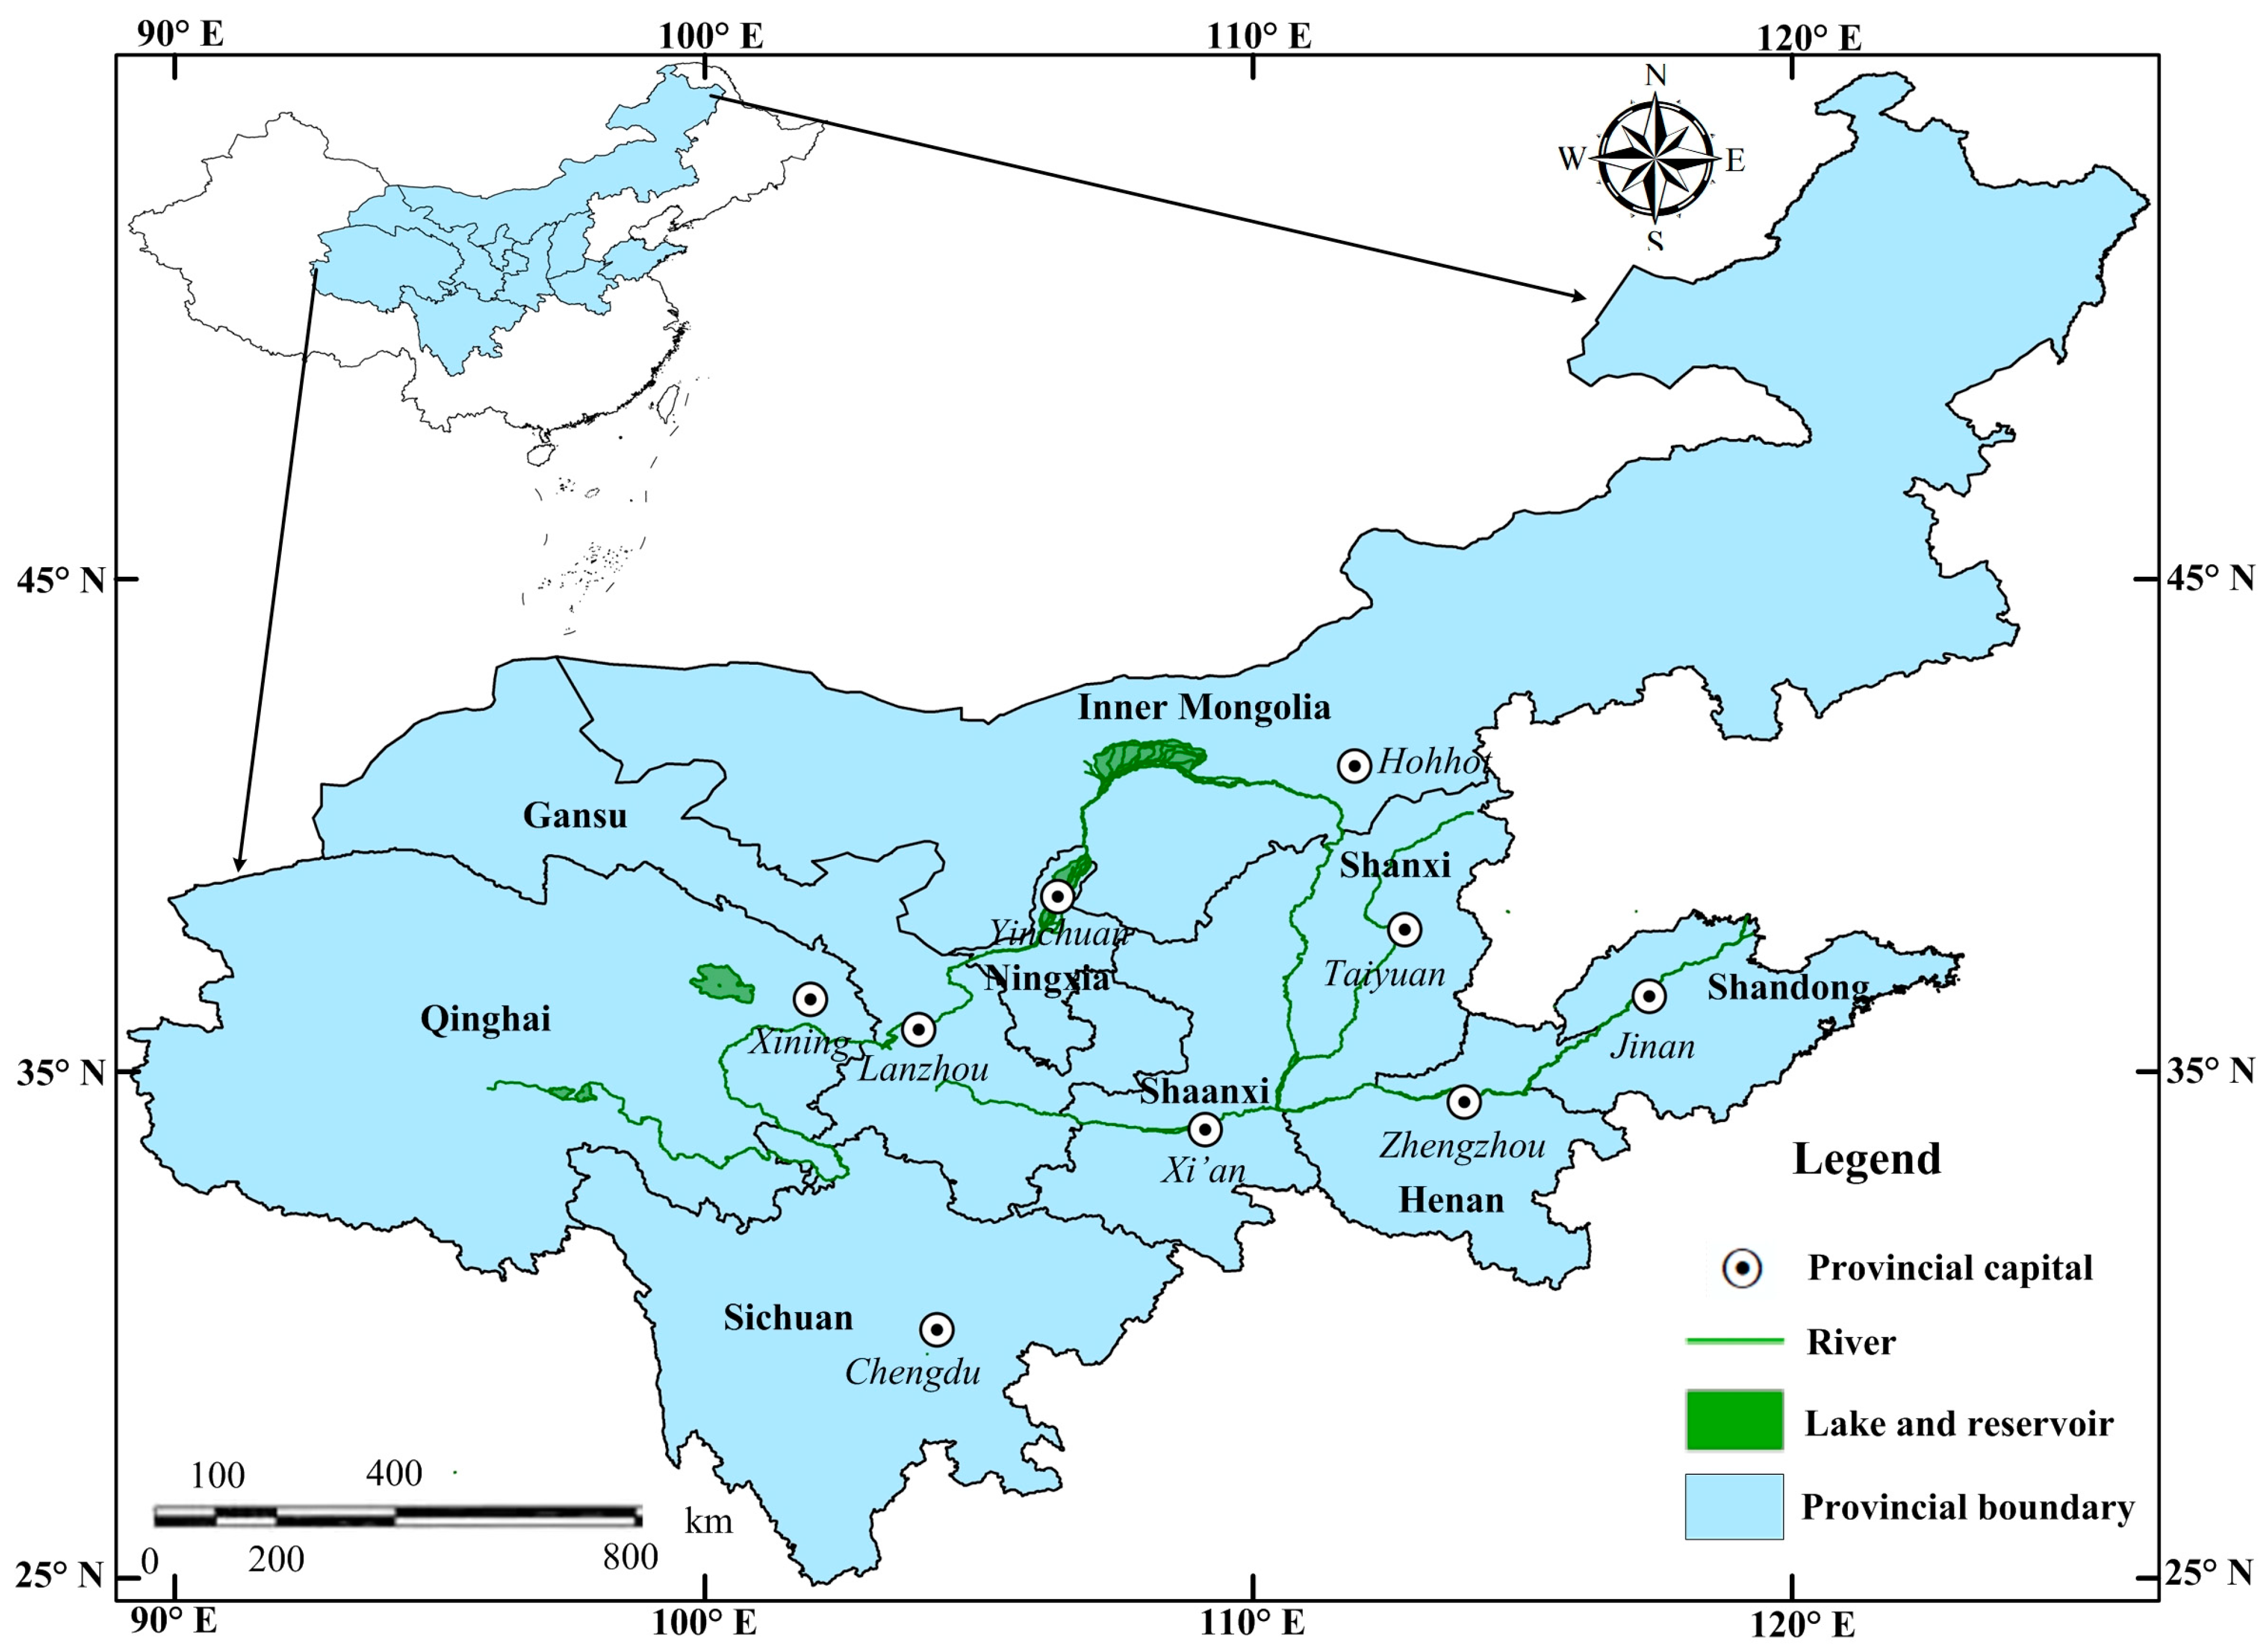
2.1. Study Area

The Yellow River Basin is an important ecological protection barrier and economic development link in China with its vast area, rich resources and dense population; it is between 32–42° N and 96–119° E, flowing from west to east through nine provinces (autonomous regions), including Qinghai, Sichuan, Gansu, Ningxia, Inner Mongolia, Shanxi, Shaanxi, Henan and Shandong (Figure 1). This basin has a drainage area of 7.95 × 10⁵ km2, with multi-year average temperature being 8–14 °C and average annual precipitation being 464 mm. The spatial distribution of precipitation shows an overall feature of “more in the south and less in the north, and more in the east and less in the west”, and its temporal distribution is extremely uneven with the precipitation from June to September accounting for 45% to 60% of the whole year [30]. In 2021, the agricultural water consumption was 24.647 billion m3, accounting for 62.35% of the total water consumption in the Yellow River Basin. Most regions belong to the arid/semi-arid regions and the agricultural production is strictly constrained by the water resources, in order to ensure food security; therefore, it is urgent to optimize the allocation of water resources in the whole basin and improve the effective utilization rate of soil and water resources in the Yellow River Basin. As these nine provinces (autonomous regions) have great differences in resource and environment endowment and economic development level, they are faced with the problems of sharp contradiction between supply and demand of water resources, water quality serious deterioration, prominent ecological environment problems, and low AWRAE [1]. Therefore, improving the AWRAE of the nine provinces (autonomous regions) is an important means to guarantee high-quality development in the Yellow River Basin.

2.2. Data Description

In this study, the evaluation system of the AWRAE includes the input and output indicators. The input indicators mainly include water resource conditions, production conditions and water saving conditions, among which, the water resource conditions mainly include annual average precipitation and agricultural water; the production conditions mainly include consumption of chemical fertilizer by 100% effective component, the consumption of chemical pesticides, total power of agricultural machinery, plastic film use for agricultural, total sown area of grain crops and persons engaged in rural area; the water saving conditions mainly include the effective irrigated area, water saving irrigation machinery and water saving irrigated area. The output indicators mainly include the grain yield and total agricultural output value. The relevant research data were obtained from China Rural Statistical Yearbook, China Water Resources Bulletin and Statistical Yearbook of the provinces (autonomous regions) from 2000 to 2020. The evaluation system indicators of the AWRAE are shown in Table 1.

2.3. Research Methods

In this study, the AWRAE values are calculated on the basis of constructing the evaluation system of the AWRAE using the super-efficiency SBM model; then, the spatiotemporal differences and dynamic changes of the AWRAE are calculated using the Malmquist index and SDE and spatial autocorrelation analysis; finally, the main driving factors of the AWRAE were identified using Tobit regression model. The evaluation framework of the AWRAE and driving factors are shown in the Figure 2.

2.3.1. Super-Efficiency SBM Model

The super-efficiency SBM Model, which was proposed by Tone in 2002 [12,31], combines the advantages of the Super-efficiency DEA model and the SBM model. The super-efficiency SBM model is based on the measurement of relaxed variables, taking into account the difference between input and output terms, and using non ray optimization of relaxed variables to make the calculation of efficiency more accurate [32,33,34]. Assuming there are N decision-making units (DMUs) and the model is carried over from stage t to stage t + 1, the AWRAE can be obtained. The model is shown in Formulas (1) and (2).
ρ = 1 1 m + n good i = 1 m s i t x i o t + r = 1 s s i t t z i o t good 1 + 1 s r = 1 s s r t t y r o t i = 1 , 2 , , T
j = 1 n z i j t a λ j t = j = 1 n z i j t a λ j t + 1 i ; t = 1 , 2 , , T 1 x i o t = i = 1 m x i j t λ i t + S i t i = 1 , 2 , , m ; t = 1 , 2 , , T y r o t = r = 1 s y r j t λ j t S r t t r = 1 , 2 , , s ; t = 1 , 2 , , T z i o t good = i = 1 n z i j t good λ j t + S i t t i = 1 , 2 , , n good ; t = 1 , 2 , , T j = 1 n λ j t = 1 t = 1 , 2 , , T λ j t 0 , S i t 0 , S i t + 0 , S r t good 0
where ρ is the value of AWRAE, the AWRAE is at a relatively ineffective level when the ρ < 1, and the AWRAE has reached a relatively effective state when the ρ ≥ 1, and the greater the value, the higher the AWRAE level. xijt, yrjt, and z i j t good are the input, output, and carry over variables, respectively; xiot, yrot and z i o t good are the total of the input, output, and carry over variables, respectively; j refers to study regions; Sit, S r t t and S i t t are relaxation variables for the input, output and carry over variables, respectively; Xio is the oth decision-making unit.
According to relevant studies [1,32], the regional input–output is effective when the efficiency value exceeds 1, which indicates that the efficiency value is at a high level, and the economy, society and environment are well coordinated; the regional efficiency value is at a relatively high level and there is room for improvement when the efficiency value is greater than 0.8 but less than 1; the regional efficiency value is at a medium level and has a large room for improvement when the efficiency value is greater than 0.6 but less than 0.8; the regional input–output is inefficient when the efficiency value is less than 0.6, which indicates that the efficiency value is at a low level, and needs to be improved urgently.

2.3.2. Malmquist Index Model

The efficiency results measured by the super-efficiency SBM model are based on the static efficiency at a fixed time point, but the production technology will continue to change over time [35,36]. Malmquist proposed a method for measuring the temporal changes of productivity during the study period; the formula for calculating the total factor productivity index (Tfpch) is as follows:
T fpch x t + 1 , y t + 1 , x t , y t = D t x t + 1 , y t + 1 D t x t , y t · D t + 1 x t + 1 , y t + 1 D t + 1 x t , y t 1 2
where (xt, yt) and (xt+1, yt+1) are the input and output of decision-making units at time t and t + 1, respectively. If the Tfpch (xt+1, yt+1, xt, yt) value is greater than 1, indicating that the total factor productivity increases from t to t + 1, and vice versa. The Malmquist index can be divided into two parts: technological progress change (Techch) and technical efficiency change (Effch), and the formula is as follows:
Tfpch = Techch × Effch
Effch = D t x t + 1 , y t + 1 D t x t , y t
Techch = D t x t , y t D t + 1 x t , y t D t x t + 1 , y t + 1 D t + 1 x t + 1 , y t + 1 1 2
If the values of Effch and Techch are greater than 1, this indicates frontier advance, technical efficiency improvement or technological progress; if the values of Effch and Techch are less than 1, this indicates that the technology is backward, and the utilization of existing technology has not reached the ideal state. In the case of variable scale efficiency, the Effch can be further decomposed into the scale efficiency change (Sech) and pure technical efficiency change (Pech), which can more intuitively characterize the factors affecting efficiency change.
Tfpch = Techch × Pech × Sec h

2.3.3. Standard Deviation Ellipse Analysis

The SDE [37,38] gives full play to the advantages of ARCGIS spatial visualization, and can accurately describe the spatial change characteristics of the AWRAE through the changes of long axis, short axis, distribution of gravity center and azimuth angle. The gravity center of the AWRAE ( X ¯ ω , Y ¯ ω ) was calculated and compared with the geographical gravity center to reflect the relative geographical location of the AWRAE in space based on the analysis results of SEDEA window.
X ¯ ω = i = 1 n w i x i / i = 1 n w i , Y ¯ ω = i = 1 n w i y i / i = 1 n w i
The long axis ( σ x ), short axis ( σ y ) and azimuth ( θ ) of the standard deviation ellipse were calculated, and the changes between different years were compared to reflect the spatial dispersion degree and the dominant direction of the AWRAE.
σ x = i = 1 n w i x ˜ i cos θ w i y ˜ i sin θ 2 / i = 1 n w i 2 , σ y = i = 1 n w i x ˜ i sin θ w i y ˜ i cos θ 2 / i = 1 n w i 2
where (xi, yi) is the study area spatial location; w i is the weight; x ˜ i and y ˜ i represent the relative coordinates of each point to the region center, respectively.

2.3.4. Spatial Autocorrelation Analysis

The correlation between data from a specific region and its adjacent regions is revealed with the spatial autocorrelation analysis [39,40,41]. The Global Moran’s I coefficient is used for the global spatial autocorrelation to reflect the distribution effect of the unit in the study region. The calculation formula is as follows:
I = n i = 1 n j = 1 n X i X ¯ X j X ¯ i = 1 n X i X ¯ 2 i = 1 n j = 1 n W i j
where n is the spatial unit numbers in the study region, Xi and Xj are the observed values of region i and region j, X ¯ is the average value of X and Wij is the spatial weight matrix. I ∈ [−1, 1], when the significance level is given, if I > 0, indicating that the water productivity level of the study region presents a spatial aggregation phenomenon, and the larger the I value is, the more obvious the spatial aggregation feature of the water productivity level, and vice versa.
Local spatial autocorrelation can effectively distinguish the degree of aggregation or dispersion of local regions. The LISA aggregation types of the local spatial autocorrelation are referred to the reference [40].

2.3.5. Tobit Regression Model

The super-efficiency SBM and Malmquist models are mainly used to measure efficiency and its changes, but they cannot explore the factors that affect efficiency [42,43]. Therefore, the influencing factors are analyzed by using the Tobit regression model in this study. The Tobit regression model is a regression model with limited dependent variables, and the regression coefficients are estimated with the maximum likelihood method. Since the data type is balanced panel data, in order to avoid the error caused by OLS estimation, the cross-section and time series information contained in panel data are fully utilized to estimate the influencing factors of the AWRAE by using the Tobit regression model. The basic expression of the Tobit model is as follows:
Y i t = Y i t = β T X i t + ε i t , β T X i t + ε i t > 0 0 , otherwise
where Yit represents the result of the AWRAE measured by the super-efficiency SBM model, Xit is the quantitative index of each influencing factor, i is the province or autonomous region, t is the year, β T is the regression coefficient of the influencing factor and ε i t is the error term.

3. Results

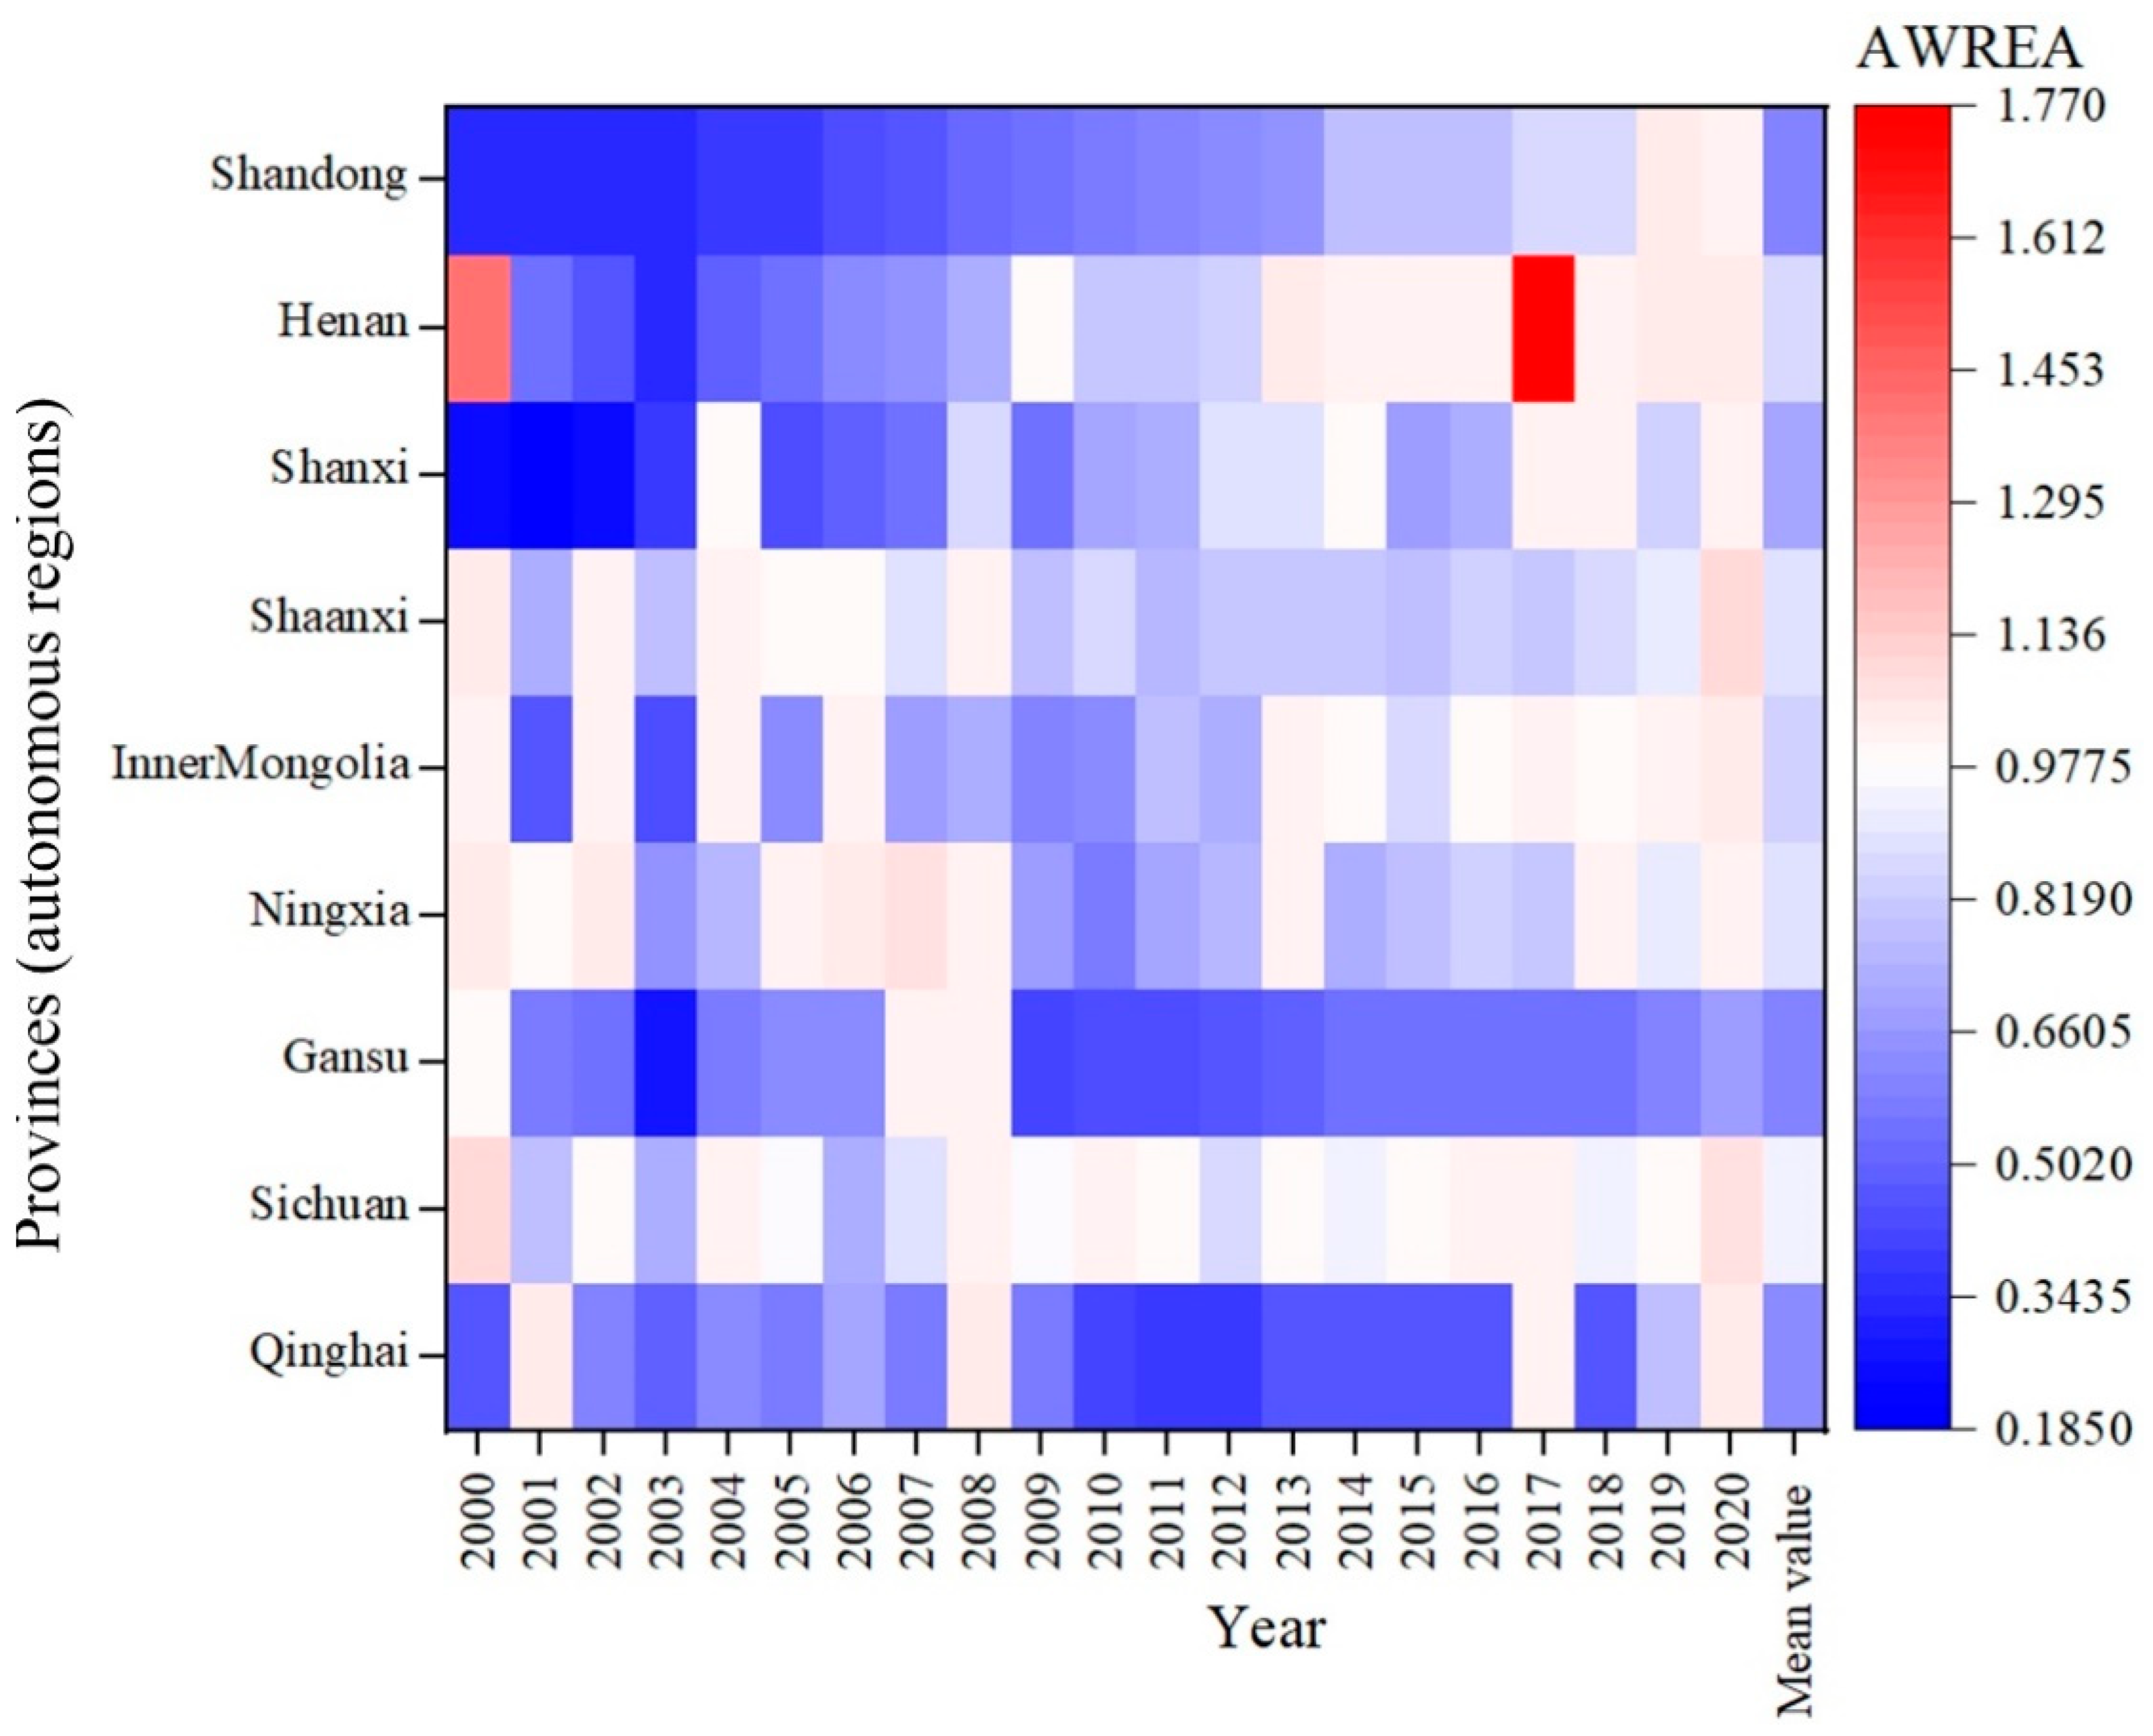
3.1. Spatiotemporal Characteristics of the AWRAE in the Yellow River Basin

In Figure 3, form the temporal perspective, the maximum values of the AWRAE are 1.053 (2008), 1.086 (2000), 1.029 (2008), 1.069 (2007), 1.047 (2020), 1.094 (2020), 1.017 (2020), 1.769 (2017) and 1.032 (2019) in Qinghai, Sichuan, Gansu, Ningxia, Inner Mongolia, Shaanxi, Shanxi, Henan and Shandong, respectively, which are all at a high level, and the minimum values of the AWRAE are 0.379 (2011), 0.721 (2006), 0.272 (2003), 0.559 (2010), 0.449 (2003), 0.727 (2001), 0.187 (2001), 0.337 (2003) and 0.318 (2003), respectively, in which Sichuan and Shaanxi are at a medium level, and the other provinces (autonomous regions) are at a low level. The changes of the AWRAE are relatively large, with 36.38%, 31.90%, 38.95%, 37.81% and 37.53% in Qinghai, Gansu, Shanxi, Henan and Shandong, respectively, and the changes of the AWRAE are relatively small, with 10.49%, 18.22%, 23.58% and 12.22% in Sichuan, Ningxia, Inner Mongolia and Shaanxi, respectively, all belonging to moderate variability. At the spatial scale, the AWRAEs from large to small rank as follows: Sichuan, Shaanxi, Ningxia, Henan, Inner Mongolia, Shanxi, Qinghai, Shandong and Gansu. The values of AWRAE are at a relatively high level in Sichuan, Shaanxi, Ningxia, Henan and Inner Mongolia, and their average values from 2000 to 2020 are 0.951, 0.882, 0.876, 0.864 and 0.842, respectively. For Shaanxi and Qinghai, the AWRAE values are 0.687 and 0.620, respectively, which are both at the medium high level; the AWRAE values in Shandong and Gansu are at a relatively low level with an average of 0.599 and 0.595, respectively.
The spatial distribution of the change trends of the AWRAE are shown in Figure 4. From Figure 4, there are no significant change trends in Sichuan, Qinghai, Gansu, Ningxia and Shanxi, but there is a significantly increasing trend in Inner Mongolia, Shanxi, Henan and Shandong, which indicates that the abundant precipitation, agricultural water consumption and regional economic development in the middle and lower reaches played an important role in ensuring the AWRAE improvement. For Inner Mongolia, the AWRAE is also in a good situation, because Inner Mongolia spans the northwest, north and northeast regions, the natural environment is complex and diverse and there are great differences in agricultural production.
On the whole, the AWRAE value is 0.768, which is at the medium level, indicating that the AWRAE has a large room for improvement in the Yellow River Basin, and it is necessary to further coordinate the water resources conditions, production conditions and water saving conditions to improve its allocation efficiency.

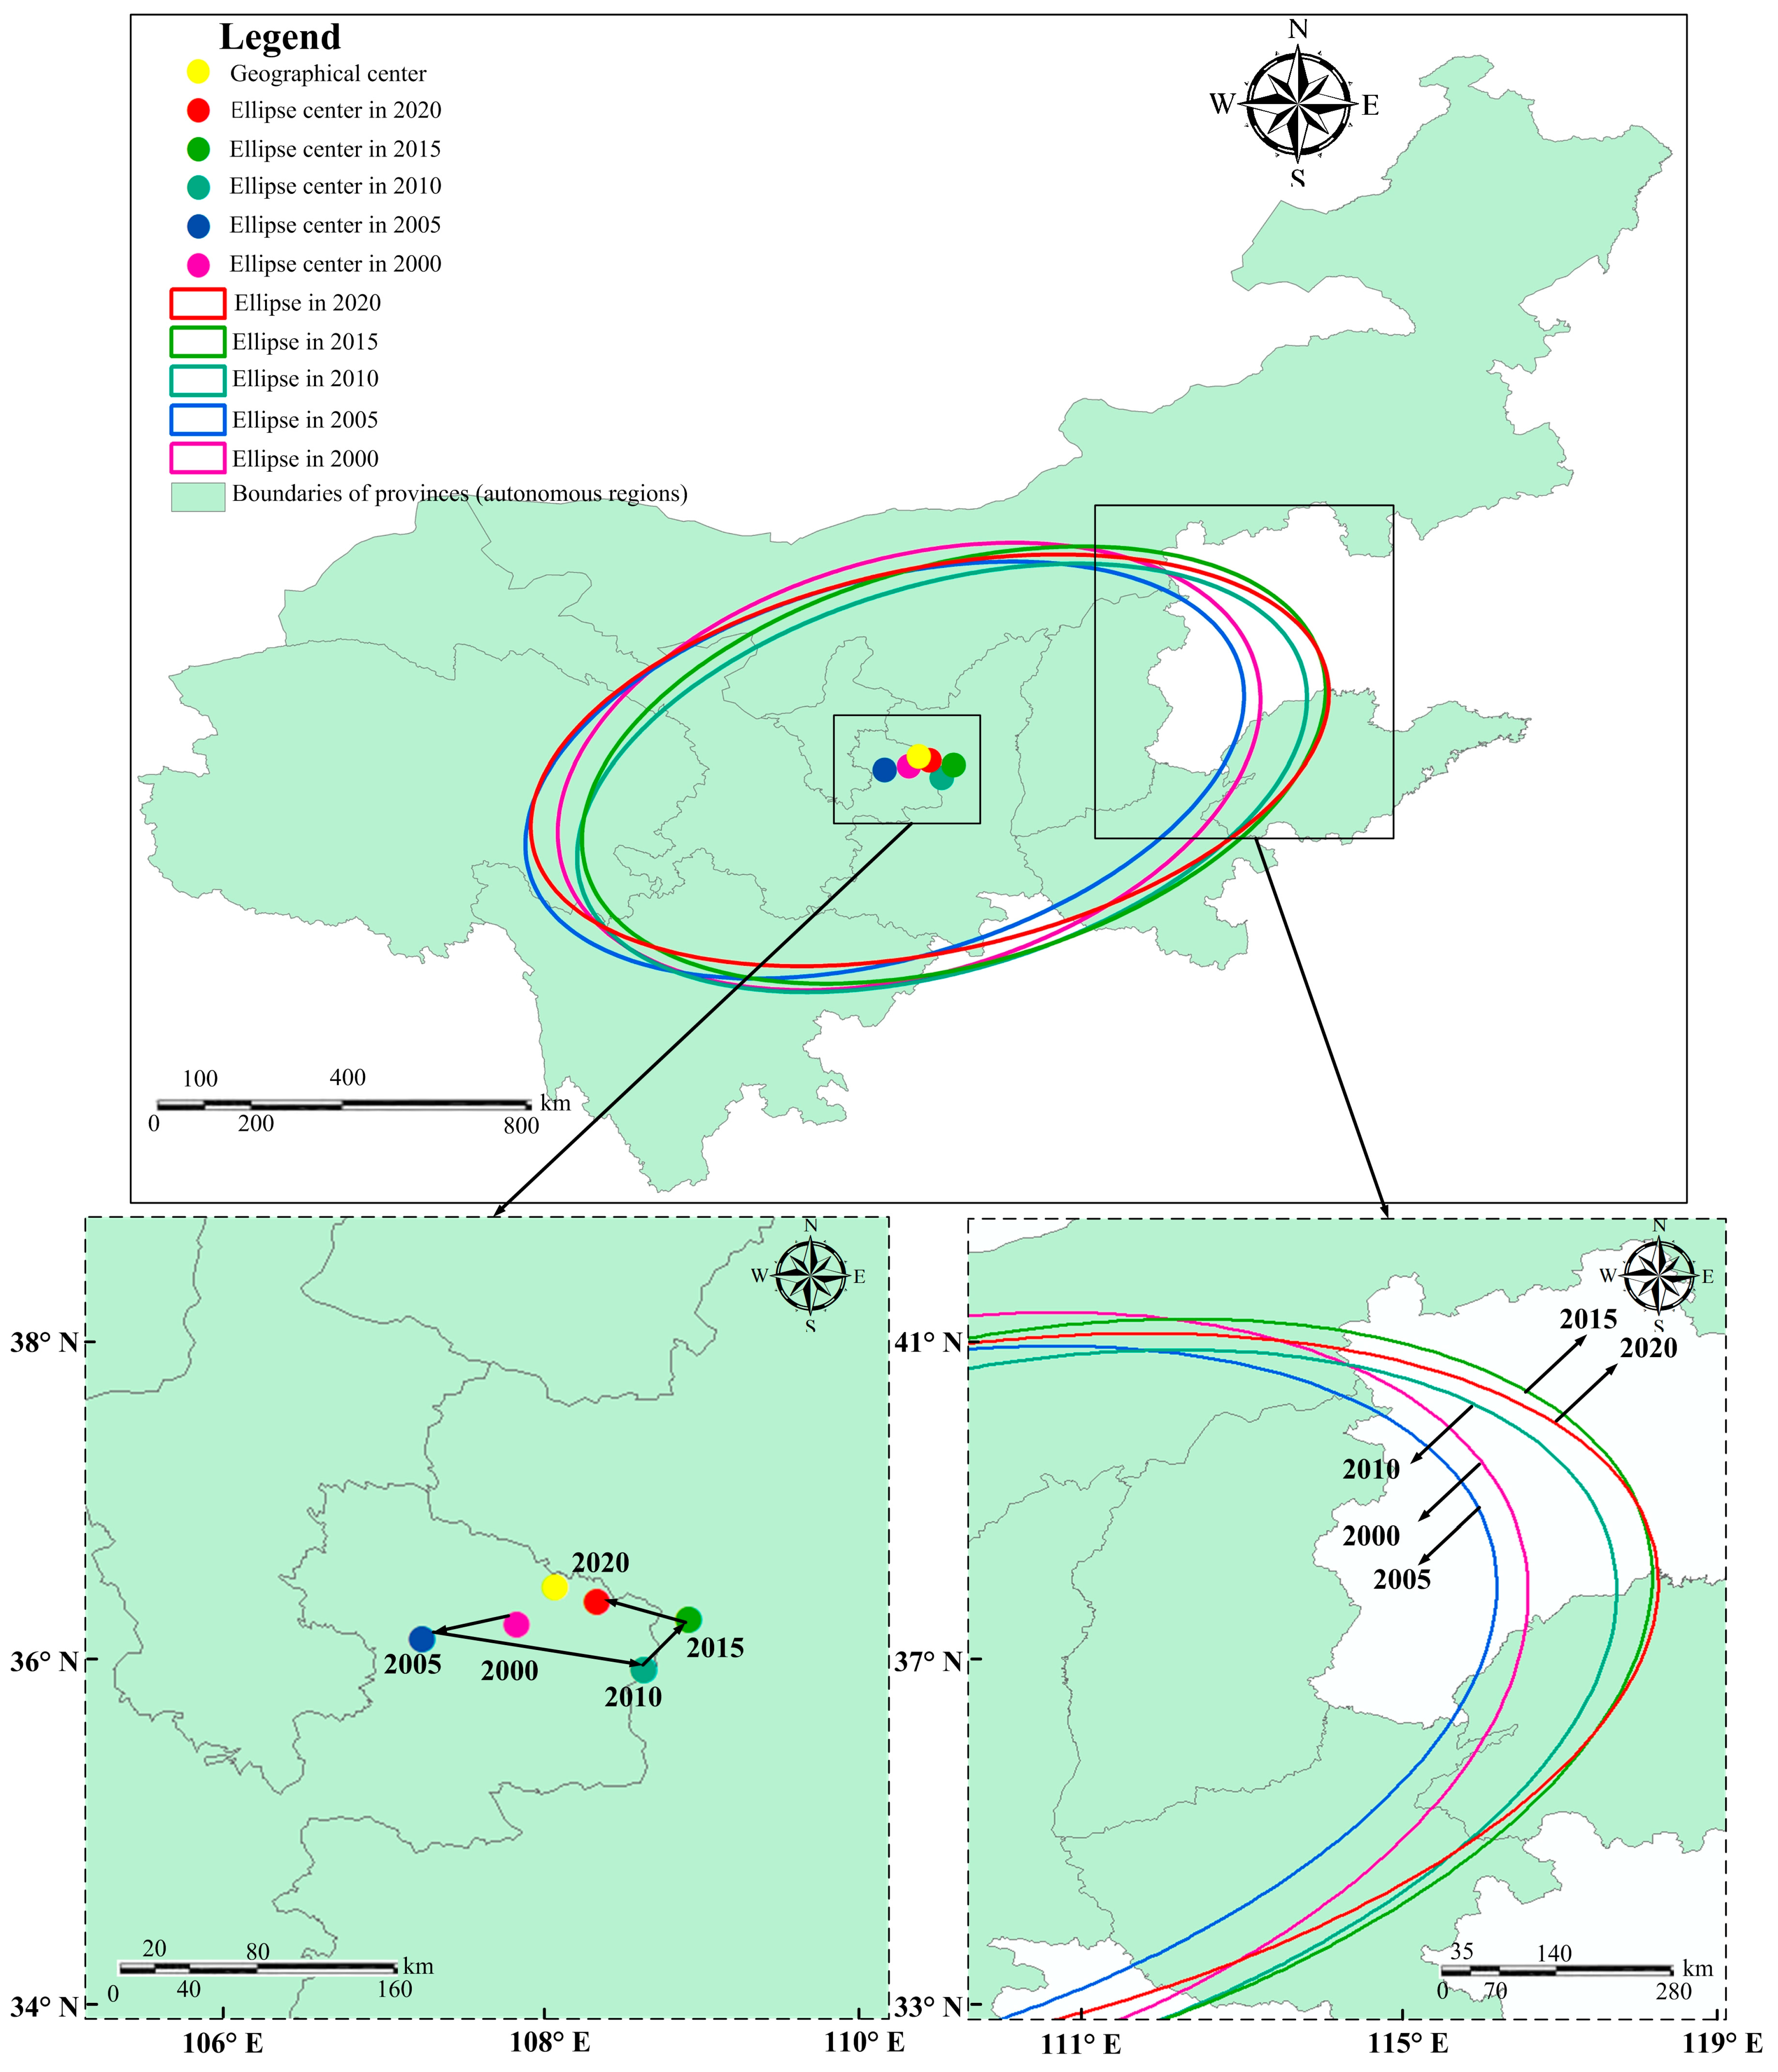
3.2. Gravity Shift and Dispersion Trend of the AWRAE

In Figure 5 and Table 2, the “East–West” long axis is always larger than the “South–North” short axis based on the analysis of the elliptic distribution shape for the AWRAE, which shows an obvious “East–West” distribution pattern that is consistent with the geographical spatial distribution of the Yellow River Basin. The long axis length of the ellipse of the AWRAE presents a graduate upward trend, with the number increasing from 862.686 km in 2000 to 970.892 km in 2020, while the short axis length shows a “W” wave change trend with the number decreasing from 498.537 km in 2000 to 458.746 km in 2020. The results indicate that the AWRAE expands in the east–west direction and the aggregation degree decreases, while the AWRAE in the north–south direction contracts and the aggregation degree increases. In 2000, 2005, 2010 and 2015, the azimuth angle of the AWRAE ellipse fluctuates little, and the azimuth angle and deviation rates are about 73.5° and 0.45, respectively. In comparison, the azimuth angle of the AWRAE ellipse in 2020 fluctuates greatly, and the azimuth angle and deviation ratio reach 77.72° and 0.528, respectively, which indicate that the level of the AWRAE has developed rapidly in recent years in the Yellow River Basin. The gravity center of the AWRAE moved 58.84 km, 138.27 km, 41.57 km and 58.46 km to the southwest, southeast, northeast and northwest during 2000–2005, 2005–2010, 2010–2015 and 2015–2020, respectively.
In general, the gravity center of the AWRAE keeps wandering along the provincial boundaries of Gansu and Shaanxi, which shows a counterclockwise rotation trend. In the early stage (i.e., 2000–2010), the economic level of the middle and lower reaches is higher than that of the upper reaches of the Yellow River Basin. The resources in the upper reaches are wasted due to the blind pursuit of rapid economic growth, coupled with the ecological environment restoration efforts and the promotion of water-saving irrigation technology; the gravity center of the AWRAE in this region has gradually shifted to the southwest and southeast regions. In the later period of the study (2010–2020), the ecological environment in the middle and lower reaches of the Yellow River Basin was greatly improved with the proposal of the ecological environment protection and high-quality development strategy of the Yellow River Basin, and the gravity center of the AWRAE moved to the northeast and northwest again, presenting a swing trend in Gansu and Shaanxi.

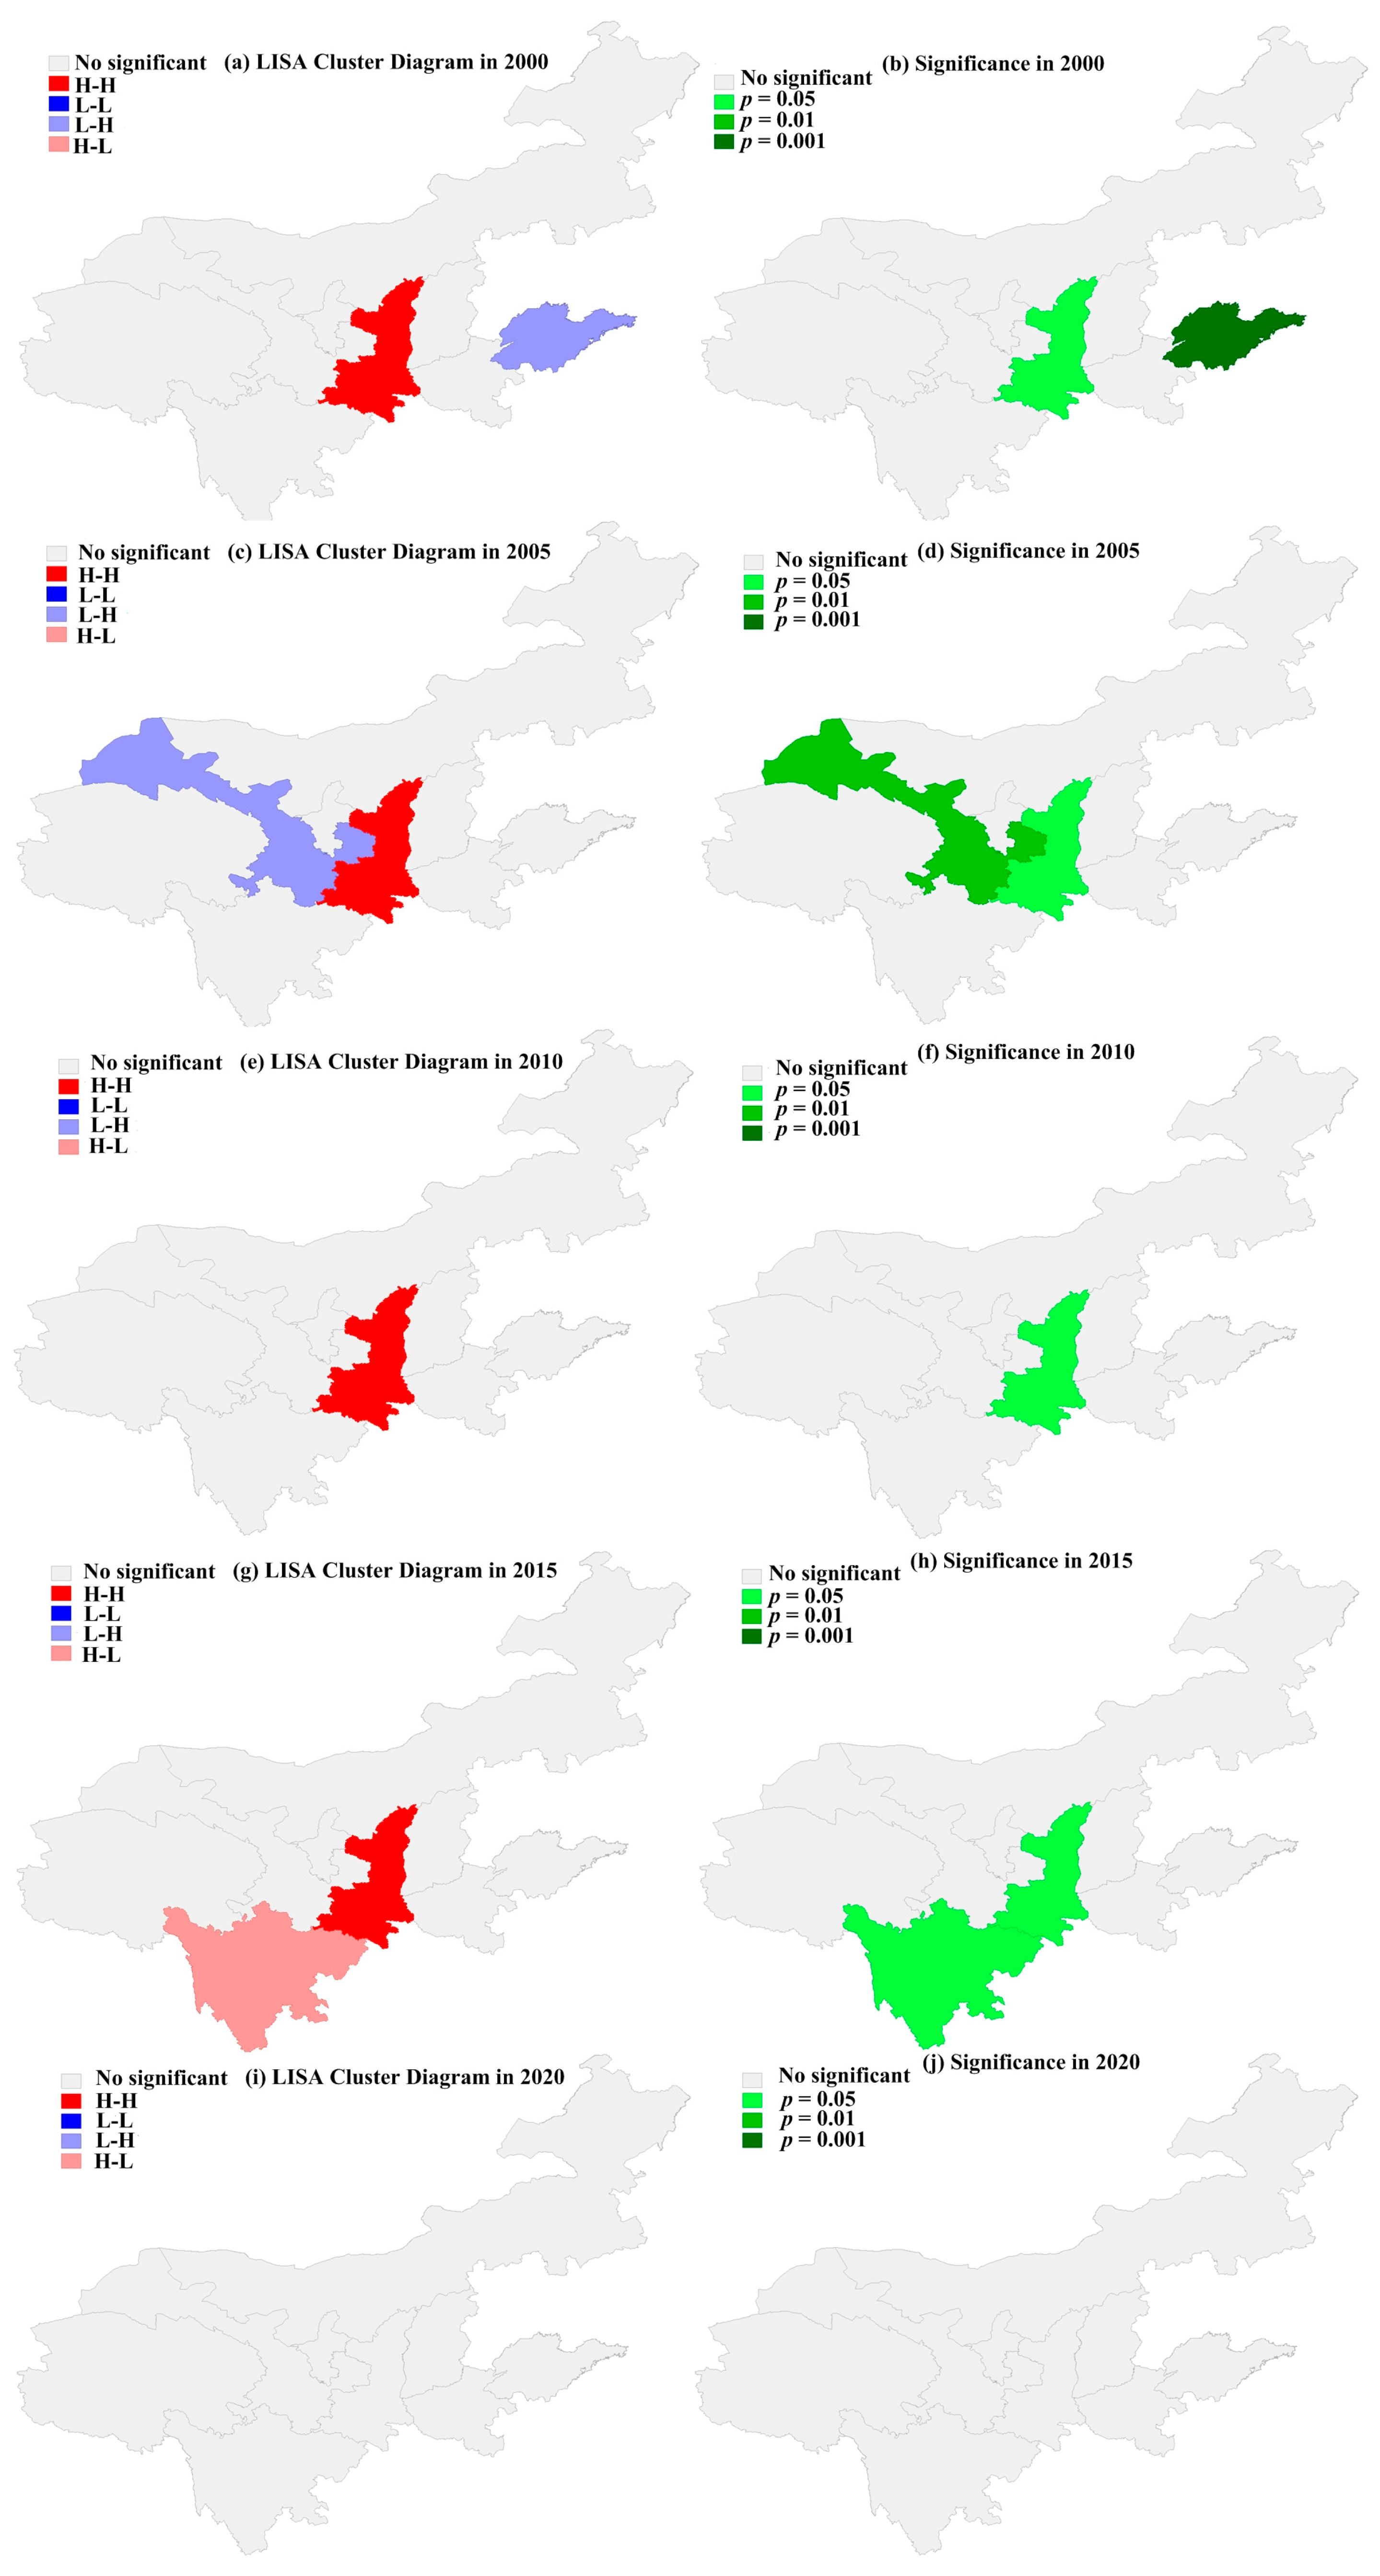
3.3. Spatial Autocorrelation Analysis of the AWRAE

The global autocorrelation Moran’s I index of the AWRAE were calculated by using the Euclidean distance as the weight based on the Geoda 1.16 software, which are −0.516, 0.120, −0.147, −0.230 and −0.228 (p < 0.05) in 2000, 2005, 2010, 2015 and 2020, respectively. These results indicate that there is a significant positive autocorrelation relationship in the spatial AWRAEs in 2005, while significant negative spatial autocorrelations are presented in 2000, 2010, 2015 and 2020. In Figure 6, the AWRAE in Shaanxi shows significant H-H aggregation in 2000, 2005, 2010 and 2015 (p < 0.05), and the AWRAE in Shandong exhibits significant L-H aggregation in 2000 (p < 0.001). In addition, Gansu shows significant AWRAE L-H aggregation in 2005 (p < 0.01), and Sichuan presents significant H-L aggregation in 2015 (p < 0.05). The agglomerations of AWRAE in other provinces in 2000, 2005, 2010, 2015 and 2020 are not significant. Overall, the aggregation of AWRAE is the most significant in Shaanxi, which is consistent with the result that the gravity center of the AWRAE is constantly hovering in the border of Gansu and Shaanxi.

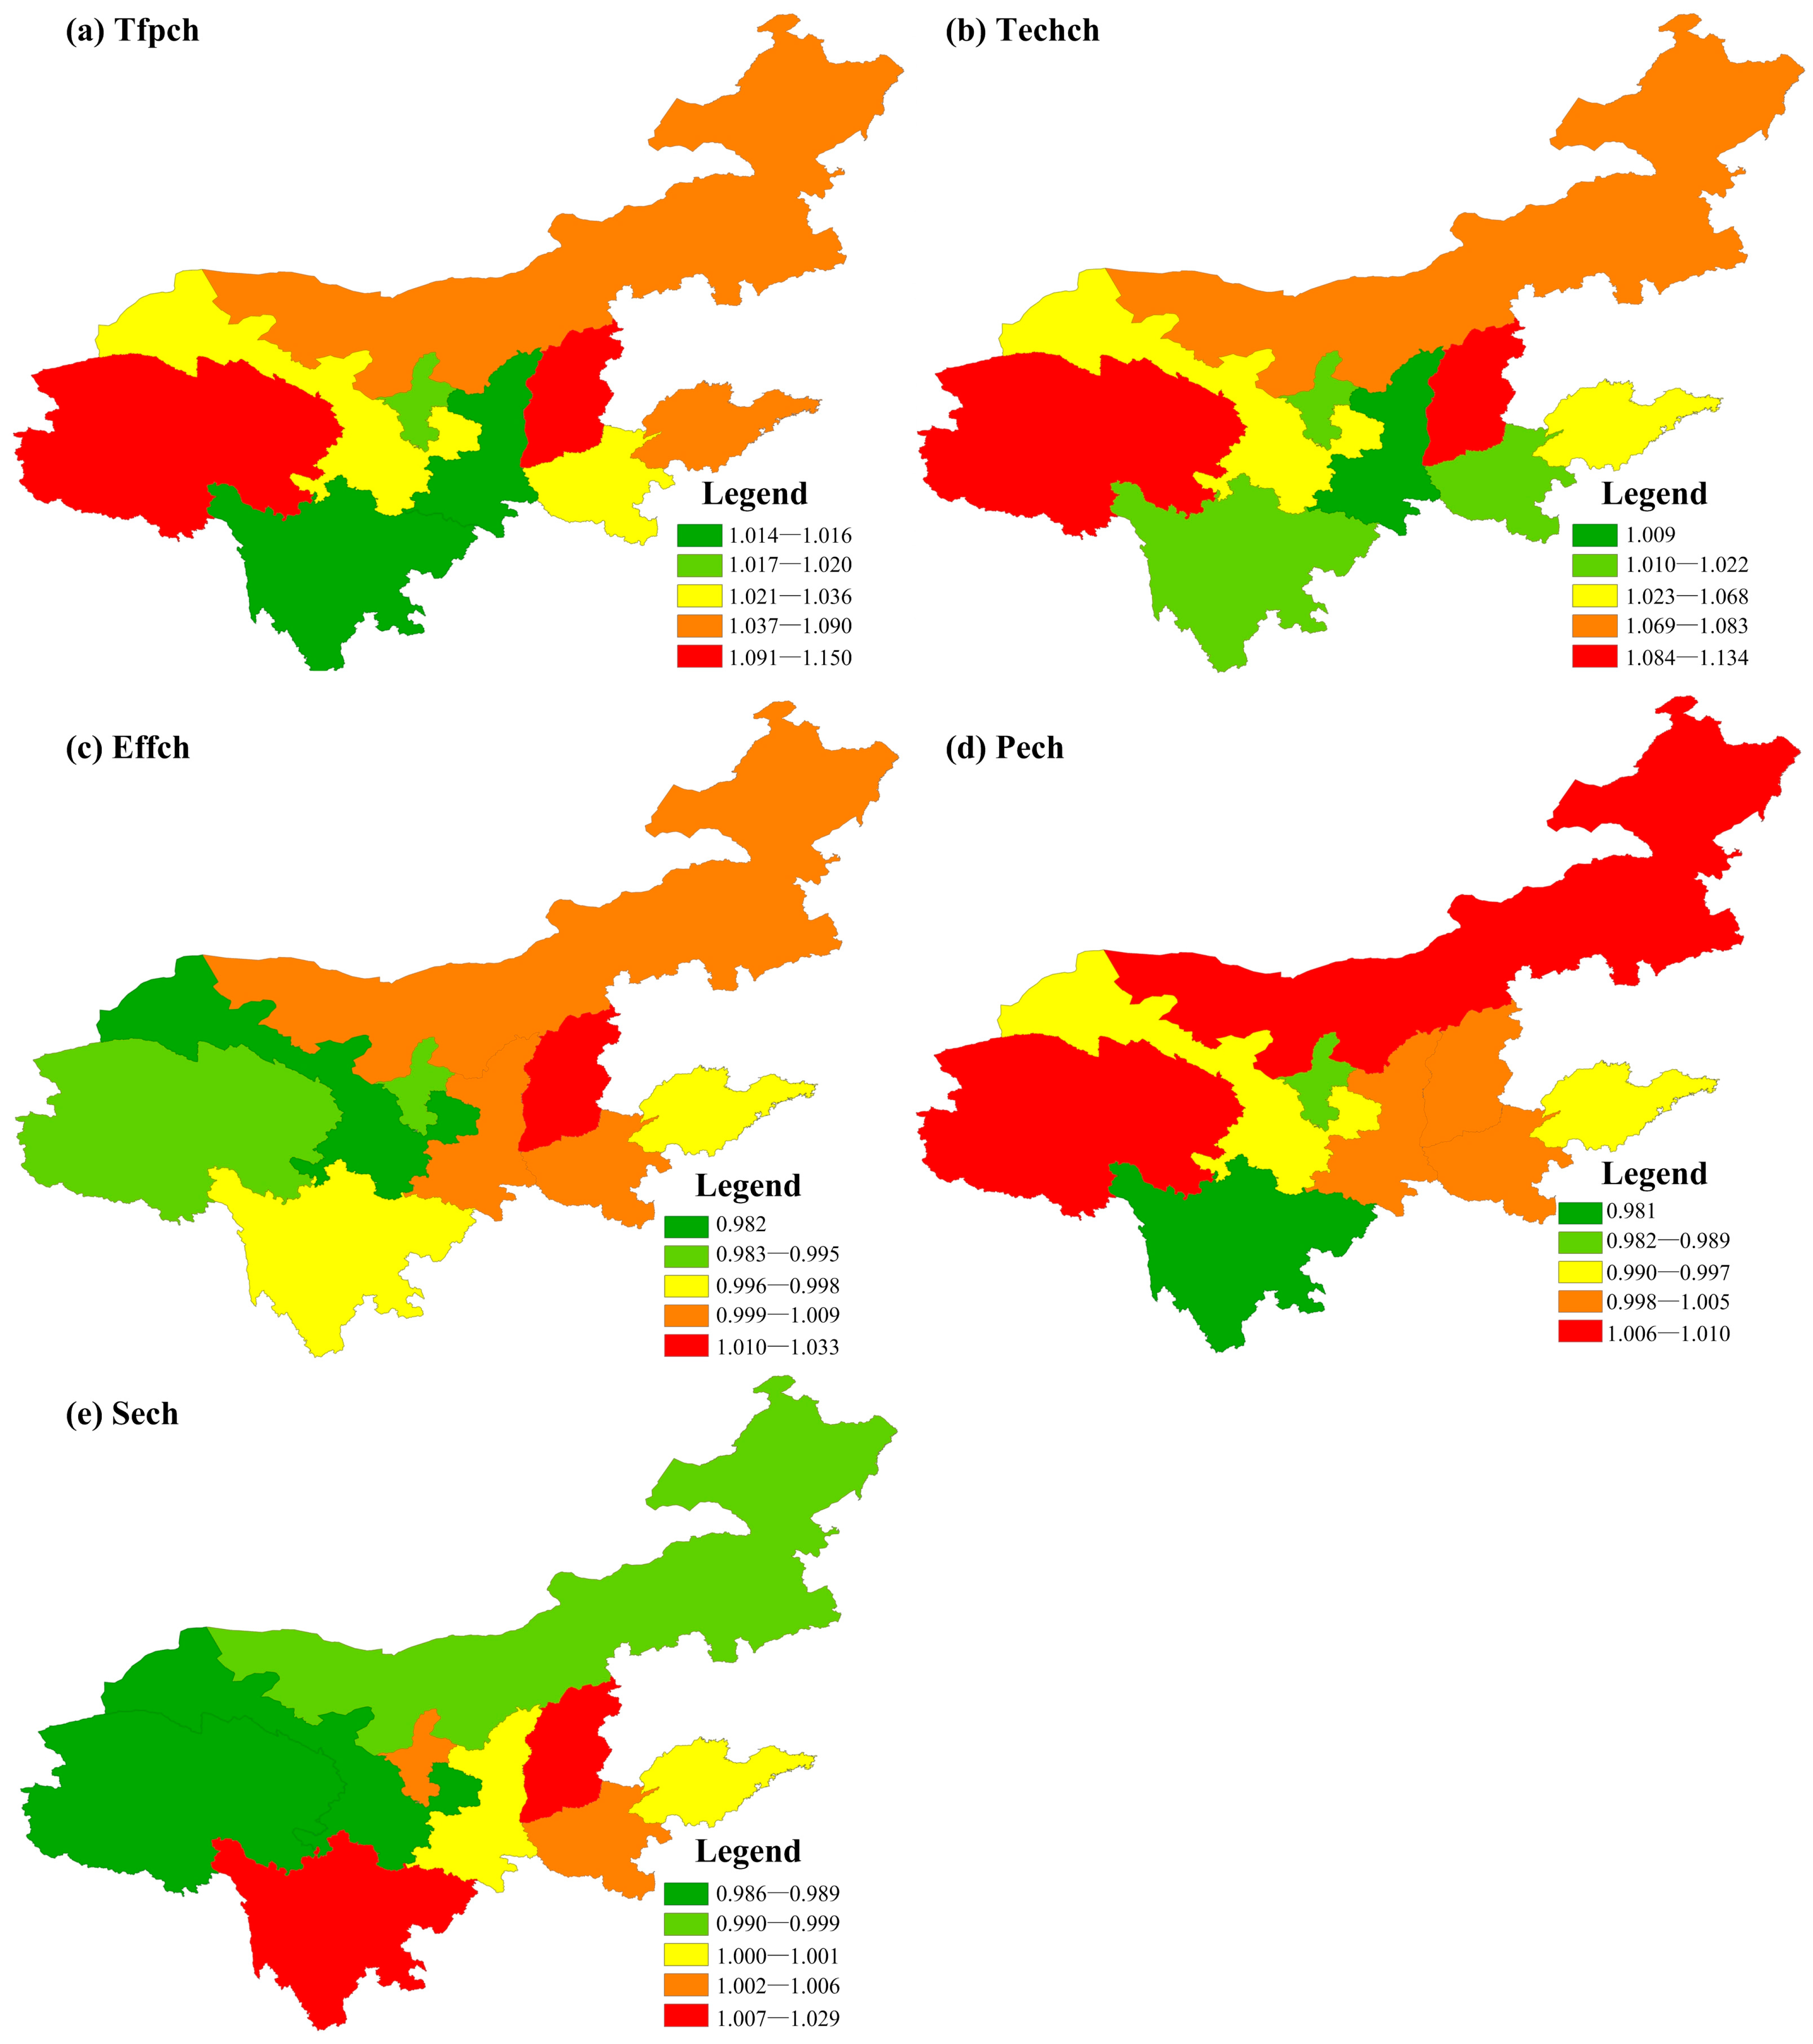
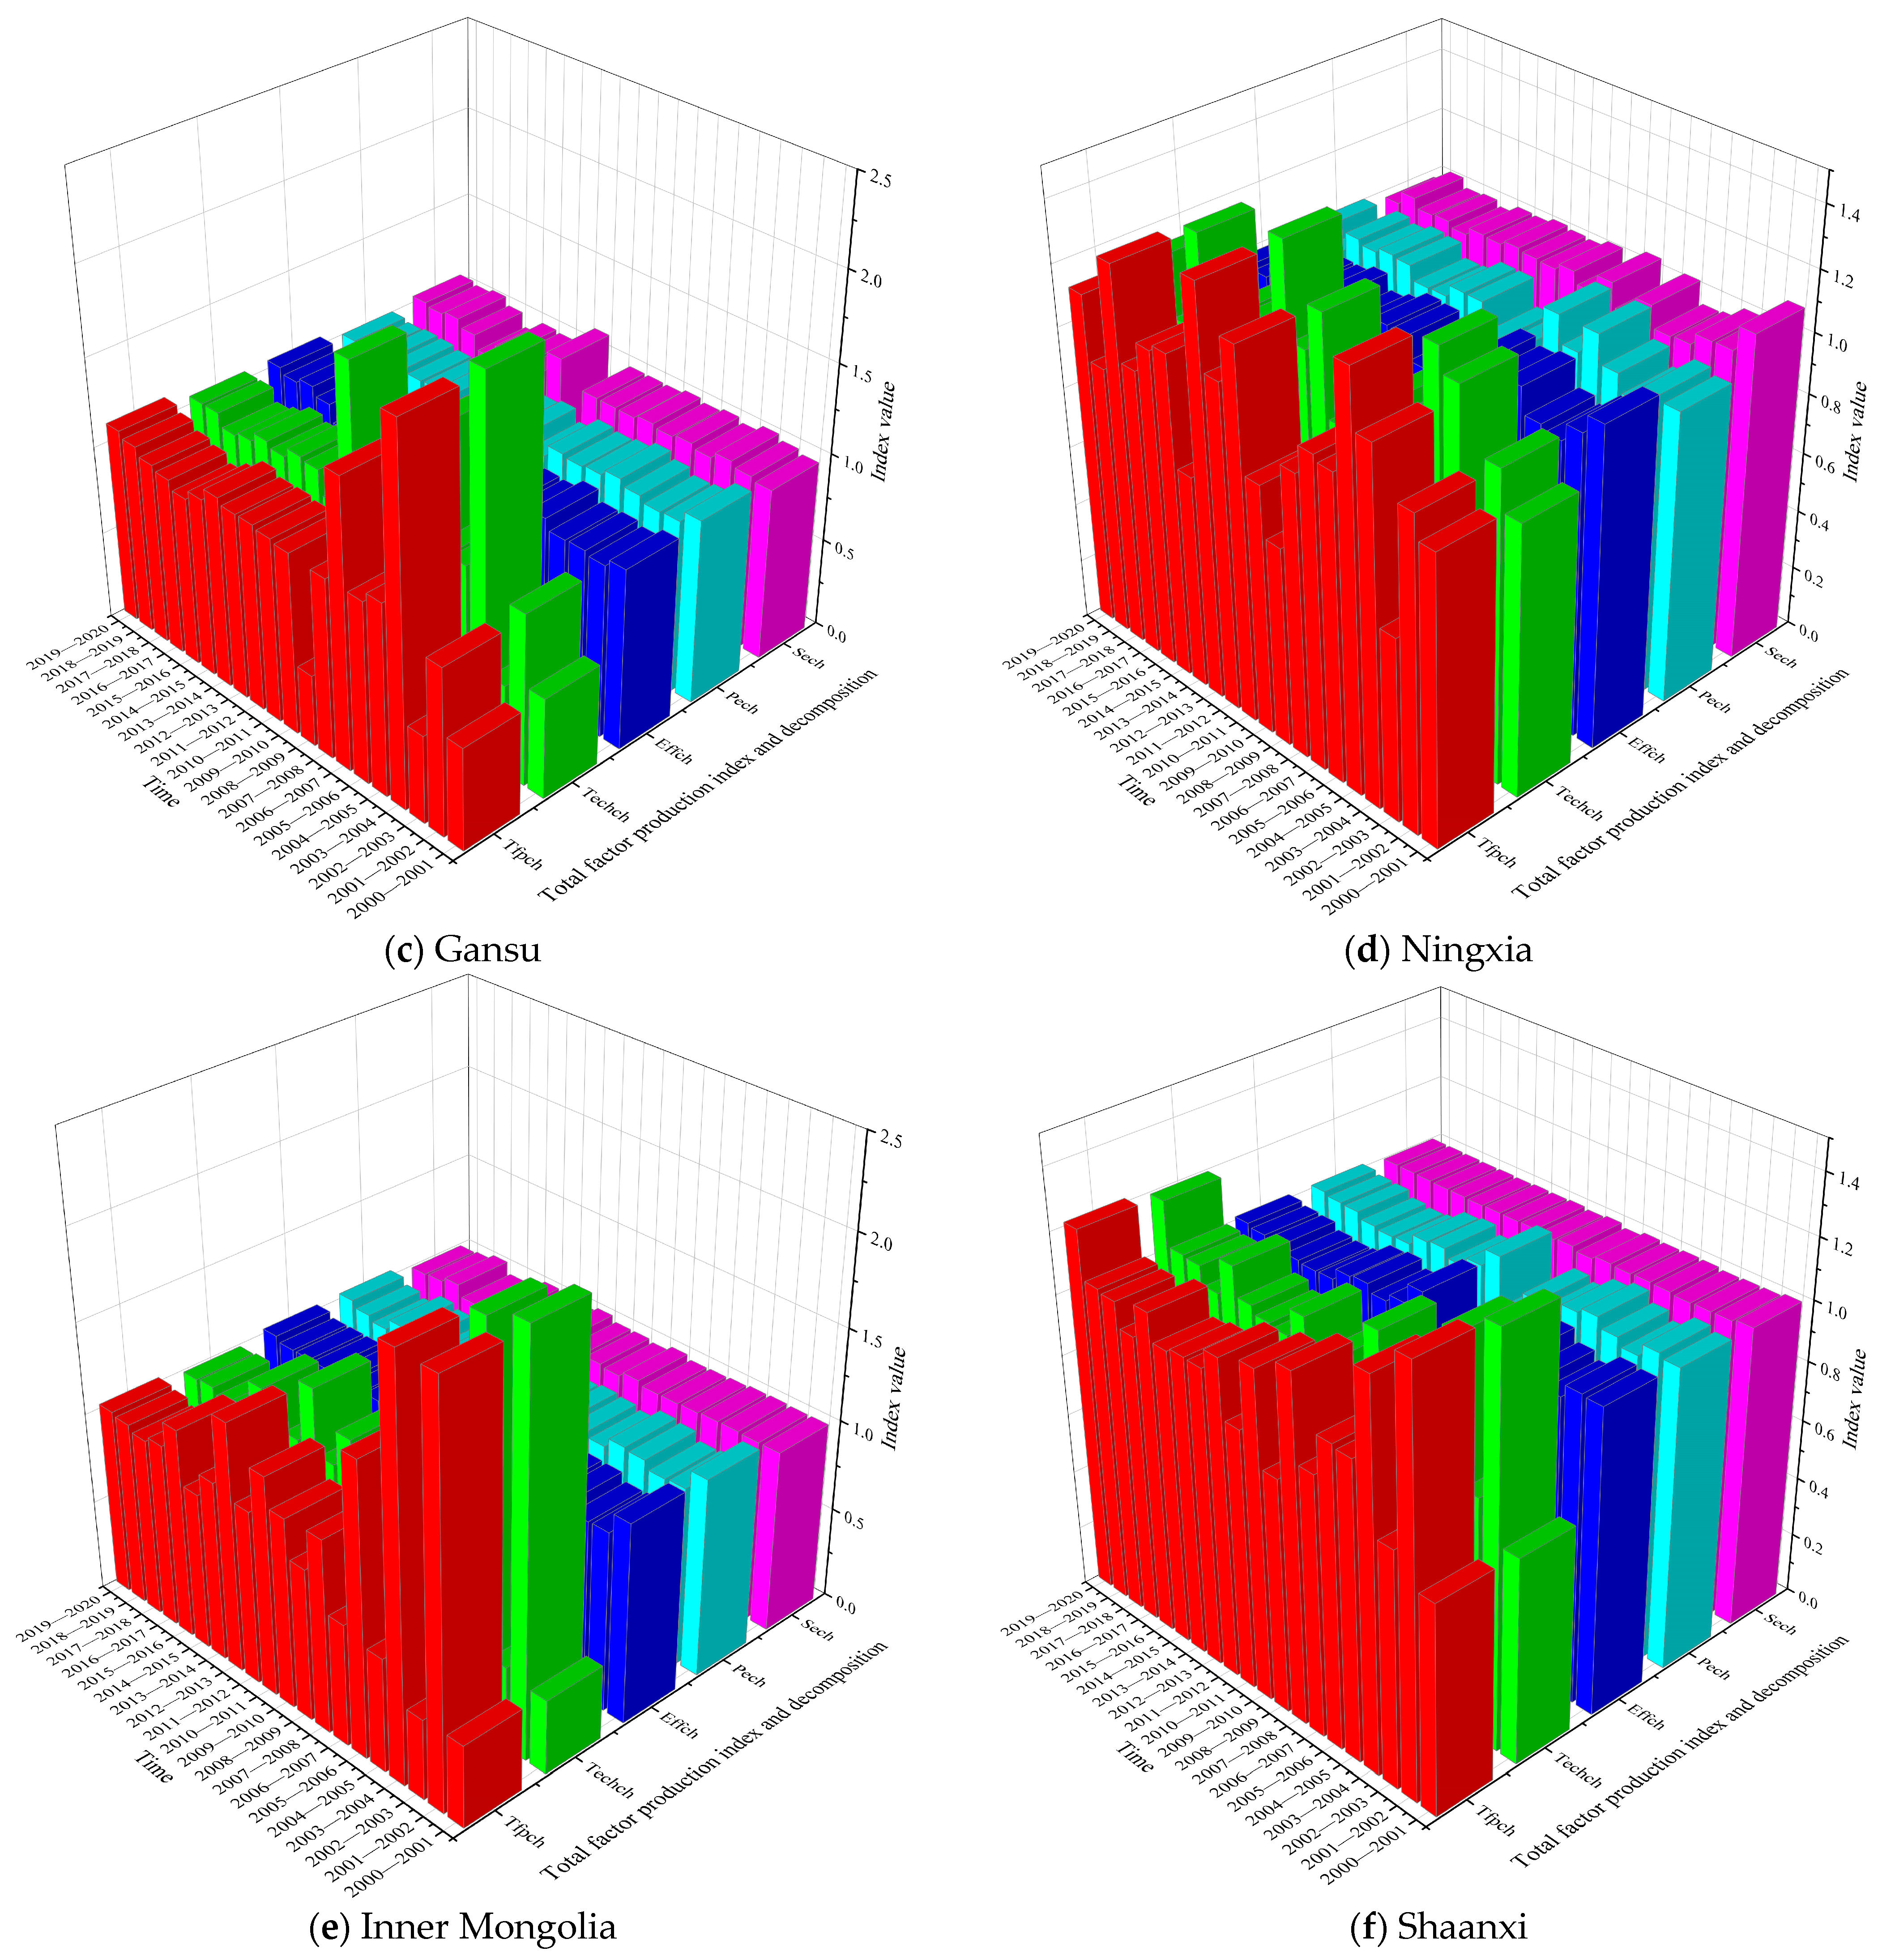
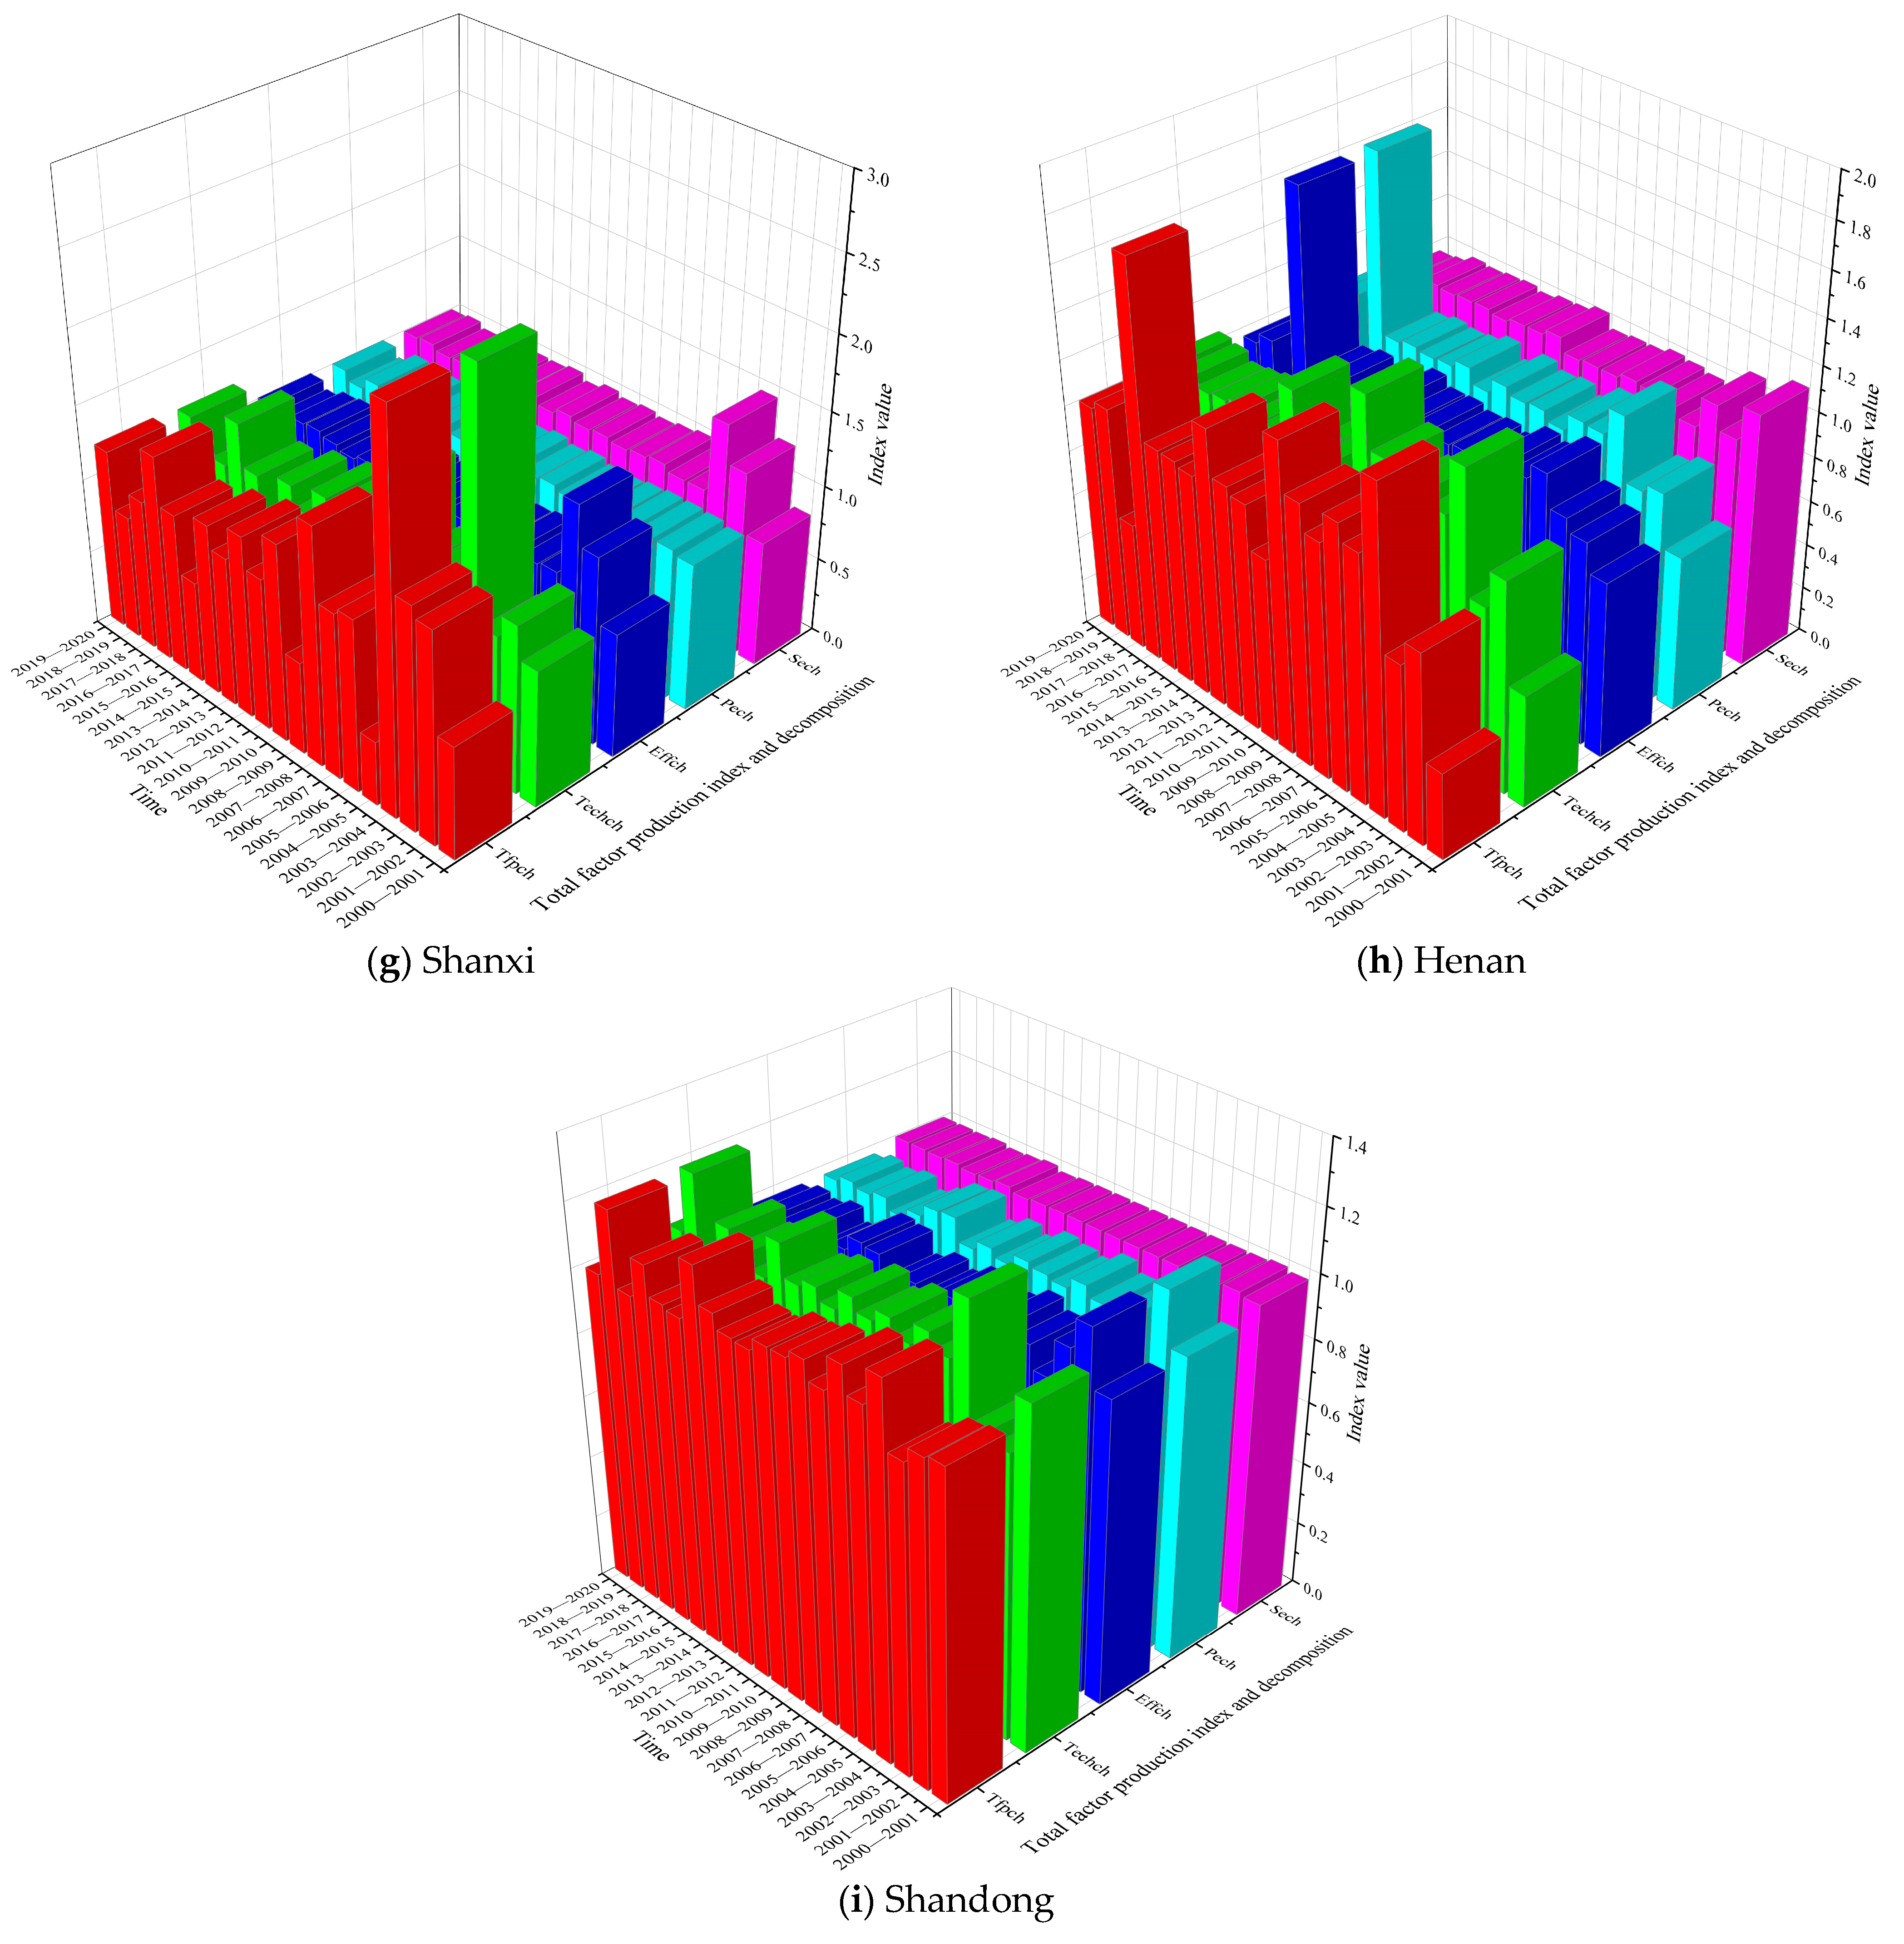
3.4. Dynamic Malmquist Index of the AWRAE and Its Decomposition

In Figure 7, the multi-year mean value of Tfpch in the AWRAE is 1.062 (≥1), indicating that the AWRAE has been continuously improved during 2000–2020. The multi-year mean values of Techch and Effch are 1.059 and 1.003 (≥1), respectively, demonstrating that the Techch and Effch are both promoted and closely related to the improvement of the AWRAE. In addition, the multi-year mean value of Pech is 0.999 (≤1) and that of Sech is 1.004 (≥1), indicating that the AWRAE is restricted by the Pech, and its improvement is greatly influenced by the pure technical efficiency. Therefore, in light of the industrial structure in some provinces and autonomous regions being unreasonable, the mode of agricultural water use is changing from extensive to energy-saving and it is necessary to introduce water-saving equipment and promote water-saving technology to improve the AWRAE in the Yellow River Basin.
The Tfpch and Techch of the nine provinces (autonomous regions) are all greater than 1, among which Qinghai and Shanxi experience the most rapid improvement in the AWRAE, while the other provinces (autonomous regions) have slower improvement and there are little differences between them. In Qinghai, Sichuan, Gansu, Ningxia and Shandong, their multi-year mean values of Effch are 0.996, 0.997, 0.983, 0.995 and 0.998 (≤1) respectively, which indicate that the slow change in technical efficiency would limit the improvement of the AWRAE. The Pech values are all less than 1 in Sichuan, Ningxia and Shandong, which are largely restricted by the pure technical efficiency, and thus it is necessary to further improve the investment in water-saving technology and equipment. In addition, the Sech are both less than 1 in Qinghai and Inner Mongolia, which is likely to be restricted by the scale efficiency caused by the low level of regional economic development and the unfavorable promotion of vast areas. Thus, it needs to further expand the scale of agricultural production conditions and water saving conditions. For Gansu, the Pech and Sech are both less than 1, indicating that the AWRAE in Gansu is subject to the dual restriction of Pech and Sech.
On the whole, the improvement of the AWRAE is greatly affected by multiple constraints in the middle and upper reaches, while the middle and lower of the Yellow River Basin reaches are relatively small.
In Figure 8, the Tfpch and Techch of the nine provinces (autonomous regions) had a large change range during 2000–2020, and the trends were nearly the same; the Effch, Pech and Sech showed relatively small changes. It can be seen that the AWRAE in Qinghai was significantly hindered by the Techch in 2001–2003, 2006–2007, 2008–2010 and 2017–2018, and was also significantly hindered by the Pech in 2017–2018. For Sichuan, its AWRAE was significantly hindered by the Techch in 2000–2001, 2002–2003, 2005–2006 and 2011–2012, and was significantly hindered by the Pech in 2000–2001. As for Gansu, the AWRAE was significantly hindered by the Techch in 2000–2001, 2002–2003 and 2008–2009, and also significantly hindered by the Effch in 2010–2011. The AWRAE in Ningxia was greatly hindered by the Techch in 2002–2003, 2008–2010 and 2013–2014, whilst in Inner Mongolia, it was greatly hindered by the Techch, except in the period of 2009–2014. Similarly, the AWRAEs in Shaanxi and Shanxi were greatly hindered by the Techch in the periods of 2000–2001, 2002–2003, 2006–2007, 2008–2009 and 2010–2011 and the periods of 2004–2005, 2008–2009, 2014–2015 and 2018–2019, respectively, and the Shanxi was also significantly hindered by the Effch in 2000–2001. In Henan, the AWRAE was greatly hindered by the Techch, Effch and Pech in 2000–2001, Techch in 2001–2003 and 2009–2010, Pech in 2002–2003, and Effch and Pech in 2017–2018. The AWRAE was greatly hindered by the Techch in Shandong in 2001–2002. In addition to the above hindrance stages, the Techch, Effch, Pech and Sech all play a certain role to promote the AWRAE in the nine provinces (autonomous regions), which are mainly due to the differences in agricultural water resources management measures among provinces and autonomous regions, the lag effect between the implementation of the strictest water resources management system in different regions and the restriction or prohibition of the development of high-water consumption industries in water shortage areas.

3.5. Driving Factors of the AWRAE

The driving factors of the AWRAE in the Yellow River Basin were analyzed by using the Tobit regression model, and the likelihood ratio test of the Tobit regression model is shown in Table 3, and it can be seen that the p of the Tobit regression model established for the AWRAE and its driving factors are all less than 0.05, indicating that the established regression model was effective.
In Figure 9 and Figure 10, for Qinghai, the regression coefficient of AMTP is 0.006 (p < 0.05), which has a significantly positive effect on the AWRAE; the regression coefficients of AAP AW, WIA and WIM are −0.004 (p < 0.05), −0.073 (p < 0.05), −0.015 (p < 0.05) and −2.649 (p < 0.01), respectively, which present significant negative effects on the AWRAE. For Sichuan, the regression coefficients of AW, CFCEC and WIM are −0.018 (p < 0.01), −0.016 (p < 0.05) and −0.178 (p < 0.05), which have significant negative effects on the AWRAE; the regression coefficients of AMTP (p < 0.01), CPC (p < 0.01), GCTSA (p < 0.05) and PERA (p < 0.01) are all 0.001, which have significant positive influences on the AWRAE. For Gansu, the regression coefficient of GCTSA is 0.002 (p < 0.05), having a significant positive effect on the AWRAE while the PERA has a significant negative effect with the regression coefficient being −0.001 (p < 0.01). For Ningxia, the AAP (p < 0.01), AW (p < 0.01), CFCEC (p < 0.01), PFUA (p < 0.05) and GCTSA (p < 0.05) all have significant positive effects on AWRAE, while the AMTP (p < 0.01), CPC (p < 0.05), PERA (p < 0.01), WIA (p < 0.01) and WIM (p < 0.01) have significant negative effects.
For Inner Mongolia, the AWRAE were significantly positive influenced by the AMTP and GCTSA with their regression coefficients being 0.001 (p < 0.05) and 0.001 (p < 0.01), respectively, but were significantly negatively influenced by the CFCEC and WIM with their regression coefficients being −0.012 (p < 0.05) and −0.350 (p < 0.01), respectively. The regression coefficients of AAP and CPC are −0.001 (p < 0.05) and −0.001 (p< 0.01) in Shaanxi Province, respectively, which have significant negative impacts on the AWRAE. For Shanxi, the regression coefficients of the CFCEC and PFUA are 0.072 (p < 0.01) and 0.001 (p < 0.05), respectively, showing significant positive impacts on AWRAE, while the CPC has a significant negative effect on the AWRAE (p < 0.05) and its regression coefficient is −0.001. For Henan, the regression coefficient of CFCEC is 0.004 (p < 0.01), which has a significant positive effect on the AWRAE, and the regression coefficients of CPC and PFUA are −0.001 (p < 0.01), which have significant negative effects. The regression coefficients of AAP, CFCEC, CPC and PERA are −0.001, −0.002, −0.001 and −0.001 (p < 0.01), respectively, in Shandong, having a significant negative impact on the AWRAE.
In general, these influencing factors on the AWRAE are significantly different in different provinces and autonomous regions, which are inseparable due to the different water resources conditions, production conditions and water saving irrigation conditions in different these provinces (autonomous regions). The upper and middle reaches are affected by relatively more influencing factors in the Yellow River Basin, while the lower and middle reaches are affected by few factors, which are closely related to the levels of economic and social development.

4. Discussion

The water resources endowment is poor, and most of the areas are arid and semi-arid in the Yellow River basin. The total water resources, the average annual precipitation, and the per capita water resources are only 7%, 40% and 27% of the national average, respectively, and the contradiction between the supply and demand of water resources is becoming increasingly prominent. In the process of promoting the high-quality development of the Yellow River Basin, severe challenges and major constraints of water resources shortage always exist. To make the limited water resources continue to support sustainable development, it is necessary to control the demand for water, limit economic activities within the water resources carrying capacity and reasonably allocate water in the Yellow River Basin. In 2021, the Implementation Plan for the Conservation and Intensive Utilization of Water Resources in the Yellow River Basin was officially issued, and it was clearly proposed to strengthen the rigid constraints of water resources and improve the level of conservation and intensive utilization of water resources in this basin [44]. On April 1, 2023, the Yellow River Protection Law of the People’s Republic of China came into effect, pointing out that the Yellow River basin should strengthen agricultural water saving and efficiency, encourage and promote the advanced water-saving technologies, and effectively realize the economical and intensive use of agricultural water resources. Based on the control index of the total amount of water withdrawn from the administrative area, the control index of agricultural water consumption of the administrative area shall be formulated, taking into account the water demand for economic and social development, water-saving standards and industrial policies. Therefore, the comprehensive improvement of the water resources utilization level has become a bottleneck that the major national strategy of the Yellow River urgently needs to break through.
Optimizing the allocation and rational utilization of water resources are important ways to achieve ecological protection and high-quality development, which not only meets the ecological water demand within the basin but also guarantees the water for industrial development [45,46,47]. The proportion of agricultural water consumption is more than 60%, the rational allocation of agricultural water resources is thus the top priority in the Yellow River Basin. The optimal allocation of agricultural water resources refers to the optimal allocation of limited and different forms of agricultural water resources in different growth stages of crops, between different crops and canal systems, and between different agricultural departments in a specific region based on the principle of efficient water saving and ecological health, to achieve the maximum comprehensive benefits of agricultural water resources utilization. Therefore, how to develop water-suitable agriculture according to the carrying capacity of water resources, improve the AWRAE and reduce agricultural water use on the premise of ensuring high quality and high yield is the key to solving the current agricultural water shortage and ensure food security [48].
Identifying the driving factors of the AWRAE based on the establishment of the evaluation system is the main task to improve the AWRAE in river basins and alleviate the contradiction between water supply and demand. Relevant studies have shown that climate change and human activities have intensified the evolution process of farmland hydrological factors such as precipitation, evapotranspiration, runoff, leakage and water consumption, thus affecting the whole process of agricultural water supply, use, consumption, discharge and return. Future studies on the evolution law of irrigation water demand should comprehensively consider the influence of climate factors, crop varieties, planting structure, irrigation area, cultivated land area, water-saving measures and other comprehensive environmental factors on agricultural water demand [49]. Zhang [50] showed that the changes in temperature and precipitation caused by climate change not only affected the water cycle and water resources, but also directly affected the water demand and water consumption process. At the same time, it is pointed out that if the farming system is not changed, the transformation of water-saving technology should be strengthened and the irrigation efficiency improved, then the agricultural water demand would be significantly increased.
In this study, the water resource conditions, production conditions and water saving conditions were comprehensively considered as the influencing factors on the AWRAE, and the evaluation system of the AWRAE was constructed, and its main driving factors were also identified, providing a theoretical basis for agricultural water saving and stable grain yield and increase in the Yellow River Basin. The results show that the AWRAE is at the medium level and has much room for improvement, and the gravity center of AWRAE is constantly wandering in the border of Gansu and Shaanxi, showing a counterclockwise rotation trend (Figure 5). The improvement of the AWRAE in the middle and upper reaches of the Yellow River Basin is greatly affected by multiple constraints, while the improvement in the middle and lower reaches is relatively small, which was closely related to the local economic and social development level. Therefore, with consideration of the shortage of water resources, weak agricultural foundation and backward agricultural water technical efficiency due to the impact of terrain and climate in the middle and upper reaches of the Yellow River Basin, the government needs to strengthen the cooperation in the upper, middle and lower reaches, coordinate regional governance needs, rationally allocate resources, promote the structural reform of agricultural supply side and strengthen financial support and technological research and development cooperation in the middle and upper reaches, in order to accelerate the coordinated regional development and improve the AWRAE. Secondly, the AWRAE is at the overall rising stage in the Yellow River Basin, and the technological progress is the key factor to improve the AWRAE. All provinces and autonomous regions need to adjust the proportion of input–output factor groups according to the regional resource endowment and development stage, so as to develop regional economy in a balanced way. Thirdly, the institutional reform in the field of agricultural water resources and the structural reform of agricultural water use in line with the factor group bias should be promoted to improve the AWRAE. Finally, the technical efficiency lag has seriously hindered the improvement of the AWRAE in the Yellow River Basin, and it is urgent to improve the technical efficiency, such as by strengthening cooperation and exchanges among provinces and regions, introducing advanced and applicable production management technologies, improving regional agricultural production processes, optimizing industrial structure, and promoting the harmonious development of economy and ecology.

5. Conclusions

In this study, the evaluation system of the AWRAE is constructed, which is applied to evaluate the AWRAE and its influencing factors in nine provinces (autonomous) by the super-efficiency SBM model, SDE, spatial autocorrelation analysis, the Malmquist index and the Tobit regression model in the Yellow River Basin. The following conclusions were drawn:
(1)
The AWRAE is at the medium level with the value being 0.768 in the Yellow River Basin, and the AWRAE ranking from large to small is as follows: Sichuan > Shaanxi > Ningxia > Henan > Inner Mongolia > Shanxi > Qinghai > Shandong > Gansu. The changes of the AWRAE are relatively large, with 36.38%, 31.90%, 38.95%, 37.81% and 37.53%, respectively, in Qinghai, Gansu, Shanxi, Henan and Shandong, and the AWRAE shows a significant increasing trend in Inner Mongolia, Shanxi, Henan and Shandong.
(2)
The gravity center of the AWRAE keeps wandering along the provincial boundaries of Gansu and Shaanxi, which shows a counterclockwise rotation trend. The AWRAE expands in the east–west direction with its aggregation decreasing, while it contracts in the north–south direction with its aggregation increasing in the Yellow River Basin. The AWRAE of Shaanxi shows significant H-H aggregation in 2000, 2005, 2010 and 2015 (p < 0.05), significant L-H aggregation in 2000 (Shandong, p < 0.001) and 2005 (Gansu, p < 0.01), and significant H-L aggregation in 2015 (Sichuan, p < 0.05).
(3)
The AWRAE has been continuously improved in the Yellow River Basin with the Techch and Effch promoting the improvement while the Pech restricting the improvement. The AWRAE is mainly restricted by the Effch in Qinghai, Sichuan, Gansu, Ningxia and Shandong. In addition, the Pech are all less than 1 in Sichuan, Ningxia and Shandong, which are restricted by the pure technical efficiency. The Tfpch and Techch have a large change range during 2000–2020 and the trends are basically the same, while the Effch, Pech and Sech showed relatively small changes.
(4)
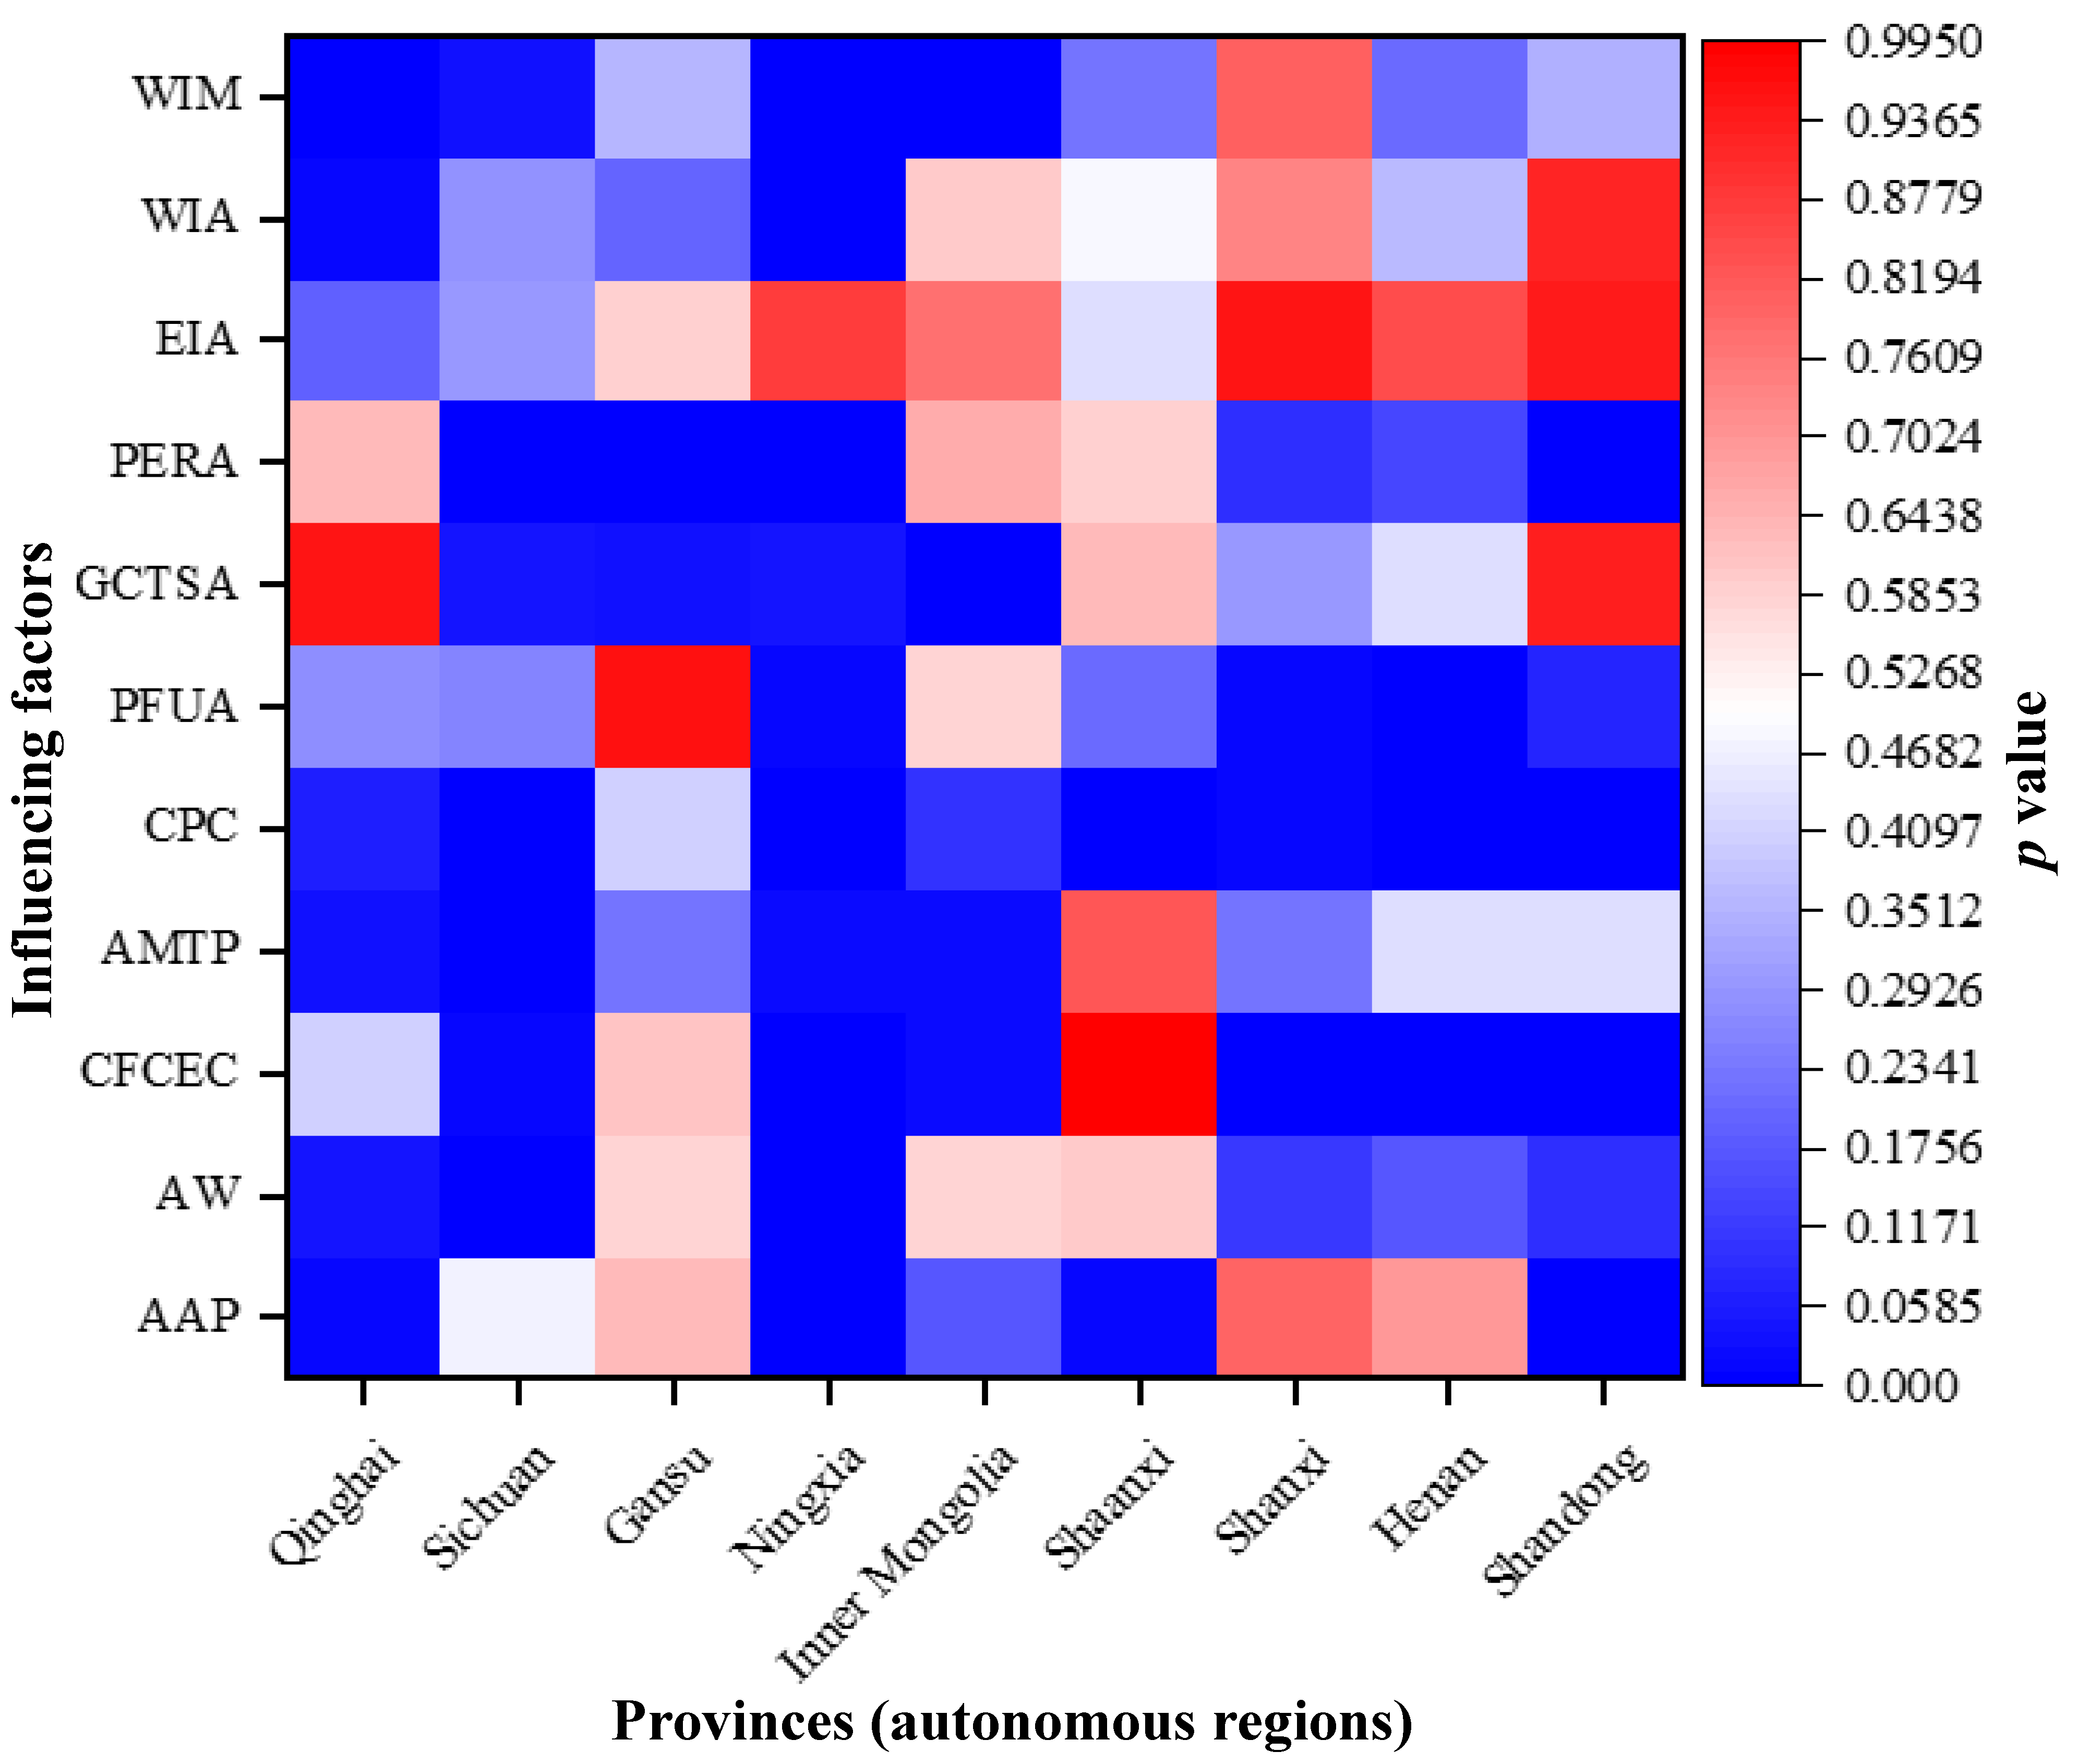
The influencing factors of the AWRAE in different provinces and autonomous regions are significantly different; for example, in Qinghai Province, the AMTP has a significant positive effect on the AWRAE, while the AAP, AW, WIA and WIM have significant negative effects. For Shandong, the AAP, CFCEC, CPC and PERA all have significant negative impacts on the AWRAE.
(5)
Due to the multiple impacts of the policies, economic development level, agricultural development level, total water resources and population pressure in the provinces and autonomous regions, the AWRAE is characterized by temporal and spatial differences in the Yellow River Basin; therefore, it is necessary to clearly understand the internal and external factors that affect the total factor productivity of the AWRAE and then take targeted measures to improve the AWRAE in the Yellow River Basin.

Author Contributions

All authors contributed to the study conception and design. Y.Z.: Project administration, Data curation, Funding acquisition, Methodology, Writing—original draft; C.G.: Project administration, Visualization, Validation, Writing—editing; C.L.: Project administration, Validation, Writing—review; P.L.: Writing—review; X.C.: Writing—review, Supervision; Z.L.: Project administration, Methodology, Editing. All authors have read and agreed to the published version of the manuscript.

Funding

This work was supported by the Strategic Priority Research Program of the Chinese Academy of Sciences (grant number XDA23040304 to C.L.); the Guangdong–Hong Kong Joint Laboratory for Water Security (grant number 2020B1212030005 to Y.Z. and C.G.); the Key R&D and promotion projects (Scientific and technological project) in Henan Province, China (grant number 212102310484 to Z.L.); the Basic and Applied Basic Research Foundation of Guangdong Province (grant number 2021A1515110410 and 2023A1515010972 to C.G.); the Central Public-interest Scientific Institution Basal Research Fund (grant number IFI2023-16 to Y.Z., FIRI20210105 to Z.L. and Y2023PT08 to Z.L.).

Data Availability Statement

The original contributions presented in the study are included in the article; further inquiries can be directed to the corresponding authors.

Conflicts of Interest

The authors declare no conflict of interest.

References

  1. Hao, M.; Duan, L.Q.; Chen, C.Y.; Liang, L.T.; Pan, T. Differences in agricultural water use efficiency and its influencing factors between Yellow River Basin and Yangtze River Economic Belt. J. Soil Water Conserv. 2022, 4, 267–277. (In Chinese) [Google Scholar]
  2. Yin, X.; Liu, X.G.; Zhang, Y.; Geng, H.Z.; Yang, Q.L.; Yang, J.R. Efficiency evaluation of agricultural water resources in Yunnan province based on Projection Pursuit model. Bull. Soil Water Conserv. 2013, 5, 271–275. (In Chinese) [Google Scholar]
  3. Liu, X.Z.; Li, W.C.; Zhao, Z.Y.; Wang, X.; Wang, S.; Dong, Y.P. Evaluation of agricultural water resources utilization efficiency in Ningxia based on Projection Pursuit. Water Sav. Irrig. 2017, 11, 46–51. (In Chinese) [Google Scholar]
  4. Wang, J.P.; Liu, G.Y.; Zhu, M.L. Measurement and influential factors of irrigation water use efficiency in Xinjiang. Water Sav. Irrig. 2016, 1, 63–67. (In Chinese) [Google Scholar]
  5. Chen, S.Y.; Cheng, H.M.; Yu, G.J.; Tian, W. Study on technical efficiency and coupling relationship of Guangxi agricultural water resources utilization based on Panel Data Stochastic Frontier Model. Acta Agric. Jiangxi 2019, 7, 117–123. (In Chinese) [Google Scholar]
  6. Cui, Y.; Wu, L.M.; Qu, J.H.; Ma, Y.M. Measurement of the efficiency of agricultural water resources production and allocation of Henan Province. J. Henan Agric. Univ. 2014, 4, 501–504. (In Chinese) [Google Scholar]
  7. Li, M.D. Regionalization of agricultural water use efficiency based on DEA method. Chin. J. Agric. Resour. Reg. Plan. 2017, 9, 106–114. (In Chinese) [Google Scholar]
  8. Li, S.Y.; Liu, X.B. Study on utilization efficiency of agricultural water resources in the Beijing-Tianjin-Hebei Region based on DEA model. Tianjin Agric. Sci. 2021, 9, 69–74. (In Chinese) [Google Scholar]
  9. Du, S.; Liang, Y.Q.; Zhang, M.; An, X.Y.; Wang, H. A study on spatio-temporal differentiation characteristic and influencing factors of agricultural water resource utilization efficiency in Hebei Province. Water Sav. Irrig. 2021, 6, 74–80. (In Chinese) [Google Scholar]
  10. Lu, Q.Z.; Lu, G.J.; Fan, Z.L.; Mo, L.Y. A study on utilization efficiency of agricultural water resources and its influential factors in Guangxi based on Global Super-Efficiency DEA and Tobit Model. Water Sav. Irrig. 2018, 8, 54–58. (In Chinese) [Google Scholar]
  11. Liu, Y.; Du, J. An empirical analysis of agricultural water utilization efficiency in Hubei Province. China Rural Water Hydropower 2011, 1, 37–39. (In Chinese) [Google Scholar]
  12. Miao, X.F.; Li, A.; Yu, Y.M.; Su, M. Evaluation and spatiotemporal evolution of agricultural water use efficiency in the Yangtze River Economic Belt—Based on SBM-Malmquist model. Hubei Agric. Sci. 2023, 4, 69–76. (In Chinese) [Google Scholar]
  13. Lu, W.N.; Guo, X.Y.; Liu, W.X.; Du, R.R.; Chi, S.Y.; Zhou, B.Y. Spatial-temporal dynamic evolution and influencing factors of green efficiency of agricultural water use in the Yellow River Basin, China. Water 2022, 1, 143. [Google Scholar] [CrossRef]
  14. Zhang, S.J.; Liu, J.; Li, C.Z.; Yu, F.L.; Jing, L.S.; Chen, W.F. Evaluation of water resources utilization efficiency based on DEA and AHP under climate change. Water 2023, 4, 718. [Google Scholar] [CrossRef]
  15. Zhao, L.P.; Li, D.J.; Hou, D.L.; Li, J.L. Tempo-spatial variations of agricultural water use efficiency measurements in Hubei Province from 2003 to 2016. J. Water Resour. Water Eng. 2020, 5, 240–247. (In Chinese) [Google Scholar]
  16. Zhao, Y.T.; Wang, Y.Y. An empirical analysis of agricultural water resources utilization efficiency in Gansu Province along the Yellow River based on DEA-Malmquist index method. J. Lanzhou Jiaotong Univ. 2022, 1, 105–111. (In Chinese) [Google Scholar]
  17. Wang, W.; Elahi, E.; Sun, S.Y.; Tong, X.Q.; Zhang, Z.S.; Abro, M.I. Factors influencing water use efficiency in agriculture: A Case Study of Shaanxi, China. Sustainability 2023, 3, 2157. [Google Scholar] [CrossRef]
  18. Zhang, H.T.; Zhou, Y.X.; Wang, X.J. Research on agricultural water use efficiency in Shandong Province based on DEA-Malmquist Model. J. Shandong Agric. Univ. Soc. Sci. Ed. 2023, 1, 47–53. (In Chinese) [Google Scholar]
  19. Dong, H.G.; Geng, J.; Xu, Y. Receiving robust analysis of spatial and temporary variation of agricultural water use efficiency while considering environmental factors: On the evaluation of data Envelopment Analysis Technique. Sustainability 2023, 5, 3926. [Google Scholar] [CrossRef]
  20. Song, M.L.; Wang, R.; Zeng, X.Q. Water resources utilization efficiency and influence factors under environmental restrictions. J. Clean. Prod. 2018, 184, 611–621. [Google Scholar] [CrossRef]
  21. Cui, Y.Z.; Liu, T. Research on the measurement and influencing factors of agricultural water total factor productivity in the Yellow River Basin. China Rural Water Hydropower 2021, 6, 126–129+136. (In Chinese) [Google Scholar]
  22. Liu, Y.; Song, Y. Evaluation and influencing factor analysis of agricultural water resource efficiency in China based on Super-efficiency SBM Model. China Rural Water Hydropower 2019, 1, 102–107. (In Chinese) [Google Scholar]
  23. Wang, F.T.; Yu, C.; Xiong, L.C.; Chang, Y. How can agricultural water use efficiency be promoted in China? A spatial-temporal analysis. Resour. Conserv. Recycl. 2019, 145, 411–418. [Google Scholar] [CrossRef]
  24. Su, X.L. Advance of optimal allocation of water resources in agriculture: A Review. J. Irrig. Drain. 2022, 7, 1–7+34. (In Chinese) [Google Scholar]
  25. Peng, L.; Deng, W.; Tan, J.; Lin, L. Restriction of economic development in the Hengduan Mountains Area by land and water resources. Acta Geogr. Sin. 2020, 9, 1996–2008. (In Chinese) [Google Scholar]
  26. Jin, T. The adjustment of China’s grain cropping structure and its effect on the consumption of water and land resources. J. Nat. Resour. 2019, 1, 14–25. (In Chinese) [Google Scholar] [CrossRef]
  27. Zhang, Z.Y.; Tian, M.H.; Li, J.J.; Wang, F.; Ma, S. Analysis and research on the value of farmland transfer based on environmental protection evaluation system. IOP Conf. Ser. Earth Environ. Sci. 2021, 4, 042013. [Google Scholar] [CrossRef]
  28. Yang, H.Y.; Zhao, H.F. Analysis of spatio-temporal characteristics and effects of land and water resources matching under cultivated land structure change: A case study of Heilongjiang province. J. Nat. Resour. 2022, 9, 2247–2263. (In Chinese) [Google Scholar] [CrossRef]
  29. Kuang, Y.P.; Yang, P.Y. Analysis on allocation efficiency of land and water resources for grain and its influencing factors in China. Bull. Soil Water Conserv. 2023; accepted. (In Chinese). [Google Scholar] [CrossRef]
  30. Bai, F.F.; Qi, X.B.; Qiao, D.M.; Han, Y.; Zhao, Y.L.; Lu, H.F. Evaluation of Agricultural Water Resource Utilization Efficiency and Obstacle Factor Diagnoses in Provinces of the Yellow River Basin. J. Soil Water Conserv. 2022, 3, 146–152. (In Chinese) [Google Scholar]
  31. Tone, K.A. A slacks-based measure of efficiency in data envelopment analysis. Eur. J. Oper. Res. 2001, 3, 498–509. [Google Scholar] [CrossRef]
  32. Wang, Y.; Feng, J.H. Measurement and analysis of provincial green development efficiency in China-Based on the Super-efficiency SBM-Malmquist Model. J. Heilongjiang Vocat. Inst. Ecol. Eng. 2023, 3, 7–12. (In Chinese) [Google Scholar]
  33. Wang, C.H.; Gong, W.F.; Zhao, M.Z.; Zhou, Y.L.; Zhao, Y. Spatio-temporal evolution characteristics of eco-efficiency in the Yellow River Basin of China based on the super-efficient SBM model. Environ. Sci. Pollut. Res. 2023, 30, 72236–72247. [Google Scholar] [CrossRef] [PubMed]
  34. Zhang, W.J.; Xu, N.; Li, C.Y.; Cui, X.H.; Zhang, H.; Chen, W.X. Impact of digital input on enterprise green productivity: Micro evidence from the Chinese manufacturing industry. J. Clean. Prod. 2023, 414, 137272. [Google Scholar] [CrossRef]
  35. Xiao, Y.M.; Long, Q. Analysis on forestry eco-efficiency in Yunnan Province Based on DEA-SBM and Malmquist Model. J. Anhui Agric. Sci. 2023, 7, 142–145, 153. (In Chinese) [Google Scholar]
  36. Zhang, H.; Sun, Y.Q.; Fan, Z.Y.; Long, Z.; Wan, S.L.; Zhang, Z.L.; Chen, X.P. Analysis of county-scale eco-efficiency and spatiotemporal characteristics in China. Land 2023, 2, 438. [Google Scholar] [CrossRef]
  37. Ma, X.L. Study on temporal evolution and spatial reconstruction of crop virtual water in Jilin Province. Res. Soil Water Conserv. 2022, 2, 304–329. (In Chinese) [Google Scholar]
  38. Liu, W.; Li, H.X.; Xu, H.; Zhang, X.T.; Xie, Y.C. Spatiotemporal distribution and driving factors of regional green spaces during rapid urbanization in Nanjing metropolitan area, China. Ecol. Indic. 2023, 148, 110058. [Google Scholar] [CrossRef]
  39. Cheng, Y.; Wang, J.J.; Wang, Y.P.; Ren, J.L. A comparative research of the spatial-temporal evolution track and influence mechanism of green development in China. Geogr. Res. 2019, 11, 2745–2765. (In Chinese) [Google Scholar]
  40. Zhang, Y.; Wang, F.Y.; Du, Z.J.; Dou, M.; Liang, Z.J.; Gao, Y.; Li, P. Spatio-temporal distribution characteristics and driving factors of main grain crop water productivity in the Yellow River Basin. Plants 2023, 12, 580. [Google Scholar] [CrossRef]
  41. Liao, J.J.; Yu, C.Y.; Feng, Z.; Zhao, H.F.; Wu, K.N.; Ma, X.Y. Spatial differentiation characteristics and driving factors of agricultural eco-efficiency in Chinese Provinces from the perspective of ecosystem services. J. Clean. Prod. 2021, 288, 125466. [Google Scholar] [CrossRef]
  42. Zhang, Q. Analysis on the impact of industrial agglomeration on green development efficiency of cultural manufacturing industry based on Super-efficiency SBM-Malmquist-Tobit Model. J. Chuzhou Univ. 2023, 1, 39–51. (In Chinese) [Google Scholar]
  43. He, W.X.; Fu, J.H.; Luo, Y.X. A study of well-being-based eco-efficiency based on Super-SBM and Tobit Regression Model: The case of China. Soc. Indic. Res. 2023, 167, 289–317. [Google Scholar] [CrossRef]
  44. Zuo, Q.T.; Wang, P.K.; Zhang, Z.Z.; Wu, Q.S. Utilization level and improvement approach of water resources in the Yellow River Basin. J. Zhengzhou Univ. Eng. Sci. 2023, 3, 12–19. [Google Scholar]
  45. Yu, F.W.; Fang, L. Several issues on ecological protection and high-quality development of the Yellow River Basin. China Soft Sci. 2020, 6, 85–95. (In Chinese) [Google Scholar]
  46. Liu, C.M. Understanding of ecological protection and high quality development in the Yellow River Basin. Yellow River 2019, 10, 158. (In Chinese) [Google Scholar]
  47. Jin, F.J. Coordinated promotion strategy of ecological protection and high quality development in the Yellow River Basin. Reform 2019, 11, 33–39. (In Chinese) [Google Scholar]
  48. Kang, S.Z. National water conservation initiative for promoting water-adapted and green agriculture and highly-efficient water use. China Water Resour. 2019, 13, 1–6. (In Chinese) [Google Scholar]
  49. Qi, X.B.; Li, P.; Bai, F.F.; Zhang, Y.; She, Y.J.; Ma, C.C. Effect of climate change on water resource allocation to irrigation: A Review. J. Irrig. Drain. 2022, 8, 1–8. (In Chinese) [Google Scholar]
  50. Zhang, J.Y. Action of national water conservation highlights impact of climate change. China Water Resour. 2018, 6, 11–13. (In Chinese) [Google Scholar]
Figure 1. Spatial distribution map of nine provinces (autonomous regions) in the Yellow River Basin.
Agronomy 13 02449 g001
Figure 2. Evaluation framework of the AWRAE and driving factors.
Agronomy 13 02449 g002
Figure 3. Heat map of the AWRAE in the Yellow River Basin from 2000 to 2020.
Agronomy 13 02449 g003
Figure 4. Spatial distribution of the change trends of the AWRAE in the Yellow River Basin from 2000 to 2020.
Agronomy 13 02449 g004
Figure 5. Gravity center shift of the AWRAE in the Yellow River Basin for the periods of 2000–2020.
Agronomy 13 02449 g005
Figure 6. LISA Cluster Diagram and significance of the AWRAE in the Yellow River Basin (2000, 2005, 2010, 2015 and 2020).
Agronomy 13 02449 g006
Figure 7. Average Malmquist index and decompositions of the AWRAE in the Yellow River Basin from 2000 to 2020.
Agronomy 13 02449 g007
Figure 8. Total Malmquist index and decompositions of the AWRAE in nine provinces (autonomous regions).
Agronomy 13 02449 g008aAgronomy 13 02449 g008bAgronomy 13 02449 g008c
Figure 9. Regression coefficients of Tobit regression analysis between the AWRAE and influencing factors in nine provinces (autonomous regions).
Agronomy 13 02449 g009
Figure 10. Significance of Tobit regression analysis between the AWRAE and influencing factors in nine provinces (autonomous regions) (p-value).
Agronomy 13 02449 g010
Table 1. The evaluation system indicators of the AWRAE.
NumberIndicator ClassificationNameAbbreviationUnit
1Input indicatorWater resource conditionsannual average precipitationAAPmm
2agricultural waterAW108 m3
3Production conditionsconsumption of chemical fertilizer by 100% effective componentCFCEC10,000 tons
4total power of agricultural machineryAMTP10,000 kw
5consumption of chemical pesticidesCPCton
6plastic film use for agriculturalPFUAton
7total sown area of grain cropsGCTSA1000 hectares
8persons engaged in rural areaPERA10,000 person
9Water saving conditionseffective irrigated areaEIA1000 hectares
10water saving irrigated areaWIA1000 hectares
11water saving irrigation machineryWIM10,000 units
12Output indicatorgrain yieldGY10,000 tons
13total agricultural output valueTAOVRMB 100 million
Table 2. The standard deviation ellipse parameter of the AWRAE in the Yellow River Basin for the periods of 2000–2020.
YearCoordinates of Gravity CenterLong Axis/kmShort Axis/kmAzimuth Angle/°Deviation Rate
LongitudeLatitude
2000107°49′53″ E36°16′08″ N862.686498.53773.6710.422
2005107°14′58″ E36°10′58″ N884.046453.66373.9560.487
2010108°37′10″ E35°59′43″ N900.533461.75573.1160.487
2015108°54′00″ E36°18′07″ N913.902478.94374.1180.476
2020108°19′36″ E36°24′55″ N970.892458.74677.7200.528
Table 3. Likelihood ratio test of Tobit regression model.
Provinces (Autonomous Regions)Model−2 Times the Logarithmic LikelihoodChi-Square
Value
pAICBIC
QinghaiIntercept−2.925
Final model−25.19322.2680.022−1.19311.342
SichuanIntercept−37.221
Final model−62.35725.1360.009−38.357−25.823
GansuIntercept−10.209
Final model−25.82315.6140.036−1.82310.711
NingxiaIntercept−17.486
Final model−63.32545.8390.000−39.325−26.791
Inner MongoliaIntercept−8.333
Final model−33.58225.2490.008−9.5822.952
ShaanxiIntercept−33.963
Final model−58.98725.0240.009−34.987−22.453
ShanxiIntercept4.256
Final model−28.17532.4320.001−4.1758.359
HenanIntercept12.61
Final model−65.83378.4430.000−41.833−29.299
ShandongIntercept−3.101
Final model−104.395101.2940.000−80.395−67.86
Disclaimer/Publisher’s Note: The statements, opinions and data contained in all publications are solely those of the individual author(s) and contributor(s) and not of MDPI and/or the editor(s). MDPI and/or the editor(s) disclaim responsibility for any injury to people or property resulting from any ideas, methods, instructions or products referred to in the content.

