1. Introduction
Biochar, over the last two decades, has become the focal point of agro-environmental research given its unique functionality, cost-effectiveness, and recyclability potential [
1,
2,
3]. The addition of biochar to agricultural systems has been shown to lead to 10–30% increases in crop biomass [
4,
5], with greater increases reported for pioneer herbaceous plant species (30–37%) [
6] and woody plants (c. 41%) [
7]. These impacts on productivity are likely due to the effects of biochar on soil and rhizosphere conditions, such as increases in available phosphorous (P) and microbial biomass of agricultural soils [
8], greater cation exchange capacity, pH, the content of total and organic C and total nitrogen (N), and C/N ratios in agricultural soils on a global scale [
9], and increases in annual plant root P concentrations and numbers of root-associated microbes and root nodules [
10].
Fertilizers are the main factor for plants’ growth, and nitrogen (N), especially, is an essential element; it determines the crops’ yield, growth, and health. Long-term application of nitrogen fertilizer adversely degrades soil and decreases crop yield. Biochar amendment with N fertilizer can not only increase yield but also improve the soil.
As an important grain crop-producing area in Xinjiang, the North Xinjiang irrigated area is also facing the problem of excessive application of nitrogen fertilizer to pursue high yield, which leads to a decrease in nitrogen fertilizer utilization efficiency and increasingly serious environmental problems. Therefore, it is of great significance to increase the ability of soil fertility preservation and promote crop stability and high yields by adding exogenous substances. In prior reports, biochar application has been proposed as a major determinant of soil quality, such that it may be an effective means of enhancing soil quality and sustaining crop production, particularly in semi-arid and arid regions [
11,
12,
13].
In an effort to better understand the effects of biochar application on soil quality and crop yields, a field experiment was conducted with the following goals: (i) to determine which soil environmental factors are the most important indexes affecting wheat yield under biochar combined with nitrogen reduction; (ii) to identify the soil fertilization effect of biochar combined with nitrogen reduction to explore their best-combined application amount. So far, there are few reports to comprehensively evaluate the effect of biochar combined with nitrogen reduction in semi-arid regions from the physical, chemical, and biological perspectives using statistical methods. The results of these analyses will provide new insight regarding the feasibility and value of biochar application in irrigated agricultural regions in Xinjiang, China.
2. Materials and Methods
2.1. Site Description
This study was performed at the Qitai Wheat Test Station in Xinjiang (longitude 89°13′ to 91°22′ east, latitude 42°25′ to 45°29′ N). Qitai has a temperate continental climate, with a mean annual temperature of 5.5 °C, a mean temperature in July of 22.6 °C, a maximum temperature of 39 °C, a mean temperature in January of −18.9 °C, and a minimum temperature of −37.3 °C during the study period. The average annual relative humidity is 60%, and the mean frost-free season is 153 days, spanning from late April to early October. The area revealed an average of 269.4 mm of precipitation annually. The soil at the test site was of a sandy loam variety, with a soil organic matter content (0–20 cm) of 15.15 g kg−1, a total nitrogen level of 0.93 g kg−1, an available phosphorus level of 7.10 mg kg−1, an available potassium level of 35.1 mg kg−1, and a pH of 8.25.
2.2. Study Design
The field experiment was conducted with the nitrogen fertilizer applied at rates of 0, 150, 300 kg·hm−2, which was applied a single time in the form of urea (46% pure nitrogen) as local farmers did. The biochar added at rates of 0, 30 × 103 kg·hm−2 as soil amendment was spread on the surface, thoroughly mixed with the soil, and then plowed to a depth of over 20 cm. No more biochar was amended in the subsequent year. Thus, there were six treatments, including CK (0 kg·hm−2 biochar with 0 nitrogen fertilizer), B (30 × 103 kg·hm−2 biochar), N1 (150 kg·hm−2 nitrogen fertilizer), N2 (300 kg·hm−2 nitrogen fertilizer), BN1 (30 × 103 kg·hm−2 biochar with 150 kg·hm−2 nitrogen fertilizer), and BN2 (30 × 103 kg·hm−2 biochar with 300 kg·hm−2 nitrogen fertilizer), which were 18 plots in total (3 nitrogen treatment × 2 biochar dosage × 3 replicate). Each plot was 3 m ×3 m in area, and the plots were arranged in a randomized complete block design. Strip sowing was performed for wheat sowing at a planting density of 4.5 million plant hm−2 with equal row spacing (20 cm). For wheat production, conventional farm management was consistently performed.
The cotton stalk biochar used for this study was obtained from the Xinjiang Academy of Agricultural Sciences. This biochar was prepared via carbonization for 4 h at 450 °C and had a particle size of 1.5–2.0 mm, a H/C of 0.52, a pH of 9.37, total nitrogen content of 21.76 g kg−1, total phosphorus of 10.58 g kg−1, total potassium of 21.45 g kg−1, available nitrogen of 5.38 mg kg−1, and available phosphorus of 200.94 mg kg−1 (data unpublished). The spring wheat variety used for this study was “Xindong 22”, a main winter wheat species in northern Xinjiang. It was sown on 27 September 2020, and harvested on 15 July 2021.
2.3. Sampling and Analysis of Soil and Crop
Crop yield: Wheat was hand-harvested. Seed yield was calculated using 6% as the standard seed moisture content.
Soil indices: After the wheat harvest, soil samples were collected from all plots. Five sampling points were randomly selected within each plot from a 20.0 cm depth of soil layer. All soil cores from each point were put in a plastic bag and thoroughly bulked, crumbled, and mixed for physical, chemical, and biological analyses. By dividing each soil sample into two subsamples, one subsample was ground, passed through a 2 mm sieve, and air-dried for the determination of organic carbon components and soil nutrient content, and another one was ground, passed through a 2 mm sieve, and stored in a refrigerator at −20 °C for the analysis of the structural and functional characteristics of the soil microbial community.
For the determination of soil basic physicochemical properties, the soil organic matter was measured using the potassium dichromate (Xilong Scientific Co., Ltd.Guangdong, China)wet combustion procedure in an externally heated oil bath (180 °C, boiling for 5 min) [
14]. Total nitrogen was determined using the semi-micro-Kjeldahl method (digestion with 5 mL concentrated H
2SO
4 (Xilong Scientific Co., Ltd.Sichuan, China)), and available nitrogen was determined using the alkaline hydrolysis diffusion method (1.00 g of a dried soil sample was treated in a diffusion dish with 10 mL of 1.8 mol L
−1 NaOH solution) (Tianjin Zhiyuan Chemical Reagent Co., LTD, Tianjin, China). After diffusion, the sample was absorbed using 3 mL of boric acid(Windship Chemical reagent Technology Co., LTD, Tianjin, China) and titrated with 0.01 mol L
−1 of hydrochloric acid(Xilong Scientific Co., Ltd.Guangdong, China) solution [
15]. Total phosphorus was measured using the HClO
4-H
2SO
4 digestion–molybdenum antimony colorimetric method, and available phosphorus was measured using the 0.5 mol L
−1 NaHCO
3 (Tianjin Shengao Chemical Reagent Co., LTD, Tianjin, China) extraction–molybdenum antimony colorimetric method [
14]. Total potassium was determined using the sodium hydroxide fusion flame photometric method, and available potassium was determined using the ammonium acetate (Fuchen Chemical reagent factory, Tianjin, China) extraction flame photometric method [
15]. The phenol–sodium colorimetric method was adopted to measure urease. Bacterial colony-forming units were determined by the drop plate method [
16]. The functional diversity of the soil microbial community was determined using BIOLOG ECO-plates (Hayward, CA, USA) [
17].
The Shannon index (H), Simpson index (D), and evenness index (U) were calculated using the following equations:
where n is the 31 carbon sources on the ECO board; C
i and R
i are the optical density values of the microwell and the control well, respectively. P
i is the ratio of the absorbance of a particular well i to the sum of the absorbance of all 31 wells at 120 h. Average well color development (AWCD) represents the overall carbon substrate utilization potential of cultural microbial communities across all wells per plate.
2.4. Evolution of Soil Fertility
Factor analysis: Factor analysis evaluates latent variables through explicit variables, finds out a few representative comprehensive factors among multiple variables, and decreases the number of variables, thus reducing dimension. The factor analysis method is characterized by high naming clarity and comprehensive evaluation of lateral cause clarity in applications, and the extracted common factors are more explanatory than the principal components extracted by principal component analysis [
18].
Cluster analysis: Cluster analysis comprises a range of methods for classifying multivariate data into subgroups. Using the Euclidean distance as a measure of the difference in the fertility of each treatment, the shortest distance method was used to systematically cluster according to the degree of intimacy and similarity of soil fertility levels. By organizing multivariate data into such subgroups, clustering can help reveal the characteristics of any structure or pattern present [
19].
2.5. Statistical Analysis
All the statistical analyses were performed using Excel 2018 (Office Software, Inc., Beijing, China) and SPSS 22.0 (SPSS Inc., Chicago, IL, USA). The comparisons of treatment means were based on the LSD test at the p < 0.05 probability level.
4. Discussion
The application of biochar mainly changes soil physical-chemical properties, improves soil nutrient metabolism, and indirectly affects soil microbial community structure [
21,
22]. Research has found that, in contrast to no fertilization, applying biochar can increase microbe quantity. Bacteria quantity reaches its peak when the usage of biochar is 0.30% [
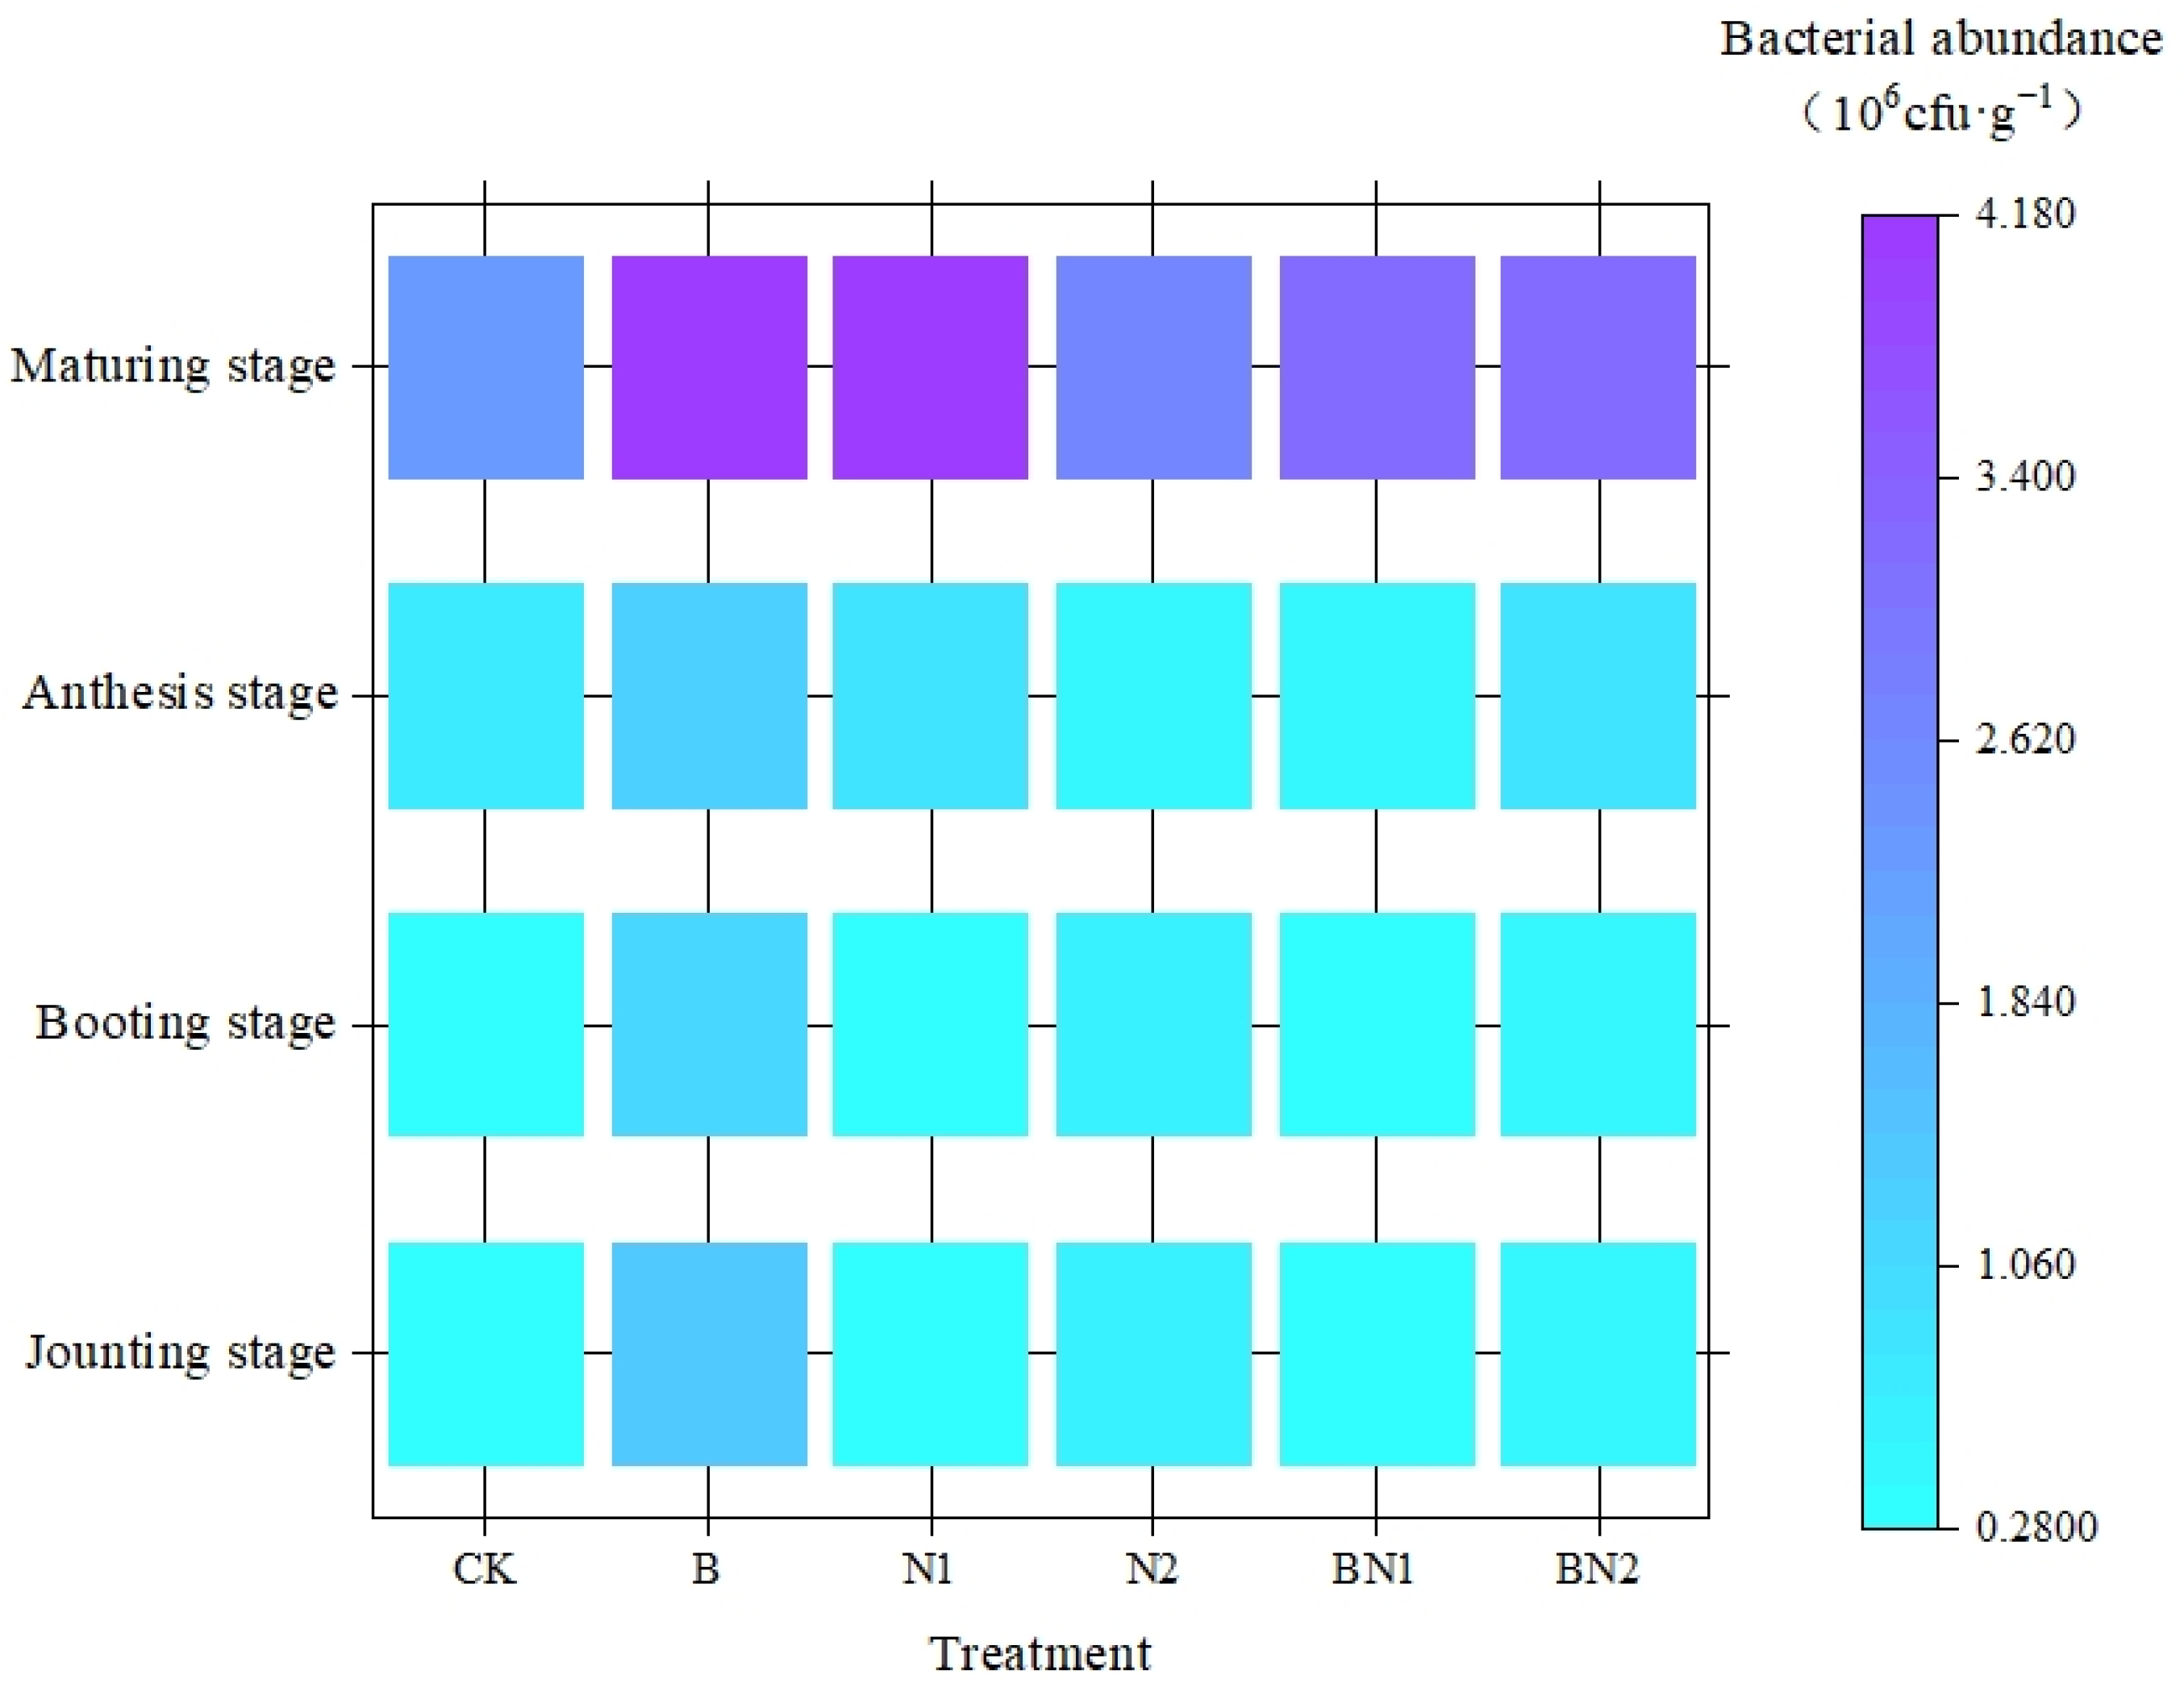
23]. This study shows that the application of biochar and nitrogen fertilizer can both increase bacterial quantity. However, the effects are influenced by the amount of nitrogen fertilizer applied and whether it is applied in combination with biochar. Due to the porous structure and large surface area of biochar, adding biochar can directly provide a suitable habitat environment for the bacterial community and a possibility for an increase in bacterial quantity [
24,
25,
26]. Meanwhile, this study also finds that adding biochar alone will inhibit urease activity, while the combined application of biochar and nitrogen fertilizer can promote urease activity. Analysis shows that carbonaceous materials in biochar are hard to decompose and thus cannot be hydrolyzed by urease quickly [
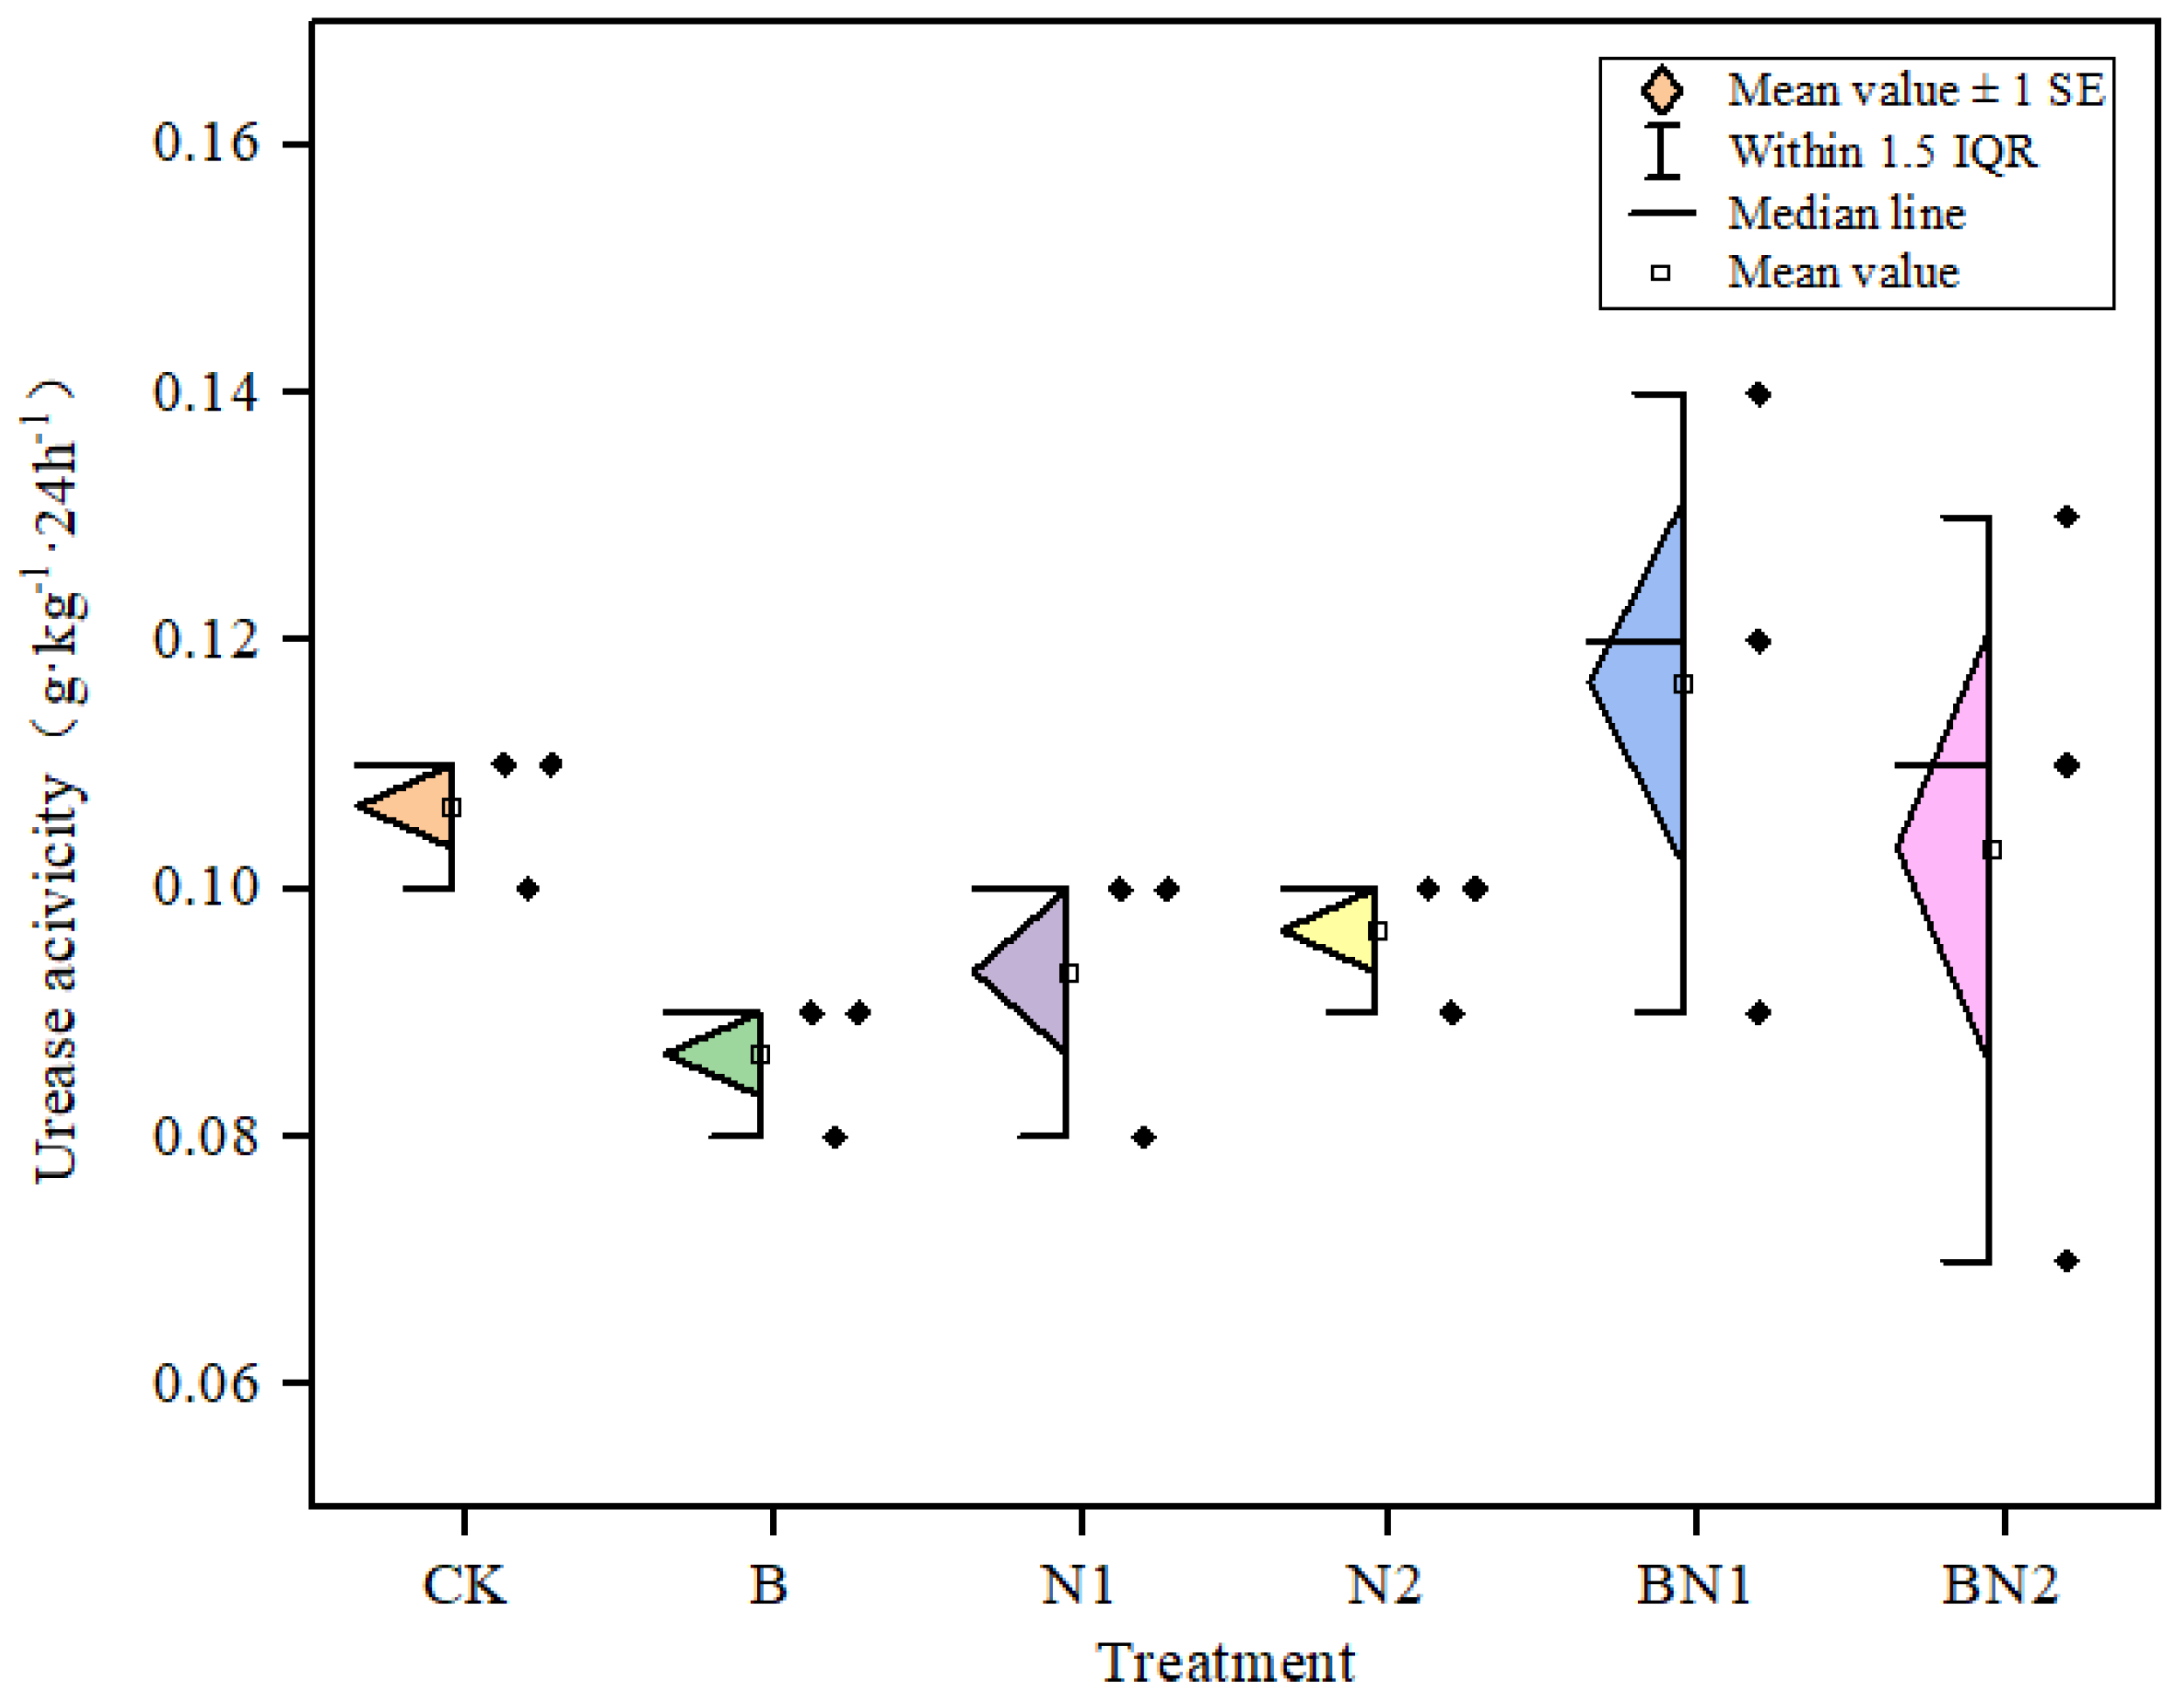
27]. It can be deduced that the regulatory effects of biochar on soil fertility are not fully exerted, and its long-term effects should be further studied.
Biochar, nitrogen fertilizer, and their combined application can enhance the metabolic activity of soil microorganisms and the metabolic capacity of soil microbial communities [
28]. The soil microbial activity is the lowest when nitrogen fertilizer is applied combined with biochar, indicating that biochar application increases the enrichment of soil organic carbon, enhances soil microbial biomass carbon, and enlarges soil C/N; thus, few parts can be directly absorbed and utilized by microorganisms, for which the processes of decomposition and mineralization of microorganisms are slow [
29,
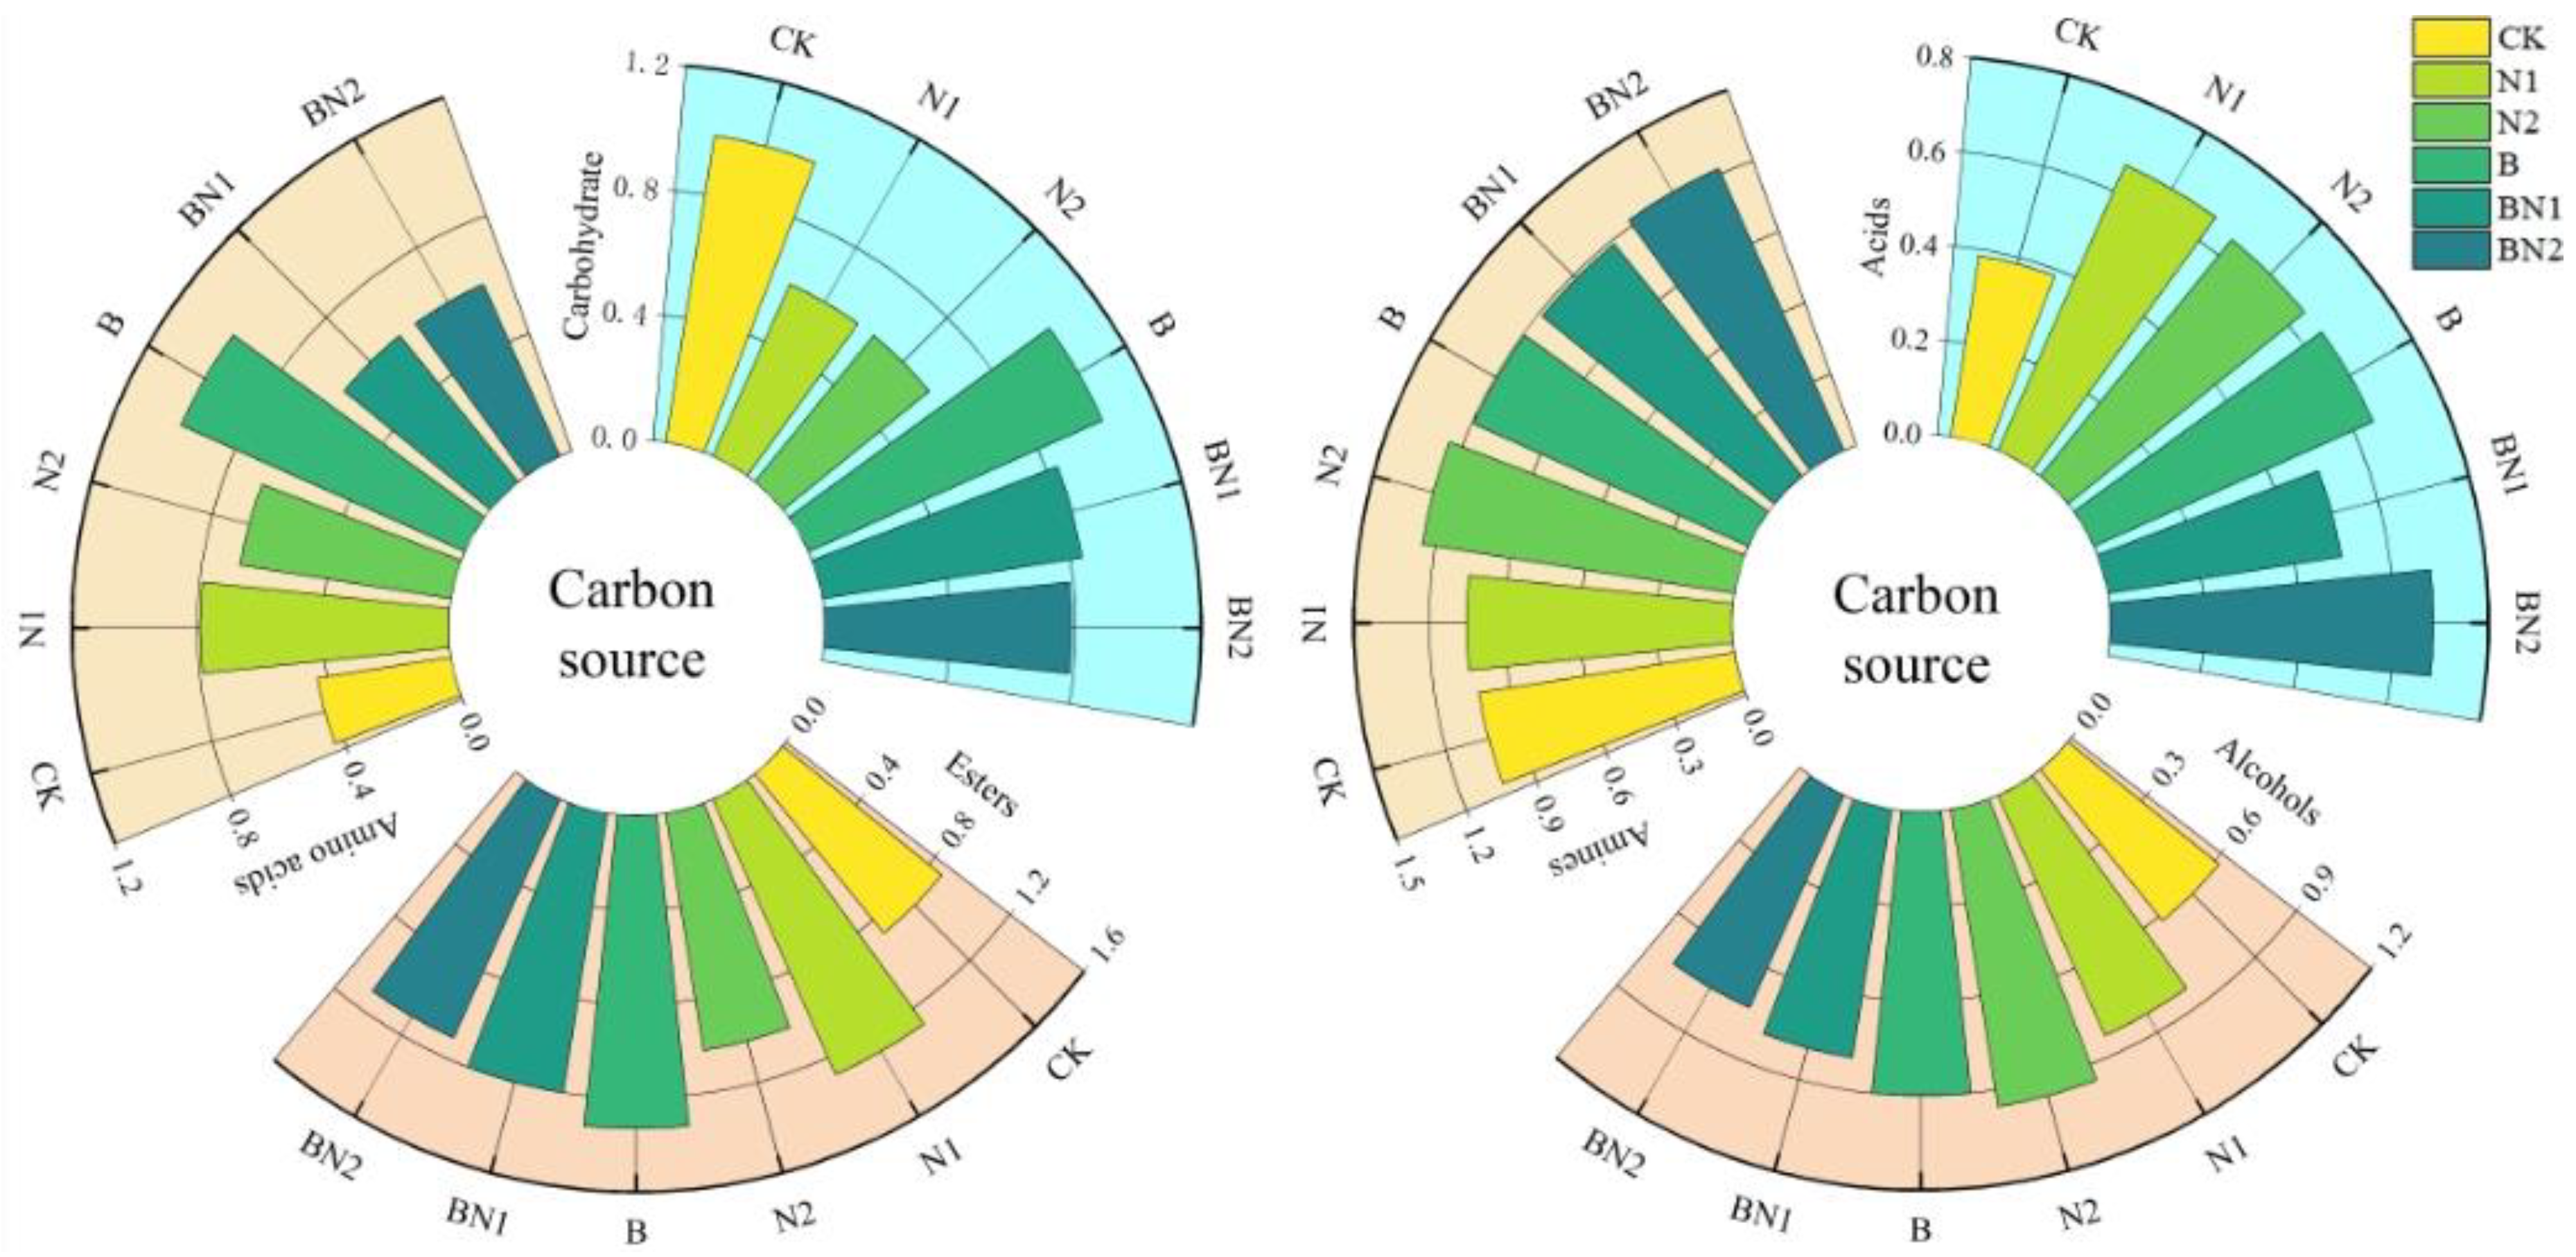
30]. The diversity of soil microorganisms is closely related to changes in soil nutrients, which will inevitably affect microbial metabolic activity. The carbon sources, which are sugars, amino acids, and esters, play a differentiation role [
31]. As shown in this study, the richness and species evenness of soil microorganisms show an upward trend under different fertilization treatments, and the utilization of different carbon sources by soil microorganisms varies under fertilization treatments. The single application of nitrogen fertilizer significantly increases the activity of saccharide metabolism. The combined application of biochar with low nitrogen (BN1) can significantly increase the ability of ester metabolism. Nitrogen fertilizer applied to the soil can quickly increase the soil nitrogen pool, promote the growth and development of most heterotrophic microorganisms, and boost saccharide metabolism [
32,
33,
34]. When nitrogen fertilizer is applied together with biochar, it can reduce the loss of nitrogen fertilizer transportation, regulate soil nitrification and denitrification, generate slow-release carriers, maintain fertility, temporarily reserve soil nutrients, increase the content of soil organic matter, and provide organic carbon sources for the absorption and utilization of microorganisms [
35,
36,
37,
38,
39,
40]. With sufficient nutrients, microorganisms have vigorous activities; therefore, they expand microbial species and promote the stability of microbial functions. Moreover, the porous structure of biochar adsorbs free nutrients, changes soil nutrient cycling, and induces the development of microbial communities with specific physiological characteristics, thus altering the metabolic pathway of soil microorganisms [
27,
41,
42].
Soil microorganisms are a critical component in soil nutrient cycling, which can promote soil nutrient cycling, improve the ability of plant organs to collect nutrients, and accelerate crop growth [
38,
43,
44,
45,
46]. When biochar is applied to the soil, it changes microbial habitat and regulates the structure of microbial communities. The structures and metabolic functions of different communities and corresponding utilization methods of carbon sources coordinate the balanced utilization of plant-root soil nutrients by soil microorganisms, promote nutrient absorption of aboveground plants, and ultimately affect yield [
47,
48,
49]. Many studies have proved that adding biochar can improve soil nutrient content [
40,
49,
50]. This study indicated that the combination of biochar and nitrogen fertilizer can increase soil organic matter content. After biochar is applied to the soil, it can replenish the organic matter that was taken away by the harvest of mature crops. It can also supplement some mineral elements, which can increase the organic matter content [
51]. As for nitrogen fertilizer, it is a kind of quick-acting nitrogen that is beneficial to the improvement of soil nutrients after being applied to the soil [
52]. Generally speaking, there is a positive correlation between soil total nitrogen content and organic matter content. The content and supply of soil nitrogen depend on the accumulation and decomposition rates of organic matter. The results of this study show that the changing trends of soil total nitrogen content and soil organic matter content are basically consistent, which is manifested by the combined application of biochar and nitrogen fertilizer (BN1 and BN2) being better than biochar treatment (B) and nitrogen fertilizer treatment (N1 and N2). The yield data of this study shows that, compared to the single application of biochar, the combined application of low nitrogen and biochar can promote dry matter accumulation after blooming and grain dry matter accumulation in winter wheat and increase yield.
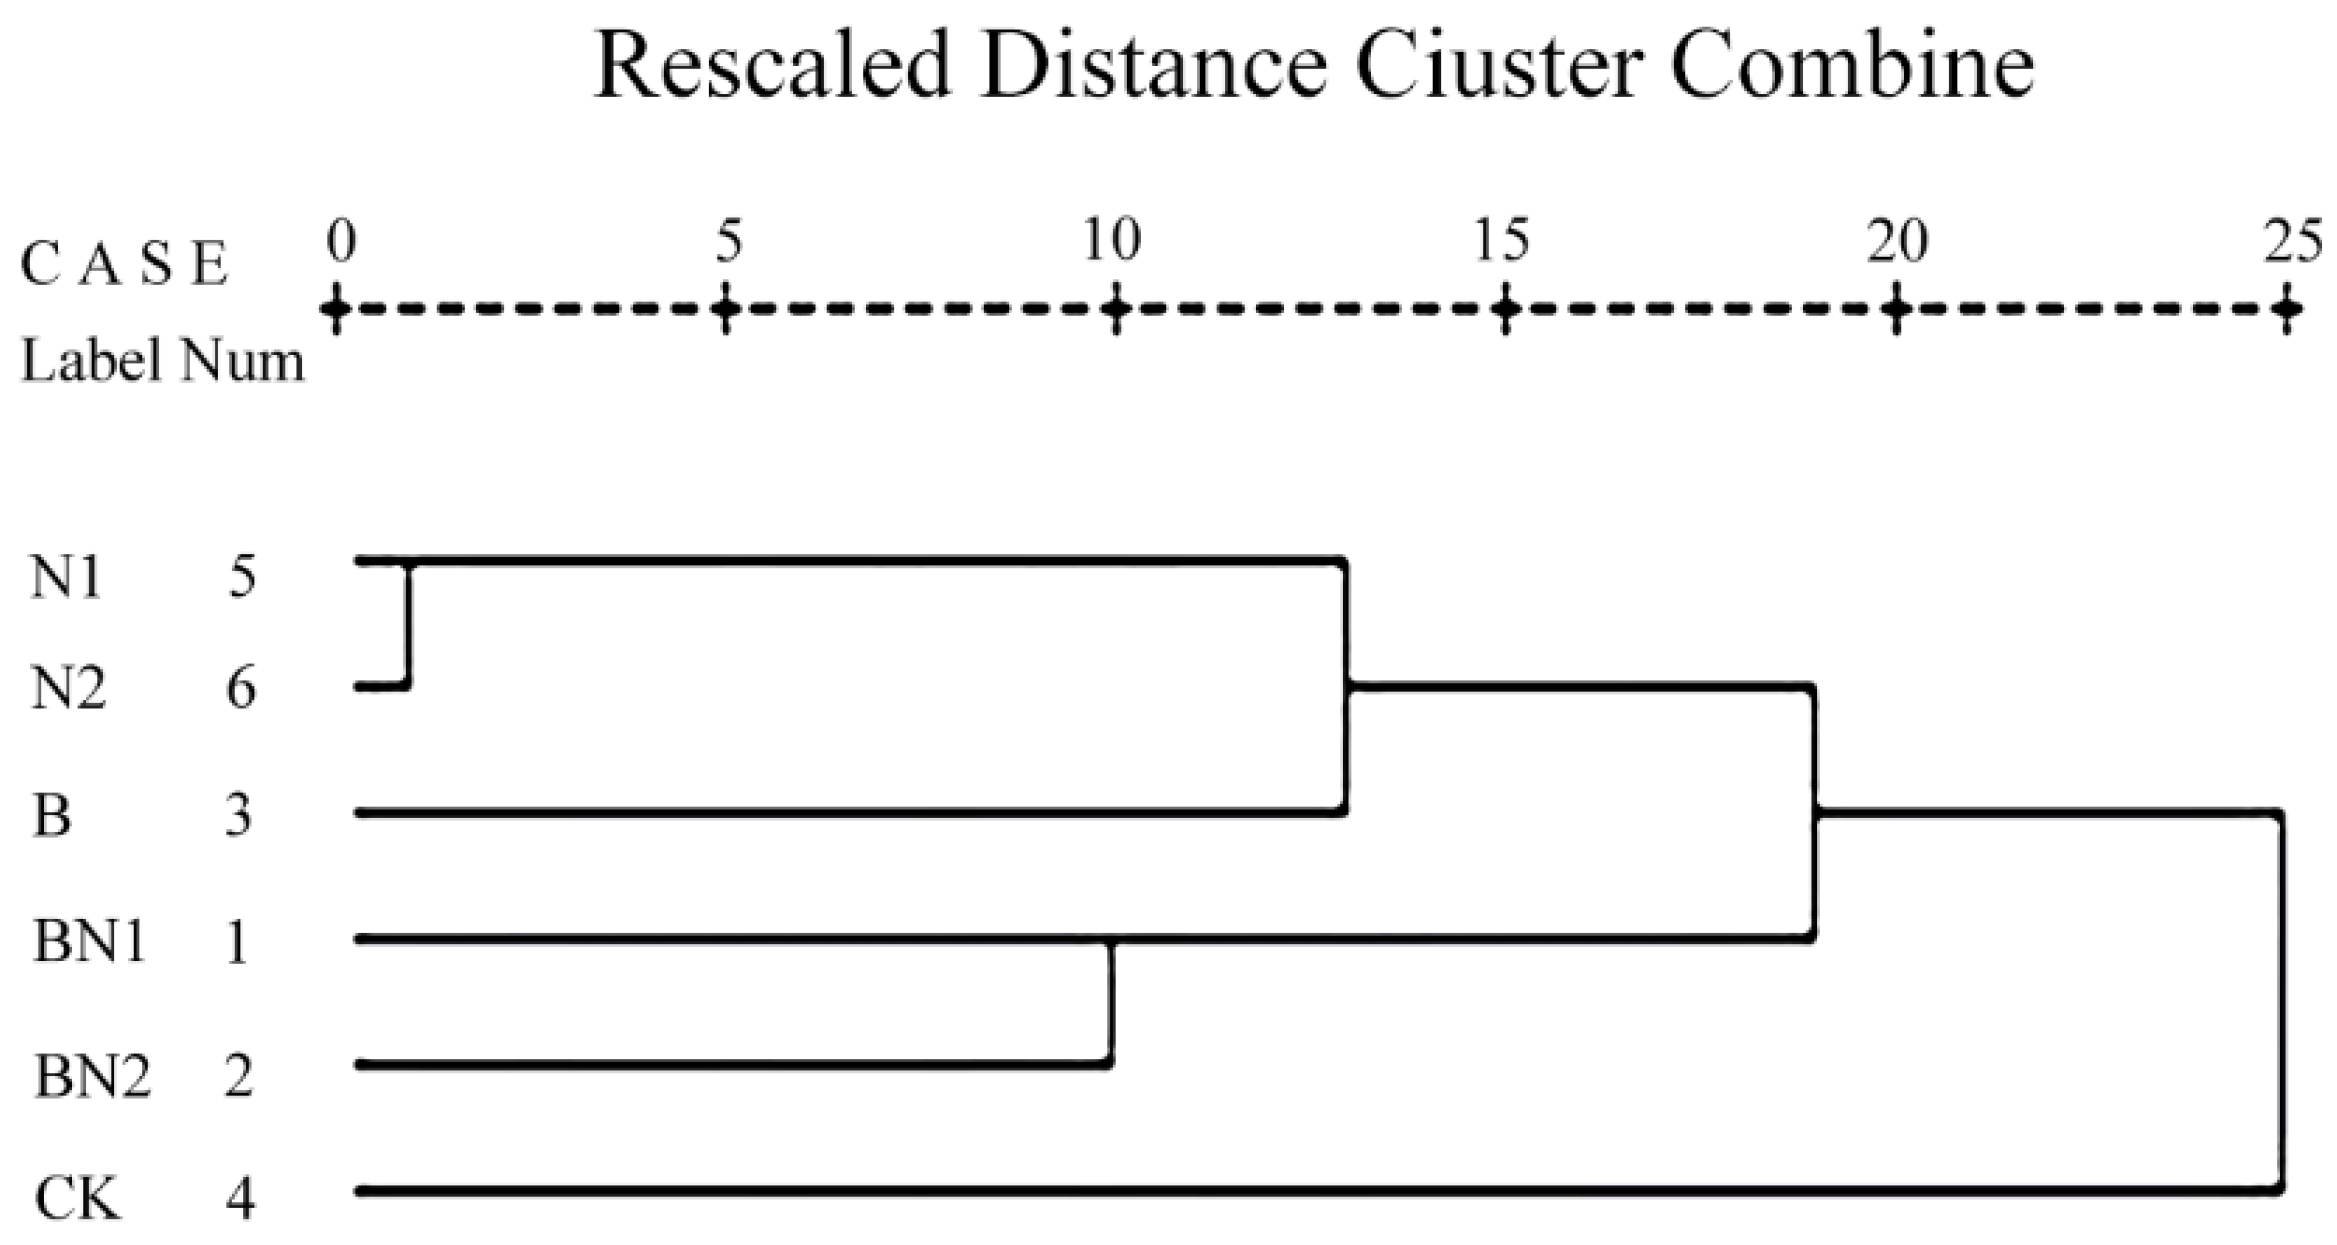
Soil quality comprehensively reflects the physical, chemical, and biological characteristics of soil, and its evaluation results can directly reflect the overall soil condition. Evaluating soil quality usually requires physical, chemical, and biological indicators of soil. This study selected soil physical, chemical, and biological properties that could represent soil quality as evaluation indicators. Factor analysis was adopted to comprehensively analyze the effects of the application of biochar and nitrogen fertilizer on wheat field soil quality. Eleven original indicators were reduced in dimension, and three common factors were extracted, with a cumulative contribution rate of 90%. Cluster analysis showed that biochar combined with nitrogen reduction brought about high soil fertility levels. This indicated that an appropriate amount of biochar and nitrogen fertilizer was beneficial to the improvement of soil fertility, being similar to reports by Nasim et al. [
53] and Veysel et al. [
54]. Generally, the yield can reflect the soil fertility to a certain extent. In this study, grain yields of BN2 were the highest, followed by other treatments at the BN1 and B levels, while the yields at the N1, N2, and CK levels were the lowest, being basically consistent with the results of cluster analysis. It was feasible to use cluster analysis to classify the soil fertility level, which was in line with objective reality and could be used as a basis for evaluating the effect of biochar combined with nitrogen reduction on soil fertility.
5. Conclusions
Available phosphorus, geometric mean diameter of water stability, fungi number, and utilization of microorganisms on sugars, amino acids, polymers, and carboxylic acids were the main soil factors affecting soil fertilization and wheat yield under biochar combined with nitrogen reduction based on factor analysis. Moreover, based on factor analysis and cluster analysis, the combined application of 30 × 103 kg·hm−2 of biochar and 150 kg hm−2 of nitrogen fertilizer had a better fertilization effect. From the perspective of comprehensive economic and environmental benefits, 30 × 103 kg·hm−2 biochar combined with 150 kg hm−2 nitrogen fertilizer was the optimal fertilization model in irrigated areas in northern Xinjiang, China, which is more advantageous for improving the soil structure of wheat fields and increasing crop yield.


