Article

Differential Physiological Responses to Different Drought Durations among a Diverse Set of Sugarcane Genotypes

1
Department of Agronomy, Faculty of Agriculture, Khon Kaen University, Khon Kaen 40002, Thailand
2
Department of Agriculture, Khon Kaen Field Crops Research Center, Khon Kaen 40000, Thailand
3
Northeast Thailand Cane and Sugar Research Center, Khon Kaen University, Khon Kaen 40002, Thailand
4
Sugar Research Station, Louisiana State University Agricultural Center, St. Gabriel, LA 70776, USA
5
Earth and Environmental Sciences, School of Agriculture, University of KwaZulu-Natal, Pietermaritzburg 3201, South Africa
6
Texas A&M AgriLife Research and Extension Center, Texas A&M University System, Weslaco, TX 78596, USA
7
Department of Agronomy, Faculty of Agriculture, Ubon Ratchatani University, Ubon Ratchatani 34190, Thailand
*
Author to whom correspondence should be addressed.
Agronomy 2023, 13(10), 2594; https://doi.org/10.3390/agronomy13102594
Submission received: 4 September 2023 / Revised: 8 October 2023 / Accepted: 8 October 2023 / Published: 11 October 2023
(This article belongs to the Section Water Use and Irrigation)

Abstract

:
Drought severely limits sugarcane productivity in many regions of the world. This study characterized physiological responses to different drought durations in a diverse set of sugarcane genotypes in two crop cycles (plant and ratoon cane). A split-plot design was used where three drought treatments, namely, no drought (SD0), short-term drought (SD1), and long-term drought (SD2), were assigned to main plots and six diverse sugarcane genotypes to subplots. Drought reduced photosynthesis, leaf area index, and biomass yield. However, the study found significant differences in physiological responses to drought among genotypes in both crops. F03-362 (F1), KK09-0358 (BC1), and KK3 (cultivar) demonstrated greater tolerance to drought by maintaining comparatively higher photosynthetic activity, while KK09-0939 (BC2) and TPJ04-768 (BC1) were more sensitive. KK3 and UT12 (cultivar) consistently maintained comparatively higher levels of photosynthesis under drought in the ratoon crop, although stomatal conductance values were comparable to those of other genotypes. Drought significantly reduced dry matter in all genotypes, but more so in the two cultivars. The study demonstrated variable levels of sensitivity to drought among diverse genotypes with different physiological responses being induced by different drought treatments. This information is useful for sugarcane production management and breeding programs.

1. Introduction

Sugarcane (Saccharum spp.), a perennial C4 grass, is one of the world’s most efficient crops capable of accumulating high yields per hectare as well as large amounts of sucrose in its culms. It is mainly cultivated in the tropical and subtropical regions of the world and is the predominant source of sugar [1]. In 2021, sugarcane was harvested from an estimated 27.8 million hectares worldwide [2]. Thailand was the fourth largest producer of sugar in 2021 (after Brazil, India, and China) and the second worldwide with respect to sugar exported [3,4].
In Thailand, sugarcane is produced under rainfed conditions where the crop is mostly dependent on unpredictable rainfall and experiences various periods of drought [1,5,6]. Planting of sugarcane in Thailand occurs toward the end of the rainy season (from October to February) [5,6,7,8], which means the young establishing crop must depend on residual soil moisture. Therefore, most of the sugarcane crops in Thailand usually experience a water deficit during one or more growth stages. The length of the drought period can vary from year to year from as short as 2 months to as long as 4 months depending on the duration of the preceding rainy season.
Drought is a leading factor known to severely limit growth, various yield components, and ultimately sugarcane productivity [9,10,11]. Depending on the genotype, severity/duration of drought, or crop growth stage [12], yield losses as high as 50 to 60% have been reported [13,14]. In sugarcane cultivation, four main growth stages are recognized, namely, (i) the germination and establishment phase, (ii) the tillering phase, (iii) the stem elongation or grand growth phase, and (iv) the ripening or maturing phase [15]. Sugarcane is particularly vulnerable to water stress during the early developmental stages [16], especially during the tillering and grand growth stages when about 70–80% of its yield is produced [17]. Drought events during early growth stages often reduce biomass and sucrose yields [16,18], and these effects can sometimes carry over to the subsequent ratoon crops [19].
The effects of prolonged water deficits on physiological and biochemical processes in plants have been widely characterized and shown to play a significant role in regulating growth, development, and productivity [8,20,21,22]. In several crops, including sugarcane, early physiological, biochemical, morphological, and developmental changes, such as stomatal conductance (gs) [23,24], transpiration rate (E) [20,21], photosynthesis (A) [16,23], leaf relative water content (RWC) [18,25], photosystem II (PSII) photochemical efficiency (Fv/Fm), leaf chlorophyll content [21,26], leaf expansion rates, average leaf area, and leaf area index (LAI) [23], have all been shown to be strongly responsive to water deficits. The magnitude and trend of the responses are species/genotype-specific. In sugarcane, the relative changes in some of these parameters have been used to distinguish between drought-sensitive and drought-tolerant genotypes [8,18]. For example, Zhao et al. [27] and Silva et al. [18] reported that water deficit stress significantly reduced gs, Fv/Fm, A, the number of tillers, and green leaf area, thereby reducing the shoot biomass of drought susceptible sugarcane genotypes. However, tolerant genotypes could maintain higher levels of Fv/Fm, SPAD index, and RWC than susceptible genotypes. Those studies provide strong evidence that different genotypes can deploy a wide range of mechanisms to cope with variable climate factors such as drought [16,28].
As global climate change continues to cause an increase in the probability of extreme weather events such as drought, it is important to understand how economically important crop commodities such as sugarcane will respond and to identify genotypes/cultivars that are resilient to such stress events. This goal is better achieved by examining diverse genotypes under conditions that mimic specific targeted environments. Characterizing variability in drought response mechanisms among diverse genotypes and understanding how these mechanisms relate to productivity is an important prerequisite for the genetic improvement of sugarcane for resilience to environmental stresses. Therefore, the goal of this study was to characterize the physiological responses of a diverse set of sugarcane genotypes subjected to short and long durations of drought conditions during the early growth stages. Specifically, the study examined the degree of variation in key physiological response variables among six diverse genotypes as a function of drought treatment and also sought to reveal the physiological basis of drought tolerance in the resilient genotypes.

2. Materials and Methods

2.1. Plant Materials, Experimental Design, and Growing Conditions

The experiment was conducted under field conditions at the Khon Kaen Field Crops Research Center of Tha Phra Campus, Khon Kaen Province, Thailand (latitude 16°20″ N, longitude 102°49″ E, 166.7 m above sea level) during the dry season, which extended from November 2020 to May 2021 (plant cane) and November 2021 to May 2022 (ratoon cane). A split-plot design arranged in randomized complete blocks with four replications was used. The main plot consisted of three drought treatments while six sugarcane genotypes were assigned to the subplots.
The three drought treatments were: no water stress (SD0), short-term drought stress (SD1), and long-term drought stress (SD2). To simulate the three drought stress treatments, a mini-sprinkler and drip irrigation systems were installed prior to transplanting. The mini-sprinkler was installed at a spacing of 4 m between sprinkler lines and 4 m between sprinkler heads. A pressure-compensated (2 bar) surface drip irrigation system (Super Typhoon®, Netafim Irrigation Equipment & Drip System, Derech HaShalom, Tel Aviv-Yafo, Israel) was installed at a spacing of 0.5 m between drip lines and 0.5 m between emitters. Totalizing water meters were also installed in each main plot to measure the amount of water supplied.
Water was initially supplied to all subplots using the mini-sprinkler system to maintain the soil at field capacity (FC)/soil moisture levels and to support crop establishment, from transplanting to 1 month after transplanting (MAT) in the plant cane and 1 month after harvesting (MAH) in the ratoon cane, and then replaced with the drip irrigation system. After 1 MAT/MAH, water was applied through a surface drip irrigation system to maintain the soil at field capacity (FC) level until 6 MAT for the SD0 treatments. For the short-term drought treatment (SD1) (3 months water-withholding duration), water was withheld during the 3rd–6th MAT (plant cane) and 3rd–6th MAH (ratoon cane). These occurred between 17 February 2021 and 16 May 2021 in the plant cane and between 17 February 2022 and 16 May 2022 in the ratoon cane. For the long-term drought treatment (SD2) (5 months water-withholding duration), water was withheld during the 1st–6th MAT/MAH. These occurred between 17 December 2020 and 16 May 2021 in the plant cane and from 17 December 2021 to 16 May 2022 in the ratoon cane.
The plants in the SD1 and SD2 treatments may have received water supply from rainfall after 6 MAT/MAH, as this period coincided with the rainy season in Thailand. The amount of supplementary water provided by irrigation was based on the daily crop water requirement (ETcrop), which was calculated as described by Khonghintaisong et al. [12], where:
ETcrop = ETo × Kc
ETcrop = the crop water requirement (mm day−1); ETo = the evapotranspiration of a reference crop under specified conditions calculated by the pan evaporation method; and Kc = constant coefficient for sugarcane at different growth stages [12].
The six sugarcane genotypes assigned to the subplots included two commercial sugarcane varieties, and one F1, two BC1s, and one BC2 from recent inter-specific hybridization events. The two genotypes of commercial origin included Khon Kaen 3 (KK3) [85-2-352 × K84-200], a variety possessing high cane yield and high sugar content, and U–thong 12 (UT12) [SP80 × UT3], a variety possessing high cane yield under irrigated conditions. KK3 was previously identified as drought-tolerant, while UT 12 was identified as drought-susceptible [8,12]. F03-362 (F1) [88-2-401 × ThS98-178 + ThS98-264 (bulk pollen)], derived from a recent inter-specific hybridization event between Saccharum spp. hybrids (commercial varieties) × S. spontaneum, was chosen as a high biomass, high fiber, and low sugar yield entry. The two BC1 genotypes, KK09-0358 (BC1) [95-2-317 × F03-381 (F1)] and TPJ04-768 (BC1) [94-2-128 × F03-331 (F1)], were chosen for their high cane yield and moderate sugar yield performance and the BC2 genotype KK09-0939 (BC2) [BC04-251 (BC1) × UT4] for its high performance in both cane yield and sugar yield. The plot size was 12 m × 13 m with a spacing of 1.5 m between rows and 0.5 m between plants within a row. Each plot consisted of 8 rows, with 26 plants each.

2.2. Preparation of Seedlings

To promote uniformity, the plants of each genotype used in the study were multiplied as vegetative cuttings in plastic bags for 3 weeks before uniform plantlets were selected and transplanted to the field. The stalk of each cane was cut into single node pieces each approximately 6.5 cm in length. The buds were then immersed in water containing fungicide (carboxin: 5,6–dihydro–2–methyl–1,4–oxathi–inc–3–carboxanilide, 75% WP) at the rate of 0.7 g L−1 of water for 10 min and incubated for 3 nights under moist conditions by covering with a burlap sack to stimulate bud germination. The germinated buds were transferred to 5 × 15 cm plastic bags containing soil and filter cake at the ratio of 2:1 v/v, and water was applied daily using a mini-sprinkler to avoid water stress until the seedlings had at least 3 leaves.

2.3. Field Preparation, Transplanting, and Crop Management

Prior to transplanting, the field was ploughed using a 3-disk tractor and followed by harrowing using a 7-disk tractor to make the soil suitable for cultivation. The holes into which the plantlets were transplanted were dug manually to a diameter of 20 cm and a depth of 20 cm. Uniform-size 3-weeks-old plantlets were selected and transplanted in the holes by covering with the soil at a level of 10 cm below the soil surface. Water was applied immediately after transplanting using an overhead sprinkler irrigation system to maintain adequate soil moisture conditions for plant establishment.
Soil samples were collected from 4 representative points of each replication at the depths of 0–30 and 30–60 cm using an auger and used to determine soil chemical and physical properties before transplanting. After air drying and sieving, soil samples from each replicate were bulked for further analysis using standard methods [29]. Fertilizer requirements were based on soil analysis results and fertilizer recommendations for sugarcane [30]. Fertilizers were applied at the rates of 137.5 kg N ha−1, 31.25 kg P ha−1, and 100 kg K ha−1 using inorganic forms of urea, diammonium phosphate, and muriate of potash, respectively. Phosphorus fertilizer was applied as basal dosages at 1 MAT/MAH, whereas nitrogen and potassium were applied in two split applications at 1 and 5 MAT/MAH.
Weeds were controlled with a chloroacetanilide herbicide (alachlor 48% W/V EC: 2–chloro–2′,6′–diethyl–/V–methoxymethy) applied at pre-emergence and also by hand weeding at 2 times. Insect pests, particularly sugarcane borer (Diatraea saccharalis), were controlled as necessary by the application of carbosulfan (2,3–dihydro–2,2–dihydrodimethyl–7–benzofuranyl (dibutylaminothio) methylcarbamate) at a rate of 2.5 L ha−1.

2.4. Data Collection

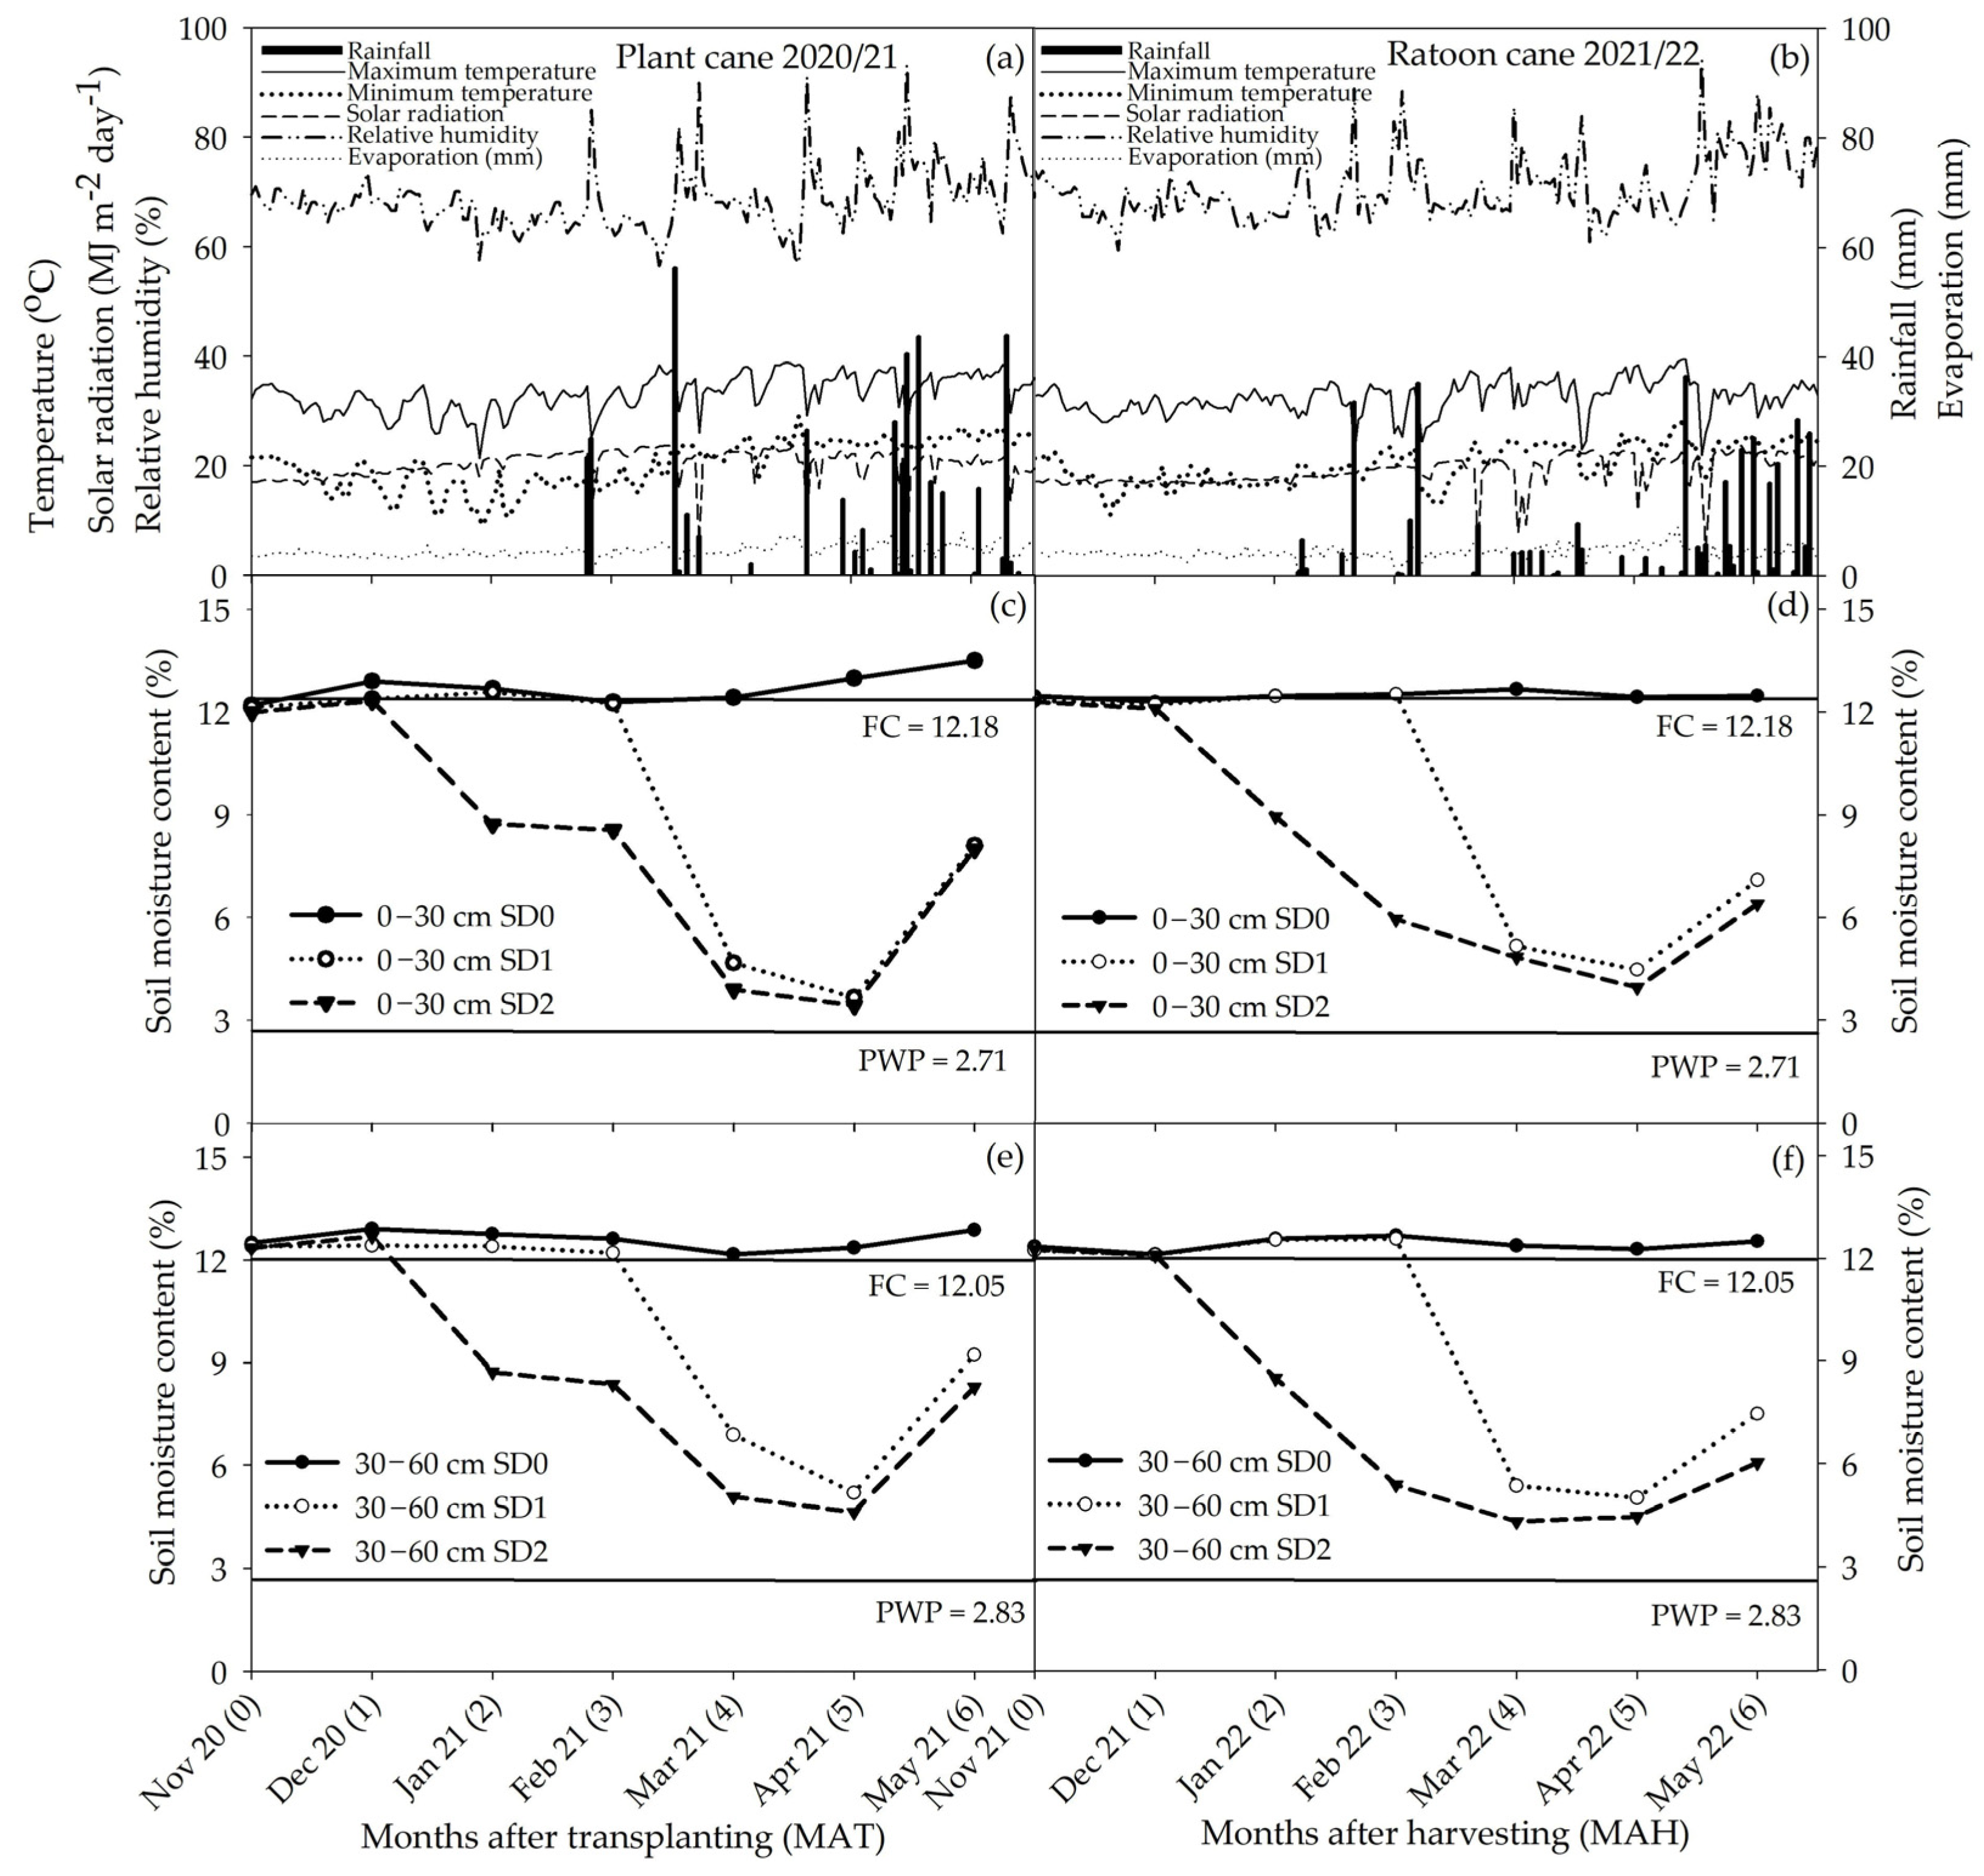
2.4.1. Growing Conditions and Soil Moisture Content

The following meteorological data were obtained daily from a weather station located approximately 100 m from the experimental site. The meteorological conditions during the plant cane experimental period (November 2020 to May 2021) were as follows: total rainfall was 410.6 mm and the average minimum and maximum air temperatures were 20.28 and 33.25 °C, respectively. The mean daily pan-evaporation was 4.47 mm and the average daily solar radiation was 20.25 MJ m−2 day−1. Daily relative humidity ranged from 44.4 to 92.4% (Figure 1a). For the ratoon cane (November 2021 to May 2022), total rainfall was 368.8 mm, whereas average minimum/maximum air temperatures, daily pan-evaporation, solar radiation, and relative humidity ranges were 20.41/32.58 °C, 4.29 mm, 19.05 MJ m−2 day−1, and 46.6 to 94.5%, respectively (Figure 1b). The total amounts of water supplied (rainfall + irrigation) for the three drought treatments, SD0, SD1, and SD2 were 984.98 mm, 627.63 mm, and 481.24 mm, respectively, for the plant cane and 975.33 mm, 601.37 mm, and 443.95 mm, respectively, for the ratoon cane period.
The soil type at the study site was a Satuk series (suk: fine-loamy, siliceous, subactive, isohyperthermic Typic Paleustults; Thailand Soil Classification System). The soil texture was sandy loam with a pH of 5.35. At a depth of 0–30 cm, the following soil chemical and physical properties were recorded: organic matter (OM), 0.29%; electrical conductivity (EC), 0.0138 dS·m−1; available phosphorus, 51.82 mg·kg−1; exchangeable potassium, 46.04 mg·kg−1; exchangeable calcium, 77.59 mg·kg−1; exchangeable manganese, 8.39 mg·kg−1; and a bulk density of 1.55 g·cm−3. At the 30–60 cm soil depth, the soil texture was a sandy loam with a pH of 5.83 and the other properties were: 0.13% OM; 0.0170 dS·m−1 EC; available phosphorus, 53.16 mg·kg−1; exchangeable potassium, 51.56 mg·kg−1; exchangeable calcium, 158.43 mg·kg−1; exchangeable manganese, 15.56 mg·kg−1; and a bulk density of 1.70 g·cm−3.
Soil moisture contents at 0–30 and 30–60 cm depths were measured gravimetrically before transplanting and at 1, 2, 3, 4, 5, and 6 MAT in the plant cane and again at 1, 2, 3, 4, 5, and 6 MAH in the ratoon cane crop. Procedurally, soil samples were weighed immediately after collection, oven-dried at 105 °C for 72 h, and reweighed. Soil moisture content was calculated as:
Soil moisture content (%) = [(wet soil mass − dry soil mass)/dry mass] × 100
Soil moisture content (SMC) in the SD0 treatment was adequately controlled to within 1% of field capacity (FC level). The range in FC was 12.20–13.51% in plant cane (Figure 1c,e) and 12.30–12.67% in ratoon cane (Figure 1d,f). Even though 211.10 mm of rain was recorded during the dry season period, the soil moisture content of SD2 treatment was significantly reduced during 2–5 MAT and 2–5 MAH at the soil depth of 0–30 cm (Figure 1c,d) (around ¼ available water (AW)) compared with the soil moisture content of SD0 treatment. The ¼ AW level had an effect on sugarcane physiological response to drought stress [8,12]. For SD1 treatment, the reduction in soil moisture was recorded after withholding water from 4–5 MAT/MAH (around ½ AW). The observed reduction in soil moisture content at the 60 cm soil depth was less than that at the 30 cm soil depth. Due to rainfall events from late April to late May, in both plant cane and ratoon cane, the soil moisture contents of SD0 and SD1 showed recovery at 6 MAT/MAH for both soil depth layers (Figure 1c–f).

2.4.2. Leaf Gas Exchange and Chlorophyll Fluorescence

Leaf gas exchange parameters, namely, A, gs, and E, were measured on 1 plant subplot−1 at 1, 3, 4, 5, and 6 MAT in the plant cane and again at 1, 3, and 6 MAH in the first ratoon cane using a portable photosynthesis system (LI–COR 6400, LI–COR Inc., Lincoln, NE, USA) with an external LED light source. Measurements were taken from the center of the leaf blade of the 2nd or 3rd fully expanded leaf between 09:00 and 11:00 a.m. local time on days with clear skies. Measurement conditions were controlled at 1500 µmol·m−2·s−1 photosynthetic photon flux density (PPFD), 300 mL·min−1 air flow, 400 µmol mol−1 chamber CO2 concentration, and 30 ± 2 °C air temperature.
At each sampling time, PSII chlorophyll fluorescence parameters (ChlFPs) were also measured on the same leaves used for gas exchange parameters using a portable Photosynthesis Yield Analyzer (Mini PAM–II Photosynthesis Yield Analyzer, Heinz Walz GmbH, Effeltrich, Germany). All ChlFPs were recorded between 09:00 and 11:00 a.m. Variable fluorescence (Fv) and maximal fluorescence (Fm) parameters were recorded after dark adapting leaves for 20 min using dark adaptation clips (Dark Leaf Clip DLC–8, Heinz Walz GmbH, Effeltrich, Germany). For each measurement, a dark-adapted leaf was exposed to a saturating light pulse of 4000 µmol·m−2·s−1 for 0.8 s, and the recorded parameters (Fv and Fm) were used to compute the maximal quantum yield of PSII photochemistry as Fv/Fm. The effective quantum yield of PSII photochemistry (ΦPSII) was similarly calculated from steady-state fluorescence parameters in the light-adapted state as described by Santanoo et al. [31].

2.4.3. Leaf Chlorophyll and Relative Water Contents (RWC)

Chlorophyll content in the leaf was measured in three plants from each plot taken from the 2nd or 3rd fully expanded leaf of the main stem at the middle positions. The leaf blade samples were cut into leaf discs (1 cm2 each). These were immediately placed in tubes kept in an ice box to minimize water loss and transported to the laboratory. Leaf chlorophyll measurements were taken between 09:00 and 11:00 a.m. at 1, 3, 4, 5, and 6 MAT in the plant cane and again at 1, 3, and 6 MAH in the ratoon cane. For Chl measurements, some of the leaf discs were incubated in 5 mL N, N-dimethylformamide (DMF) for 48 h in the dark after which absorbance (A) of 3 mL extracts were measured using a spectrophotometer at 647 and 664 nm. Total chlorophyll (Chl total), chlorophyll a (Chl a), and chlorophyll b (Chl b) contents (expressed in µg·cm−2) were calculated according to Moran [32] as:
Chl a = 12.64 A664 − 2.99 A647; Chl b = -5.6 A664 + 23.24 A647; and Chl total = 7.04 A664 + 20.27 A647.
The remaining leaf discs were used to determine RWC. Leaf discs were collected as described above at 1, 3, 4, 5, and 6 MAT in the plane cane and again at 1, 3, and 6 MAH in the ratoon cane crops. Once in the laboratory, fresh mass was recorded and discs were immersed in distilled water for 24 h, then blotted dry and reweighed to obtain the water-saturated mass. The dry mass of the discs was recorded after drying at 80 °C for 48 h. The RWC was calculated as:
RWC (%) = [(fresh mass − dry mass)/(water-saturated mass − leaf dry mass)] × 100

2.4.4. Biomass and Leaf Area Index (LAI)

At 6 MAT or 6 MAH, three stools in an area of 2.25 m2 were harvested from the middle rows. The plants were cut at the soil surface and separated into stalks, leaf blades, leaf sheaths, number of dry leaves, and number of tillers, and the fresh weight of each plant part was recorded. After weighing, at least 10% of each plant part was sampled. The samples of leaves were used to measure the leaf area using a leaf area meter (LI-3100, LI-COR Biosciences, Lincoln, NE, USA). The total leaf area per plot was then computed from this sample. All samples were oven-dried at 70 °C for 72 h or until constant weight and then weighed. Total biomass was calculated as a sum of the weights of all plant components. Leaf area index was calculated as the ratio of leaf area (cm2) and ground area (cm2).

2.4.5. Statistical Analyses

Statistical analyses were performed using Statistix ver. 10 (Analytical Software, Tallahassee, FL, USA) [33] following the split-plot experimental design [34]. The main effect of drought treatments, subplot effect of genotypes and their interaction effect were analyzed with a two-factor analysis of variance (ANOVA). Drought effect was tested with the main plot experimental error (error a), while significance of the subplot and interaction effects were tested with the subplot experimental error (error b) [33]. The Least significant difference (LSD) procedure was used to compare means at the 95% probability level.

3. Results

3.1. Plant Water Status

For the plant cane, average relative water content (RWC) values were not significantly different at 1 and 3 MAT among the six genotypes and drought treatments. Even though the soil moisture content in SD2 was already reduced from 12% to 8% (Figure 1c), this did not significantly affect RWC at 3 MAT regardless of the genotype. However, at 4–5 MAT, when soil moisture content had fallen to 3–5%, RWC in SD1 and SD2 treatments was significantly reduced compared to that in the SD0 control (Figure 2a). With the return of rainfall by 6 MAT, the soil moisture contents of SD1 and SD2 treatments rose by approximately 8% and this was accompanied by a partial recovery of RWC in both drought treatments. Despite this recovery, SD0 treatment still maintained higher average RWC values than SD1 and SD2 treatments (Figure 2a).
For the ratoon cane, RWC measured at 1 MAH was similar among treatments. However, by 3 MAH, the soil moisture content of SD2 treatments (approximately 5%; Figure 1d) was significantly reduced compared to SD0 and SD1 treatments and to the levels observed in the plant cane. This coincided with lower RWC values compared to SD0 and SD1 treatments at 3 MAH (Figure 2b). With the return of the rainy season around 6 MAH, RWC values of SD1 and SD2 did not recover appreciably as was observed during the plant cane phase. Hence, the RWC of SD0 remained significantly higher than those of SD1 and SD2 treatments (Figure 2b).
Significant differences in RWC were observed among the six genotypes in response to early season drought treatments. These differences depended on the duration of drought exposure. Early in the season, under controlled well-watered conditions, all genotypes generally had similar RWC values (range 93–99%) (Figure 3). However, by 4 MAT, differences in RWC among genotypes were evident and more pronounced under SD1 and SD2 treatments. The reduction in RWC was more severe in F03-362 at 4–5 MAT compared to the other genotypes (Figure 3a). A similar trend was observed in the ratoon cane but genotypic differences were not as strong as in the plant cane (Figure 3b). Under all treatments, two genotypes, namely, TPJ04-768 and KK3, generally presented higher RWC values compared to the other genotypes (Figure 3b).

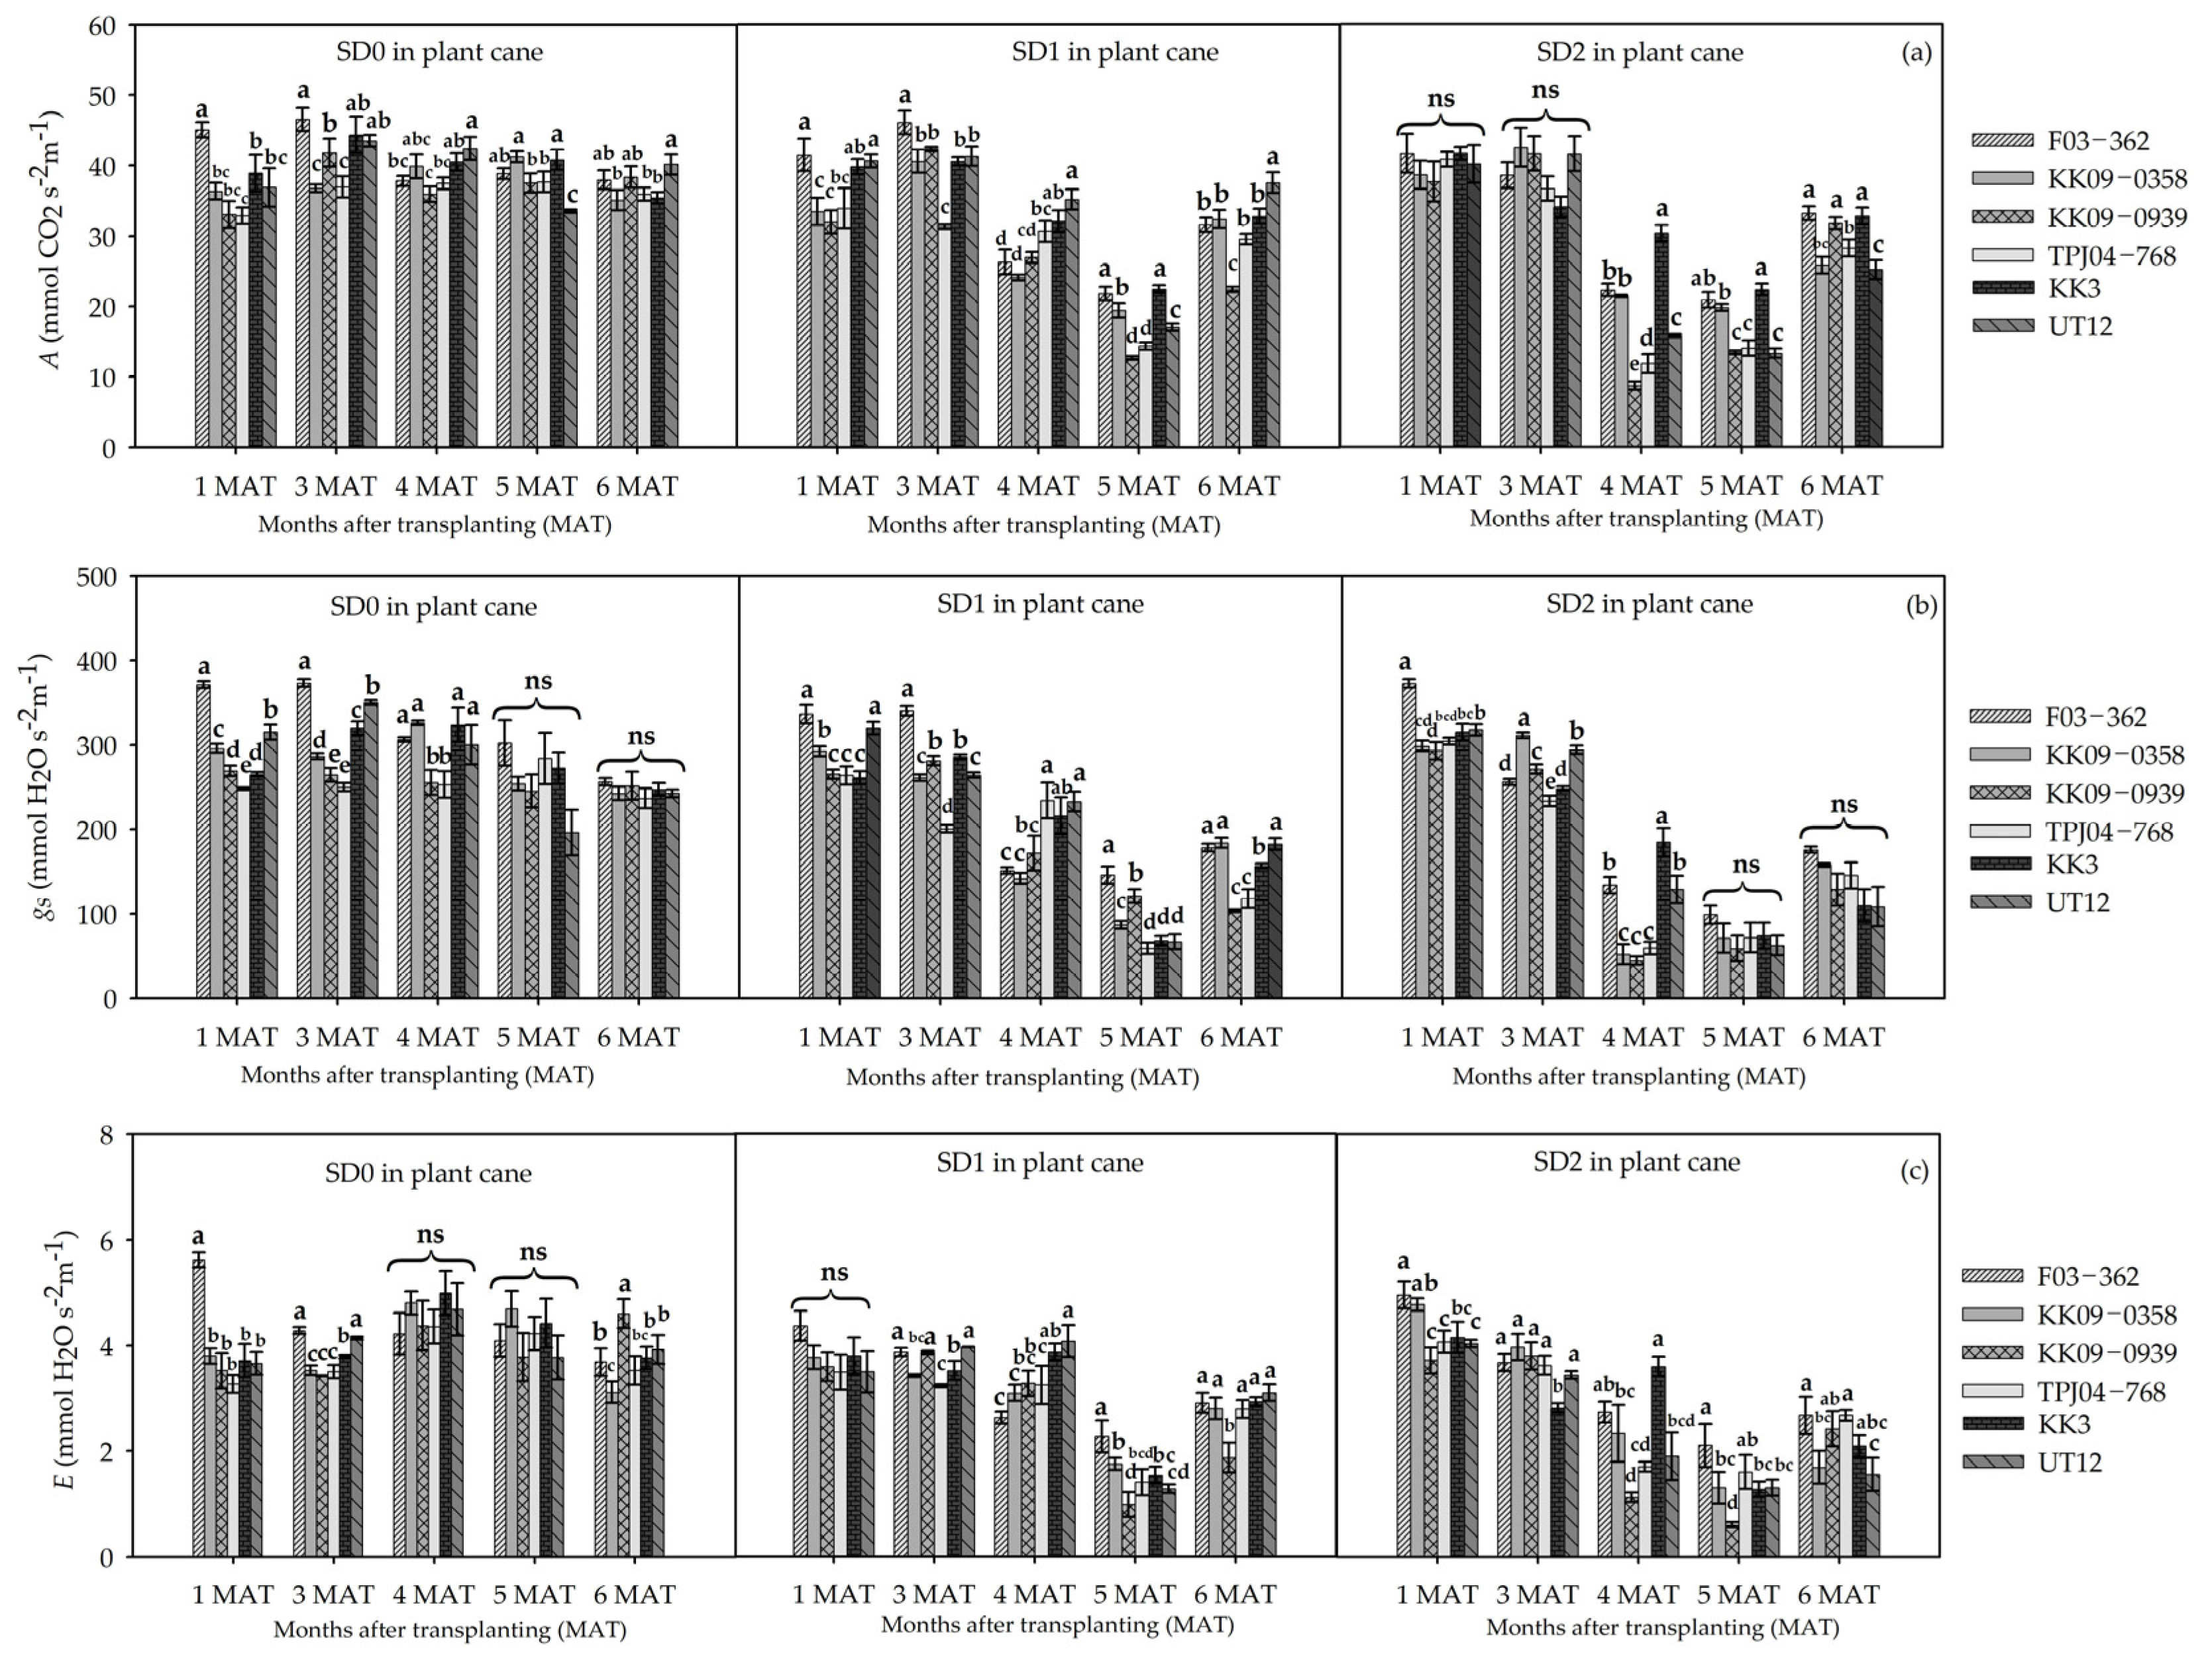
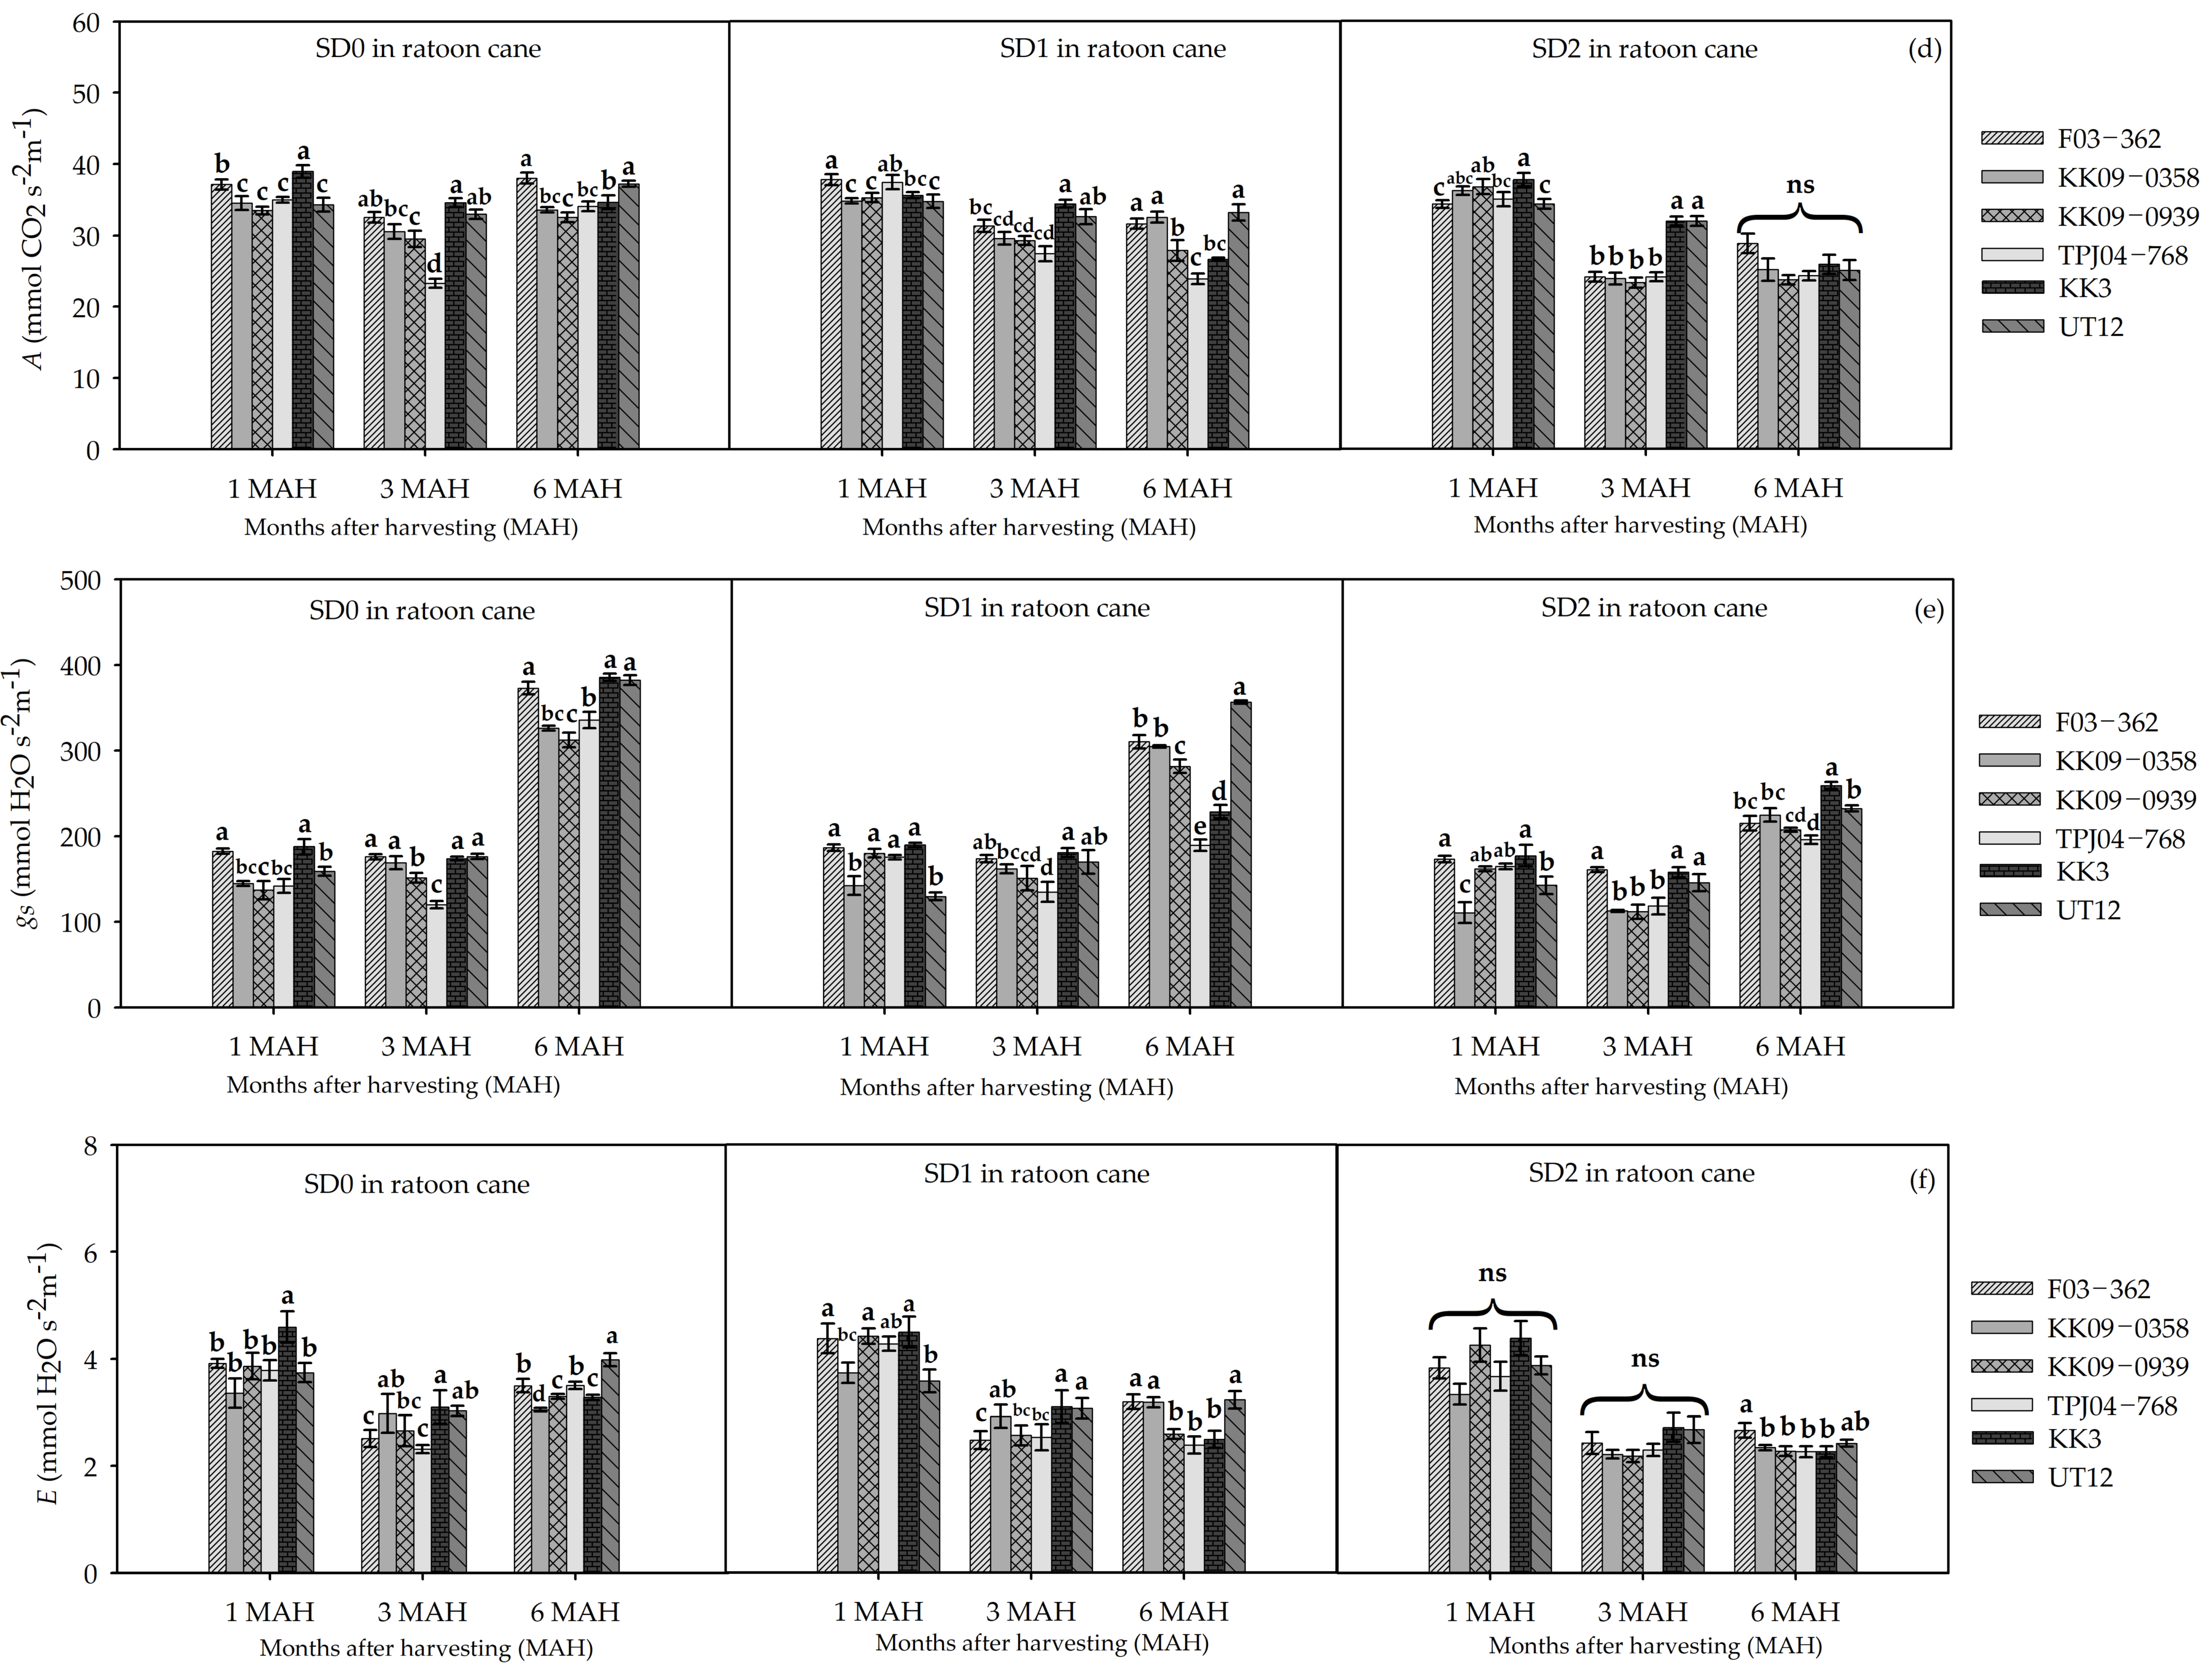
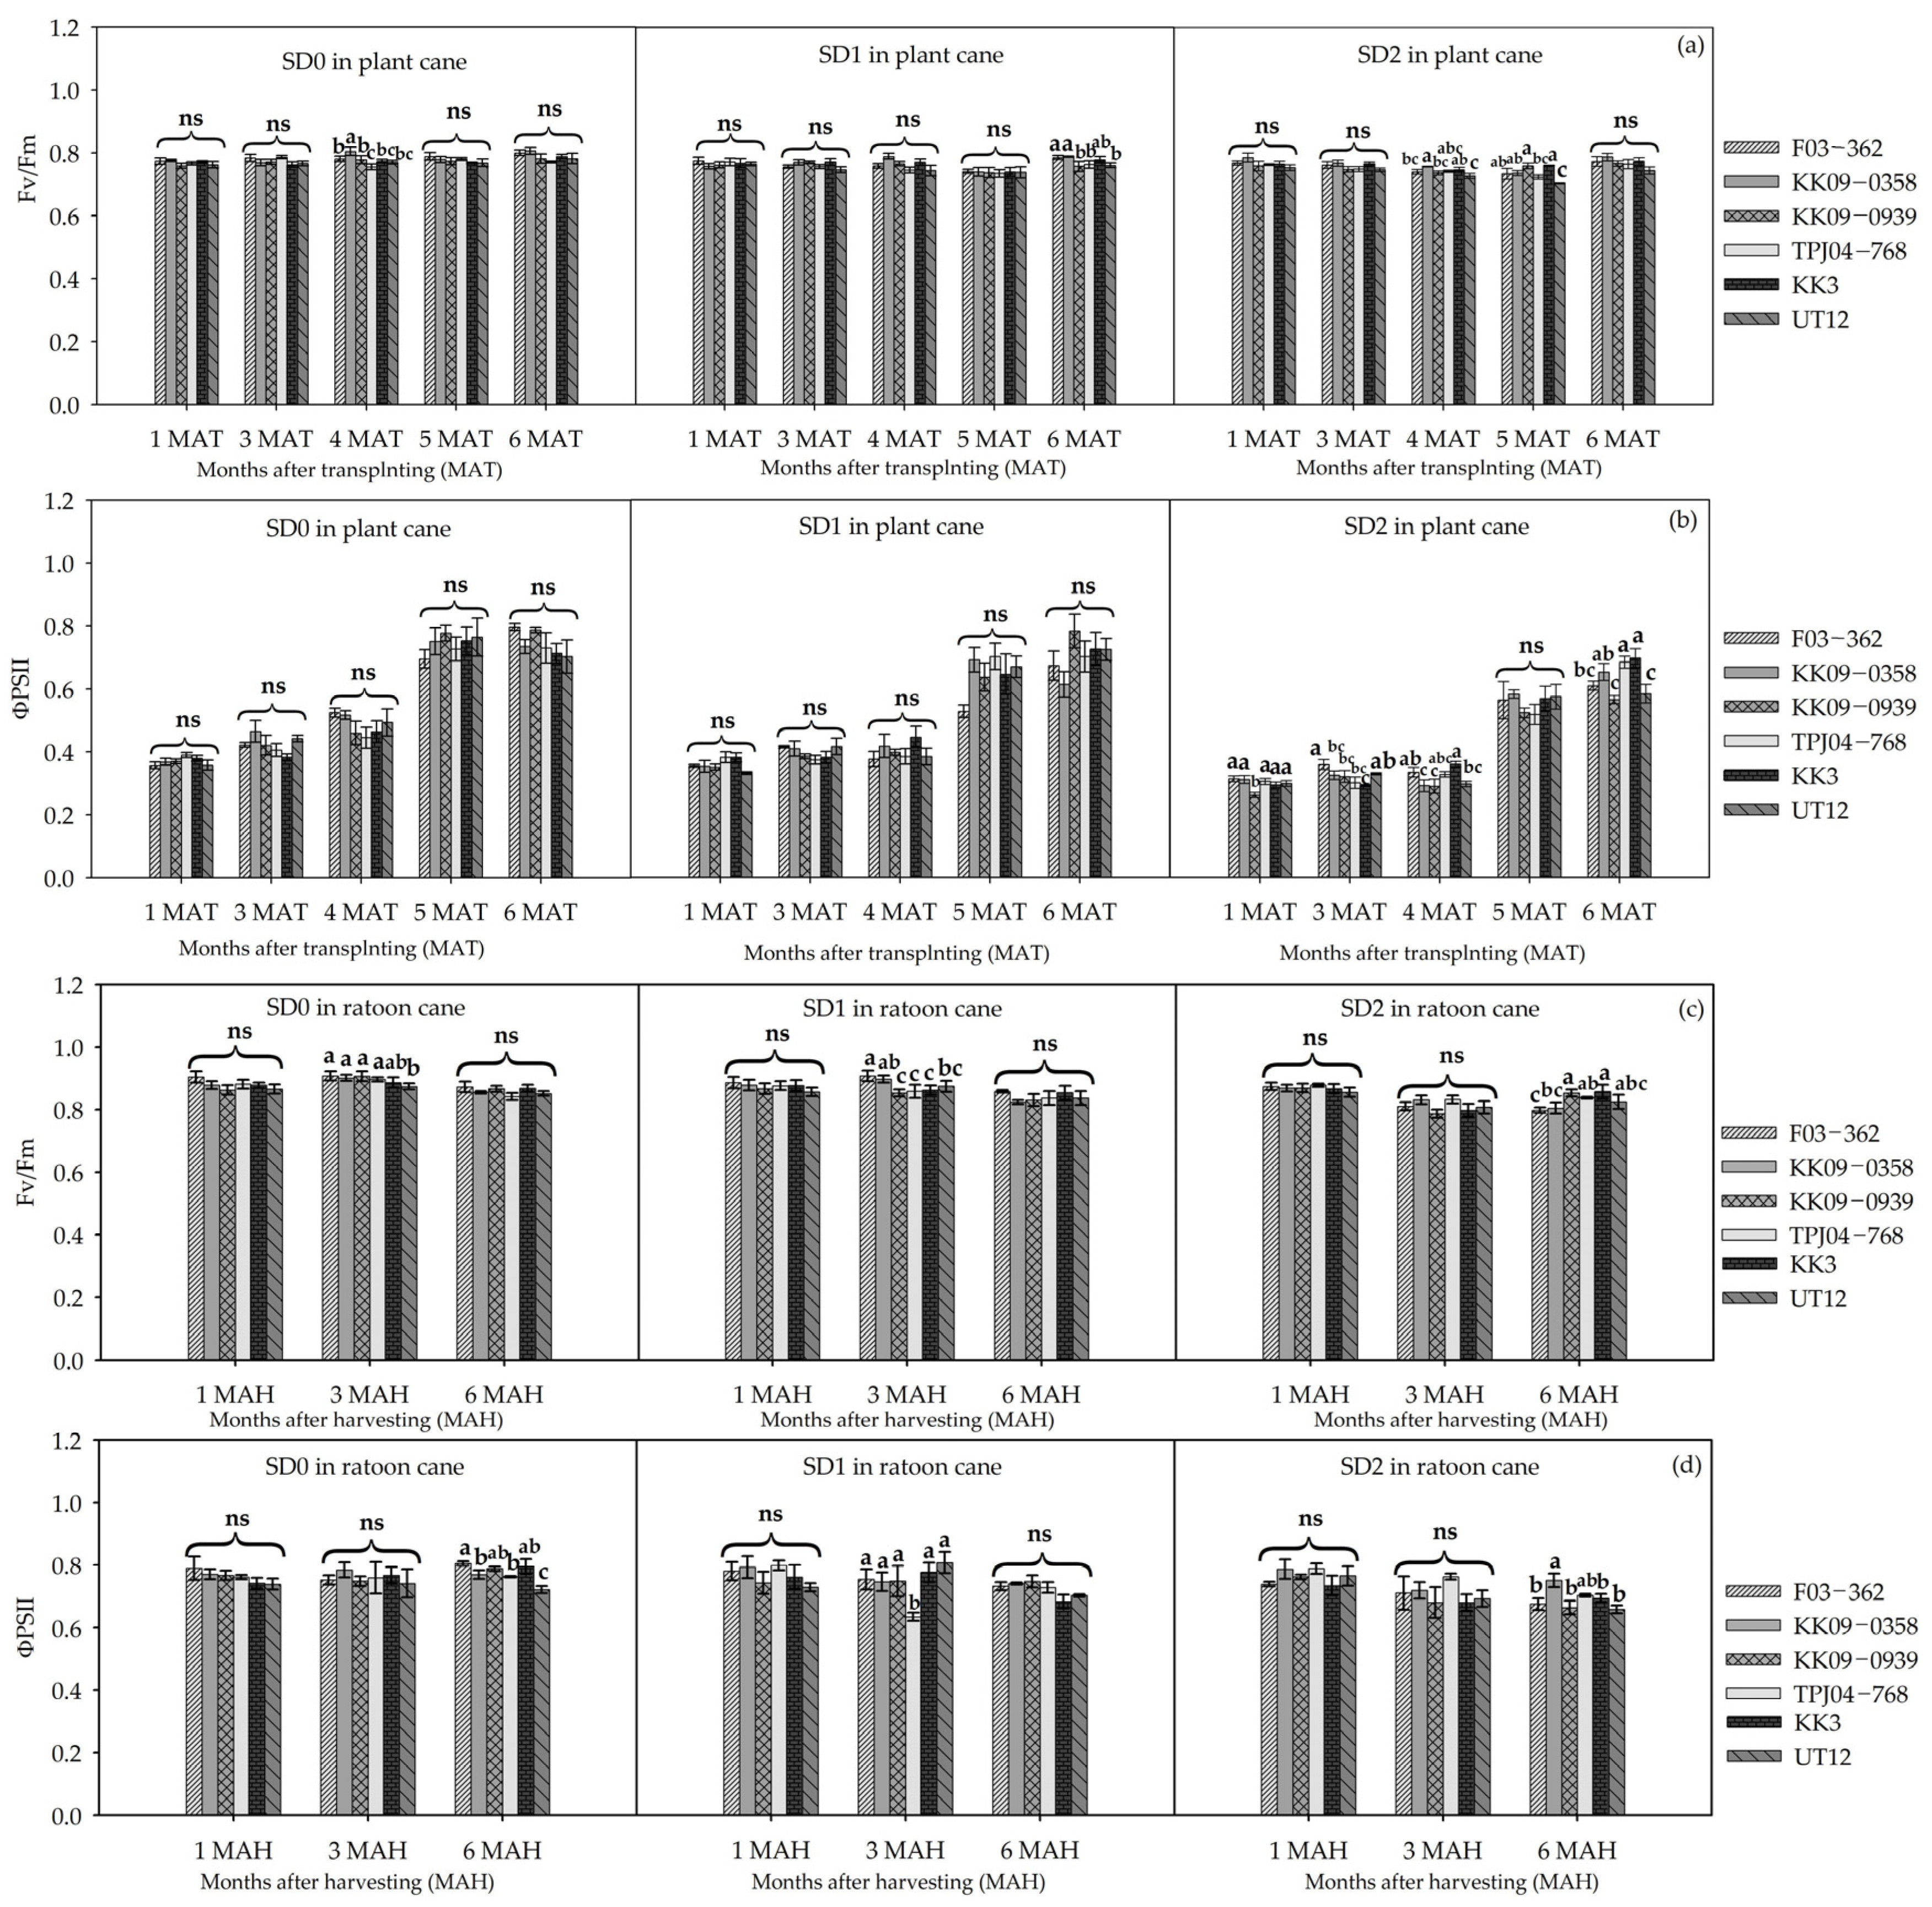
3.2. Leaf Gas Exchange and Physiological Responses to Drought Durations

Net photosynthesis (A), stomatal conductance (gs), and transpiration rate (E): Gas exchange (A, gs, and E) responses to drought treatments were closely associated with changes in soil moisture content. Similar to RWC, gas exchange parameters were initially high (Figure 4), but gradually declined between 3 and 5 MAT, with the rate of decline depending on the duration of drought exposure (SD1 or SD2) and cropping season (plant cane or ratoon cane). The rate of decline in gas exchange parameters was faster under SD2 than under SD1 treatments. The decline rate was also faster in the plant cane crop compared to the ratoon crop. The lowest gas exchange values were observed between 4 and 5 MAT (Figure 4a–c). With the return of rains by 6 MAT and 6 MAH, gas exchange parameters exhibited significant recovery despite not to the pretreatment levels. Significant differences in gas exchange parameters among genotypes were also evident under the drought treatment conditions (SD0, SD1, and SD2) and between the two cropping seasons (plant cane and ratoon cane). Under well-watered treatment conditions, some genotypes, namely, F03-362, KK3, and UT12, generally had higher gas exchange values than the others. However, under drought conditions, all genotypes exhibited varying degrees of reductions in gas exchange parameters. The reduction in A was more severe (approximately 60% reduction) in genotypes KK09-0939, TPJ04-768, and UT12 compared to the rest of the genotypes (approximately 30% reduction). This response pattern among genotypes in A, gs, and E was also more pronounced under SD2 than under SD1. The moderately tolerant genotype (KK3) generally maintained higher gas exchange values than the susceptible genotype (UT12). In some instances, the drought-induced reductions in gs and E among genotypes (notably, TPJ04-768, KK3, and UT12) were more pronounced than the reduction in A. With the return of the rainy season (at 6 MAT), all gas exchange parameters showed significant recovery, with genotypes F03-362, KK09-0939, and KK3 having the highest A values at 6 MAT. During the ratoon season, drought-induced reductions in gas exchange parameters were less pronounced (compared with the SD0 treatment) than reductions observed during the plant cane phase and were mostly evident for A in the SD2 treatment (Figure 4e). Gas exchange values were also generally slightly (~10%) lower in the ratoon cane compared to the plant cane. During the ratoon season, two genotypes, namely, KK3 and UT12, consistently maintained higher gas exchange values under SD1 and SD2 drought treatments than the other genotypes. Stomatal conductance (Figure 4b,e) of plant and ratoon crops remained relatively low and did not change appreciably between 1 MAT/MAH and 3 MAT/MAH for both SD1 and SD2 drought treatments, but showed the reduction in gs was more severe (35% reduction averaged from all genotypes for both SD1 and SD2) at 6 MAH. Transpiration values declined significantly between 1 MAH and 3 MAH for both SD1 and SD2 drought treatments but did not recover appreciably at 6 MAH (Figure 4c,f). Overall, recovery of A and E for the ratoon cane at 6 MAH was not as pronounced as in the plant cane.
Maximum quantum yield (Fv/Fm) and photosystem II quantum yield (ΦPSII): There were no significant differences among water treatments and sugarcane genotypes in terms of Fv/Fm at 1–6 MAT/MAH (Figure 5a,c). Dark-adapted Fv/Fm values were reduced slightly under drought conditions. The reduction in Fv/Fm was observed at 5 MAT for the plant cane (Figure 5a), and at 6 MAH for the ratoon crop (Figure 5c). For the ratoon cane, TPJ04-768, KK3, and KK09-0939 had higher Fv/Fm values than the other genotypes at 6 MAH for the SD2 treatment. Similarly, reductions in ΦPSII among sugarcane genotypes were not significantly different during 1–6 MAT for the plant cane (Figure 5b), but KK09-0939 displayed low average ΦPSII values at 6 MAT for the SD2 treatment in the ratoon cane (Figure 5d).
Leaf chlorophyll responses: Leaf chlorophyll contents declined during the growing season in response to both drought treatments SD1 and SD2 and were generally higher in the plant cane (Table 1) compared to the ratoon cane (Table 2). Total leaf chlorophyll contents ranged from about 7 to 15 µg·cm−2 and were lowest in the prolonged drought treatment (SD2; 4 MAT). Differences in total leaf chlorophyll contents among the six genotypes were also observed, with the two genotypes F03-362 and KK09-0358 generally maintaining higher leaf chlorophyll contents than the others. Leaf chlorophyll contents of the commercial genotype UT12 were the most sensitive to drought. This genotype recorded the largest decline in leaf chlorophyll (approximately 42%) by the end of the drought cycle (5 MAT).
Leaf area index (LAI): For both plant cane and ratoon crops, the leaf area index values of SD0 and SD1 drought treatments at 3 MAT/MAH were similar and 10% higher than those of SD2 treatments (Figure 6). Leaf area index values were also generally higher in the plant cane than in the ratoon cane. Significant differences in LAI among genotypes were observed especially during the recovery stage (6 MAT/MAH) and in the ratoon cane. Overall, genotype F03-362 consistently maintained high LAI values under all treatment conditions.

3.3. Biomass

Biomass yields ranged from as low as 5.75 to nearly 32 tons per hectare (Table 3) and were significantly reduced by drought exposure. The largest yield declines in genotypes were consistently observed under prolonged drought (SD2) treatment conditions in both the plant cane and the ratoon cane. The genotype F03-362 consistently exhibited the highest yields under all treatment conditions, whereas the two commercial genotypes (KK3 and UT12) displayed severe yield sensitivity to both short-term (SD1) and long-term (SD2) drought exposure. Those two commercial genotypes also had the lowest yields under control (non-stressed condition; SD0) conditions. Yield performance of the other interspecific hybrids (TPJ04-768, KK09-0358, and KK09-0939) was intermediate between the high-yielding such as F03-362 and commercial genotypes under all treatment conditions.

4. Discussion

Sugarcane is one of the world’s most productive crops, with dry matter yields that can exceed 100 tons ha−1 yr−1 [35]. However, the yield potential is seldom achieved due to several limiting factors of which water scarcity is the most critical, especially in rainfed production systems. To address these limitations, breeding efforts to develop drought-tolerant varieties, have received considerable attention [36]. However, many putative tolerant varieties often possess a limited set of adaptive traits that are useful only in a few environments or fail to allow the plant to optimize resource acquisition and utilization in situations where growth limitations display spatial and temporal variations. A better understanding of the physiological basis for differential reactions to drought among genotypes would accelerate progress in breeding efforts.
Results obtained in the current study demonstrated differential responses among the six genotypes and genotype × environment interactions in numerous physiological response variables. As anticipated, RWC, an important indicator of plant water status, which reflects the balance between water supply to leaves and transpiration rate [37] declined with the onset of soil moisture deficits (Figure 2 and Figure 3). The decline in RWC mirrored changes in SMC (Figure 1). This decline in water deficit seemed to occur rapidly (within one month after the onset of drought) in SD1, compared to SD2 treatments where the decline was not evident until after about three months into the drought treatment. This could be attributed to favorable weather conditions that possibly prevented rapid water loss early in the season. Acclimation of younger SD2 plants to evolving water deficit stress potentially also helped slow the decline in RWC, whereas SD1 plants had already established a large leaf surface area for transpirational water loss at 3 MAT (Figure 6). Similar age-dependent responses of physiological parameters to water deficits have been reported in wheat [38] and several Mediterranean species [39], whereby leaf gas exchange parameters decreased more rapidly in older leaves and plants than in young seedlings in response to drought. Previous field and greenhouse studies with sugarcane have also reported significant drought-induced reductions in key physiological and agronomic parameters, ultimately leading to reductions in yield components [5,8,12,16,18,21,27,40]. However, these looked at either short-term only (<75 days) or whole season exposure to drought. The current study expanded the scope of previous investigations by characterizing both short- and long-term drought effects on key physiological traits over two growth cycles.
As water deficit stress progressed, differences in RWC among genotypes occurred first and were more pronounced under SD1 treatments than under SD0 or SD2 treatments (Figure 3). Genotype F03-362 was the most sensitive, showing a decline of almost 25% compared to RWC values at the onset of drought treatments. This response pattern seems to correspond with leaf properties. Even though F03-362 has small leaf blades, it produces more leaves per unit area (Figure 6), leading to a larger surface area for moisture loss. In contrast, the RWC values of genotypes with larger leaf blades but lower LAI (such as UT12, KK3, and TPJ04-768) were relatively less sensitive to moisture deficit, thus maintaining a more favorable tissue moisture status.
Slight differences were also evident between the plant cane and ratoon crop responses. Drought-induced reductions in RWC and related physiological parameters were more evident in the plant cane crop than in the ratoon crop. This could be due to the well-established root system of the ratoon crop, which enabled better soil exploration and water uptake compared to the plant cane. At the end of each growth cycle after the return of rains (approximately 110 DAP), the soil water status of the stressed treatments was approximately 13%, whereas that of non-stressed treatment was 10.5%. This could be an indication of faster soil moisture depletion due to greater leaf surface area (and higher transpiration flux) in non-stressed plants compared to that in stressed treatments [41]. Similar observations have been reported by Jangpromma et al. [5], who found a difference of 1.3% in the permanent wilting points (PWPs) of stressed versus non-stressed plants, showing that stressed plants had better survival rates after drought exposure.
Leaf gs, E, and A roughly followed a similar response pattern as RWC. Moisture stress was associated with increased diffusion resistance (reduced gs) and concomitant reductions in E and A, especially as plants aged. Reductions in gas exchange parameters were also much greater in the plant cane than in the ratoon cane. Soil moisture deficits and high air temperature generally occur together (Figure 1). It is well documented that under such conditions, the ensuing low RWC and high vapor pressure deficit (VPD or increased atmospheric demand for water vapor) conditions trigger the production/mobilization of the phytohormone, abscisic acid (ABA), which is known to induce stomatal closure [42,43], leading to a reduction in transpiration and photosynthesis [18,44,45]. In the current study, the effects of drought on gs resulted in disproportionate reductions in E and A. As moisture deficit stress progressed, reductions in gs and E were slightly bigger in magnitude (~74% and ~70% for gs and E, respectively) compared to reductions in A (~39%), and this was most evident in SD2 treatments (Figure 4). Similar observations have previously been reported in other crops. For instance, when exogenous transpiration suppressants that cause partial stomatal closure were applied to cotton leaves, this triggered proportionately greater reductions in transpiration than in photosynthesis [46]. This has been attributed at least in part to additional diffusional resistances associated with CO2 flux into leaves compared to water vapor, hence partial stomata closure increases resistance to CO2 movement relatively less than the resistance to water vapor movement leading to greater reductions in transpiration than photosynthesis [47]. It has also been reported that A in C4 species is less sensitive to partial stomatal closure than transpiration [48], perhaps contributing to the generally superior water use efficiency of C4 compared to C3 species. Similar observations have been reported in other Saccharum species [28,49,50]. For instance, Leanasawat et al. [8] found that S. spontaneum (Ths 98–271) had a higher net photosynthetic rate under early drought conditions. Similarly, Irvine [51] demonstrated that the photosynthetic rate on an area basis of S. spontaneum was greater than those of S. officinarum and hybrid cultivars. In the current study, F03-362, KK09-0358, and KK3 were more tolerant and able to maintain higher photosynthetic activity during and after drought recovery (Figure 4). Among the genotypes studied, KK09-0939 and TPJ04-768 had the most sensitive A and this was more pronounced in the SD2, plant cane cycle. During the ratoon cane cycle, two genotypes, KK3 and UT12, consistently had some of the highest A values during drought exposure, even though their gs values were similar to those of other genotypes. Stomatal control of CO2 diffusion for photosynthesis and water loss through transpiration is pivotal for productivity and water use efficiency. The mechanism(s) underlying the differential gs responses to short- and long-term drought exposure deserve further investigations. Leaf size and LAI differences among the genotypes studied have been noted but additional factors such as differences in anatomical features (stomatal aperture size, stomatal density, guard cell shape, presence or absence of subsidiary cells, etc.), as well as the speed at which stomatal aperture responds to changing conditions, could explain some of the variations among genotypes [52]. The stomatal response speed could also be related to the source of ABA which stimulates stomatal closure. Recent studies examining the transport times between roots and leaves have led several investigators to conclude that leaf-sourced ABA is the principal source of ABA accounting for the rapid responses of gs to environmental cues [53,54]. Therefore, genotypic differences in leaf ABA biosynthesis sensitivities to stresses could help explain the observed responses of A, E, and RWC to treatments.
Observed values of the maximum photochemical efficiency of photosystem II ranged from 0.70 to 0.78 and were slightly reduced in SD2 during water deficit at 4–5 MAT in the plant cane. The commercial sugarcane genotype UT12 had the lowest values of Fv/Fm and ΦPSII. Under SD1 and SD0 treatments, these parameters were generally not significantly different among the six sugarcane genotypes. These observations suggest that under our experimental conditions, no significant drought-induced damage was inflicted on the light-harvesting, electron transport complex. The capacity to maintain a high Fv/Fm ratio during stress could indicate a high efficiency of radiation use, possibly by the Calvin cycle reactions [55,56]. They reported Fv/Fm values of 0.73 in the sugarcane genotype HoCP93–776 exposed to drought under field conditions. High prevailing insolation levels as well as other crops, environmental, and management factors that limit assimilate export from leaves (e.g., sink strength) could contribute to severe reductions in Fv/Fm values. Silva et al. [56] and da Graça et al. [45] reported Fv/Fm values of below 0.7 in drought-susceptible sugarcane genotypes compared to higher values (>0.73) in tolerant genotypes. Similar observations have also been reported by other investigators [8,18,45,55,57,58], making chlorophyll fluorescence a useful tool for drought tolerance screening.
Leaf chlorophyll content showed a clear decline with plant age, whereby values at 1 MAT were generally significantly higher than those at 6 MAT. However, responses to drought treatments among the genotypes studied were not consistent. Silva et al. [56] reported SPAD index values below 40 in drought-susceptible sugarcane genotypes. According to Torres et al. [59], SPAD index below 40 indicates the beginning of a chlorophyll deficiency, which affects photosynthetic performance. The absence of significant drought-induced chlorophyll degradation suggests that drought effects on sink development were not severe enough to induce downregulation of the light harvesting apparatus [60].

5. Conclusions

Crops such as sugarcane in rainfed production systems will likely experience significant yield reductions because of extreme weather events such as prolonged droughts and heat waves, which are predicted to become more frequent or more intense with human-induced climate change. A better understanding of the short- and long-term responses to these events amongst diverse genotypes will assist breeders in selecting and breeding resilient cultivars. The current study focused on key physiological responses to short- and long-term drought among contrasting sugarcane genotypes grown under commercial production conditions in Thailand. The responses of basic physiological processes, gs, E, and A, to drought had predictable consequences for yield components such as LAI (an indicator of the light interception efficiency and a crucial determinant of productivity). The results confirm the notion that the timing and severity of early season drought durations in plant cane and ratoon cane can have important implications for light capture and conversion to biomass. Short-term (SD1) and long-term (SD2) exposure to soil moisture deficits clearly elicited differential physiological responses and revealed differences in sensitivity among the genotypes studied. Three genotypes, namely, F03-362, KK09-0358, and KK3, displayed superior tolerance to soil moisture deficit exposure and were able to sustain higher photosynthetic activity during and after the drought recovery period. Two genotypes KK09-0939 and TPJ04-768 were more sensitive to drought exposure, especially under SD2, plant cane crop cycle. During the ratoon crop cycle, two genotypes, KK3 and UT12, consistently had some of the highest A values during drought exposure, even though their gs values were similar to those of other genotypes. Such genotypic differences in the ability to tolerate drought episodes and still sustain economic yield levels are important in crop improvement for rainfed production systems where resource availability is unpredictable. Our results also confirm the observation that the final yield of tolerant sugarcane genotypes is relatively insensitive to drought experienced during the tillering growth phase [61]. Our results provide valuable insights with respect to possible physiological leaf-level mechanisms. Further studies coupling physiological and agronomic assessments are warranted to identify additional parameters that can be used in strategic trait-based improvement programs to develop resilient cultivars to mitigate current and future production challenges.

Author Contributions

Conceptualization, S.J., C.A.K., J.L.J., N.V., P.S. and N.J.; methodology, A.T., A.J., N.T., S.J. and N.V.; validation, A.T., A.J., N.T., S.J., N.V., P.S. and N.J.; formal analysis, A.T., S.J., C.A.K., J.L.J., N.V., P.S., A.J., N.T. and N.J.; investigation, S.J., C.A.K., J.L.J., P.S. and N.J.; resources, S.J., P.S. and N.J.; data curation, A.T., A.J., N.T., S.J., P.S. and N.J.; writing—original draft preparation, A.T., A.J., N.T., S.J., P.S. and N.J.; writing—review and editing, S.J., C.A.K., J.L.J., P.S. and N.J.; visualization, S.J., N.J., J.L.J. and C.A.K.; supervision, S.J., P.S. and N.J.; project administration, S.J., P.S. and N.J.; funding acquisition, S.J. and P.S. All authors have read and agreed to the published version of the manuscript.

Funding

This research was mainly funded by the Thailand Research Fund (grant number PHD/0223/2560) and the Fundamental Fund of Khon Kaen University (grant number 65A103000128), which has received funding support from the National Science Research and Innovation Fund (NSRF). The Thailand Research Fund also supported the partial funding, which provided financial support to this research through the Senior Research Scholar Project of Sanun Jogloy (Project No. RTA 6180002). It was also partially funded by the research funding of the Northeast Thailand Cane and Sugar Research Center (NECS), Khon Kaen University (KKU), Khon Kaen, Thailand.

Data Availability Statement

The data presented in this study are available within the article.

Acknowledgments

Special thanks are due to the Thailand Research Fund, Knowledge Creation for Sugarcane Development Project from the Office of the Cane and Sugar Board (OCSB), the Department of Agronomy, Faculty of Agriculture, Khon Kaen University, the Northeast Thailand Cane and Sugar Research Center (NECS), Khon Kaen University (KKU), and Khon Kaen Field Crops Research Center, Department of Agriculture for providing research facilities.

Conflicts of Interest

The authors declare no conflict of interest.

References

  1. Li, C.; Jackson, P.; Lu, X.; Xu, C.; Cai, Q.; Basnayake, J.; Lakshmanan, P.; Ghannoum, O.; Fan, Y. Genotypic variation in transpiration efficiency due to differences in photosynthetic capacity among sugarcane–related clones. J. Exp. Bot. 2017, 68, 2377–2385. [Google Scholar] [CrossRef]
  2. Food and Agriculture Organization of the United Nations. FAOSTAT: Crops and Livestock Products; Food and Agriculture Organization of the United Nations: Québec City, QC, Canada, 2021; Available online: https://www.fao.org/faostat/en/#data/QCL/visualize (accessed on 10 September 2021).
  3. De Aquino, G.S.; de Contri Medina, C.; da Costa, D.C.; Shahab, M.; Santigo, A.D. Sugarcane straw management and its impact on production and development of ratoons. Ind. Crops Prod. 2017, 102, 58–64. [Google Scholar] [CrossRef]
  4. Pipitpukdee, S.; Attavanich, W.; Bejranonda, S. Climate change impacts on sugarcane production in Thailand. Atmosphere 2020, 11, 408. [Google Scholar] [CrossRef]
  5. Jangpromma, N.; Thammasirirak, S.; Jaisil, P.; Songsri, P. Effects of drought and recovery from drought stress on above ground and root growth, and water use efficiency in sugarcane (Saccharum officinarum L.). Aust. J. Crop Sci. 2012, 6, 1298–1304. [Google Scholar]
  6. Wolde, Z.; Adane, A. Determination of planting season of sugarcane at Kuraz sugar development project, Southern Ethiopia. ASRJETS 2014, 7, 44–49. [Google Scholar]
  7. Jaiphong, T.; Tominaga, J.; Watanabe, K.; Nakabaru, M.; Takaragawa, H.; Suwa, R.; Ueno, M.; Kawamitsu, Y. Effects of duration and combination of drought and flood conditions on leaf photosynthesis, growth and sugar content in sugarcane. Plant Prod. Sci. 2016, 19, 427–437. [Google Scholar] [CrossRef]
  8. Leanasawat, N.; Kosittrakun, M.; Lontom, W.; Songsri, P. Physiological and agronomic traits of certain sugarcane genotypes grown under field conditions as influenced by early drought stress. Agronomy 2021, 11, 2319. [Google Scholar] [CrossRef]
  9. Hemaprabha, G.; Nagarajan, R.; Alarmelu, S. Response of sugarcane genotypes to water deficit stress. Sugar Tech 2004, 6, 165–168. [Google Scholar] [CrossRef]
  10. Devi, K.; Gomathi, R.; Arun Kumar, R.; Manimekalai, R.; Selvi, A. Field tolerance and recovery potential of sugarcane varieties subjected to drought. Indian J. Plant Physiol. 2018, 23, 271–282. [Google Scholar] [CrossRef]
  11. Dinh, H.T.; Watanable, K.; Takaragawa, H.; Kawamitsu, Y. Effects of drought stress at early growth stage on response of sugarcane to different nitrogen application. Sugar Tech 2018, 20, 420–430. [Google Scholar] [CrossRef]
  12. Khonghintaisong, J.; Songsri, P.; Jongrungklang, N. Understanding growth rate patterns among different drought resistant sugarcane cultivars during plant and ratoon crops encountered water deficit at early growth stage under natural field conditions. Agronomy 2021, 11, 2083. [Google Scholar] [CrossRef]
  13. Silva, F.L.; Pedrozo, C.Â.; Barbosa, M.H.P.; Resende, M.D.V.; Peternelli, L.A.; Costa, P.M.A.; Vieira, M.S. Análise de trilha para os componentes de produção de cana-de-açúcar via blup. Rev. Ceres 2009, 56, 308–314. [Google Scholar]
  14. Robertson, M.J.; Inman-Bamber, N.G.; Muchow, R.C.; Wood, A.W. Physiology and productivity of sugarcane with early and mid–season water deficit. Field Crops Res. 1999, 64, 211–227. [Google Scholar] [CrossRef]
  15. Som–Ard, J.; Atzberger, C.; Izquierdo–Verdiguier, E.; Vuolo, F.; Immitzer, M. Remote sensing applications in sugarcane cultivation. Remote Sens. 2021, 13, 4040. [Google Scholar] [CrossRef]
  16. Silva, P.P.; Soares, L.; Costa, J.G.; Viana, L.S.; Andrade, J.C.F.; Goncalves, E.R.; Santos, J.M.; Barbosa, G.V.S.; Nascimento, V.X.; Todaro, A.R.; et al. Path analysis for selection of drought tolerant sugarcane genotypes through physiological components. Ind Crops Prod. 2012, 37, 11–19. [Google Scholar] [CrossRef]
  17. Ramesh, P.; Mahadevaswamy, M. Effect of formative phase drought on different classes of shoots, shoot mortality, cane attributes, yield and quality of four sugarcane cultivars. J. Agron. Crop Sci. 2000, 185, 249–258. [Google Scholar] [CrossRef]
  18. Silva, M.A.; Jifon, J.L.; Santos, C.M.; Jadoski, C.J.; Silva, J.A.G. Photosynthetic capacity and water use efficiency in sugarcane genotypes subject to water deficit during early growth phase. Braz Arch Biol. Technol. 2013, 56, 735–748. [Google Scholar] [CrossRef]
  19. Castro, P.R.C.; Zambon, S.; Sansigolo, M.A.; Beltrame, J.A.; Nogueira, M.C.S. Ação comparada de ethrel, fuzilade e roundup, em duas épocas de aplicação, na maturação e produtividade da cana-de-açúcar SP 70-1143. Rev. Agric. 2002, 77, 23–38. [Google Scholar] [CrossRef]
  20. Ferreira, T.H.S.; Tsunada, M.S.; Bassi, D.; Araujo, P.; Mattiello, L.; Guidelli, G.V.; Righetto, G.L.; Goncalves, R.V.; Lakshmanan, P.; Menossi, M. Sugarcane water stress tolerance mechanisms and its implications on developing biotechnology solutions. Front. Plant Sci. 2017, 8, 1077–1095. [Google Scholar] [CrossRef]
  21. Reyes, J.A.O.; Carpentero, A.S.; Santos, P.J.A.; Delfin, E.F. Effects of water regime, genotype, and formative stages on the agro–physiological response of sugarcane (Saccharum officinarum L.) to drought. Plants 2020, 9, 661. [Google Scholar] [CrossRef]
  22. Azevedo, R.A.; Carvalho, R.F.; Cia, M.C.; Gratão, P.L. Sugarcane under pressure: An overview of biochemical and physiological studies of abiotic stress. Trop. Plant Biol. 2011, 4, 42–51. [Google Scholar] [CrossRef]
  23. Luo, J.; Pan, Y.B.; Xu, L.; Zhang, Y.; Zhang, H.; Chen, R.; Que, Y. Photosynthetic and canopy characteristics of different varieties at the early elongation stage and their relationships with the cane yield in sugarcane. Sci. World J. 2014, 2014, 707095. [Google Scholar] [CrossRef]
  24. Basnayake, J.; Jackson, P.A.; Inman–Bamber, N.G.; Lakshmanan, P. Sugarcane for water–limited environments. Variation in stomatal conductance and its genetic correlation with crop productivity. J. Exp. Bot. 2015, 66, 3945–3958. [Google Scholar] [CrossRef]
  25. Rodrigues, F.A.; Laia, M.L.; Zingaretti, S.M. Analysis of gene expression profiles under water stress in tolerant and sensitive sugarcane plants. Plant Sci. 2009, 176, 286–302. [Google Scholar] [CrossRef]
  26. Bunphan, D.; Sinsiri, N.; Wanna, R. Application of SCMR and fluorescence for chlorophyll measurement in sugarcane. Int. J. GEOMATE 2019, 16, 33–38. [Google Scholar] [CrossRef]
  27. Zhao, D.; Glaz, B.; Comstock, J.C. Sugarcane response to water-deficit stress during early growth on organic and sandy soils. Am. J. Agric. Biol. Sci. 2010, 5, 403–414. [Google Scholar] [CrossRef]
  28. Endres, L.; Silva, J.V.; Ferreira, V.M.; Barbosa, G.V.D.S. Photosynthesis and water relations in Brazilian sugarcane. Open Agric. J. 2010, 4, 31–37. [Google Scholar] [CrossRef]
  29. Zhang, H.; Kaiuki, S.; Schroder, J.L.; Payton, M.E.; Focht, C. Interlaboratory validation of the Mehlich 3 method for extraction of plant–available phosphorus. J. AOAC Int. 2009, 92, 91–102. [Google Scholar] [CrossRef] [PubMed]
  30. Meyer, J. Sugarcane nutrition and fertilization. In Good Management Practices Manual for the Cane Sugar Industry; Meyer, J., Ed.; The International Finance Corporation (IFC): Johannesburg, South Africa, 2011; pp. 173–226. [Google Scholar]
  31. Santanoo, S.; Vongcharoen, K.; Banterng, P.; Vorasoot, N.; Jogloy, S.; Roytrakul, S.; Theerakulpisut, P. Seasonal variation in diurnal photosynthesis and chlorophyll fluorescence of four genotypes of cassava (Manihot esculenta Crantz) under irrigation conditions in a tropical savanna climate. Agronomy 2019, 9, 206. [Google Scholar] [CrossRef]
  32. Moran, R. Formulae for determination of chlorophyllous pigments extracted with N, N–dimethylformamide. Plant Physiol. 1982, 69, 1376–1381. [Google Scholar] [CrossRef]
  33. Statistix-Data Analysis Software for Researchers, Version 10.0; Analytical Software: Tallahassee, FL, USA, 2013. Available online: https://www.statistix.com/ (accessed on 1 September 2022).
  34. Gomez, K.A.; Gomez, A.A. Statistical Procedures for Agricultural Research; John Wiley and Sons: Singapore, 1984. [Google Scholar]
  35. Waclawovsky, A.J.; Sato, P.M.; Lembke, C.G. Sugarcane for bioenergy production: An assessment of yield and regulation of sucrose content. Plant Biotechnol. J. 2010, 8, 263–276. [Google Scholar] [CrossRef] [PubMed]
  36. Meena, M.R.; Kumar, R.; Chinnaswamy, A.; Karuppaiyan, R.; Kulshreshtha, N.; Ram, B. Current breeding and genomic approaches to enhance the cane and sugar productivity under abiotic stress conditions. 3 Biotech 2020, 10, 440. [Google Scholar] [CrossRef]
  37. Lugojan, C.; Ciulca, S. Evaluation of relative water content in winter wheat. J. Hortic. For. Biotechnol. 2011, 15, 173–177. [Google Scholar]
  38. Jahan, E.; Sharwood, R.E.; Tissue, D.T. Effects of leaf age during drought and recovery on photosynthesis, mesophyll conductance and leaf anatomy in wheat leaves. Front. Plant Sci. 2023, 14, 1091418. [Google Scholar] [CrossRef] [PubMed]
  39. Varone, L.; Ribas–Carbo, M.; Cardona, C.; Galle, A.; Medrano, H.; Gratani, L. Stomatal and non-stomatal limitations to photosynthesis in seedlings and saplings of Mediterranean species pre-conditioned and aged in nurseries: Different response to water stress. Environ. Exp. Bot. 2012, 75, 235–247. [Google Scholar] [CrossRef]
  40. Endres, L.; dos Santos, C.M.; Silva, J.V.; Barbosa, G.V.D.S.; Silva, A.L.J.; Froehlich, A.; Teixeira, M.M. Inter-relationship between photosynthetic efficiency, Δ13C, antioxidant activity and sugarcane yield under drought stress in field conditions. J. Agron. Crop Sci. 2019, 205, 433–446. [Google Scholar] [CrossRef]
  41. Verstraeten, W.W.; Veroustraete, F.; Feyen, J. Assessment of evapotranspiration and soil moisture content across different scales of observation. Sensors 2008, 8, 70–117. [Google Scholar] [CrossRef]
  42. Mir, R.R.; Zaman–Allah, M.; Sreenivasulu, N.; Trethowan, R.; Varshney, R.K. Integrated genomics, physiology and breeding approaches for improving drought tolerance in crops. Theor. Appl. Genet. 2012, 125, 625–645. [Google Scholar] [CrossRef]
  43. Dinh, T.H.; Takaragawa, H.; Watanabe, K.; Nakabaru, M.; Kawamitsu, Y. Leaf photosynthesis response to change of soil moisture content in sugarcane. Sugar Tech 2019, 21, 949–958. [Google Scholar] [CrossRef]
  44. Natarajan, S.; Basnayake, J.; Lakshmanan, P.; Fukai, S. Genotypic variation in intrinsic transpiration efficiency correlates with sugarcane yield under rainfed and irrigated field conditions. Physiol. Plant 2020, 172, 976–989. [Google Scholar] [CrossRef]
  45. da Graca, J.P.; Rodrigues, F.A.; Farias, J.R.B.; da Oliveira, M.C.N.; Hoffmann-Campo, C.B.; Zingaretti, S.M. Physiological parameters in sugarcane cultivars submitted to water deficit. Braz. J. Plant Physiol. 2010, 22, 189–197. [Google Scholar] [CrossRef]
  46. Slatyer, R.O.; Bierhuizen, J.F. The influence of several transpiration suppressants on transpiration, photosynthesis, and water-use efficiency of cotton leaves. Aust. J. Biol. Sci. 1964, 17, 131–146. [Google Scholar] [CrossRef]
  47. Pallardy, S.G. Photosynthesis. In Physiology of Woody Plants, 3rd ed.; Pallardy, S.G., Ed.; Academic Press: San Diego, CA, USA, 2010; pp. 107–167. [Google Scholar]
  48. Bunce, J.A. Low humidity effects on photosynthesis in single leaves of C4 plants. Oecologia 1982, 54, 233–235. [Google Scholar] [CrossRef] [PubMed]
  49. Suriyan, C.U.; Chalermpol, K. Proline accumulation, photosynthetic abilities and growth characters of sugarcane (Saccharum officinarum L.) plantlets in response to iso-osmotic salt and water-deficit stress. Agric. Sci. China 2009, 8, 51–58. [Google Scholar] [CrossRef]
  50. Silva, A.L.C.; Costa, W.A.J.M. Varietal variation in stomatal conductance, transpiration and photosynthesis of commercial sugarcane varieties under two contrasting water regimes. Trop. Agric. Res. Ext. 2009, 12, 97–102. [Google Scholar] [CrossRef]
  51. Irvine, J.E. Relations of photosynthetic rate and leaf and canopy characters of sugarcane yield. Crop Sci. 1975, 15, 671–676. [Google Scholar] [CrossRef]
  52. Lawson, T.; Vialet–Chabrand, S. Speedy stomata, photosynthesis and plant water use efficiency. New Phytol. 2019, 221, 93–98. [Google Scholar] [CrossRef]
  53. Sampaio–Filho, I.J.; Jardine, K.J.; de Oliveira, R.C.A.; Gimenez, B.O.; Cobello, L.O.; Piva, L.R.O.; Candido, L.A.; Higuchi, N.; Chambers, J.Q. Below versus above ground plant sources of abscisic acid (ABA) at the heart of tropical forest response to warming. Int. J. Mol. Sci. 2018, 19, 2023. [Google Scholar] [CrossRef]
  54. Reynold, M.; Langridge, P. Physiological breeding. Curr. Opin. Plant Biol. 2016, 31, 162–171. [Google Scholar] [CrossRef]
  55. Maxwell, K.; Johnson, G.N. Chlorophyll fluorescence: A practical guide. J. Exp. Bot. 2000, 51, 659–668. [Google Scholar] [CrossRef]
  56. Silva, M.A.; Jifon, J.L.; Sharma, V.; da Silva, J.A.G.; Caputo, M.M.; Damaj, M.B. Use of physiological parameters in screening drought tolerance in sugarcane genotypes. Sugar Tech 2011, 13, 178–184. [Google Scholar] [CrossRef]
  57. Souza, A.P.; Grandis, A.; Arenque–Musa, B.C.; Buckeridge, M. Diurnal variation in gas exchange and nonstructural carbohydrates throughout sugarcane development. Funct. Plant Biol. 2018, 45, 865–876. [Google Scholar] [CrossRef] [PubMed]
  58. Ribeiro, R.V.; Machado, R.S.; Machado, E.C.; Machado, D.F.S.P.; Filho, R.M.; Landell, M.G.A. Revealing drought-resistance and productive patterns in sugarcane genotypes by evaluating both physiological responses and stalk yield. Exp. Agric. 2013, 49, 212–224. [Google Scholar] [CrossRef]
  59. Torres, N.A.; Campostrini, E.; Oliveira, J.G.; Bressan-Smith, R.E. Photosynthetic pigments, nitrogen, chlorophyll a fluorescence and SPAD–502 readings in coffee leaves. Sci. Hort. 2005, 104, 199–209. [Google Scholar] [CrossRef]
  60. Sugiura, D.; Watanabe, C.K.A.; Betsuyak, E.; Terashima, I. Sink–source balance and down–regulation of photosynthesis in Raphanus sativus: Effects of grafting, N and CO2. Plant Cell Physiol. 2017, 58, 2043–2056. [Google Scholar] [CrossRef] [PubMed]
  61. Ellis, R.D.; Lankford, B.A. The tolerance of sugarcane to water stress during its main development phases. Agric. Water Manag. 1990, 17, 117–128. [Google Scholar] [CrossRef]
Figure 1. Rainfall (mm), maximum temperature (°C), minimum temperature (°C), solar radiation (MJ m−2 day−1), relative humidity (%), evaporation (mm) (a,b), and soil moisture content (%) at the depth of 0–30 cm (c,d) and 30–60 cm (e,f) during the crop growth period of sugarcane. FC = field capacity; PWP = permanent wilting point from November 2020 to May 2021 (plant cane) and November 2021 to May 2022 (ratoon cane).
Agronomy 13 02594 g001
Figure 2. Relative water content (RWC) across sugarcane genotypes at 1, 3, 4, 5, and 6 months after transplanting (MAT) in the plant cane (a) and at 1, 3, and 6 months after harvesting (MAH) in the ratoon cane (b) with no water stress (SD0), short-term drought by withholding water at 3–6 MAT/MAH (SD1), and long-term drought by withholding water at 1–6 MAT/MAH (SD2). Values are mean ± SE (n = 24). Different lowercase letters above the SE-bar at each plant age indicate significant differences among water treatments by LSD test at 5%, ns = non-significant.
Agronomy 13 02594 g002
Figure 3. Relative water content (RWC) of six sugarcane genotypes under different early season drought durations at different plant ages in plant cane (a) and ratoon cane (b) with no water stress (SD0), short-term drought by withholding water at 3–6 MAT/MAH (SD1), and long-term drought by withholding water at 1–6 MAT/MAH (SD2). The different lowercase letters above the SE-bar at each plant age indicate significant differences among water treatments by LSD test at 5%, ns = non-significant.
Agronomy 13 02594 g003
Figure 4. (a,d) Net photosynthetic rate (A), (b,e) stomatal conductance (gs), and (c,f) transpiration rate (E) of six sugarcane genotypes under different early season drought durations at different plant ages in plant cane (ac) and ratoon cane (df) with no water stress (SD0), short-term drought by withholding water at 3–6 MAT/MAH (SD1), and long-term drought by withholding water at 1–6 MAT/MAH (SD2). The different lowercase letters above the SE-bar at each plant age indicate significant differences among water treatments by LSD test at 5%, ns = non-significant.
Agronomy 13 02594 g004aAgronomy 13 02594 g004b
Figure 5. (a,c) Chlorophyll fluorescence dark (Fv/Fm) and (b,d) chlorophyll fluorescence light (ΦPSII) of six sugarcane genotypes under different early season drought durations at different plant ages in plant cane and ratoon cane with no water stress (SD0), short-term drought by withholding water at 3–6 MAT/MAH (SD1) and long-term drought by withholding water at 1–6 MAT/MAH (SD2). The different lowercase letters above the SE-bar at each plant age indicate significant differences among water treatments by LSD test at 5%, ns = non-significant.
Agronomy 13 02594 g005
Figure 6. Leaf area index (LAI) of six sugarcane genotypes under different early season drought durations at different plant ages in plant cane (a) and ratoon cane (b) with no water stress (SD0), short-term drought by withholding water at 3–6 MAT/MAH (SD1), and long-term drought by withholding water at 1–6 MAT/MAH (SD2). Different lowercase letters above the SE-bar at each plant age indicate significant differences among water treatments by LSD test at 5%.
Agronomy 13 02594 g006
Table 1. Estimated chlorophyll contents including chlorophyll a, chlorophyll b, and chlorophyll total in six sugarcane genotypes at 1, 3, 4, 5, and 6 months after transplanting (MAT) in plant cane under no water stress (SD0), short-term drought by withholding water at 3–6 MAT (SD1), and long-term drought by withholding water at 1–6 MAT (SD2).
GenotypesChl a (μg cm−2)Chl b (μg cm−2)Chl total (μg cm−2)
1 MATSD0SD1SD2SD0SD1SD2SD0SD1SD2
F03-36211.69Aa9.88 Ab10.32 Aab3.58 Aa2.98 Ab2.64 Aa15.28 Aa12.87 Ab12.96 Aa
KK09-03589.39 Aa10.32 Ab10.52 Aab2.75 Aa2.88 Ab3.03 Aa12.14 Aa13.20 Ab13.57 Aa
KK09-093910.77 Aa9.28 Ab8.73 Ab3.60 Aa2.84 Ab2.66 Aa14.38 Aa12.12 Ab11.39 Aa
TPJ04-76811.48 Aa13.35 Aa11.21 Aab3.69 Aa4.14 Aa3.37 Aa15.17 Aa17.50 Aa14.59 Aa
KK39.43 Aa11.16 Ab10.99 Aab2.54 Aa3.60 Aab2.88 Aa11.99 Aa14.76 Ab13.87 Aa
UT129.92 Aa10.33 Ab10.53 Aab3.12 Aa2.86 Ab3.17 Aa13.04 Aa13.20 Ab13.71 Aa
Mean10.4510.7210.383.213.212.9613.6713.9413.35
F-testns**nsns**nsns**ns
CV (%)17.2212.4715.6224.5216.7020.7017.4212.7516.05
3 MATSD0SD1SD2SD0SD1SD2SD0SD1SD2
F03-3628.84 Aab8.82 Aab9.27 Aab2.73 Aab2.67 Aab2.65 Aab11.58 Aab11.49 Aab11.93 Aab
KK09-03589.55 Aa9.16 Aa8.93 Aab3.06 Aa2.70 Aab3.51 Aa12.61 Aa11.86 Aab12.44 Aa
KK09-09396.92 Bc8.17 Aab7.02 Bb2.61 Aab2.53 Aab2.25 Ab9.53 Ac10.70 Aab9.27 Ab
TPJ04-7689.03 Aab9.17 Aa9.61 Aa2.49 Ab2.79 Aa2.65 Aab11.53 Aab11.97 Aa12.27 Aab
KK37.80 Abc8.53 Aab7.98 Aab2.25 Ab2.33 Ab2.90 Aab10.05 Abc10.87 Aab10.89 Aab
UT128.73 Aab7.83 Ab8.16 Aab2.72 Aab2.44 Aab2.71 Aab11.45 Aabc10.27 Ab10.87 Aab
Mean8.488.618.502.642.582.7811.1211.1911.28
F-test*nsnsnsnsns*nsns
CV (%)12.959.7219.6512.7511.1026.9011.769.5017.97
4 MATSD0SD1SD2SD0SD1SD2SD0SD1SD2
F03-3628.48 Aa7.95 Aa7.87 Aa2.64 Aa1.81 Aa2.51 Aa11.13 Aa9.76 Aab10.39 Aa
KK09-03588.43 Aa7.98 Aa7.56 Aab2.65 Aa2.06 Aa2.25 Aab11.09 Aa10.04 Aa9.82 Aab
KK09-09397.37 Aab6.53 Aab5.82 Ac2.16 Aa2.27 Aa2.01 Aab8.92 Aab8.81 Aab7.84 Ab
TPJ04-7687.02 Aab7.17 Aab5.95 Ac2.31 Aa2.39 Aa2.04 Aab9.68 Aab9.57 Aab7.99 Ab
KK36.76 Aab6.41 Ab6.03 Abc2.12 Aa2.39 Aa1.82 Ab9.16 Aab8.80 Aab7.85 Ab
UT126.07 Ab6.11 Ab6.56 Aabc1.98 Aa1.98 Aa2.16 Aab8.05 Ab8.10 Aab8.73 Aab
Mean7.367.026.632.312.152.139.679.188.77
F-testnsns*nsnsnsnsnsns
CV (%)18.2414.4015.3520.1734.1016.0018.6112.9515.34
5 MATSD0SD1SD2SD0SD1SD2SD0SD1SD2
F03-3629.78 Aa8.31 Aa8.56 Aa2.33 Aab2.18 Aa2.22 Aa12.11 Aa10.49 Aa10.78 Aa
KK09-03589.60 Aab8.26 Aa8.24 Aab2.25 Aab2.08 Aab2.07 Aab11.85 Aab10.35 Aa10.31 Aab
KK09-09398.33 Aab6.67 Bb6.35 Bc2.03 Aab1.81 Abc1.79 Abc10.36 Aab8.48 ABbc8.14 Bcd
TPJ04-76810.03 Aa7.91 Bab7.11 Bbc2.46 Aa2.17 ABa1.94 Babc12.49 Aa10.08 Bab9.05 Bbcd
KK38.55 Aab6.79 Ab7.69 Aab1.96 Ab1.71 Ac1.90 Abc10.51 Aab8.50 Abc9.59 Aabc
UT127.93 Ab6.47 Bb6.27 Bc1.92 Ab1.61 Ac1.70 Ac9.85 Ab8.08 Abc7.98 Bd
Mean9.037.407.372.161.931.9311.209.339.31
F-testnsns**ns***ns***
CV (%)12.8812.9811.7113.7711.7010.9012.9512.6111.15
6 MATSD0SD1SD2SD0SD1SD2SD0SD1SD2
F03-3628.81 ABab8.38 Ba9.56 Aa2.72 Aab2.56 Aa3.04 Aa11.53 ABabc10.95 Ba12.61 Aa
KK09-03589.01 Aab8.22 Aa8.62 Aa2.92 Aa2.59 Aa3.22 Aa11.93 Aab10.81 Aa11.85 Aab
KK09-09397.54 Ab7.80 Aa7.09 Ab2.63 Aab2.91 Aa2.39 Aa10.18 Abc10.71 Aa9.49 Ac
TPJ04-7689.67 Aa8.53 Aa8.47 Aab3.26 Aa3.33 Aa2.82 Aa12.94 Aa11.86 Aa11.28 Ab
KK37.19 Ab8.58 Aa8.63 Aa2.11 Ab2.72 Aa3.02 Aa9.30 Ac11.30 Aa11.65 Aab
UT128.37 Aab8.11 Aa8.72 Aa2.63 Aab2.65 Aa2.67 Aa11.00 Aabc10.77 Aa11.40 Aab
Mean8.438.278.512.712.792.8611.1511.0711.38
F-testnsns*nsnsnsnsns**
CV (%)15.179.5210.8016.8414.2023.3715.468.887.45
Different capital letters within the same row indicate a significant difference between the water treatments of each genotype by LSD test at 5%. Different lowercase letters within the same column indicate a significant difference between the genotypes of each water treatment by LSD test at 5%. **, *, and ns data significant at p ≤ 0.01, significant at p ≤ 0.05, and non-significant, respectively.
Table 2. Estimated chlorophyll contents including chlorophyll a, chlorophyll b, and chlorophyll total in six sugarcane genotypes at 1, 3, and 6 months after harvesting (MAH) in ratoon cane under no water stress (SD0), short-term drought by withholding water at 3–6 MAH (SD1), and long-term drought by withholding water at 1–6 MAH (SD2).
GenotypesChl a (μg cm−2)Chl b (μg cm−2)Chl total (μg cm−2)
1 MAHSD0SD1SD2SD0SD1SD2SD0SD1SD2
F03-3629.80 Aa9.52 Aa8.49 Aa2.99 Aa2.95 Aa3.00 Aa12.79 Aa12.47 Aa11.49 Aa
KK09-03588.24 Aa9.14 Aa9.01 Aa3.27 Aa3.11 Aa3.07 Aa11.52 Aa12.26 Aa12.08 Aa
KK09-09398.63 Aa8.86 Aa8.55 Aa3.05 Aa2.99 Aa3.16 Aa11.68 Aa11.86 Aa11.71 Aa
TPJ04-7688.85 Aa9.48 Aa9.55 Aa2.92 Aa3.17 Aa3.36 Aa11.78 Aa12.66 Aa12.92 Aa
KK38.23 Aa8.04 Aa8.72 Aa3.07 Aa3.25 Aa3.40 Aa11.31 Aa11.29 Aa12.12 Aa
UT128.47 Aa7.87 Aa9.20 Aa2.61 Aa2.62 Aa2.60 Aa11.09 Aa10.49 Aa11.81 Aa
Mean8.708.828.922.983.013.1011.7011.8412.02
F-testnsnsnsnsnsnsns**ns
CV (%)14.2414.6012.2218.7018.9319.4012.9413.8911.89
3 MAHSD0SD1SD2SD0SD1SD2SD0SD1SD2
F03-3627.04 Aa6.69 Aa6.84 Aa2.85 Aab2.47 Aa2.70 Aa9.89 Aa9.16 Aa9.54 Aa
KK09-03587.39 Aa6.37 Aa6.97 Aa2.87 Aab2.68 Aa3.10 Aa10.26 Aa9.06 Aa10.08 Aa
KK09-09395.81 Aa6.39 Ba7.03 Aa2.43 Aab2.38 Aa2.74 Aa8.24 Ba8.77 ABa9.78 Aa
TPJ04-7686.99 Aa6.66 Aa7.22 Aa2.55 Aab2.54 Aa2.44 Aa9.54 Aa9.20 Aa9.66 Aa
KK37.03 Aa6.94 Aa7.58 Aa1.90 Ab2.58 Aa2.75 Aa8.93 Aa9.52 Aa10.34 Aa
UT126.85 Aa6.68 Aa7.13 Aa3.65 Aa2.49 Aa2.68 Aa10.51 Aa9.17 Aa9.81 Aa
Mean6.856.627.132.712.522.739.569.149.87
F-testnsnsnsnsnsnsnsnsns
CV (%)24.1414.4116.7331.6520.9716.3021.9615.4514.37
6 MAHSD0SD1SD2SD0SD1SD2SD0SD1SD2
F03-3627.00 Aa7.81 Aa8.26 Aa2.20 Aab2.48 Aa2.72 Aa9.21 Aa10.29 Aa10.98 Aa
KK09-03587.47 Aa7.39 Aab7.94 Aab2.15 Aab1.90 Ab2.32 Aab9.62 Aa9.30 Aab10.26 Aab
KK09-09395.64 Ab6.63 Abc6.70 Abc1.76 Bb2.08 Ab2.02 ABb7.40 Ab8.71 Abc8.72 Abc
TPJ04-7686.34 Aab6.49 Abc6.66 Ac1.84 Aab1.92 Ab2.20 Aab8.18 Aab8.41 Abc8.87 Abc
KK36.75 Aab5.99 Ac5.91 Ac2.27 Aab1.94 Ab1.87 Ab9.03 Aab7.93 Ac7.79 Ac
UT127.27 Aa7.05 Aab6.96 Abc2.31 Aa2.14 Aab2.18 Aab9.58 Aa9.20 Aab9.15 Abc
Mean6.746.897.072.092.082.228.848.979.29
F-testns***ns*nsns****
CV (%)12.8810.1111.8016.7012.2117.3313.219.2512.27
Different capital letters within the same row indicate a significant difference between the water treatments of each genotype by LSD test at 5%. Different lowercase letters within the same column indicate a significant difference between the genotypes of each water treatment by LSD test at 5%. **, *, and ns data significant at p ≤ 0.01, significant at p ≤ 0.05, and non-significant, respectively.
Table 3. Biomass yield (tons ha−1) of six sugarcane genotypes at 6 months after transplanting (MAT) in plant cane and at 6 months after harvesting (MAH) in ratoon cane under no water stress (SD0), short-term drought by withholding water at 3–6 MAT/MAH (SD1), and long-term drought by withholding water at 1–6 MAT/MAH (SD2).
GenotypesBiomass Yield in Plant Cane (tons ha−1)Biomass Yield in Ratoon Cane (tons ha−1)
SD0SD1SD2SD0SD1SD2
F03-36231.85 a21.07 a14.64 a31.73 a24.14 a16.44 a
KK09-035828.62 b18.63 b12.08 b30.02 a17.05 b13.09 b
KK09-093927.05 b19.50 ab12.88 ab23.87 b24.35 a10.07 c
TPJ04-76827.36 b19.74 ab13.85 ab23.92 b22.67 a10.59 c
KK321.97 c14.38 c7.46 c21.60 c12.67 c5.75 d
UT1221.40 c16.25 c8.96 c22.55 bc14.01 c8.69 c
Mean26.3718.2611.6425.6119.1510.77
Different lowercase letters within the same column indicate a significant difference between the genotypes for each water treatment by LSD test at 5%.
Disclaimer/Publisher’s Note: The statements, opinions and data contained in all publications are solely those of the individual author(s) and contributor(s) and not of MDPI and/or the editor(s). MDPI and/or the editor(s) disclaim responsibility for any injury to people or property resulting from any ideas, methods, instructions or products referred to in the content.

