Article

Cover Crop Termination Methods and Custom Residue Manager Effects on Collard Production

1
USDA ARS National Soil Dynamics Laboratory, 411 S. Donahue Dr., Auburn, AL 36832, USA
2
Department of Crop, Soils, and Environmental Sciences, Auburn University, Auburn, AL 36849, USA
*
Author to whom correspondence should be addressed.
Agronomy 2023, 13(10), 2595; https://doi.org/10.3390/agronomy13102595
Submission received: 23 August 2023 / Revised: 25 September 2023 / Accepted: 9 October 2023 / Published: 11 October 2023
(This article belongs to the Special Issue Soil Health and Crop Management in Conservation Agriculture)

Abstract

:
Producers are looking for more sustainable methods of producing fresh vegetables. No-till systems that use cover crops to keep the soil surface covered can increase sustainability by reducing soil erosion, reducing weed pressure, and retaining soil moisture compared to bare soil cropping systems. Cover crop termination methods along with planting equipment modifications required to work in high residue planting systems are often areas of interest to farmers prior to adopting no-till systems. The objectives of this experiment are to compare the effects of two different cover crops, iron clay pea (Vigna unguiculata L.), and pearl millet (Pennisetum glaucum L.), using three different termination methods (rolled/crimped, mowed, and mowed + incorporated via tillage) and two no-till transplanter configurations (with and without residue manager) on soil properties and collard (Brassica oleracea L. var. viridis) yield. Results show that biomass production for pearl millet was greater, with a three-season average of 8461 kg ha−1 compared to 6465 kg ha−1 for iron clay pea. Rolled cover crops under drier weather conditions retained more volumetric soil moisture compared to other methods for both cover crops. Increases in total soil carbon and nitrogen concentration in the top 15 cm ranged from 8 to 11% and 23 to 35%, respectively. Collards grown in an iron clay pea cover crop produced greater weight and height per plant for all growing seasons compared to those grown in pearl millet. Collard yield was affected by cover crop type as reported with iron clay peas ranging from 2881–13,168 kg ha−1 compared to lower yield for the pearl millet cover crop with a range of 1354–8943 kg ha−1. Overall, both cover crops showed the ability to improve soil health by increasing total soil carbon, but collard production was better in the iron clay pea cover crop.

1. Introduction

Conservation agricultural cropping systems utilizing cover crops have gained in popularity over the past few decades. Some benefits can be seen in profits, and others are more long term, such as soil health improvements. Reduced input costs are often noticed due to decreased pesticide, fertilizer, and irrigation use [1,2]. The continued use of cover crops can also lead to increased soil water retention, carbon sequestration, organic matter increase, decreased soil erosion, and improved weed suppression [3,4]. Increased water infiltration and holding capacity enables soil moisture to be available to economic crops for longer durations in the growing season, thus easing drought stress and yield loss [1]. However, many different aspects must be considered when designing a cropping system, including cover crop species, cover crop termination method, and equipment required to effectively manage cover crop residues and planting operations. Different cover crop termination methods (including rolling/crimping, tillage, and mowing) and the timing of these methods have been investigated and present unique advantages and disadvantages to a cropping system. Cover crop termination timing determines how much biomass is produced. Obtaining maximum biomass production is key to realizing benefits such as erosion control and increased carbon sequestration [3,5]. Increasing soil organic matter from cover crops residues is of interest to producers where, in some cases, supplemental nutrient applications can be reduced or eliminated.
Roller/crimpers are popular pieces of no-till machinery used to terminate cover crops by damaging the cover crop (flattening on the soil surface) through a series of blunt blades equally spaced around the circumference of a large tube. When used properly, damage to plant stalks can accelerate death and minimize cover crop residue interference with the planter, compared to planting into a standing cover crop [3,4]. Mowing is another method used to manage cover crop residues. Many different mowers are available, but preference is given to flail mowers, as they tend to distribute residue more evenly, thus allowing the soil moisture and weed suppression benefits to be maximized. Mowing does give immediate termination results; however, under certain conditions it can lead to the regrowth of the cover crop giving way to cash crop competition for soil moisture and nutrients later in the season. Additional management methods include directly incorporating residue into the soil, usually with a disc or rotary tiller, and is often referred to as “green manure”. The crop can be mowed prior to tillage and the residue is incorporated into the soil to be broken down and digested by native soil organisms [1,6]. Compared to rolling/crimping or mowing alone, incorporating residue into soil has been shown to accelerate the mineralization of nitrogen from the breakdown of the residue [7]. This could benefit subsequent cash crops, especially if the cover crop was a legume. However, this method is energy intensive and does not offer any surface residue coverage for weed and moisture retention and can be prone to the runoff and depletion of soil structure. Cover crop selection along with termination method can provide advantages to the cash crop by providing supplemental nutrition during residue decomposition.
Weed pressure is minimized when residue covering the soil surface prevents sunlight exposure, resulting in prevented or delayed seed germination and ultimately, reduced spray frequencies [8]. Grass crops (Poaceae family) are known for high levels of biomass production, which provides good weed suppression, allelopathic effects, soil organic matter accumulation, erosion control, and scavenged residual nutrients. Popular warm season grasses include sorghum sudangrass (Sorghum bicolor L.) and pearl millet (Pennisetum glaucum L.) [2]. Warm season legume cover crops include velvet bean (Mucuna pruriens L.), peas (Vigna unguicilata L.) and sunn hemp (Crotalaria juncea L.). Legume groups must be matched with specific strains of Rhizobium bacteria for optimum nitrogen fixation to occur [2]. It has been shown in many studies that different strains of inoculum can improve nutrient available to subsequent crops, especially for nitrogen and phosphorus [9]. Legumes increase soil microbial activity, which can assist in improving nutrient levels in soil by helping to solubilize phosphorus, which is otherwise not usable by plants [9]. Non-legume crops such as corn (Poaceae family; Zea mays L.) can benefit from legumes in rotation by being able to use roughly 30–60% of the nitrogen that is fixed, thus reducing the amount of fertilization [2]. Additionally, crops with higher carbon to nitrogen ratios, like those from the Poaceae family instead of Fabaceae family, tend to persist on the soil surface and breakdown slower, thus providing longer benefits [2]. For example, researchers [10] evaluated the use of foxtail millet and forage soybeans as cover crops for broccoli production. They observed increased biomass production and C:N ratio with foxtail millet (7 t ha−1 and 43:1, respectively) compared to that of forage soybean (4.7 t ha−1 and 15:1). Higher C:N ratios can decrease the mineralization of nitrogen from cover crop residue due to immobilization not allowing it to be available for the subsequent crop [3]. Therefore, cover crop species selection is important in obtaining the sought after benefits of a cropping system.
Interest in consuming fresh vegetables, including collards (Brassica oleracea L. var. viridis), sold by local producers at farmers markets have also been on the rise. Collards are a healthy nutrition food source that contain a variety of minerals and vitamins, including iron, magnesium, potassium, vitamins C and A, and dietary fiber [11]. Collards are typically grown from seed in greenhouses and then transplanted into the field using a transplanter. Transplanted crops tend to have increased success in no-till systems compared to direct seeded crops due to less concern about adequate seed to soil contact for germination. Faster crop establishment also leads to earlier canopy closure, which decreases weed pressure [12]. However, residue can often interfere with planting operations by not allowing cutting coulters to sever surface residue, thus preventing the creation of an adequate soil furrow for placing seeds or transplants [13]. A conceptual patented device called the cover crop residue manager [14] could be a good addition to any planter for pressing residue against the soil surface to improve residue cutting and successful furrow opening [15]. Further research is needed to investigate the effectiveness of this device in managing heavy surface residue in vegetable planting operations.
This research investigates two different warm season cover crops (legume vs. non-legume) and three different cover crop termination methods (rolled/crimped, mowed, mowed + incorporated via tillage). A modified patented residue manager device was also evaluated using a no-till vegetable transplanter under different residue cutting and/or accumulation management scenarios. The objective of this research was to evaluate which cover cropping system (cover crop species and termination method) produces the best collard yields in the southeastern United States. Additionally, we investigated the use of the patented residue manager on the no-till vegetable transplanter.

2. Materials and Methods

2.1. Site Description and Weather

An experiment was established at Auburn University’s E.V. Smith Research and Extension Center—Plant Breeding Unit (32°29′53″ N, 85°53′30″ W) in Tallassee, AL, USA. The soil was a Kalmia loamy sand found in the southern Coastal Plain and consists of very deep, well-drained, moderately permeable soil formed from loamy over sandy alluvium, fluviomarine, and marine deposits [16]. The Kalmia soil series is classified as a fine-loamy over sandy or sandy-skeletal, siliceous, semiactive, thermic Typic Hapludults [17]. The climate for this region is humid subtropical with average high and low temperatures of 26 °C and 12 °C, respectively, and an average precipitation of 1299 mm [18]. This study was conducted over three growing seasons. The two different summer cover crops evaluated in this experiment were pearl millet and iron clay peas, also known as cowpeas. Three different termination treatments included rolling/crimping, mowing, and mowing with incorporation.
Weather data for the experimental area were provided by Medius Ag, LLC (Bird In Hand, PA, USA) [19], for all three seasons, including monthly average minimum and maximum temperatures along with the total monthly precipitation, and are presented in Table 1.

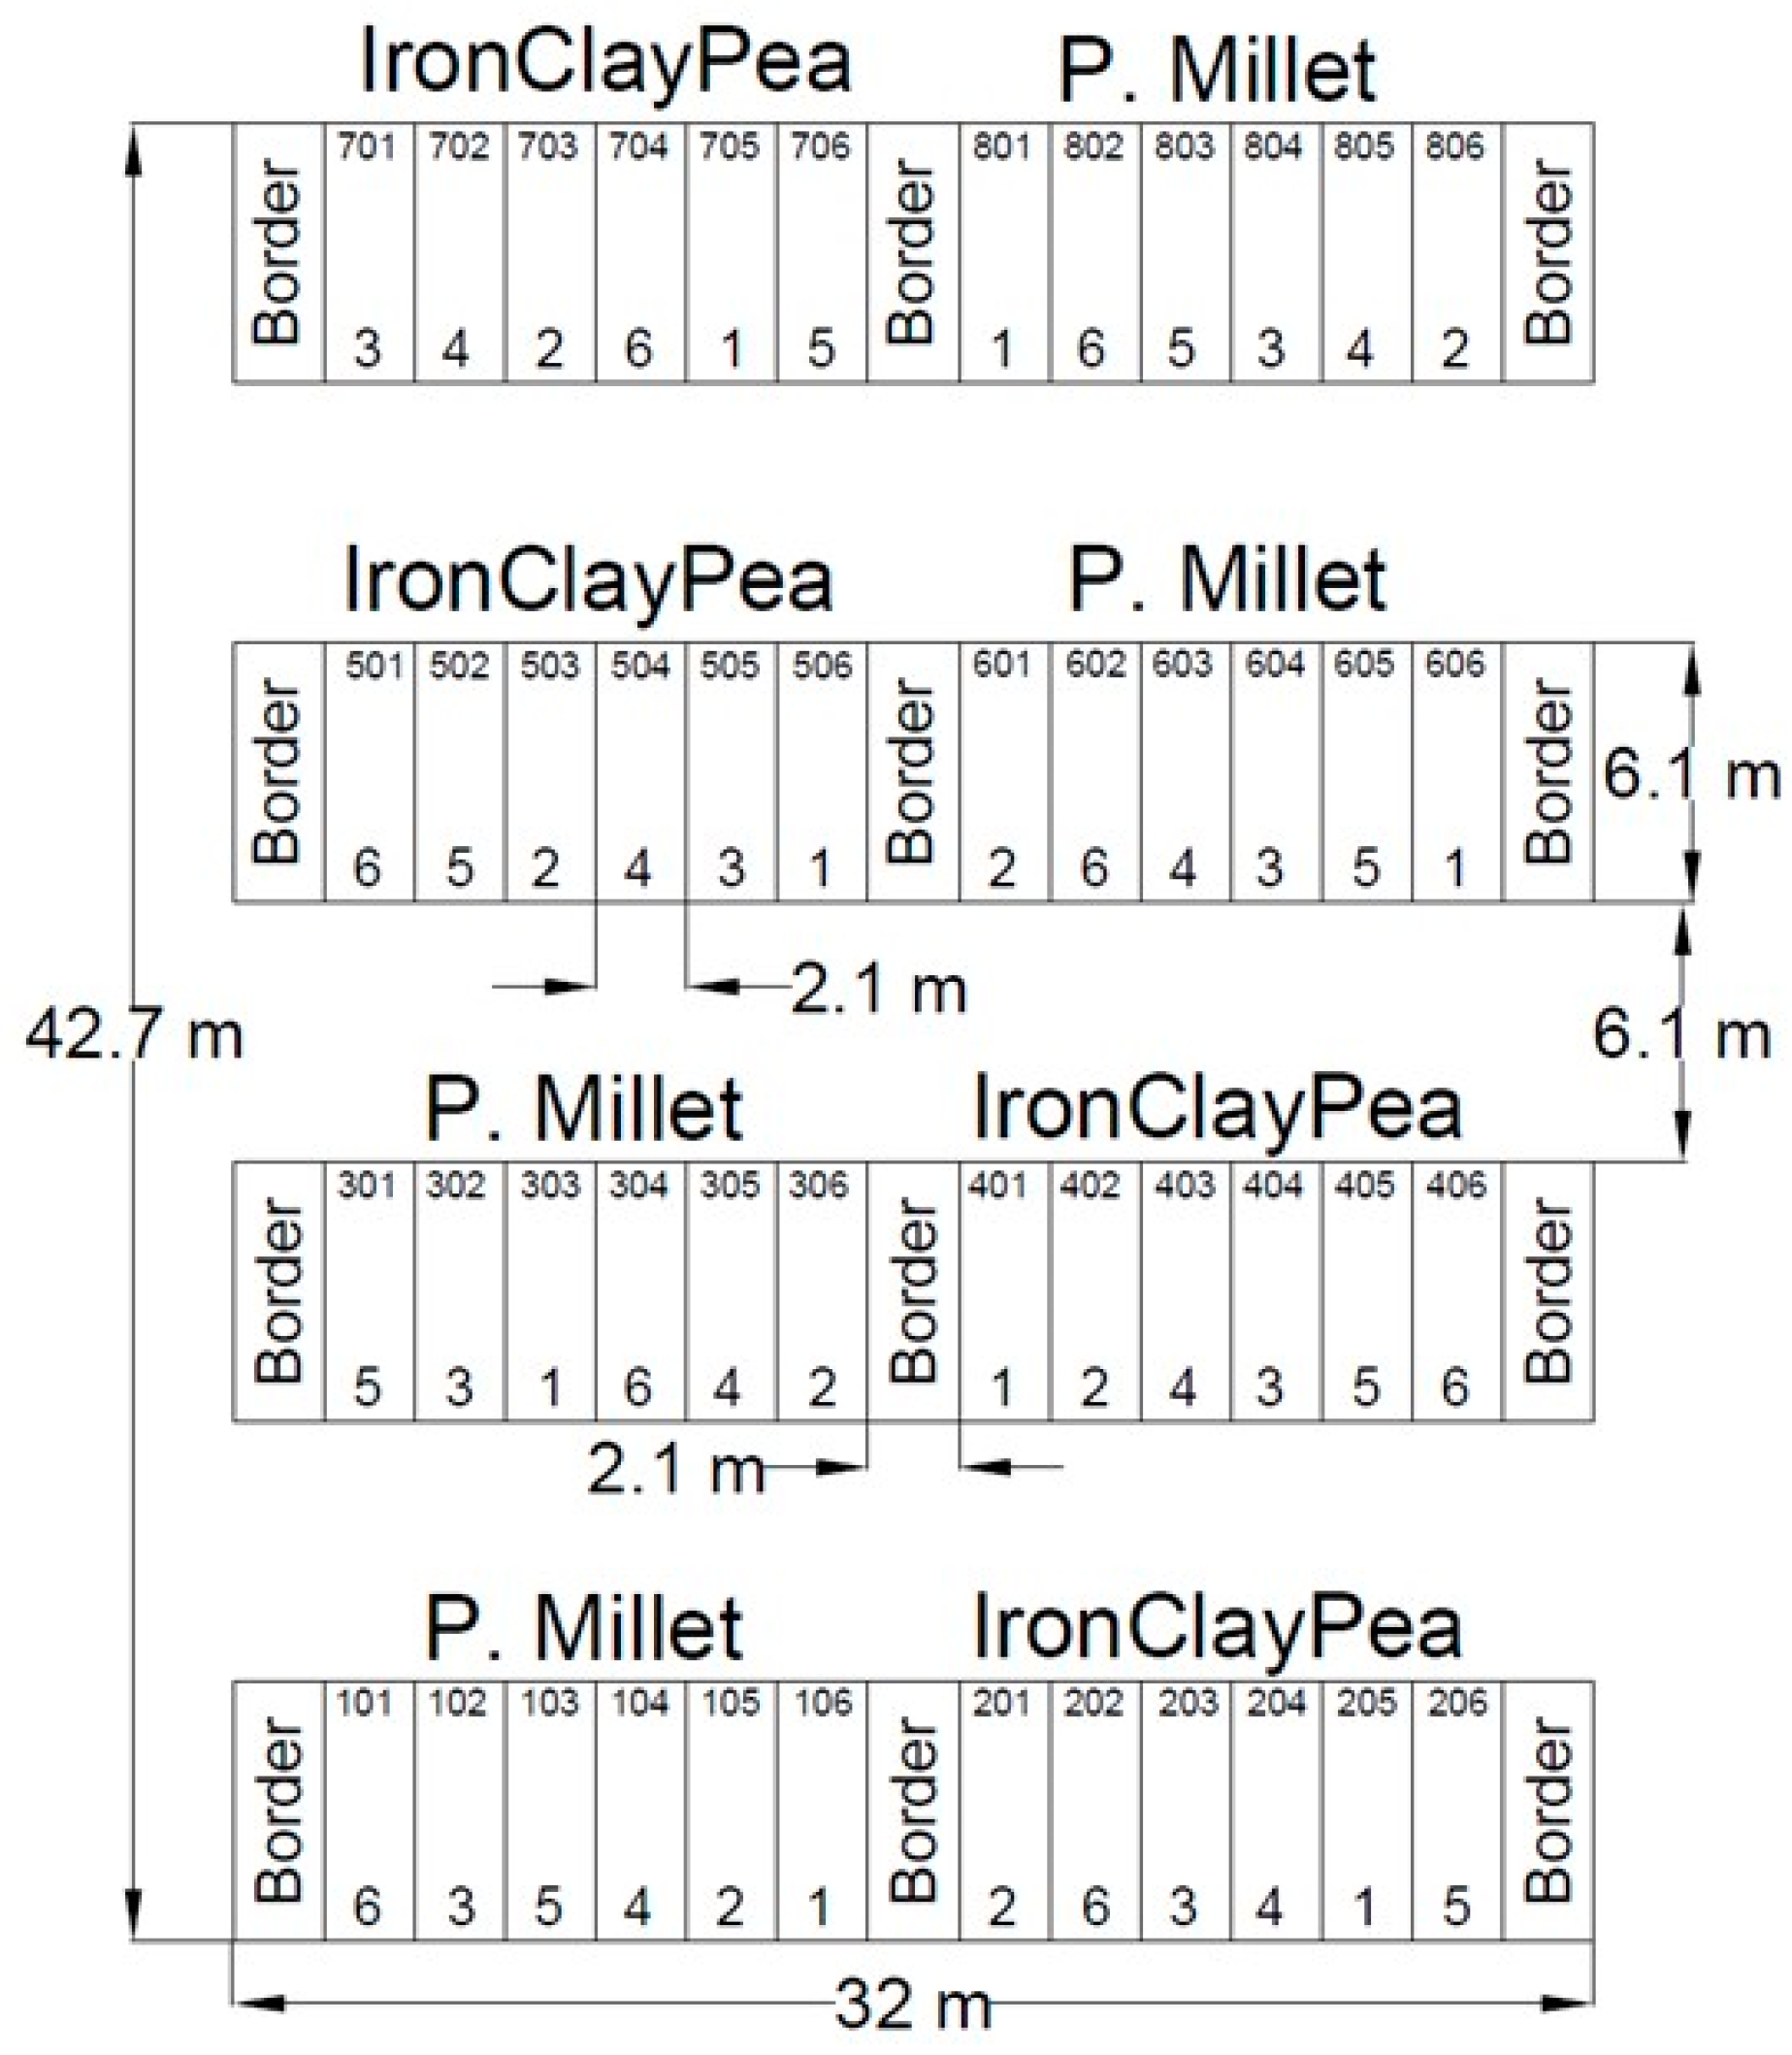
2.2. Experimental Design

This experiment was conducted with a split-plot restriction in a randomized complete block design. The plot length was 6.1 m with a 6.1 m border in between each block to allow space for maneuvering equipment during field operations (Figure 1). The main plots included blocks of each cover crop with 6 treatments (Table 2 shows 3 termination methods × 2 equipment configurations) randomized within each of the cover crop blocks as split plots. Each cover crop block was replicated 4 times, and the cover crop factors were randomly assigned using the PROC PLAN feature in SAS [20] to determine block placement. Once the blocks were assigned, the same procedure was performed to randomly assign treatments 1 through 6 within each cover crop factor.

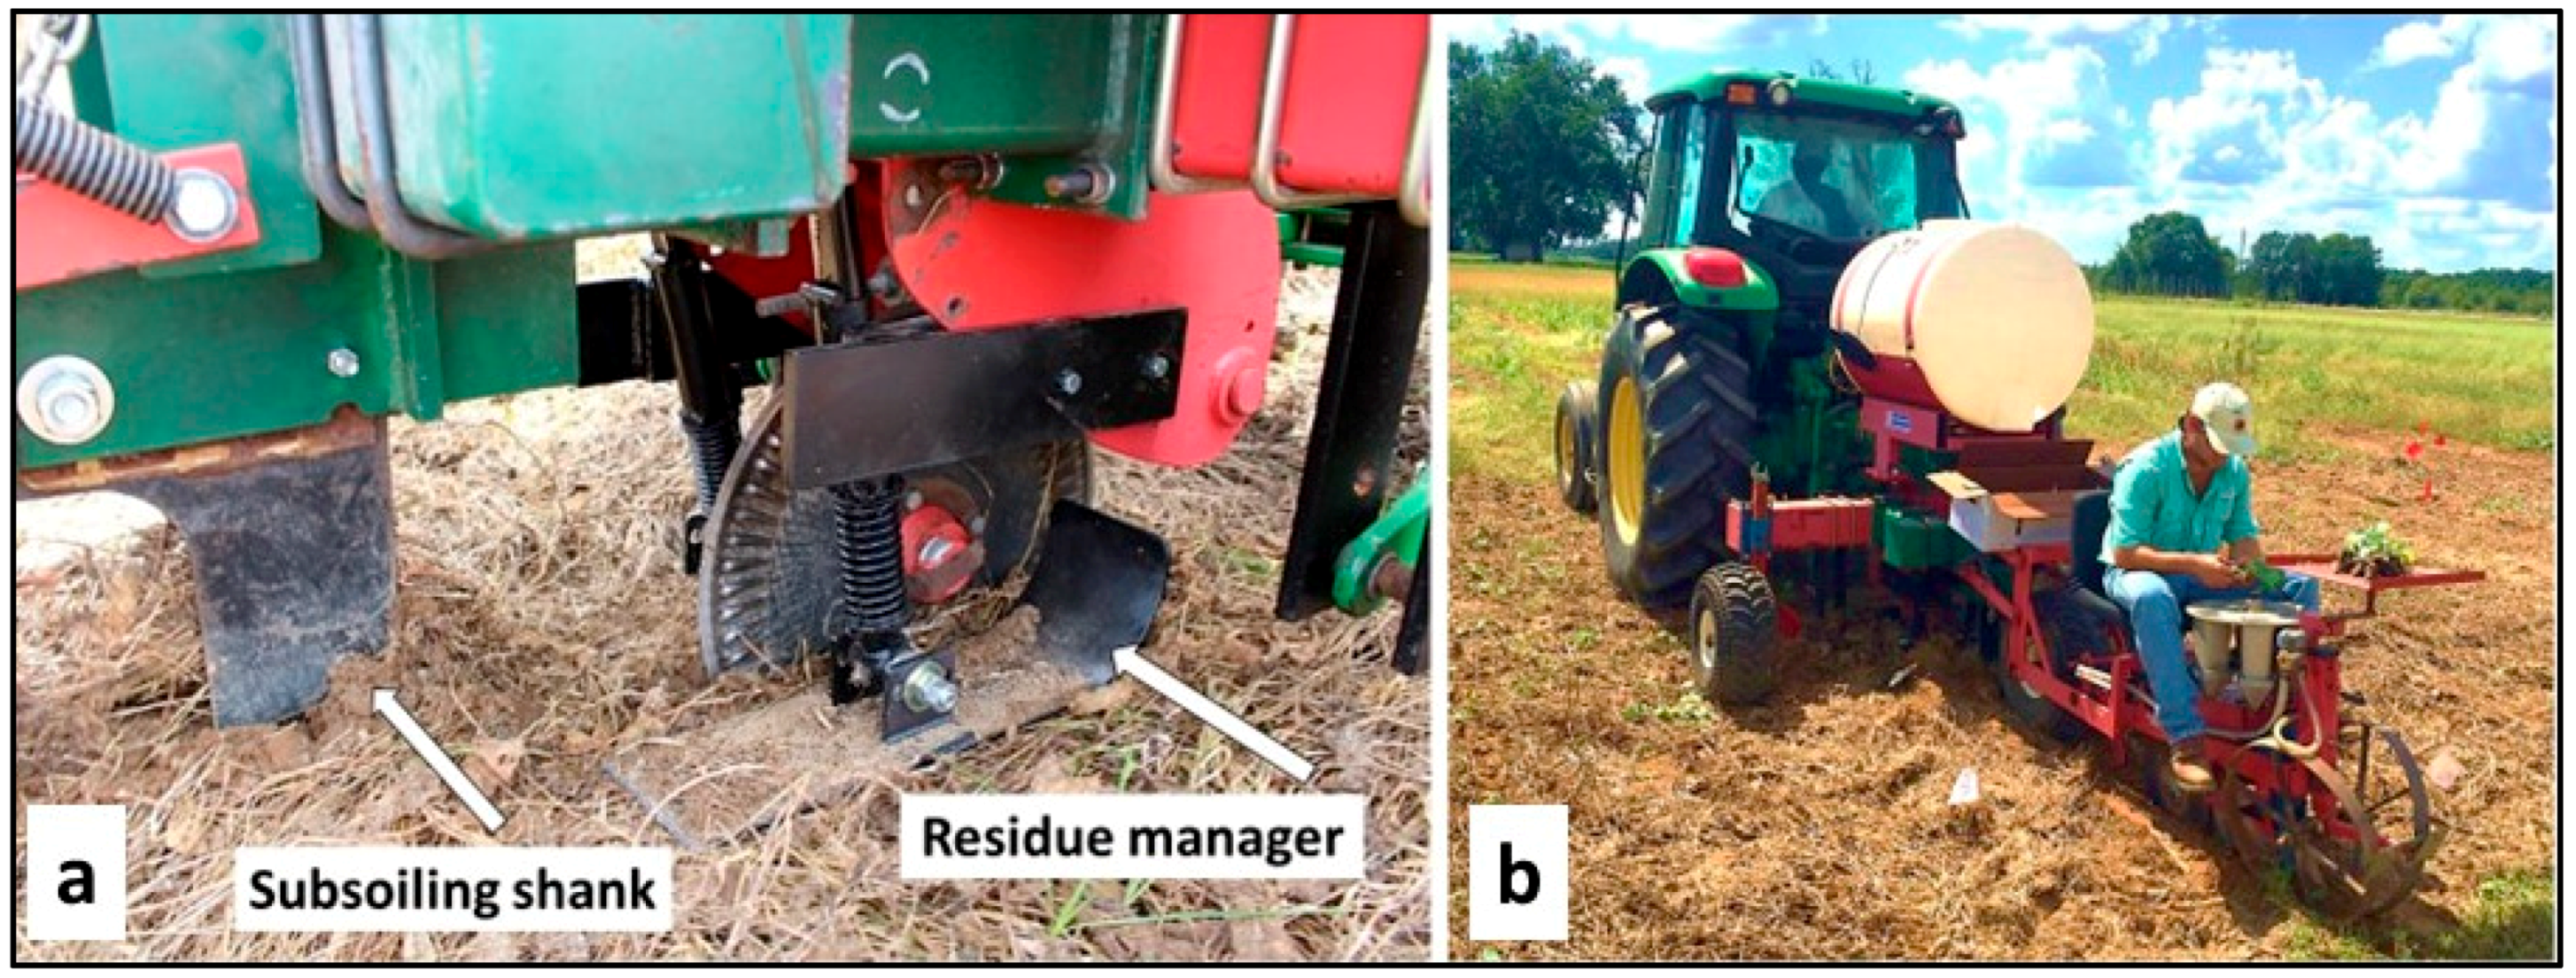
2.3. Agronomic Management and Treatment Application

Prior to establishing this experiment, the test area was an established fescue (Festuca arundinacea L.) hayfield. The area was tilled and planted to cereal rye (Secale cereale L.) at a rate of 100.9 kg ha−1 in the fall prior to establishing the summer cover crop treatments for this study. In the fall prior to each growing season, cereal rye was planted and grown through winter until it reached the early milk stage, so that biomass could be maximized [3]. Samples from each replicated block area were collected prior to applying chemical burndown. In the spring of each year, the rye was flail mowed using a BCS 853 (BCS S.p.A, Abbiategrasso, MI, Italy) with Berta flail mower (Berta s.r.l., Calamandrana, Italy) and disked to incorporate the residue, creating a green manure effect. Lime, phosphorous, and potassium were applied in the spring according to the Alabama Agricultural Experimentation recommendations for soil test results [21]. In 2015, 2241.7 kg ha−1 of dolomitic limestone and 44.8 kg ha−1 of P2O5 using triple super phosphate was applied to the entire test area. For 2016 and 2017, 44.8 kg ha−1 of P2O5 and/or K2O (using potash) were applied to specific replications as indicated by the soil test report. Nitrogen was applied in split applications (33.6 kg N ha−1 pre-plant and at elongation) to the pearl millet only. No fertilizer was applied to the iron clay peas due to it being a legume. A KMC field cultivator (Kelley Manufacturing Co., Tifton, GA, USA) was used to level and prepare the soil for planting. The summer cover crops were planted May or early June of each year at 33.6 kg ha−1 for pearl millet (Var: Tifleaf 3) and 56 kg ha−1 (approx. 185,250 seeds ha−1) of iron clay peas (variety not stated) using a John Deere 450 grain drill (John Deere, Moline, IL, USA) and were grown through the summer. Iron clay peas were inoculated using the sprinkle method with Bradyrhizobium sp. (Vigna) 2 × 10⁸ CFU g−1 at a rate of 241 g for 22.7 kg of seed.
Termination occurred after sampling using the 3 different termination methods (Figure 1). Rolling/crimping was performed as a single pass using a patented four-stage roller crimper [22] (Figure 2a), which has a smooth roller in the front followed by 3 consecutive straight bar crimping rollers. Mowing was performed with a single pass using a 2.1 m wide Rhino rotary mower (Figure 2b, RhinoAg, Gibson City, IL, USA). The mowing and discing (MowIncorp) treatment was performed in two separate operations with the rotary mower and then with a 1.5 m wide Bush Hog disc (Figure 2c, Bush Hog, Selma, AL, USA). Disking was performed 4–6 times per plot depending on the conditions to properly incorporate cover crop residues.
Once cover crops were terminated and soil samples were collected, RoundupTM (Bayer AG, Leverkusen, Germany) was applied at a rate of 2.24 kg ha−1 to the entire test area. A modified RJ Manufacturing (RJ Equipment, Blenheim, ON, Canada) single row no-till plug transplanter was used to plant the collard transplants every year (Figure 3b). The transplanter used included a patented custom attachment that was designed and installed on the transplanter called the residue manager (RM) [14]. The residue manager consists of a 3.8 cm diameter steel spring-loaded rod bolted to a 15.2 cm wide steel sled that was allowed to pivot to maintain contact with the ground surface at all angles (Figure 3a). The front curve has a 10.2 cm radius, and the total length of the sled is 53.3 cm and was designed to have one unit on both sides of the spring-loaded cutting coulter. The main idea regarding this residue manager is to assist in pushing down heavy cover crop residue to improve the cutting effectiveness of the spring-loaded fluted coulter. The collard plants (Brassica oleracea) (Var: Top Bunch (2015) and Bulldog (2016–2017)) were planted at a spacing of approximately 40.6 cm between plants and irrigated and fertilized through drip tape at a rate of 5.6 kg N ha−1 per week. Drip irrigation was applied three times daily at equal intervals at a rate of approximately 0.01 hectare-meter of water per week. Field operation dates are provided in Table 3.

2.4. Sample Collection and Analyses

Once the cover crops reached anthesis, they were sampled prior to termination by collecting plant heights from the soil surface to the highest growing point. A 0.25 m2 custom stainless steel wire frame was randomly placed (once per plot) and all plants within the area of the frame was cut with clippers and placed into cloth bags and tagged to quantify biomass production. The samples were then oven-dried at 55 °C until constant mass and then weighed and ground using a Wiley Mill (Thomas Scientific, Swedesboro, NJ, USA) to pass through a 2 mm screen and then further ground with a Cyclone mill (UDY Corp, Fort Collins, CO, USA) to pass through a 1 mm screen. Samples were processed for total carbon and nitrogen using dry combustion on a Leco TruSpec-CN analyzer (Leco Corp., St. Joseph, MI, USA).
Soil samples were collected three times throughout the growing season to help understand the effects of two different summer grown cover crops (legume and non-legume) on collard production. The first soil sampling event took place immediately prior to prepping and planting the summer cover crops. The second soil samples were collected when the cover crops were terminated. The third and final soil samples were collected approximately 1 month after the collards were planted. Samples were collected using a Giddings hydraulic soil sampling and coring machine (Giddings Machine Company, Windsor, CO, USA) mounted on a John Deere Gator (John Deere, Moline, IL, USA). Three 4.6 cm diameter cores were collected randomly per plot for a total number of 144 samples for each timing interval and split according to soil depths of 0–15 cm and 15–30 cm and mixed into a composite sample. The samples were oven-dried at 55 °C and then ground with a hammermill (DC-5 Dynacrush Soil Crusher; Custom laboratory Equipment, Inc., Orange City, FL, USA) to pass through a 2 mm screen and then further ground with a coffee grinder to a fine texture. The soil was then analyzed for total carbon and total nitrogen. Total soil carbon and nitrogen was analyzed using dry combustion on a Leco TruSpec-CN analyzer.
Volumetric moisture content (VMC) was determined weekly from collard planting until 3 weeks after planting to quantify soil moisture difference between the cover crops and termination methods. These VMC readings were collected at three random locations within each plot for each week with a FieldScout TDR 300 soil moisture meter (Spectrum Technologies, Inc., Aurora, IL, USA) and then averaged per plot for analysis.
Collards were harvested by cutting at the soil surface and were weighed and counted (per plant) from each plot for yield. The total plot weight harvested, the number of collard plants, and then the average weight per plant for each plot was calculated to quantify the success of each cover crop termination method, residue manager effects, and how the collards responded to each different growing system.

2.5. Statistical Description

JMP 16.2.0 statistical software was used for data analysis [23]. Data were analyzed using analysis of variance (ANOVA) for testing the model using the fit model feature in JMP at alpha level = 0.10 determined a priori. ANOVA assumptions of both normal distribution and homoscedasticity were inspected with graphs created in JMP of data distribution (compared to normal fit) and residuals, respectively, where no significant deviations were observed. Mean separation was performed using the fit Y by X feature with REP set to block in JMP using Tukey’s HSD with alpha level = 0.10 significance level.

3. Results and Discussion

3.1. Cover Crop Biomass

Biomass production for the rye winter cover crop varied by year with significant differences noticed between all three seasons (Table 4). The 2015 season measured the lowest biomass production of all three seasons with 1284 kg ha−1 and 41.9 cm for biomass and average height, respectively. The 2016 season experienced the highest biomass production for rye by a significant amount at 5197.5 kg ha−1 (159.4 cm height). Rye produced in 2017 measured in between the values for the 2015 and 2016 seasons, with biomass production of 3384 kg ha−1 and average height of 127.1 cm that produced 1576.8 kg carbon ha−1 and 42.1 kg nitrogen ha−1. Carbon and nitrogen added by the rye cover crop was the highest in the 2016 season with 2515.7 kg carbon ha−1 and 68.6 kg nitrogen ha−1 and the lowest in the 2015 season with 570.1 kg carbon ha−1 and 26.1 kg nitrogen ha−1. Results from [24] reported similar findings for biomass and total carbon contributed by a rye cover crop over six growing seasons, ranging from 801–5296 kg ha−1 and 353–2531 kg C ha−1, respectively. Rye is a well-known winter cover crop in the southeastern United States due to its ability to produced large amounts of biomass during the mild winters [25].
The two-way ANOVA results for iron clay pea and pearl millet indicated significant differences were observed for all production characteristics including plant length, biomass production, total carbon, total nitrogen, and C:N ratio for YEAR, CROP, and YEAR × CROP, so data were analyzed separately. Average length and biomass across all years was 150.7 cm and 8461 kg/ha for pearl millet and 49.8 cm and 6465 kg/ha for iron clay peas (Table 5). For iron clay peas, biomass production was significantly lower for 2015 with 4422 kg ha−1 compared to 2016 (7119 kg ha−1) and 2017 (7854 kg ha−1). Plant heights for iron clay peas were significantly higher for 2017 compared to the two other seasons. Pearl millet biomass and plant heights were significantly higher in 2017 compared to 2016 but biomass amounts were not different than 2015. Carbon-to-nitrogen ratios were significantly lower for iron clay peas compared to pearl millet with an 18.0 average ratio across years for iron clay peas and a 48.9 average yearly ratio for pearl millet. The lower C:N ratios of the ICP increase the rate of mineralization. Previous research by [26] observed that ICP had an N accumulation on average of 113 kg ha−1 and that 65–70% of carbon added by both sunn hemp and cowpeas mineralized within the first 60 days. These results are also consistent with findings of [27], who reported cowpea (iron clay pea) biomass and a C:N ratio of 3966 kg ha−1 and 21:1, respectively, and pearl millet biomass and C:N ratio of 6670 kg ha−1 and 50:1, respectively, over two growing seasons. The increased C:N ratio found in pearl millet may have led to the immobilization of nitrogen in the cover crop, making it unavailable for the collard crop [28]. Crops with higher C:N ratios, such as grasses, do not decompose as fast as legumes and are less beneficial for providing nutrients to the subsequent cash crop [25]. However, these longer lasting residues do provide erosion and soil moisture retention benefits for extended periods compared to faster decomposing crops [5].

3.2. Volumetric Soil Moisture Content

The mixed analysis of variance (Table 6) was evaluated for season (YEAR), cover crop type (CROP), weekly interval (WEEK), termination method (TERM), and with/without residue manager attachment (ATTACH) and volumetric soil moisture (VMC). Every term showed significant differences except the residue manager (ATTACH). Data indicated significances using ANOVA for YEAR, CROP, WEEK, and TERM; therefore, data were analyzed separately.
VMC for 1, 2, and 3 weeks after planting (WAP) are presented separately (Table 7) because these weeks are the most critical for transplant establishment. Precipitation data from previous reading are also included in the table. Data from 2015 indicate that for ICP at 1 WAP, the Roll termination method is greater compared to that of the mowed treatment but similar to MowIncorp. This is due to the lowest biomass production for ICP in 2015 coupled with the mower not distributing the residue evenly over the soil surface, thus allowing moisture to evaporate. A similar trend was found for ICP at 3 WAP in 2015 with MowIncorp showing the largest value of 19%, which was similar to the rolled treatment at 18.5% but different from Mow, which had the lowest at 16.6%, again due to having a lower biomass and an uneven distribution of residue over the soil surface. No significant differences were observed at 2 WAP (2015) for ICP due to there having only been 0.94 cm of precipitation since the previous measurement. For pearl millet in 2015 at 1 WAP, similar to the ICP, the Roll treatments experienced the highest moisture level at 10.5%, followed by Mow (9.3%) and MowIncorp (8.8%), which is due to the high biomass accumulation of this crop providing more soil coverage to lessen soil evaporation compared to the other methods. At 2 WAP for pearl millet in 2015, results indicated that the mowed (13.8%) treatment had a higher VMC compared to the incorporation (12.5%) treatment but similar values to the Roll treatment (13.7%) due to the soil surface being covered compared to uncovered, along with the greater biomass production of the pearl millet compared to the iron clay peas for 2015. At 3 WAP (pearl millet, 2015), no differences were noticed between treatments due to only 2.16 cm of rainfall occurring since the previous readings.
VMC for 2016 showed no differences between the termination methods for ICP at any of the intervals after collard planting as no rainfall occurred at 1 WAP and 2 WAP, and a slight 0.23 cm precipitation event occurred between the 2 WAP and 3 WAP readings. For 2016, the pearl millet cover crop showed a significant response to termination method in contrast to the ICP, which did not show any differences. The pearl millet data for 2016 showed that the rolled method had significantly higher soil moisture, at both 1 WAP (12.8%) and 2 WAP (12%), compared to the lower MowIncorp treatment, but does not differ significantly to the Mow treatment. This shows that in periods of low rainfall during plant establishment, keeping the soil surface covered with rolled residue can help retain moisture compared to a conventional tillage-based management.
VMC for 2017 ICP showed no differences for 1 WAP between termination methods due to a large rainfall event (9.53 cm) that occurred prior to collecting the reading. For ICP 2 WAP, the soil VMC was dryer for the MowIncorp treatments compared to Roll treatment but was no different to the Mow treatment. With a 2.74 cm rainfall occurring between 2 WAP and 3 WAP, differences in VMC occurred during this interval with MowIncorp showing the lowest VMC for 3 WAP, illustrating faster soil drying compared to the significantly higher Mow and Roll methods. For 2017 pearl millet, subjected to the same 9.53 cm rainfall event, the MowIncorp treatment had significantly higher VMC at 15.6% compared to the Mow (13.2%) and Roll (13.7%). Higher moisture for MowIncorp could be due to soil structure and lower infiltration of the tilled soil compared to non-tilled soil after being wet [24,28]. The 1 WAP and 2 WAP intervals had 6.4% lower VMC for pearl millet MowIncorp compared to a difference of only 3.4% and 2.6% for the Mow and Roll, respectively. This shows that tilled soil tends to dry at an accelerated rate compared to non-tilled, which could lead to inadequate soil moisture for the cash crop transplants during critical establishment periods. Overall, covering the soil surface, especially with rolling, retained soil moisture, which is consistent with [4], who noticed increased soil moisture retention with a rolled rye, clover, and rye/clover cover crop when compared to a conventionally tilled system. Cover crops that are terminated and flattened to the ground can keep soil cooler and reduce soil water evaporation, which is important during plant establishment [13].

3.3. Soil Properties

According to the mixed ANOVA results (Table 8) for total soil carbon, differences existed for YEAR, DEPTH, TIMING, DEPTH × YEAR, DEPTH × TIMING, YEAR × TIMING, YEAR × CROP, TIMING × CROP, DEPTH × TIMING × CROP, and YEAR × TIMING × CROP at alpha = 0.1. For total soil nitrogen, significant differences existed for YEAR, CROP, DEPTH, TIMING, DEPTH × YEAR, DEPTH × TIMING, YEAR × TIMING, and YEAR × CROP. According to these significant interactions, data were separated by YEAR, CROP, DEPTH, and TIMING and post hoc analysis was performed using Tukey’s HSD at alpha = 0.1.

3.3.1. Total Soil Carbon

Based on the mixed ANOVA results (Table 8), the results for total soil carbon are presented in Table 9 below according to cover crop, depth, and timing interval for each growing season. The ICP in both the 2015 and 2016 growing seasons showed significant differences in soil carbon between the timing events. Levels observed for the 0–15 cm depth at the MONTH AFTER sampling interval in 2015 showed a 7.1% increase and 2016 showed a 9.4% increase in total soil carbon compared to PRE sampling interval levels. No significant differences were noticed for the top level for ICP in 2017 among the sampling intervals. In ICP for the BOTTOM depth in 2015, lower levels of soil carbon were noticed at both the AT TERM and MONTH AFTER intervals compared to the PRE level. This was due to levels that were in place prior to initiating the experiment. An inverse trend, similar to that of the top for 2015 and 2016, was noticed in the bottom depth for the 2016 season shown with the increased total soil carbon concentration of 3.14 g C ha−1 (MONTH AFTER) compared to 2.79 kg ha−1 for the PRE interval but was not significantly different from the AT TERM interval (3.07 g C kg−1). These results are consistent with those from [29] that showed increases in total soil carbon with sunn hemp grown prior to sweet corn growing system alone ranged from 1.7–3.7 g kg−1 for a loamy sand soil. The results of [30] indicated that soil organic carbon in the 0–15 cm soil depth was greater by a range of 0.2–0.9 mg kg−1, although this was not significant, for mono and mixtures of buckwheat, barley, and chickling pea compared to no cover crops over just two lettuce growing seasons.
Pearl millet showed no significant differences for total carbon in the TOP depth for 2015. However, in the bottom depth for 2015, a significant 9.2% decrease in total soil carbon concentration occurred between the PRE and AT TERM interval due to initial levels prior to initiating the experiment. For 2016, increases in total soil carbon was measured for the AT TERM and MONTH AFTER interval compared to the PRE interval in the TOP portion of the soil. This is due to the addition of residues and roots in the soil provided by the high biomass of the pearl millet and a similar trend was noticed in the same year and soil portion for the ICP as the two crops had similar biomass production quantities. No significant differences were noticed between the sampling intervals in 2016 for pearl millet for the bottom portion of soil; however, numerical increases were noticed sequentially from PRE to AT TERM to MONTH AFTER. For the 2017 season, significant differences were observed for both DEPTHs in between the TIMING intervals. For both DEPTHs, the AT TERM interval showed the highest level of total soil carbon with a 6.03 g kg−1 amount compared to 5.57 g kg−1 for the MONTH AFTER and 5.26 g kg−1 for the PRE level. For the BOTTOM depth, AT TERM showed an 18.6% increase in the PRE interval and the MONTH AFTER interval decreased by a slight 8% compared to the AT TERM level. The growth of the cover crop created increases in soil carbon from the PRE to the AT TERM intervals, and then when the cover crop was terminated, carbon decreased during the next month due to the oxidation of the residue and the digestion of soil microbes over time [25,31].
Overall, both cover crops showed increases in soil carbon levels in the top layer between the PRE timing of 2015 to the MONTHAFTER of 2017 of 0.41 g C kg−1 (8.1%) for ICP and 0.53 g C kg−1 (10.5%) for pearl millet. These results show similar trends to [24], who showed increases in soil carbon in the top 0–15 cm of soil for a cover cropped corn system. Results from [32] show that 15% and 11% more total soil carbon was noticed when cover crops were used compared to no cover crops at the 0–5 cm and 15–30 cm depths, respectively. Findings from [29], who conducted research in Tifton loamy sand soil, suggest that the decomposition of residues are expedited in sandier soils, even with higher C:N ratio residues, which lead to increased soil carbon levels. Increases in soil carbon of 8% were noticed for a fallow cover crop followed by a sweet corn main crop over from years 2003–2005.

3.3.2. Total Soil Nitrogen

For ICP in the top layer, total soil nitrogen showed increasing trends from year to year (Table 10). In the 2015 season (TOP), total soil nitrogen for iron clay peas showed a sequentially significant increase in the timing intervals with a 12.8% increase from PRE to AT TERM and a 21.3% increase from PRE to MONTH AFTER. A significant decrease of 7.0% occurred in total soil nitrogen for ICP between the AT TERM and MONTH AFTER interval in the 2016 season that was possibly due to the lack of precipitation during that interval. In 2017, a similar trend to 2016 occurred, but the difference between AT TERM and MONTH AFTER was not significantly different. Overall, 2017 levels were higher than each previous season level for total soil nitrogen when compared to the same interval, except for 2015 MONTH AFTER. The increase in 2016 and 2017 compared to 2015 show that total soil nitrogen is increasing due to the cover crop residue input from year to year. No significant difference existed between intervals for the bottom depths for ICP. Results for a sandy soil [29] show increases in total soil nitrogen from the addition of sunn hemp followed by winter fallow of 0.3–0.5 g ka−1 and soil planted with a sweet corn crop with amended fertilizer additions ranging from 0–133 kg N ha−1. Results from [33] shows that soil organic matter and total mineral nitrogen was increased in some seasons when Trifolium subterranean clover was used compared to conventional management system. Results from [34] also showed that legume cover crops were able to increase the supply of soil nitrogen more effectively than non-legume cover crops; however, soil carbon is more effectively increased by non-legume cover crop due to the lower concentration of nitrogen that increases the carbon to nitrogen ratio that can lead to slower residue breakdown.
Pearl millet trends showed that total soil nitrogen generally increased year to year along the same intervals in the TOP depth. For both 2015 and 2017, significant differences were observed between the PRE interval and both the AT TERM and MONTH AFTER intervals in the upper depth. For 2015, the bottom depth showed no significant differences between the intervals. The 2016 season showed no significant differences between intervals for the pearl millet for both upper and lower soil depths. Overall trends for the bottom depth show that total soil nitrogen increased from year to year when compared to the interval in the previous year. Total nitrogen levels for 2017 were the same or slightly higher for each interval compared to the previous two seasons of the same interval for both depths. A 11.1% and 7.4% increase in total soil nitrogen in the TOP depth was observed in the AT TERM and MONTH AFTER intervals, respectively, for the 2017 season compared to the PRE level. This shows that the increased levels of biomass produced by pearl millet residue is quickly mineralized by this sandy loam soil. These results are consistent with [29], who found that soil nitrogen levels increased by 0.2 g kg−1 for a fallow cover crop followed by a non-fertilized sweet crop from 2003–2005.

3.4. Collard Population, Height, Weight per Plant, and Yield

The mixed ANOVA for collard population, collard height, weight per plant, and yield are presented in Table 11 below. YEAR was highly significant for all collard properties. CROP was significant for collard height, weight per plant, and yield. TRT, which is the randomized treatment assignments, including termination method and with/without residue manager (Table 2), was not significant by itself but showed a significant interaction as TRT × CROP for collard population and yield along with a significant interaction with TRT × CROP × YEAR for collard population. According to these ANOVA results, collard height and weight per plant are shown by CROP and YEAR and collard population and yield are displayed by cover crop, termination method, and residue manager configuration.
Collard yield (Table 12) was significantly different between growing seasons and cover crops (CROP AND YEAR p < 0.0001). Average yield for the 2015 growing season was the largest for both cover crops as seen with 12,073.6 kg ha−1 and 7813.1 kg ha−1 or ICP and PM, respectively. The 2015 season also experienced the largest weight of collard plant per cover crop at 1.28 kg plt−1 for ICP and 0.8 kg plt−1 for pearl millet. Other research by [35] shows a collard yield of 14,005–23,109 kg ha−1 under different cover crop types and mulch applications. More specifically, results from [36] report yields over three growing seasons in the range of 7720–16,330 kg ha−1 for ICP and 5514–15,423 kg ha−1 for pearl millet cover crops terminated with roller/crimper or flail mower. The year 2016 experienced the lowest numerical yield for ICP with 4548.4 kg ha−1 and the lowest significant yield for PM with 1914.2 kg ha−1. The lowest yield for 2016 was due to weather as dry conditions were prevalent in October of 2016 (0.2 cm precipitation for OCT, Table 3) during plant establishment where rainwater is critical for successful growth even where drip irrigation is applied. However, in terms of average yields for 2016, the ICP collards outperformed the PMILL collards by 138%. The ICP yield for 2017 only showed a 13.9% increase in yield compared to the 2016 season while the PMILL collards reported a 132% yield increase from 2016 to 2017. Significantly lower yield was noticed in 2017 for ICP for the MowIncorp termination method both with and without RM compared to the Roll and Mow methods with and without RM due to increased weed pressure in these plots. Overall, results illustrate that collards grown in an ICP cover crop were more resilient to drier seasons compared to PMILL cover crop production systems, as seen by the 2017 recovery.
Lower yields for the pearl millet cover crop plots were probably due to the increased carbon-to-nitrogen ratio, which is able to immobilize nitrogen compared to the iron clay pea. In fact, results from a field experiment conducted in [27] revealed that a C:N ratio for pearl millet was 50:1 and cowpea had a C:N ratio of 21:1. In addition, another study [32] reported that the increased biomass of the pearl millet cover crop can impede collard growth by increasing transplant shock during establishment. Research conducted in [10] also demonstrated small broccoli head biomass and lower yields for foxtail millet compared to a forage soybean cover crop in broccoli production.
Collard population (Table 13) showed significant difference for ICP in the 2016 season for TRT. The highest population was observed for Roll with RM but was not different from any of the other treatments except for MowIncorp without RM. This shows that using the roller/crimper along with the residue manager may have a slight advantage over MowIncorp without the RM installed due to the vining nature of the ICP that may have created non-optimal conditions for the transplanter compared to the no-till roll treatment. The year 2016 also had lower precipitation levels in the month of September, when these plants were planted and could have influenced overall plant survival. For ICP, no other significant differences existed for 2015 or 2017 seasons for collard population. Both 2015 and 2017 seasons showed significant differences in collard populations for the pearl millet (PM). The Mow treatment with RM showed the significantly lowest population across all treatments for 2015 in pearl millet. This was due to the residue managers potentially interfering with the loose mowed residue along with the coulter not being able to properly cut through the fluffy residue, hindering the transplants from having optimum soil contact. The 2016 collard population for PM did not have any significant differences between treatments, but on average had the lowest population out of all crops and years due to drought conditions and ant infestations in the PM plots. In 2017, significantly lower plants ha−1 were noticed for the MowIncorp with RM but were not significantly different than any other treatment except for Mow with RM. This slightly significant lower population of the MowIncorp with RM could be contributed to the high amount of biomass production along with the tallest plant heights for pearl millet in this season. High amounts of residue could have resulted in an un-uniform surface for the planter to operate in as well as being difficult for the residue managers to properly slide across the bare soil surface and thus may have resulted in poor soil contact [15].
Collard weight per plant and height are presented in Table 14. A significant difference in weight per plant between years and cover crops was also observed with the pearl millet exhibiting the lowest weight for each year compared to the ICP. The values for the 2016 and 2017 season showed weight per plant of 0.46 and 0.50 for ICP, respectively, and 0.28 and 0.45 for pearl millet. Collard heights for the ICP were highest in both the 2015 and 2017 seasons with significantly different values of 43.1 cm for 2016, which was also the year with drought conditions. The 2016 season also had the shortest height of 33.93 cm for the pearl millet. Overall, collards grown in ICP cover crop show increased weight per plant and height over three growing seasons compared to those grown in a pearl millet cover crop.

4. Conclusions

Cover crop termination methods, including rolled and mowed, show soil moisture retention benefits for both cover crops during this experiment. Having the soil surface covered can decrease water evaporation and extend soil moisture availability compared to conventional tillage methods. The pearl millet produced larger amounts of biomass compared to the iron clay peas, but that could have had a negative effect on nitrogen availability due to the crop’s high carbon-to-nitrogen ratio. Both cover cropping systems show trends of increasing total soil carbon and nitrogen from year to year, illustrating that cover cropping can improve soil over time. Overall, both cover crops showed total soil carbon increases in the top layer between the PRE timing of 2015 to the MONTHAFTER of 2017 8.1% for ICP and 0.53 g C kg−1 10.5% for pearl millet. Iron clay peas produced a 54% higher overall average yield when compared to the pearl millet for collards with an overall average yield for ICP of 7268 kg ha−1 and 4724 kg ha−1 for pearl millet. The collards produced in the ICP cover crop during a season with low precipitation did not suffer as much yield loss as the collards produced in pearl millet when compared to two other seasons with greater precipitation. This illustrates more resilience to adverse conditions for the ICP cover crop compared to raising collards under a pearl millet cover crop. The cover crop termination method only made a significant difference in the 2017 season in ICP for collard yield with the MowIncorp plot resulting in significantly lower yields compared to the Roll and Mow treatments due to increased weed pressure. Collard populations may have been affected by the biomass amount produced by the pearl millet, which made it difficult to plant into, even with the addition of the custom residue manager attachment. According to these results, pearl millet is not the best choice for growing collards but demonstrated that both soil carbon and nitrogen can be improved over time using the pearl millet.

Author Contributions

Conceptualization, C.M.K. and T.S.K.; methodology, C.M.K. and T.S.K.; formal analysis, C.M.K.; investigation, C.M.K.; data curation, C.M.K.; writing—original draft preparation, C.M.K.; writing—review and editing, C.M.K., T.S.K., H.A.T., D.B.W. and R.P.; supervision, T.S.K. and H.A.T.; project administration, T.S.K. and H.A.T.; funding acquisition, H.A.T. All authors have read and agreed to the published version of the manuscript.

Funding

This research was funded through USDA Agriculture Research Service (ARS) appropriated funds.

Data Availability Statement

Data available upon request.

Acknowledgments

The authors would like to acknowledge Jeffrey Walker for his technical assistance in collecting field samples.

Conflicts of Interest

The authors declare no conflict of interest.

References

  1. Delaney, D.; Iversen, K.; Balkcom, K.; Caylor, A. Cover Crops for Alabama; Alabama Cooperative Extension System: Auburn, AL, USA, 2018. [Google Scholar]
  2. Sustainable Agriculture Network (SAN). Managing Cover Crops Profitably, 3rd ed.; Sustainable Agriculture Network: College Park, MD, USA, 2007. [Google Scholar]
  3. Ashford, D.L.; Reeves, D.W. Use of a mechanical roller-crimper as an alternative kill method for cover crops. Am. J. Altern. Agric. 2003, 18, 37–45. [Google Scholar] [CrossRef]
  4. Kornecki, T.S.; Price, A.J. Management of High-Residue Cover Crops in a Conservation Tillage Organic Vegetable On-Farm Setting. Agronomy 2019, 9, 640. [Google Scholar] [CrossRef]
  5. Scavo, A.; Fontanazza, S.; Restuccia, A.; Pesce, G.R.; Abbate, C.; Mauromicale, G. The role of cover crops in improving soil fertility and plant nutritional status in temperate climates. A review. Agron. Sustain. Dev. 2022, 42, 93. [Google Scholar] [CrossRef]
  6. Bloszies, S.A.; Reberg-Horton, S.C.; Heitman, J.L.; Woodley, A.L.; Grossman, J.M.; Hu, S. Legume cover crop type and termination method effects on labile soil carbon and nitrogen and aggregation. Agron. J. 2022, 114, 1817–1832. [Google Scholar] [CrossRef]
  7. Wortman, S.E.; Francis, C.A.; Bernards, M.L.; Drijber, R.A.; Lindquist, J.L. Optimizing Cover Crop Benefits with Diverse Mixtures and an Alternative Termination Method. Agron. J. 2012, 104, 1425–1435. [Google Scholar] [CrossRef]
  8. Price, A.J.; Balkcom, K.S.; Monks, C.D.; Barentine, R.M.; Iversen, K.V.; Patterson, M.G. Controlling Glyphosate-Resistant Pigweed in Conservation Tillage cotton Systems (09). USDA ARS NSDL, 2008. Available online: https://www.ars.usda.gov/ARSUserFiles/60100500/SpecialPubs/SP09.pdf (accessed on 22 March 2023).
  9. Kebede, E. Contribution, utilization, and improvement of legumes-driven biological nitrogen fixation in agricultural systems. Front. Sustain. Food Syst. 2021, 5, 767998. [Google Scholar] [CrossRef]
  10. Abdul-Baki, A.A.; Morse, R.D.; Devine, T.E.; Teasdale, J.R. Broccoli production in forage soybean and foxtail millet cover crop mulches. Hortscience 1997, 32, 836–839. [Google Scholar] [CrossRef]
  11. USDA ARS. FoodData Central. 2019. Available online: https://fdc.nal.usda.gov/fdc-app.html#/food-details/170406/nutrients (accessed on 23 March 2023).
  12. Morse, R.D. No-till vegetable production—Its time is now. HortTechnology 1999, 9, 373–379. [Google Scholar] [CrossRef]
  13. Balkcom, K.S.; Duzy, L.M.; Kornecki, T.S.; Price, A.J. Timing of cover crop termination: Management considerations for the Southeast. Crop Forage Turfgrass Manag. 2015, 1, 1–7. [Google Scholar] [CrossRef]
  14. Kornecki, T.S.; Torbert, H.A.; Prior, S.A. Cover Crop Residue Manager. U.S. Patent 8,770,119 B1, 8 July 2014. [Google Scholar]
  15. Kornecki, T.S.; Prior, S.A.; Torbert, H.A. Effects of a Custom Cover Crop Residue Manager in a No-Till Cotton System. Appl. Eng. Agric. 2016, 32, 333–340. [Google Scholar]
  16. Official Soil Series Descriptions and Series Classification. USDA Natural Resource Conservation Service. Available online: https://soilseries.sc.egov.usda.gov/# (accessed on 14 September 2023).
  17. Web Soil Survey. USDA Natural Resource Conservation Service. Available online: https://websoilsurvey.nrcs.usda.gov/app/ (accessed on 15 May 2023).
  18. Current Results Weather and Science Facts. Available online: https://www.currentresults.com/Weather/Alabama/average-alabama-weather.php (accessed on 14 September 2023).
  19. Medius—Auburn University. Available online: https://medius.re/tag/auburn-university (accessed on 15 January 2023).
  20. SAS. Proprietary Software Release 9.4; SAS Institute: Cary, NC, USA, 2013. [Google Scholar]
  21. Mitchell, C.C.; Huluka, G. Nutrient Recommendation Tables for Alabama Crops; Auburn University: Auburn, AB, USA, 2012. [Google Scholar]
  22. Kornecki, T.S. Multistage Crop Roller. U.S. Patent 7,987,917 B1, 2 August 2011. [Google Scholar]
  23. SAS. Proprietary Software Release JMP 16.2.0; SAS Institute: Cary, NC, USA, 2022. [Google Scholar]
  24. Balkcom, K.S.; Arriaga, F.J.; Van Santen, E. Conservation systems to enhance soil carbon sequestration in the Southeast US Coastal Plain. Soil Sci. Soc. Am. J. 2013, 77, 1774–1783. [Google Scholar] [CrossRef]
  25. Lu, Y.-C.; Watkins, K.B.; Teasdale, J.R.; Abdul-Baki, A.A. Cover crops in sustainable food production. Food Rev. Int. 2000, 16, 121–157. [Google Scholar] [CrossRef]
  26. Beri, V.; Meelu, O.; Khind, C. Biomass production, N accumulation, symbiotic effectiveness and mineralization of green manures in relation to yield of wetland rice. Trop. Agric. 1989, 66, 11–16. [Google Scholar]
  27. Creamer, N.G.; Baldwin, K.R. An evaluation of summer cover crops for use in vegetable production systems in North Carolina. Hortscience 2000, 35, 600–603. [Google Scholar] [CrossRef]
  28. Brady, N.C.; Weil, R.R. The Nature and Properties of Soils; Prentice Hall: Upper Saddle River, NJ, USA, 2008. [Google Scholar]
  29. Hubbard, R.K.; Strickland, T.C.; Phatak, S. Effects of cover crop systems on soil physical properties and carbon/nitrogen relationships in the coastal plain of southeastern USA. Soil Tillage Res. 2013, 126, 276–283. [Google Scholar] [CrossRef]
  30. Ghahremani, S.; Ebadi, A.; Tobeh, A.; Hashemi, M.; Sedghi, M.; Gholipoouri, A.; Barker, A.V. Short-term impact of monocultured and mixed cover crops on soil properties, weed suppression, and lettuce yield. Commun. Soil Sci. Plant Anal. 2021, 52, 406–415. [Google Scholar] [CrossRef]
  31. Havlin, J.L.; Tisdale, S.L.; Nelson, W.L.; Beaton, J.D. Soil Fertility and Fertilizers; Pearson Education India: Noida, India, 2016. [Google Scholar]
  32. Adeli, A.; Brooks, J.P.; Read, J.J.; Feng, G.; Miles, D.; Shankle, M.W.; Barksdale, N.; Jenkins, J.N. Management strategies on an upland soil for improving soil properties. Commun. Soil Sci. Plant Anal. 2020, 51, 413–429. [Google Scholar] [CrossRef]
  33. Scavo, A.; Restuccia, A.; Abbate, C.; Lombardo, S.; Fontanazza, S.; Pandino, G.; Anastasi, U.; Mauromicale, G. Trifolium subterraneum cover cropping enhances soil fertility and weed seedbank dynamics in a Mediterranean apricot orchard. Agron. Sustain. Dev. 2021, 41, 70. [Google Scholar] [CrossRef]
  34. Sainju, U.; Whitehead, W.; Singh, B. Cover crops and nitrogen fertilization effects on soil aggregation and carbon and nitrogen pools. Can. J. Soil Sci. 2003, 83, 155–165. [Google Scholar] [CrossRef]
  35. Mulvaney, M.J.; Price, A.J.; Wood, C.W. Cover Crop Residue and Organic Mulches Provide Weed Control during Limited-Input No-Till Collard Production. J. Sustain. Agric. 2011, 35, 312–328. [Google Scholar] [CrossRef]
  36. Kornecki, T.S. Impact of different cover crop and termination methods on collard yield. Eur. Agrophysical J. 2019. [Google Scholar]
Figure 1. Experimental layout with split-plot design. Main factor is the cover crop block with the six management and residue manager treatment randomized within each block.
Agronomy 13 02595 g001
Figure 2. (a) Patented four-stage experimental roller/crimper [16]; (b) rotary mower used to mow cover crops; (c) disc harrow used to incorporate cover crop residue after mowing.
Agronomy 13 02595 g002
Figure 3. (a) Isometric view of subsoiling shank residue manager (with compression spring for downward force) mounted near coulter. (b) Isometric view of entire RJ transplanter planting collards during field operations.
Agronomy 13 02595 g003
Table 1. Weather data from Medius Ag, LLC, with minimum and maximum temperatures and precipitation for all three seasons.
201520162017
MonthMin(°C)Max (°C)Prec. (cm)Min (°C)Max (°C)Prec. (cm)Min (°C)Max (°C)Prec. (cm)
January1.214.79.82.214.012.011.919.129.9
February0.713.411.74.518.112.013.620.811.3
March9.922.45.09.723.414.415.122.47.2
April14.225.913.311.725.420.619.927.812.5
May16.129.713.015.829.05.421.728.523.1
June21.232.814.820.633.614.524.830.622.4
July22.634.712.422.635.113.926.934.09.5
August21.833.515.523.134.315.326.132.315.7
September19.130.24.619.933.62.323.330.210.9
October13.025.95.912.530.00.219.025.713.7
November10.622.215.86.324.25.313.519.53.3
December9.120.836.25.416.813.18.814.57.0
Table 2. Experimental description for cover crop treatments.
TreatmentDescription
1Rolling/crimping (Roll) + Residue Manager
2Mowing (Mow) + Residue Manager
3Mowing and incorporating (MowIncorp) + Residue Manager
4Rolling/crimping (Roll)+ No Residue Manager
5Mowing (Mow) + No Residue Manager
6Mowing and incorporating (MowIncorp) + No Residue Manager
Table 3. Dates of individual field activities for all three growing seasons.
Field ActivityGrowing Season
2014–20152015–20162016–2017
Rye cover crop planted17 December 201410 December 201516 December 2016
Collection of plant hts/biomass of rye6 May 2015 19 April 2016 19 April 2017
Application of glyphosate to rye6 May 2015 19 April 2016 19 April 2017
Pre-season soil sample collection11 May 2015 10 May 2016 7 June 2017
Mowing and tilling of test area 12 May 2015 4 May 2016 15 May 2017
Incorporated soil amendments and pre-plant nitrogen for pearl millet12 May 2015 11 May 2016 8 June 2017
Planted summer cover crops13 May 2015 12 May 2016 8 June 2017
Applied nitrogen to pearl millet2 July 2015 29 June 2016 21 July 2017
Collection of plant hts/biomass of pearl millet and performed termination treatments27 July 2015 15 August 2016 29 August 2017
Collection of soil samples for pearl millet at termination28 July 2015 16 August 2016 29 August 2017
Collection of plant hts/biomass of iron clay peas and performed termination treatments25 August 2015 31 August 2016 14 September 2017
Collection of soil samples for iron clay peas at termination26 August 2015 1 September 2016 14 September 2017
Applied glyphosate to entire test area3 September 2015 19 September 2016 18 September 2017
Transplanted collards10 September 2015 21 September 2016
28 September 2016
5 October 2017
Collection of soil samples 1 month after planting8 October 201521 October 2016 1 November 2017
Harvested collards12 November 2015 16 December 2016 11 December 2017
Table 4. Data for rye cover crops including plant height, biomass, total carbon, and total nitrogen.
YearHeight (cm)Biomass (kg ha−1)Total Carbon (kg C ha−1)Total Nitrogen (kg N ha−1)
201541.9 c*1284.0 c570.1 c26.1 c
2016159.4 a5197.5 a2515.7 a68.6 a
2017127.1 b3384.0 b1576.8 b42.1 b
p-value<0.001<0.001<0.001<0.001
* Similar letters in columns indicate no statistical differences using Tukey’s HSD at 0.1 significance level.
Table 5. Biomass, plant length, and carbon to nitrogen ratio data for iron clay peas and pearl millet for all three growing seasons.
Iron Clay PeaPearl Millet
YearBiomass
(kg ha−1)
Ht.
(cm)
C
(kg ha−1)
N
(kg ha−1)
C:NBiomass
(kg ha−1)
Ht.
(cm)
C
(kg ha−1)
N
(kg ha−1)
C:N
20154422 b*47.3 b1950.7 c117.2 b16.5 b8613 ab156.7 b3842.7 a69.9 b55.4 a
20167119 a47.5 b2874.1 b178.4 a17.2 b7232 b128.2 c3098.4 b68.7 b46.9 b
20177854 a54.5 a3483.9 a179.1 a20.4 a9539 a167.2 a4290.6 a98.3 a44.3 b
Average646549.82769.6158.218.08461.3150.73743.979.048.9
p-value<0.0001<0.0001<0.0001<0.00010.00160.0108<0.00010.0027<0.00010.0007
* Similar letters in columns indicate no statistical differences using Tukey’s HSD at 0.1 significance level.
Table 6. ANOVA for collard weekly VMC (volumetric moisture content) readings.
Effectp-Value
REP<0.0001
YEAR<0.0001
CROP<0.0001
WEEK<0.0001
TERM0.0025
ATTACH0.4431
TERM × CROP 0.0065
YEAR × WEEK<0.0001
CROP × YEAR<0.0001
TERM × CROP × YEAR0.0019
TERM × YEAR × WEEK0.0472
Table 7. Weekly VMC (volumetric moisture content) data by crop, year, term meth, and week for first 3 weeks after planting collards. Precipitation amount since previous reading (cm), previous week low temperature (°C), and previous week high temperature (°C).
Iron Clay PeasPearl Millet
YearTerm Meth1 WAP2 WAP3 WAP1 WAP2 WAP3 WAP
2015Roll12.2 a*16.418.5 ab10.5 a13.7 ab16.3
Mow10.1 b14.816.6 b9.3 b13.8 a16.7
MowIncorp10.4 ab15.419.0 a8.8 b12.5 b15.6
Average10.915.318.09.513.316.2
p-value0.02020.14000.03100.01280.05970.3584
Prev Precip0.00.942.160.00.942.16
Prev Low T16.217.419.416.217.419.4
Prev High T29.130.226.829.130.226.8
2016Roll11.910.614.412.8 a12.0 a14.5 a
Mow11.39.613.410.1 b10.3 b13.0 ab
MowIncorp12.210.113.310.8 ab10.1 b12.6 b
Average11.810.113.711.210.813.4
p-value0.52330.42830.35500.03800.03960.0382
Prev Precip0.00.00.230.00.00.23
Prev Low T13.614.812.713.614.812.7
Prev High T30.230.229.830.230.229.8
2017Roll14.611.2 a13.8 a13.7 b11.1 a12.7
Mow14.710.4 ab13.7 a13.2 b9.8 ab12.6
MowIncorp14.69.6 b12.0 b15.6 a9.2 b11.8
Average14.610.413.214.210.012.4
p-value0.97900.04880.01680.01390.01670.1937
Prev Precip9.530.052.749.530.052.74
Prev Low T24.020.016.124.020.016.1
Prev High T29.626.224.129.626.224.1
* Similar letters in column for each year indicate no significant statistical differences using Tukey’s HSD at 0.1 significance level.
Table 8. ANOVA table for total soil carbon and total soil nitrogen.
Soil CarbonSoil Nitrogen
Effectp-Valuep-Value
REP<0.0001<0.0001
YEAR 0.0027<0.0001
CROP0.2238<0.0001
TERM0.27530.1143
DEPTH<0.0001<0.0001
TIMING0.0578<0.0001
DEPTH × YEAR<0.0001<0.0001
DEPTH × TIMING0.02450.0009
YEAR × TIMING<0.00010.0239
YEAR × CROP0.04220.0018
TIMING × CROP0.07220.8532
DEPTH × TIMING × CROP0.02570.1255
YEAR × TIMING × CROP0.02050.7144
Table 9. Total soil carbon concentration (g C kg−1) by depth (TOP = 0–15 cm; BOTTOM = 15–30 cm), timing, crop (ICP = iron clay peas; PMILL = pearl millet), and year.
ICPPMILL
DEPTHTIMING201520162017201520162017
TOPPRE5.08 b*5.00 b5.275.044.93 b5.26 c
AT TERM4.93 b5.51 a5.385.195.45 a6.03 a
MONTH AFTER5.44 a5.47 a5.494.915.51 a5.57 b
p-value0.00040.00200.48900.28730.0012<0.0001
BOTTOMPRE3.36 a2.79 b2.85 ab3.14 a3.002.74 c
AT TERM2.85 b3.07 ab2.81 b2.85 b3.033.25 a
MONTH AFTER2.96 b3.14 a3.08 a2.99 ab3.172.99 b
p-value<0.00010.04350.03700.01220.5255<0.0001
* Similar letters in column for each depth indicate no significant statistical differences using Tukey’s HSD at 0.1 significance level.
Table 10. Total soil nitrogen concentration (g N kg−1) by depth (TOP = 0–15 cm; BOTTOM = 15–30 cm), timing, crop (ICP = iron clay peas; PMILL = pearl millet), and year.
ICPPMILL
DEPTHTIMING201520162017201520162017
TOPPRE0.47 c*0.52 b0.55 b0.43 b0.510.54 b
AT TERM0.53 b0.57 a0.59 a0.49 a0.530.60 a
MONTH AFTER0.57 a0.53 b0.58 ab0.49 a0.530.58 a
p-value<0.00010.00350.02780.00030.16860.0149
BOTTOMPRE0.350.350.340.320.350.35
AT TERM0.360.360.380.330.340.35
MONTH AFTER0.350.350.380.340.350.38
p-value0.55400.50910.09360.13430.74760.1257
* Similar letters in column for each depth indicate no significant statistical differences using Tukey’s HSD at 0.1 significance level.
Table 11. ANOVA table for collard population, collard height, weight per plant, and collard yield.
Collard PopulationCollard HeightWeight per PlantCollard Yield
Effectp-Valuep-Valuep-Valuep-Value
REP0.5196<0.0001<0.00010.0002
YEAR<0.0001<0.0001<0.0001<0.0001
CROP0.5116<0.0001<0.0001<0.0001
TRT0.19300.97330.43330.4273
TRT × YEAR0.12690.63440.28680.4199
CROP × YEAR<0.00010.0267<0.0001<0.0001
TRT × CROP0.02390.80310.57740.0890
TRT × CROP × YEAR0.06280.99550.83480.6637
Table 12. Collard yield (kg ha−1) by cover crop (ICP = iron clay peas; PMILL = pearl millet), cover crop termination method (TERM), and residue manager configuration (with RM/Without RM).
ICPPMILL
TERM201520162017201520162017
With RMRoll11,083.15186.75946.1 a*7954.91625.15266.0
Mow13,154.74559.06042.0 a5914.71790.85203.3
MowIncorp10,063.04638.34029.7 b8012.42259.03020.1
Without RMRoll12,232.24722.95602.6 a8943.62164.04551.1
Mow13,168.65302.75743.8 a7743.92292.14348.8
MowIncorp12,739.72880.63724.6 b8308.81354.04279.1
Average12,073.64548.45181.57813.11914.24444.7
p-value0.63310.20590.00020.36400.78640.1630
* Similar letters in columns indicate no statistical differences using Tukey’s HSD at 0.1 significance level.
Table 13. Collard population (plants ha−1) by cover crop (ICP = iron clay peas; PMILL = pearl millet), cover crop termination method (TERM), and residue manager configuration (with RM/without RM).
ICPPMILL
TERM201520162017201520162017
With RMRoll9043.311,159.9 a*10,775.011,544.7 a7119.210,775.0 ab
Mow10,005.410,582.6 ab10,582.67119.2 b7888.911,159.9 a
MowIncorp7888.99620.6 ab10,197.89813.0 a6734.47696.5 b
Without RMRoll10,390.29428.2 ab9620.610,005.4 a5387.510,197.8 ab
Mow10,005.49620.6 ab10,775.09620.6 a6926.89235.7 ab
MowIncorp9428.29043.3 b10,775.010,582.6 a5772.310,967.4 ab
Average9460.29909.210,454.49780.96638.210,005.4
p-value0.41820.07860.69700.00330.62080.0828
* Similar letters in columns indicate no statistical differences using Tukey’s HSD at a 0.1 significance level.
Table 14. Collard weight per plant (kg plt−1) and height (cm) by cover crop and year.
Collard wt. per PlantCollard Height (cm)
YearIron Clay PeasPearl MilletIron Clay PeasPearl Millet
20151.28 a*0.80 a47.4 a40.1 b
20160.46 b0.28 c43.1 b33.9 c
20170.50 b0.45 b48.5 a44.9 a
Average0.750.5146.339.7
p-value<0.0001<0.0001<0.0001<0.0001
* Similar letters in columns indicate no statistical differences using Tukey’s HSD at 0.1 significance level.
Disclaimer/Publisher’s Note: The statements, opinions and data contained in all publications are solely those of the individual author(s) and contributor(s) and not of MDPI and/or the editor(s). MDPI and/or the editor(s) disclaim responsibility for any injury to people or property resulting from any ideas, methods, instructions or products referred to in the content.

