Abstract
Soil salinization is a significant obstacle to improving natural grasslands, also affecting farmland productivity. The main distribution area of high salinity soils is primarily located in western China, with a significant presence in the Qinghai–Tibet Plateau (QTP). Siberian wildrye (Elymus sibiricus L.) has been widely used in ecological restoration and reseeding in the QTP, due to its strong salt and alkali resistance. To comprehensively evaluate its salt tolerance and to screen salt-tolerant and salt-sensitive germplasm resources, 50 wild E. sibiricus accessions were assessed through the measurement of several physiological parameters. These included the relative water content (RWC); relative electrical conductivity (REC); malondialdehyde content (MDA); proline content (Pro); and Na+/K+ ratio after 14 days of salt stress treatment (200 mmol L−1 NaCl). Through principal component analysis (PCA) based on both material sources and physiological indexing, it was found that the salt damage score (SDS) and RWC had a strong positive correlation (p < 0.05), in opposition to other indices. The positive indicators were REC, Pro, Na+/K+, and MDA, and the negative indicators were RWC and SDS. Ultimately, by combining the results of the conventional membership function analysis and the weighted membership function analysis based on major components, three salt-tolerant accessions—including XJ013-28, NM021-13 and XJ012-17—and four salt-sensitive accessions, including XZ008-20, QH013-8, XZ009-20, and QH005-35, were screened out. These results could be effectively used to assess the effects of salt stress on Siberian wildrye and its related species. This study provides a reference for the discovery and breeding of salt-tolerant cultivars among the Elymus species.
1. Introduction
Salinity is a serious abiotic stress that already affects nearly 1.0 × 10⁹ hm2 of land worldwide, including 30% of highly irrigated land [1]. In China, the area of salinized soil covers approximately 1.0 × 10⁸ hm2, representing almost 10% of the world’s total salinized soil area—among which, saline soil, residual saline soil, and potential saline soil account for 37%, 45%, and 18%, respectively [2]. Excessive soil salinity can cause salt injury to plants, which manifests as damage from a variety of secondary stresses, including osmotic stress, ion toxicity, nutrient deficiency, and oxidative stress [3]. High salt content reduces the water content of soil, causes osmotic stress, inhibits the growth and differentiation of plant organs and tissues, and may even lead to plant death [4,5]. Malondialdehyde and relative conductivity are important physiological indicators to measure the degree of cell membrane damage in plants under stress [6,7,8]. When plants are subjected to salt stress, osmotic balance is regulated by increasing free proline content, in order to maintain the stability of enzyme structures and the integrity of the membrane system [9]. Under salt stress, salt-tolerant plants can selectively absorb K+ and transport it to their above-ground organs, simultaneously reducing the transport of Na+ to their above-ground organs, thus maintaining a higher K+/Na+ ratio in order to reduce the damage of salt stress on the above-ground tissues [10,11,12].
The saline–alkali land in China is mainly distributed between Inner Mongolia, Gansu, Qinghai, Tibet, and Xinjiang. The Qinghai–Tibet Plateau (QTP) is a large area of saline soil distribution in China [13]. The introduction and the planting of vegetation restoration are dependent on the biological improvement and utilization of saline soil [14]. Siberian wildrye (Elymus sibiricus L.) is the typical plant of the Elymus genus in the Triticeae of the Poaceae [15]. It is an allotetraploid perennial herb (genome constitute is StStHH, 2n = 4x = 28). It is one of the endemic species of the QTP. It can form dominant species or constructive species in meadow and grassland plant communities. E. sibiricus has been recognized for its remarkable attributes, including elevated crude protein content; desirable palatability; vigorous tillering capacity; superior yield potential; straightforward cultivation techniques; and remarkable resilience towards cold and drought conditions [16,17,18,19]. Moreover, owing to its extensive root system and adaptability, certain E. sibiricus germplasms have shown promising prospects for cultivation in saline–alkali environments [20]. Therefore, understanding the physiological resistance mechanisms of E. sibiricus with regards to salinity tolerance and using it for saline land management and improvement is a cost-effective strategy for saline land management in China.
In this study, the salt response of 50 E. sibiricus wild accessions was evaluated by measuring their relative water content (RWC), relative electrical conductivity (REC), malondialdehyde content (MDA), proline content (Pro), and Na+/K+ ratio after two weeks of salt stress treatment on seedlings. The aims of this study were to improve the salt tolerance evaluation framework of E. sibiricus, to assess the salt tolerance of these E. sibiricus accessions, and to identify robust salt stress tolerant germplasm. This study can provide the genetic resources available for breeding new salt-tolerant E. sibiricus varieties, and offer insights that can inform broader plant breeding and stress tolerance studies of endemic species to the QTP.
2. Materials and Methods
2.1. Materials, Resources, and Experimental Design
A total of 50 accessions of Elymus sibiricus were used, with the majority sourced from various regions within China, including the Sichuan (6), Qinghai (8), Tibet (4), Gansu (6), Xinjiang (7), Inner Mongolia (8), Heilongjiang (1), and Hebei (6) provinces. Additionally, a limited number of accessions (4) were obtained from Russia (Table S1).
During the initial phase, the glumes of each accession were meticulously removed, followed by sterilization (75% alcohol for 30 s, 10% sodium hypochlorite for 20 min, and rinsing with sterile water twice). The sterilized seeds were then placed on a petri dish lined with moist, double-layered filter paper for germination and seedling emergence. After the seedlings reached the three-leaf stage, uniform and healthy seedlings were selected and transplanted into pots (5 cm in diameter and 25 cm in height) filled with river sand. One plant was grown in each pot, and each accession was represented by four replicates. A small amount of Hoagland nutrient solution was applied daily to keep the river sand moist. When the plants reached 5–8 tillers, the pots were placed in an uncovered chamber and submerged in a 200 mmol·L−1 NaCl Hoagland solution for 14 days. The water level was carefully monitored, ensuring it reached two-thirds of the pot height while completely immersing the root system. Periodic water supplementation was carried out, to prevent any fluctuations in salt concentration due to evaporation. All these meticulous procedures were executed within the controlled environment of a glass greenhouse situated at the Research Academy of Sichuan Grassland Science in Hongyuan County, Aba Prefecture, Sichuan Province, China. The greenhouse was diligently maintained by an air conditioner at a temperature range of 22–26 °C during the daytime, and 15–18 °C during the nighttime. Following the controlled exposure to saline conditions, bulked leaf samples were systematically collected from each individual plant in every pot, instantly frozen in liquid nitrogen, and securely stored in a −80 °C ultra-low temperature freezer. These samples were intended for subsequent determination of various physiological indicators.
2.2. Measurement Indices
2.2.1. Relative Water Content (RWC)
The leaves were weighed to record the fresh leaf weight (FW). The leaves were then soaked in distilled water for 12 h and the turgid weight (TW) was recorded. Finally, the dry weight of the leaves was measured after drying at 65 °C for 48 h to constant weight (DW) [21]. .
2.2.2. Relative Electrical Conductivity (REC)
Leaves of the same size were selected and immersed in a centrifuge tube containing 10 mL of deionized water for 6 h. The initial conductivity was measured and recorded as S1. The centrifuge tube containing the leaves was then heated in a boiling water bath for 30 min. After cooling to room temperature, the total conductivity was measured and recorded as S2 [22]. .
2.2.3. Malondialdehyde Content (MDA) and Proline Content (Pro)
0.5 g of the leaves kept in a −80 °C refrigerator was taken and ground into powder using a high-throughput tissue grinding instrument. The MDA content in leaves was determined using an MDA assay kit (Solarbio, Beijing, China). Specific procedures and calculations were performed according to the instructions in the kit. Proline was determined by the same method as MDA using a Pro assay kit (Solarbio, Beijing, China).
2.2.4. Na+/K+ Ratio
The leaves were dried and ground to powder, weighed, dissolved in 10 mL of 98% H2SO4 and 3 mL of 30% H2O2 mixture, left for 5 h, and digested using the digestion oven. After digestion, the solution was fixed to 100 mL. A series of KCl and NaCl solutions with different concentrations were prepared and the corresponding standard curves were plotted. The Na+ and K+ ions were analyzed by means of a flame spectrophotometer (FP64 series flame spectrophotometer, INESA Analytical Instrument Co., Ltd., Shanghai, China). The Na+ and K+ ion contents were ascertained employing the aforementioned standard curves, and consequently, the Na+/K+ ratio was determined [23].
2.2.5. Salt Damage Score (SDS)
In this study, the evaluation of SDS was conducted based on a four-level scoring system in accordance with the Agricultural Industry Standard of the People’s Republic of China—Technical Regulations for Salt Tolerance Identification of Rice (NY/T 3692-2020) [24]. These scores were determined by considering the actual growth conditions of the materials. Grade D, weak salt tolerance (1–2 points): tiller growth stopped, most leaves dried up; Grade C, medium salt tolerance (2–3 points): tiller growth was inhibited, most leaves curled up, some leaves elongated; Grade B, strong salt tolerance (3–4 points): tiller growth was close to normal, the old leaves of the plant were yellow and dry especially at the leaf margin and leaf tip, no obvious damage to the new leaves; Grade A, very strong salt tolerance (4–5 points): tiller growth is basically normal, and the plant leaves are basically undamaged.
2.3. Data Statistics and Analysis
IBM SPSS Statistics 27 and GraphPad Prism 9.4 software were used to calculate the mean, standard error and descriptive statistical analysis, analysis of variance (ANOVA), and principal component analysis (PCA) for each accession. Correlation analysis was performed based on the R package ‘cor’. Microsoft Excel 2021 was used to calculate and analyze the membership function. The comprehensive evaluation of salt tolerance was performed using the assigned weights method [25].
Comprehensive evaluation of the membership functions formula:
where X is a composite index of E. sibiricus accessions under salt stress, and Xmax and Xmin are the maximum and minimum values of the composite index, respectively. If the indicators are positively correlated with the evaluated properties, such as salt tolerance, use the Formula (1); for negative correlation, use the Equation (2). The values of the membership function are summed up and the mean is obtained and ranked; the greater the mean value, the stronger the evaluation property.
Comprehensive evaluation of the PCA weighted membership function formula:
j = 1, 2, 3, ……n;
- where μ is the expected value; W is the weight value corresponding to variable X (the proportion of the contribution rate of the corresponding variable and the cumulative contribution rate); and D is the comprehensive evaluation value of salinity tolerance obtained from the evaluation of each index under salt stress, with higher values indicating stronger salinity tolerance.
3. Results
The descriptive statistical results of the six indicators showed wide significant variation among the 50 accessions, with coefficients of variation ranging from 9.633% (RWC) to 47.50% (Pro) (Table 1).

Table 1.
Descriptive statistical analysis of indicators for 50 E. sibircus accessions.
3.1. Physiological Response of E. sibiricus under Salt Stress
The relative water content (RWC) is often considered as one of the important indicators to evaluate the water content in plants, and it is closely related to the salt tolerance of plants. When E. sibiricus was subjected to the stress environment of 200 mmol·L−1 NaCl for 14 days, the RWC of accession W610304 reached a max of 95.24%, showing the strongest water retention capacity. HB010-3 was relatively weak in terms of water retention, with the lowest relative water content of 68.61% (Figure 1a). Relative electrical conductivity (REC) reflects the cell membrane permeability, and it has been shown that an increase in cell membrane permeability indicates an increase in salt stress damage, and that the change in REC is negatively correlated with plant salt tolerance. Salt stress had a significant effect on the REC of E. sibiricus, and the REC of QH008-33 was the lowest, at 19.47% after 14 days of growth under salt stress, indicating that the plant cell membrane was less damaged. This result indicated that QH008-33 was extremely tolerant to salt stress. On the contrary, the REC of GS014-8 was the highest at 96.97%, indicating that it was extremely sensitive to the salt stress environment (Figure 1b).
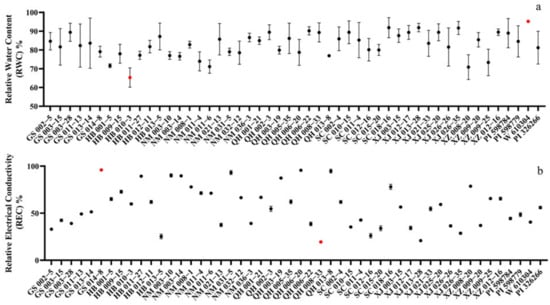
Figure 1.
(a) Effects of salt stress on relative water content (RWC-a) and (b) relative electrical conductivity (REC-b) of E. sibiricus accessions after 14 days. Red dots represent max and min values.
SC012-16 had the lowest MDA content of 3.75 nmol·g−1, indicating that it was less damaged by salt stress. On the contrary, W610304 was subjected to salt stress and accumulated a large amount of MDA, measured at 39.4 nmol·g−1, and suffered a higher degree of damage (Figure 2a). Pro not only regulates cytoplasmic osmotic pressure under stress conditions, but also protects cell membranes and enzyme structures and relieves stress pressure [26]. Therefore, Pro content is often used to assess plant tolerance. HB010-3 had the highest Pro content of 49.28 μg·g−1. In contrast, SC015-20 had only 6.28 μg·g−1 (Figure 2b). When plants are in salt-stressed environments, their intracellular ion homeostasis is disrupted. Because Na+ and K+ have similar ionic radii and will compete for binding to ion proteins that transport K+, Na+ inhibits K+ uptake in a saline environment. QH005-35 had the highest Na+/K+ value of 1, indicating that Na+ has the strongest inhibitory effect on K+ in the intracellular environment of this material, and that salt stress has the greatest effect on its intracellular ion balance. In contrast, the E. sibiricus material HB011-27 maintained a very low Na+/K+ value (0.2157) in a 200 mmol·L−1 NaCl solution, indicating that this plant material has an extremely strong ion homeostasis (Figure 2c).
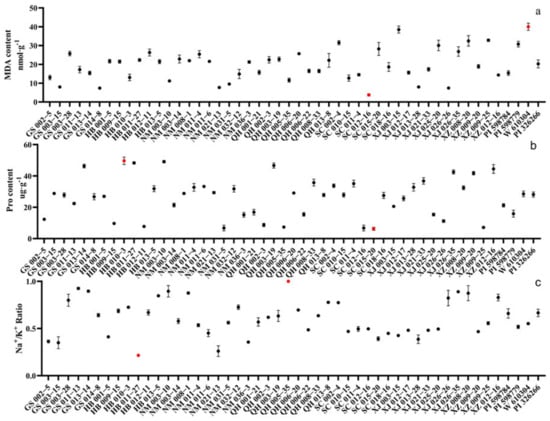
Figure 2.
Effects of salt stress on malondialdehyde content (MDA-a) (a), proline content (Pro-b) (b), and Na+/K+ ratio (c) of E. sibiricus accessions after 14 days. Red dots represent max and min values.
After 14 days of salt stress treatment, the E. sibiricus accessions had different plant phenotypes (Figure 3). XJ013-28 and PI598784 had abundant tillers, less yellow leafage, no obvious leaf curling, and still bright green leaves, so the points of SDS were higher and were rated as grade A (Figure S1). In contrast, the E. sibiricus accessions of NM011-6 and QH005-35 were more damaged, with suppressed tillering and plant growth, more severe leaf wilting and leaf curling, and a high number of needle-like leaves; they thus had lower points of SDS and were rated as grade D, indicating lower tolerance to salt stress.
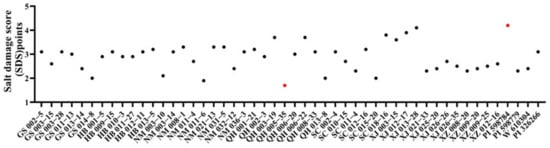
Figure 3.
Effects of salt stress on the salt damage score (SDS) of E. sibiricus accessions after 14 days. Red dots represent max and min values.
3.2. Correlation Analysis and Principal Component Analysis
The KMO–Bartlett test result showed that the overall MSA (measures of sampling adequacy) is 0.52 (p = 0.0099), and the MSA value for each parameter is greater than 0.5, which indicates that the dataset is suitable for PCA analysis (Table 2). Correlation analysis of the measured indicators of E. sibiricus under salt stress was performed using the R(v.4.3.1) package ‘cor’. Among the corrplot of the observed indicators of E. sibiricus seedlings (Figure 4), REC and RWC showed a significant negative correlation (R = −0.598, p < 0.05), but all other indicators have a correlation of less than 0.8. Overall, the correlations among the indicators were not strong or significant, indicating that the observed indicators were relatively independent of each other. However, since the performances of E. sibiricus accessions varied under different observation indices, the salt tolerance of the accessions could not be evaluated by a single index. In order to objectively and accurately evaluate the salt tolerance of E. sibiricus, principal component analysis (PCA) was performed by SPSS.
Table 2.
KMO–Bartlett test of principal components.
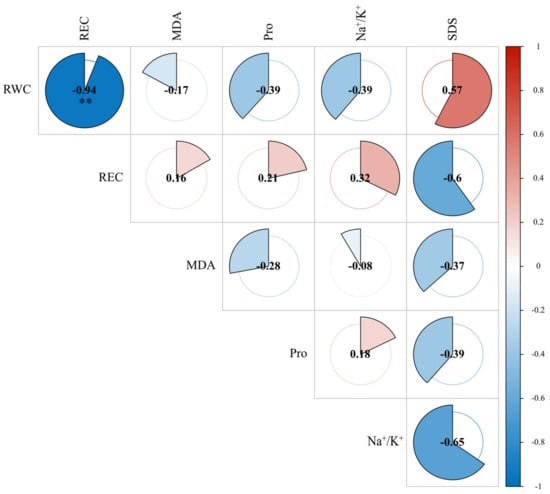
Figure 4.
Corrplot of observed indicators. Red represents positive correlation; blue represents negative correlation. ** = significant at p < 0.01, respectively.
In the process of performing PCA, three principal component factors with eigenvalues greater than 1 were extracted in this study. They possessed a cumulative contribution of 67.28%, indicating that they could cover most of the information of the six measurement indices, and thus could be used as effective components of the analyzed data (Table 3). From the component loadings matrix, combined with the magnitude of the contribution of each principal component, it can be concluded that the RWC, REC, and SDS have higher loadings on the first principal component compared to other measured indicators. This indicates that the first principal component mainly responds to the information of these indicators. MDA and Pro have higher loadings on the second principal component, indicating that the second principal component mainly responds to the information of these two indicators. The third principal component has the highest loadings of Na+/K+. The loadings of Na+/K+ were the highest in the third principal component, indicating that the information of this index was more completely represented. In conclusion, the most important indicators of salt tolerance in E. sibiricus are RWC, REC, and SDS, followed by MDA, Pro, and Na+/K+ (Table 4).
Table 3.
Eigenvalues of principal components.
Table 4.
Loading matrix of principal components.
The associations between all physiological parameters under salinity stress conditions were estimated through PCA. The first two PCAs were used to construct an informative plot system based on the evaluated sources of geographical information on E. sibiricus, but each accession could not be clearly identified. The first two PCAs represented about 49.5% of the variability, with the first and the second PCA explaining 31.7% and 17.8% of the total variation between all parameters, respectively. In general, the parameters represented by adjacent or parallel vectors show a strong positive association between each other. It is not a very accurate approach to distinguish individual germplasm by geographical origin as a group (Figure 5). All the parameters measured in this study can be divided into three groups. The first group included Pro and Na+/K+ ratio. The second group included REC and MDA. The third group consisted of RWC and SDS. There was an acute angle between the vectors of these parameters. A strong positive association was found between the characteristics included in the same group. There was also a positive association between the first and second groups. On the other hand, a negative association was observed between the second and third groups (Figure 6).
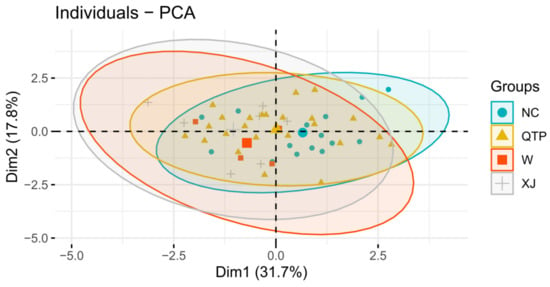
Figure 5.
Principal component analysis (PCA) of labelled groups.
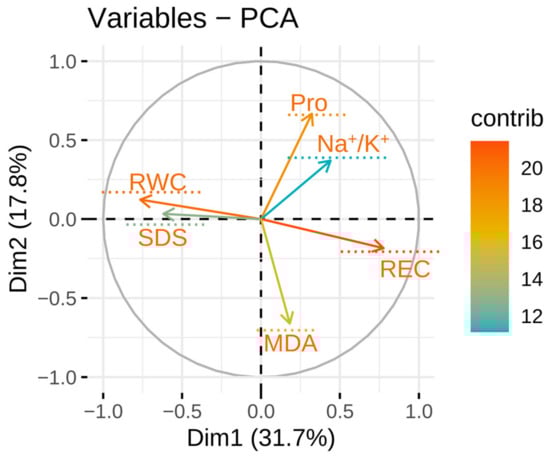
Figure 6.
PCA of physiologic parameters.
3.3. Cluster Analysis
After normalization of all data, the 50 germplasm in this study were classified into seven clusters (Figure 7). Cluster 1 consisted of 15 accessions, followed by 12, 9, 2, 8, 2, and 2 in clusters 2, 3, 4, 5, 6, and 7, respectively. The heat map shows the two-way classification of traits and germplasm; seedling traits under salinity stress were divided into three groups. SDS and RWC were found to be positively correlated with the salt stress in E. sibiricus. QH005-35 was found to be the most susceptible to salinity stress. QH006-22, XJ012-17, and PI598784 perform better in some negative indicators like MDA, Pro, REC, and Na+/K+, so they are considered as salt-tolerant varieties.
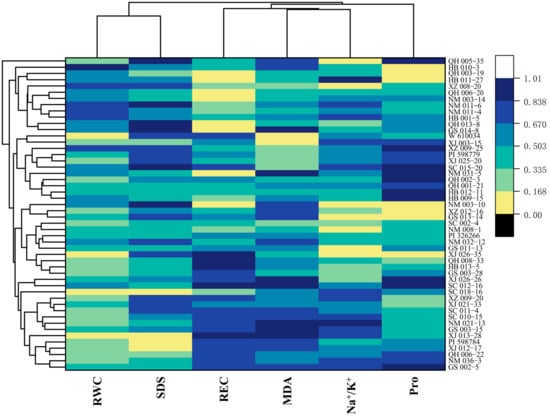
Figure 7.
Clustered heat map of the performance of E. sibiricus accessions under salt stress.
3.4. Comprehensive Evaluation of Salt Tolerance
Comprehensive evaluation is a commonly used method for screening adversity-tolerant and sensitive accessions. Methods based on traditional membership function analysis require artificial assignment of correlations between indicators and resistance (positive and negative correlations); but the reality is that the physiology and biochemistry that occurs in response to stress is extremely complicated, and a simple linear relationship is not sufficient. Therefore, in this study, two comprehensive analysis methods—principal component weighted membership function analysis, and fuzzy mathematical membership function analysis—were used to distinguish salt-tolerant and salt-sensitive materials in the comprehensive evaluation of the salt tolerance of E. sibiricus. The weighted membership function algorithm, based on the principal component analysis, was used to calculate the composite scores of salt tolerance indices for E. sibiricus, and the higher the score, the better the germplasm salt tolerance. The top five and bottom five accessions in terms of salt tolerance under salt stress conditions were selected as tolerant and sensitive materials under stress conditions, respectively. These were XJ013-28, NM021-13, SC012-16, XJ012-17, GS002-5 and QH005-35, along with NM003-10, XZ009-20, QH013-8, and XZ008-20 (Table 5).
Table 5.
Principal Component Weighted Membership Function Analysis.
Furthermore, based on the salinity tolerance index results, the E. sibiricus accessions were rescreened using the fuzzy membership function method in this study, and their salinity tolerance was comprehensively evaluated. Based on the specific affiliation values and ranking of different E. sibiricus accessions, the top five accessions were considered salt-tolerant, including XJ013-28, NM021-13, XJ012-17, QH008-33, and SC010-15, while the bottom five accessions were considered salt-sensitive; these included ID HB009-15, QH005-35, QH013-8, XZ008-20, and XZ009-20 (Table 6).
Table 6.
Analysis of membership functions in fuzzy mathematics.
Therefore, it is necessary to use a combination of both principal component weighted association function analysis and fuzzy association function analysis. In summary, XJ013-28, NM021-13, and XJ012-17 exhibited salt tolerance, while XZ008-20, QH013-8, XZ009-20, and QH005-35 exhibited salt sensitivity when exposed to a salt stress environment. Notably, XJ013-28 had the most robust overall salt tolerance rating, while XZ008-20 had the weakest overall salt tolerance rating.
4. Discussion
Currently, soil salinity is one of the environmental factors affecting plant growth, causing secondary stresses like ionic, osmotic, and oxidative stress, which inhibit the growth and differentiation of plant tissues and organs, causing plant leaves to wilt and curl, and plants to wilt and dwarf [27,28,29,30,31]. Water molecules are abundant in plant leaves, and the amount of water content in leaves is a key factor in determining plant survival, as well as being an important indicator of overall plant water content, which is extremely important in assessing the physiological status of plants under salt stress. Leaf water content was negatively correlated with the salinity of the growing environment—the higher the salinity, the more significant the effect [32]. In an analysis of the salt tolerance of alfalfa, it was found that the variation of leaf water content varied among different varieties of alfalfa, and its salt tolerance was positively correlated with leaf water content [33]. In this study, the relative water content of E. sibiricus leaves varied widely (68.61% to 95.24%) under salt stress, indicating that different genotypic materials showed large differences in relative water content under salt stress, which can provide preparation for the screening of different salt-tolerant germplasm materials. It was found that the Triticosecale rimpaui germplasm accessions with higher salt tolerance could maintain higher relative water content under salt stress, indicating that it is important for plants to maintain and utilize internal water under salt stress [34].
The cytoplasm of plant leaf cells is tightly bound to the cell wall, forming a membrane known as the leaf cell membrane. When plants are in a high salinity environment, this membrane increases its permeability due to varying degrees of damage, leading to extravasation of intracellular electrolytes, resulting in an increase in the conductivity of the external fluid and a consequent increase in the relative conductivity. The accumulation of Malondialdehyde (MDA) indicates a level of damage to membranes and cells. MDA is a measure of membrane damage and is the end product of lipid peroxidation, and its values are useful in assessing the extent of plant damage due to stress [6,7,8]. In the salt stress experiment of Chenopodium quinoa Willd [35], the MDA content of leaves increased significantly, aggravating the degree of membrane ester peroxidation and causing cell membrane damage. The changes in MDA levels reflect the peroxidation of plant cytoplasmic membranes under stress. It is generally believed that the higher the intracellular MDA content, the greater the damage to the membrane system. In the present study, different E. sibiricus materials showed different levels of malondialdehyde response, with a minimum of 3.75 nmol g−1 and a maximum of 40.00 nmol g−1, which provided some basis for the salt tolerance evaluation work. To maintain cell expansion pressure and alleviate osmotic stress, plants also actively accumulate organic substances for osmoregulation. Proline is the most important osmoprotectant for plants to regulate osmotic potential in response to stress [36]. It has been shown that both E. sibiricus and Elymus nutans have adapted to saline environments by accumulating proline [37]. In the present study, the proline accumulation of E. sibiricus in a high salinity environment ranged from 6.28 μg g−1 to 49.67 μg g−1, and the materials with high proline content grew well, indicating that E. sibiricus can regulate cellular osmotic potential and mitigate osmotic damage by accumulating large amounts of proline. Accumulating more proline may be one of the important strategies for E. sibiricus to respond to salt stress.
Excessive sodium ions under salt stress can lead to ion imbalance, which can cause ion toxicity because most salt-intolerant species do not have the ability to translocate Na+, and Na+ is more likely to accumulate in plants compared to CI−. While K+ is an important ion involved in plant photosynthesis, osmoregulation, and other processes in plants, too much Na+ inhibits K+ uptake, which in turn affects plant growth. Therefore, plants maintain a low Na+/K+ ratio as a reflection of their high salt tolerance [38]. This phenomenon has been observed in rice [39], oats [40], and alfalfa [41]. The Na+/K+ ratio of the test materials varied from 0.22 to 1, with an average value of 0.61. In general, the salt tolerance of different germplasm differed significantly. The highest Na+/K+ ratio was 1, which was lower than that of oats [42], indicating that E. sibiricus species have strong salt tolerance.
Salt tolerance in plants is a quantitative genetic trait, controlled by multiple genes that reflect the genetics, physiology, and biochemistry of the plant’s own responses. The strength of salt tolerance cannot be accurately evaluated by only one indicator, so a comprehensive evaluation of indicators should be conducted when studying the salt tolerance of plants [36]. The fuzzy mathematical affiliation function method is widely used to evaluate the salt tolerance of many plants because it can eliminate the one-sidedness brought by a single index [40,41,42]. Due to the correlation between different indicators, the salt tolerance information overlaps, and it is necessary to determine the positivity and negativity of the affiliation function, although salt tolerance is a comprehensive trait, and most of the time, it is not a simple linear relationship [43,44]. Therefore, the present study was conducted by principal component analysis. Principal component analysis was used to convert each individual index of E. sibiricus into three independent composite indices that reflect most of the information of the indices. These were combined with the weights to calculate the comprehensive evaluation value of drought tolerance (D values) in order to identify the salt tolerance of E. sibiricus, and then combined with the results of conventional affiliation function analysis based on the measured indices to evaluate the salt tolerance of E. sibiricus. The accuracy of the study results was improved by combining the results of the conventional affiliation function analysis with multiple evaluation methods.
5. Conclusions
In this study, salt tolerance evaluation was conducted on diverse geographical sources of collected E. sibiricus germplasm. Multiple assessment methods were employed, revealing that there was no significant correlation between geographic origin and salt tolerance. This lack of correlation could be attributed to the sampling strategy being random in nature and the limited diversity of accessions. Through comprehensive evaluation, salt-tolerant germplasm was successfully identified, providing a valuable reference for the assessment of highly resistant germplasm in E. sibiricus and its related species. Additionally, in future salt tolerance evaluations, it is recommended to utilize various assessment methods, such as membership functions and PCA, focusing on indicators such as REC, Pro, Na+/K+, MDA, and others. Moreover, this evaluation provides useful resources for the development of grazing pastures and artificial grasslands in challenging environmental conditions.
Supplementary Materials
The following supporting information can be downloaded at: https://www.mdpi.com/article/10.3390/agronomy13112675/s1, Table S1: Basic information of the tested E. sibiricus accessions. Figure S1: The obvious phenotype difference between Lower point of SDS and Higher point of SDS accessions.
Author Contributions
S.C.: software, writing—original draft preparation, visualization, formal analysis, J.F.: software, data curation, writing—original draft preparation, Y.X. (Yi Xiong): validation, investigation, writing—review and editing, Y.X. (Yanli Xiong): validation, writing—review and editing, Y.L.: conceptualization, investigation, J.Z.: methodology, resources, Z.D.: resources, methodology, X.M.: conceptualization, writing—review and editing, supervision, project administration, funding acquisition, L.Y.: supervision, project administration, funding acquisition, resources. All authors have read and agreed to the published version of the manuscript.
Funding
This research was funded by the National Natural Science Foundation of China (32271753); National Forestry and Grassland Administration Emergency Science and Technology Leading Project (20220102); Sichuan Provincial Central and Local University Regional Cooperation Project (2023YFSY0012); the Sichuan Province "14th Five-Year Plan" Forage Breeding Research Project (2021YFYZ0013-2); and the Sichuan Forage Innovation Team Program (sccxtd-2020-16).
Data Availability Statement
Data are contained within the article or the Supplementary Materials.
Acknowledgments
We are very grateful to the College of Grassland Science and Technology, Sichuan Agricultural University and Sichuan Academy of Grassland Science for providing us with experimental equipment and venues. Thank you to all authors for their hard work on this manuscript.
Conflicts of Interest
The authors declare no conflict of interest.
References
- Giordano, M.; Petropoulos, S.A.; Rouphael, Y. Response and Defence Mechanisms of Vegetable Crops against Drought, Heat and Salinity Stress. Agriculture 2021, 11, 463. [Google Scholar] [CrossRef]
- Huang, J.; Kong, Y.L.; Xu, Q.S.; Zhu, C.Q.; Zhu, L.F.; Cao, X.C.; Hong, X.Z.; Zhang, J.H. Progresses for Characteristics and Amelioration Measures of Saline Soil. Soils 2022, 54, 18–23. [Google Scholar]
- Muchate, N.S.; Nikalje, G.C.; Rajurkar, N.S.; Suprasanna, P.; Nikam, T.D. Plant Salt Stress: Adaptive Responses, Tolerance Mechanism and Bioengineering for Salt Tolerance. Bot. Rev. 2016, 82, 371–406. [Google Scholar] [CrossRef]
- Ben, H.A.; Ghneim, H.T.; Ben, R.W.; Dabbous, A.; Ben, S.R.; Brini, F.; Abdelly, C.; Ben, H.K. Early effects of salt stress on the physiological and oxidative status of the halophyte Lobularia maritima. Funct. Plant Biol. 2020, 47, 912. [Google Scholar] [CrossRef]
- Sadaqat, S.S.; Li, Z.; Yan, H.; Shi, L.; Zhou, B. Comparative Study of the Effects of Salinity on Growth, Gas Exchange, N Accumulation and Stable Isotope Signatures of Forage Oat (Avena sativa L.) Genotypes. Plants 2020, 9, 1025. [Google Scholar] [CrossRef]
- Wang, W.; Zhao, Y.; Wang, W.; Xu, K.; Niu, L.; Yu, L.; Zou, J.; Wang, Z.; Zhang, Y.; Wang, F.; et al. Evaluation of Salt Tolerance Mechanism and Study on Salt Tolerance Relationship of Different Salt-Tolerant Wheat Varieties. Comput. Intell. Neurosci. 2022, 2022, 2395568. [Google Scholar] [CrossRef]
- Zuo, Z.F.; Kang, H.; Park, M.Y.; Jeong, H.; Sun, H.; Song, P.; Lee, H.Y. Zoysia japonica MYC type transcription factor ZjICE1 regulates cold tolerance in transgenic Arabidopsis. Plant Sci. 2019, 289, 110254. [Google Scholar] [CrossRef]
- Zou, J.; Liu, C.; Liu, A.; Zou, D.; Chen, X. Overexpression of OsHsp17.0 and OsHsp23.7 enhances drought and salt tolerance in rice. J. Plant Physiol. 2012, 169, 628–635. [Google Scholar] [CrossRef]
- Wang, Y. Evaluation of Salt Tolerance of Different Types of Tobacco and Physiological Mechanism of Salinity Stress Tolerance at Seeding Stage. Master’s Dissertation, Henan Agricultural University, Zhengzhou, China, 2021. [Google Scholar]
- Hu, D.D.; Li, R.F.; Dong, S.T.; Zhang, J.W.; Zhao, B.; Ren, B.Z.; Ren, H.; Yao, H.Y.; Wang, Z.Q.; Liu, Z. Maize (Zea mays L.) responses to salt stress in terms of root anatomy, respiration and antioxidative enzyme activity. BMC Plant Biol. 2022, 22, 602. [Google Scholar] [CrossRef]
- Bargaz, A.; Zaman, A.M.; Farissi, M.; Lazali, M.; Drevon, J.J.; Maougal, R.; Georg, C. Physiological Physiological and molecular aspects of tolerance to environmental constraints in grain and forage legumes. Int. J. Mol. Sci. 2015, 16, 18976–19008. [Google Scholar] [CrossRef]
- Wang, X.D.; Wang, C.; Ma, Z.H.; Hou, R.F.; Gao, Q.; Chen, Q. Effect of short-term salt stress on the absorption of K+ and accumulation of Na+, K+ in seedlings of different wheat varieties. Acta Ecol. Sin. 2011, 31, 2822–2830. [Google Scholar]
- Wei, B.X. Distribution and Cause Analysis of Saline—Alkaline Soil in China. Technol. Soil Water Conserv. 2012, 6, 27–28. [Google Scholar]
- Yang, J.S.; Yao, R.J.; Wang, X.P.; Xie, W.P.; Zhang, X.; Zhu, W.; Zhang, L.; Sun, R.J. Research on Salt-affected Soils in China: History, Status Quo and Prospect. Acta Pedol. Sin. 2022, 59, 10–27. [Google Scholar]
- Huang, F.; Li, Z.Y.; Li, H.Y.; Shi, W.G.; Bai, W.J.; Liu, L.; Li, J.; Xie, Y.F. Analysis of Morphological Diversity of Elymus sibiricus L. Germplasm Resources. Chin. J. Grassl. 2015, 37, 111–115. [Google Scholar]
- Yan, X.B. Study of Genetic Diversity of Elymus Species. Ph.D. Dissertation, China Agricultural University, Beijing, China, 2005. [Google Scholar]
- Li, M.F.; Li, X.R.; Li, Y.Z.; Chen, L.L.; Wang, Y.; Li, C.Y.; Chang, D.; Lei, X.; Yan, L.J.; You, M.H.; et al. Identification of Wild Elymus sibiricus Germplasm Resources and Analysis of Variation of Dorsal Hairs in Basal Leaf Sheath. Acta Prataculturae Sin. 2023, 31, 1026–1035. [Google Scholar]
- Peng, J.; Sun, X.X.; Shi, H.T.; Chen, Y.J.; Cai, X.R.; Wang, X.; Bai, X.; Li, S.L. Nutritional Value and Molecular Structure Characteristics in Different Fractions of Elymus sibiricus from Qinghai-Tibet Plateau. Chin. J. Anim. Nutr. 2022, 34, 5270–5282. [Google Scholar]
- Zeng, H.G.; Yue, J.M.; Zhang, S.H.; Yi, K.; Wei, K.; Yang, S.F.; Liu, G.X.; Li, M.L.; Yang, C.H. Comprehensive Evaluation of Agronomic Traits of 76 Germplasm Resources of Elymus sibiricus. Acta Agrestia Sin. 2022, 30, 3046–3055. [Google Scholar]
- Zhang, Z.; Zheng, Y.; Zhang, J.; Wang, N.; Wang, Y.; Liu, W.; Bai, S.; Xie, W. High-Altitude Genetic Selection and Genome-Wide Association Analysis of Yield-Related Traits in Elymus sibiricus L. Using SLAF Sequencing. Front. Plant Sci. 2022, 13, 874409. [Google Scholar] [CrossRef]
- Guo, Y.; Liu, Y.; Zhang, Y.; Liu, J.; Gul, Z.; Guo, X.R.; Abozeid, A.; Tang, Z.H. Effects of Exogenous Calcium on Adaptive Growth, Photosynthesis, Ion Homeostasis and Phenolics of Gleditsia sinensis Lam. Plants under Salt Stress. Agriculture 2021, 11, 978. [Google Scholar] [CrossRef]
- You, J.; Zhang, J.; Wang, W.R.; Lu, J.; Jia, P.X.; Miao, J.S.; Yang, Y.L. Changes of Physiological Properties in Limonium aureum(Linn.) Hill Seedlings under Salt Stress. Bull. Bot. Res. 2013, 33, 45–50. [Google Scholar]
- Wang, N.; Yang, J.; Huang, Q.; Su, G.L.; Zhou, H.; Xu, Q.H.; Dong, H.L.; Yan, G.T. Physiological Salinity Tolerance Mechanism for Transport of K+ and Na+ Ions in Cotton (Gossypium hirsutum L.) Seedlings under Salt Stress. Cotton Sci. 2015, 27, 208–215. [Google Scholar]
- Han, L.Z.; Gen, L.Y.; Ma, X.D.; Cui, D.; Wang, C.L.; Zhang, Q.X. Technical Code of Practice for Identification of Salt Tolerance in Rice; NY/T 3692-2020; Ministry of Agiculture and Rural Affairs of the People’s Republic of China: Beijing, China, 2020. Available online: http://www.jgj.moa.gov.cn/nybz/202009/t20200924_6353165.htm (accessed on 24 September 2020).
- Liang, S.; Xiong, W.; Yin, C.; Xie, X.; Jin, Y.; Zhang, S.; Yang, B.; Ye, G.; Chen, S.; Luan, W. Overexpression of OsARD1 Improves Submergence, Drought, and Salt Tolerances of Seedling Through the Enhancement of Ethylene Synthesis in Rice. Front. Plant Sci. 2019, 10, 1088. [Google Scholar] [CrossRef] [PubMed]
- Zhu, B.; Zheng, S.; Fan, W.; Zhang, M.; Xia, Z.; Chen, X.; Zhao, A. Ectopic overexpression of mulberry MnT5H2 enhances melatonin production and salt tolerance in tobacco. Front. Plant Sci. 2022, 13, 1061141. [Google Scholar] [CrossRef] [PubMed]
- Zhao, N.; Sheng, M.; Zhao, J.; Ma, X.; Wei, Q.; Song, Q.; Zhang, K.; Xu, W.; Sun, C.; Liu, F.; et al. Over-Expression of HDA710 Delays Leaf Senescence in Rice (Oryza sativa L.). Front. Bioeng. Biotechnol. 2020, 8, 471. [Google Scholar] [CrossRef]
- Zhang, Z.Y.; Li, X.; Wang, Y.; Chang, W.; Gao, X.Q.; Fu, B.Z. Salt Tolerance Evaluation and Salt Tolerance Index Screening of 59 Alfalfa Germplasm Materials at Seedling Stage. Acta Agrestia Sin. 2020, 28, 112–121. [Google Scholar]
- Zhang, Z.R.; Zhang, X.W.; Jiang, W.; Wang, B.B.; Sun, H.D.; Wang, Y.S.; Luo, J.X. Responses of Growth and Physiological Characteristics of Three Ground Cover Plants to Salinity Stress. Tianjin Agric. Sci. 2017, 23, 20–24. [Google Scholar]
- Han, Z.P.; Zhang, H.X.; Zhou, F. Effect of Salinity on Plant and Adaptation of Plant to Salinity. J. Shanxi Datong Univ. (Nat. Sci.) 2015, 31, 59–62. [Google Scholar]
- Wang, Y.F. Responses of Maize Seedling under NaCl Stress and the Regulatory Mechanism of Salt Tolerance. Ph.D. Dissertation, Shenyang Agricultural University, Shenyang, China, 2008. [Google Scholar]
- Mi, Y.W.; Wang, G.X.; Gong, C.W.; Cai, Z.P.; Wu, W.G. Effects of Salt stress on growth and physiology of Isatis indigotica seedlings. Acta Pratacult. Sin. 2018, 27, 43–51. [Google Scholar]
- Li, Y.; Liu, G.B.; Gao, H.W.; Sun, G.Z.; Zhao, H.M.; Xie, N. A comprehensive evaluation of salt-tolerance and the physiological response of Medicago sativa at the seedling stage. Acta Pratacultu. Sin. 2010, 19, 79–86. [Google Scholar]
- Zhang, R.Q.; Chen, H.; Wang, R.Q. Screening on Salt-tolerant Germplasm Resource of Triticale. Seed 2016, 35, 61–64. [Google Scholar]
- Liu, W.; Li, J.; Yang, F.; Huang, J.; Wei, Y.; Jin, Q. Effects of Salt Stress on Seed Germination of 40 Quinoa Germplasm and Evaluation of Salt Tolerance. Mol. Plant Breed. 2021, 19, 938–995. [Google Scholar]
- Yang, Y.J.; Zhang, H.; Zhou, H.K.; Wang, W.Y.; Yin, H.X.; Yao, B.Q.; Zhao, X.Q. Effect of Salt Stress on Physiological Characteristics of Alpine Grassland Pasture Elymus sibiricus. Acta Agric. Boreali-Occident. Sin. 2015, 24, 156–162. [Google Scholar]
- Yang, Y.J.; Zhou, H.K.; Wang, W.Y.; Yin, H.X.; Yao, B.Q.; Yu, X.C.; Zhao, X.Q.; Wang, F.G. Effect of salt stess on the physiological characteristics of Elymus nutans. J. Lanzhou Univ. 2014, 50, 101–106. [Google Scholar]
- Zhao, Z.J.; Zhang, H.L.; Wang, M.J.; Zhang, X.M.; Li, L.X. Salt stress-related regulation mechanism of intracellular pH and ion homeostasis in plants. Plant Physiol. J. 2020, 56, 337–344. [Google Scholar]
- Porcel, R.; Aroca, R.; Azcon, R.; Ruiz-Lozano, J.M. Regulation of cation transporter genes by the arbuscular mycorrhizal symbiosis in rice plants subjected to salinity suggests improved salt tolerance due to reduced Na+ root-to-shoot distribution. Mycorrhiza 2016, 26, 673–684. [Google Scholar] [CrossRef]
- Wang, M.M.; Zhou, X.R.; Liang, G.L.; Zhao, G.Q.; Jiao, R.A.; Chai, J.K.; Gao, X.M.; Li, J.N. A multi-trait evaluation of salt tolerance of 5 oat germplasm lines at lines at seedling stage. Acta Pratacult. Sin. 2020, 29, 143–154. [Google Scholar]
- Li, X.; Sha, B.P.; Gao, X.Q.; Wang, Y.; Fu, B.Z. Identification and Comprehensive Evaluation of Salt Tolerance of Alfalfa Germplasm Materials at Germination Stage. Acta Agrestia Sin. 2020, 28, 437–445. [Google Scholar]
- Gao, Z.W. Research on the Salt-Alkali Resistance Mechanism of Alfalfa an Oat. Ph.D. Dissertation, Northeast Normal University, Changchun, China, 2011. [Google Scholar]
- Peng, Z.; Li, L.; Liu, Y.P.; Liu, H.M.; Jing, R.L. Evaluation of Salinity Tolerance in Wheat (Triticum aestium) Genotypes at Germination and Seedling Stages. J. Plant Genet. Resour. 2017, 18, 638–645. [Google Scholar]
- Sheng, W.; Wu, X.C.; Liang, H.; Li, C.Y.; Ma, Y.Y.; Zhang, J.X.; Ding, X.P.; Li, X.Y.; Liu, G.D. Evaluation of salt tolerance in 41 pigeon pea varieties during germination. Pratacult. Sci. 2022, 39, 1607–1617. [Google Scholar]
Disclaimer/Publisher’s Note: The statements, opinions and data contained in all publications are solely those of the individual author(s) and contributor(s) and not of MDPI and/or the editor(s). MDPI and/or the editor(s) disclaim responsibility for any injury to people or property resulting from any ideas, methods, instructions or products referred to in the content. |
© 2023 by the authors. Licensee MDPI, Basel, Switzerland. This article is an open access article distributed under the terms and conditions of the Creative Commons Attribution (CC BY) license (https://creativecommons.org/licenses/by/4.0/).