Article

Role of Temporal Zn Fertilization along with Zn Solubilizing Bacteria in Enhancing Zinc Content, Uptake, and Zinc Use Efficiency in Wheat Genotypes and Its Implications for Agronomic Biofortification

1
Department of Agronomy, The University of Haripur, Haripur 22620, Pakistan
2
Department of Agronomy, Sayed Jamaluddin Afghani University, Asadabad 2801, Afghanistan
3
Agricultural Research Institute, Tarnab, Peshawar 24330, Pakistan
4
Biology Department, Faculty of Science, King Khalid University, P.O. Box 9004, Abha 61413, Saudi Arabia
5
Research Center for Advanced Materials Science (RCAMS), King Khalid University, P.O. Box 9004, Abha 61413, Saudi Arabia
*
Author to whom correspondence should be addressed.
Agronomy 2023, 13(11), 2677; https://doi.org/10.3390/agronomy13112677
Submission received: 2 October 2023 / Revised: 18 October 2023 / Accepted: 23 October 2023 / Published: 25 October 2023

Abstract

:
Wheat (Triticum aestivum L.) is a vital cereal crop for food security in Pakistan. In Zn-deficient soils, its productivity and quality suffer, affecting grain yield, Zn bioavailability, and nutrition, which can lead to malnutrition. Field experiments were conducted using factorial randomized block design at the Agricultural Research Institute (ARI) Tarnab, Peshawar, Pakistan to evaluate the impact of wheat genotypes (G1-TRB-72-311 synthetic hexaploid, G2-TRB-89-348 advanced line, and G3-Pirsabak-19-approved variety), Zn application methods (AM1: no Zn application, AM2: seed priming with 0.5% Zn, AM3: soil application of 10 kg ha−1 Zn, and AM4: foliar application of 0.5% Zn), and the experiment also explored the use of ZSB (BF1: with bacteria, BF0: without bacteria) to cope with Zn deficiency. The study revealed significant impacts on wheat’s Zn content, uptake, and nutrient efficiency, arising from genotypes variance, Zn application approaches, and ZSB. TRB-72-311 synthetic hexaploid genotype with 0.5% foliar Zn and ZSB excelled, enhancing grain (17.8%) and straw Zn (23.1%), increasing total Zn uptake (55.0%), reducing grain phytic acid (11.7%), and boosting Zn-related efficiencies in wheat. These results prompt further discussion regarding the potential implications for agricultural practices. In conclusion, utilizing the TRB-72-311 genotype with 0.5% foliar Zn application and ZSB enhances wheat’s Zn content, uptake, grain quality, and addresses malnutrition.

1. Introduction

The second Sustainable Development Goal (SDG2) of the United Nations is centered on the ambitious objective of eliminating hunger and ensuring food security for everyone by the year 2030 [1]. Hidden hunger is a prevalent global problem, impacting billions of people. It refers to a severe lack of essential vitamins and micronutrients, especially zinc (Zn), in their diets [2,3]. Zn is one of the most vital micronutrients needed for numerous metabolic processes in all forms of life [4]. Approximately 1.25 billion people experienced nutritional disorders due to insufficient Zn intake [5]. The daily zinc requirements for the human body depend on age and gender. Pregnant and lactating women demand substantially higher Zn (25–30 mg day−1), while children and adults require 1.1–11.2 and 3.0–19.0 mg Zn day−1, respectively [6,7]. Reported [8] that consuming wheat and other food grains produced in Zn-deficient soil conditions in Afghanistan, Pakistan, Iran, India, and Turkey causes severe Zn deficiency in those nations. The primary reason for widespread Zn deficiency is the relatively low bioavailability of Zn [9]. Approximately 50% of cereal-growing soils worldwide have low Zn availability by The Food and Agriculture Organization [10]. In Pakistan, the situation is more severe, with 70% of soils being Zn deficient [8]. This deficiency results in reduced Zn content in grains. Wheat (Triticum aestivum L.) stands out as the predominant staple cereal, globally cultivated on over 240 million hectares of land, with production exceeding 778 million tonnes [11], being as is an important staple crop in many parts of the world, and it does contribute significantly to the calorie and protein intake of various populations (25%) [12,13,14], however, it is inherently deficient in bioavailable Zn [15,16]. New wheat genotypes were developed through hybridization of synthetic hexaploid wheat lines derived from the wild ancestor “Aegilops tauschii” and cultivated wheat species Triticum durum. The main objective behind this development is to enhance the Zn content in wheat, and this effort aligns with the goals of the HarvestPlus initiative [17]. Wheat genotypes demonstrated a significant relationship with plant yield, influencing the uptake of Zn as [18]. There exists a substantial disparity between the Zn content found in wheat grains, which typically ranges from 20 to 35 mg kg−1, and the recommended Zn level of 45 mg kg−1 for ensuring human health underscores the necessity for biofortification [19]. In addition to genetic approaches, agronomic biofortification approaches can also enhance the Zn content in wheat grain with Zn fertilization through seed priming, soil applied, and foliar application, along with the presence and absence of Zn-solubilizing bacteria (ZSB) in term of availability, effectiveness and sustainability ([20,21,22]. Numerous studies demonstrated that seed priming increases the Zn content in wheat, and it is a cost-effective approach [5,23,24]. The soil application of Zn is widely used to enhance Zn content in wheat and maximize grain yield [25]. However, foliar application of Zn is particularly useful when soil conditions limit root uptake. Foliar Zn application resulted in the highest Zn content and best bioavailability in grains, followed closely by soil application, which demonstrated the second-highest Zn content and bioavailability for grains [5]. The use of ZSB is another alternative approach. Incorporating ZSB as an inoculant is a cost-effective and environmentally friendly option for Zn bio-fertilization. These bacteria have the ability to solubilize Zn by producing organic acids in the soil, which leads to a decrease in soil pH and the sequestration of Zn cations [26]. According to [27], the application of ZSB resulted in a 7.5% increase in wheat straw Zn content compared to not using ZSB. Similarly, [28] found that applying ZSB, along with both soil and foliage applications of Zn, increased grain Zn content and bioavailability. In light of the mentioned concerns, this study aims to evaluate the effects of Zn fertilization and ZSB application on Zn content, uptake, grain yield, and use efficiency in various wheat genotypes to eliminate malnutrition.

2. Material and Methods

2.1. Location and Soil

Field experiments were conducted during the winter season at the Agricultural Research Institute (ARI) Tarnab, Peshawar, in Khyber Pakhtunkhwa, Pakistan, with the first experiment carried out in the years 2021–2022 and repeated in 2022–2023. The research site is located at latitude of 34°01′ N and a longitude of 71°72′ E, with an elevation of 581 m above sea level, monthly average temperature and rainfall of growing seasons were shown in Figure 1. The soil at the experimental site (Alfisol) had a texture composed of 2% sand, 88% silt, and 10% clay. Its pH was 8.1, electrical conductivity (EC) was 0.48 ds m−1, organic content was 0.46%, calcium carbonate (CaCO3) content was 6.75%, nitrogen content was 0.086 mg kg−1, phosphorus content was 9.03 mg kg−1, potassium content was 87 mg kg−1, and Zn content was 0.98 mg kg−1.

2.2. Experimental Details

The experiments followed a randomized complete block design (RCBD) with a factorial arrangement having three replications. The study involved three variables: (A) Three wheat genotypes: G1—TRB-72-311 synthetic hexaploid (SHW), G2—TRB-89-348 advanced line, and G3—Pirsabak-19-approved variety. (B) Four Zn application methods: AM1—no Zn application (control), AM2—Zn seed priming, wheat seeds were soaked in an aerated Zn solution with a ratio of 1:5 seed weight to distilled water at a concentration of 0.5% (0.1 M or 3 kg Zn ha−1) for 12 hours. An aquarium pump was used to provide artificial aeration during soaking. Afterward, the seeds were rinsed with disttilled water and dried in the shade with air until they reached their original weight, AM3—Zn was applied to the soil at the rate of 10 kg ha−1 during seed bed preparation, and AM4—foliar spray of Zn was applied at a concentration of 0.5% (3.5 kg Zn ha−1) using a manually operated knapsack sprayer at the heading stage of crop. ZnSO47H2O was used as the source of Zn for all the treatments. (C) BF1—ZSB (Bacillus sp. strain AZ6 (accession number KT221633) application and BF0—no ZSB application. The prepared ZSB solution of strains was obtained from the Institute of Soil & Environmental Sciences, University of Agricultural Faisalabad. The ZSB was applied to the soil before sowing at the rate of 5 L ha−1 [29].

2.3. Crop Husbandry

The wheat crop was planted by hand hoe with a 30 cm row-to-row distance and a 3 m row length, using a 120 kg seeds ha−1. The field was prepared by plowing it twice with a cultivator, after that by a rotavator to break up clods and pulverize the soil. Each plot had a size of 3 m × 1.8 m, containing six rows. The recommended dose of N: P: K fertilizers at the rate of 120–90–60 kg ha−1 was applied using urea, di-ammonium phosphate (DAP), and sulfate of potash as the fertilizer sources. The half amount of the recommended dose of nitrogen (N) and the all amount of phosphorus (P) and potassium (K) were applied at the time of sowing, while the remaining N dose was split equally and applied during the first and second irrigation.

2.4. Observations and Measurements

Wheat grain and a straw grinded sample of 0.5 g was taken from each treatment and digested in a 1:1 mixture of nitric acid and per chloric acid. The flasks were placed on a hot plate in a digestion chamber and temperature was gradually increased up to (320 °C), white fumes of the per chloric acid were ceased, and the digestion was cooled and diluted to 50 mL by the addition of distilled water. Aliquots of this solution were used for the determination of Zn by using atomic absorption spectroscopy [30]. Phytic acid was determined according to the method explained by [31]. Zn uptake and use contributing attributes were calculated using following equations:
Grain   Zn   conc .   mg   kg 1 = m a c h i n e   r e a d i n g w e i g h t   o f   s a m p l e ×   volume   of   extract   ( mL ) ;
Zn uptake (g ha−1) by grain = grains Zn conc. mg kg−1 × yield of grain t ha−1;
Zn uptake (g ha−1) by straw = straw Zn conc. mg kg−1 × yield of straw t ha−1;
Total uptake (g ha−1) = grain uptake of Zn + Straw uptake of Zn.
The Zn use efficiencies (including agronomic, physiological, recovery efficiency, and partial factor productivity) were calculated following the method of [32,33].
Agronomic use efficiency (AE) kg yield increase per kg Zn applied
A E = G Y Z n G Y 0 F Z n .
Physiological efficiency (PE) kg yield increase per kg increase in Zn uptake from fertilizer
F E = G Y Z n G Y 0 G U Z n G U 0 .
Recovery efficiency (RE) kg increase in Zn uptake per kg Zn applied
RE = G U Z n G U 0 F Z n .
Partial factor productivity (PFP) kg harvest yield per kg Zn applied
PEP = G Y Z n F Z n .
  • GYZn: represent the grain yield with applied Zn (kg ha−1).
  • GY0: represent the grain yield (kg ha−1) in a control treatment where no Zn was applied.
  • FZn: represent the amount of Zn fertilizer applied (kg ha−1).
  • GUZn: represent the Zn uptake in the grain (kg ha−1), in a plot that received Zn.
  • GU0: represent the Zn uptake in the grain (kg ha−1), in a plot that did not receive Zn.

2.5. Statistical Analysis

The data were analyzed using Statistics 8.1 (Analytical Software, Statistix; Tallahassee, FL, USA, 1985–2003). Post hoc testing was performed using the least significant differences (LSD) Fisher at the p ≤ 0.05 test to compare and distinguish between the treatments means. For multivariate analysis and identifying strong Pearson correlations among several features in various ways, Biplot and correlation plots were produced using the OriginPro 2023b program.

3. Results

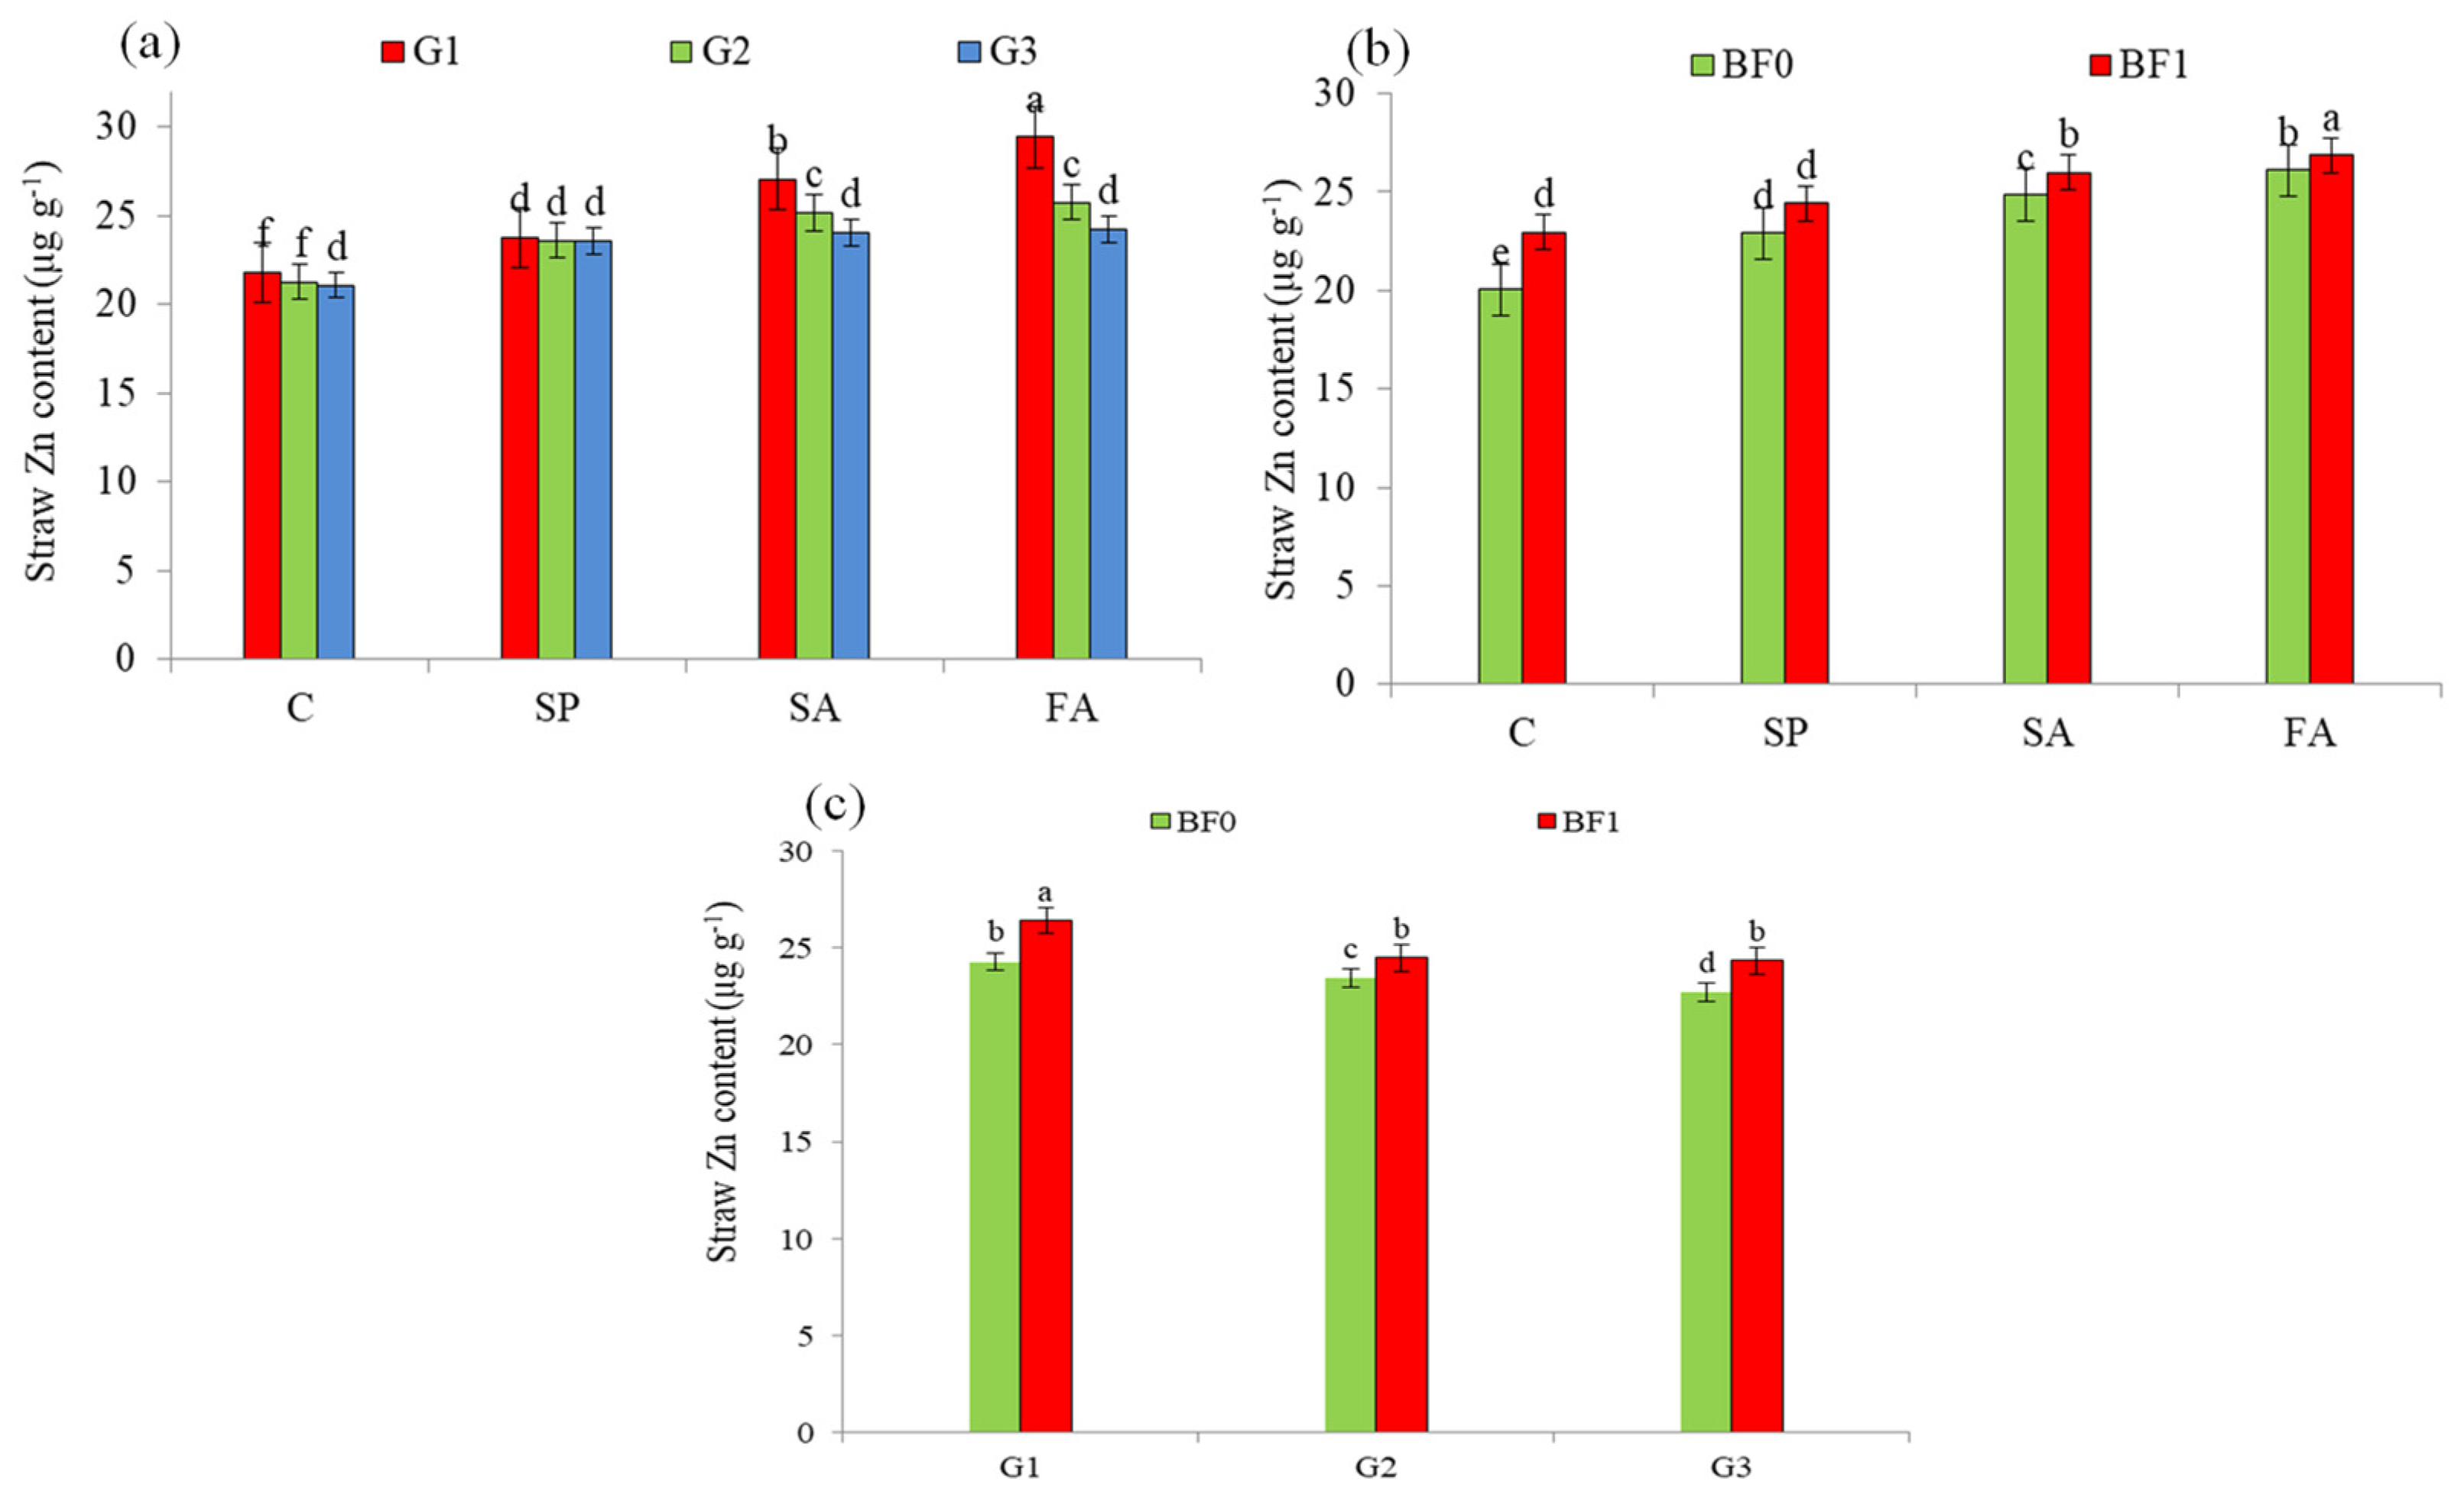
3.1. Grain and Straw Zn Content µg g−1

Grain and straw Zn content of wheat significantly impacted wheat genotypes (G), Zn application methods (AM), and ZSB application (Table 1). Significant interactions (G × AM, G × ZSB, AM × ZSB, Y × G × AM, Y × G × ZSB, and Y × G × AM × ZSB) were observed for Zn content of grain (Figure 2) and (G × AM, G × ZSB, AM × ZSB, G × AM × ZSB, and Y × AM) for straw Zn content (Figure 3), while other interactions were not significant. Among wheat genotypes, TRB-72-311 exhibited the highest grain Zn content, closely followed by TRB-89-348, PS-19 showing slightly lower grain Zn content. Foliar spraying at 0.5% consistently resulted in the highest grain Zn content over both years, followed by Zn soil application at 10 kg ha−1. Zn seed priming at 0.5% showed a moderate increase, while no Zn application yielded the lowest grain Zn content. ZSB application resulted in a higher average grain Zn content compared to no ZSB application. Likewise, straw Zn content significantly increased by 8.5% in TRB-72-311 and by 2.0% in TRB-89-348 compared to PS-19. In 2021–22, the straw Zn content increased through various methods, with the highest increase observed with Zn foliar spraying at 0.5%, followed by Zn soil application at 10 kg ha−1 and seed priming at 0.5%, compared to no Zn application. Similarly, there was an increase in Zn content for each method in 2022–23 as well. ZSB application resulted in an overall higher straw Zn content as compared to without ZSB application.

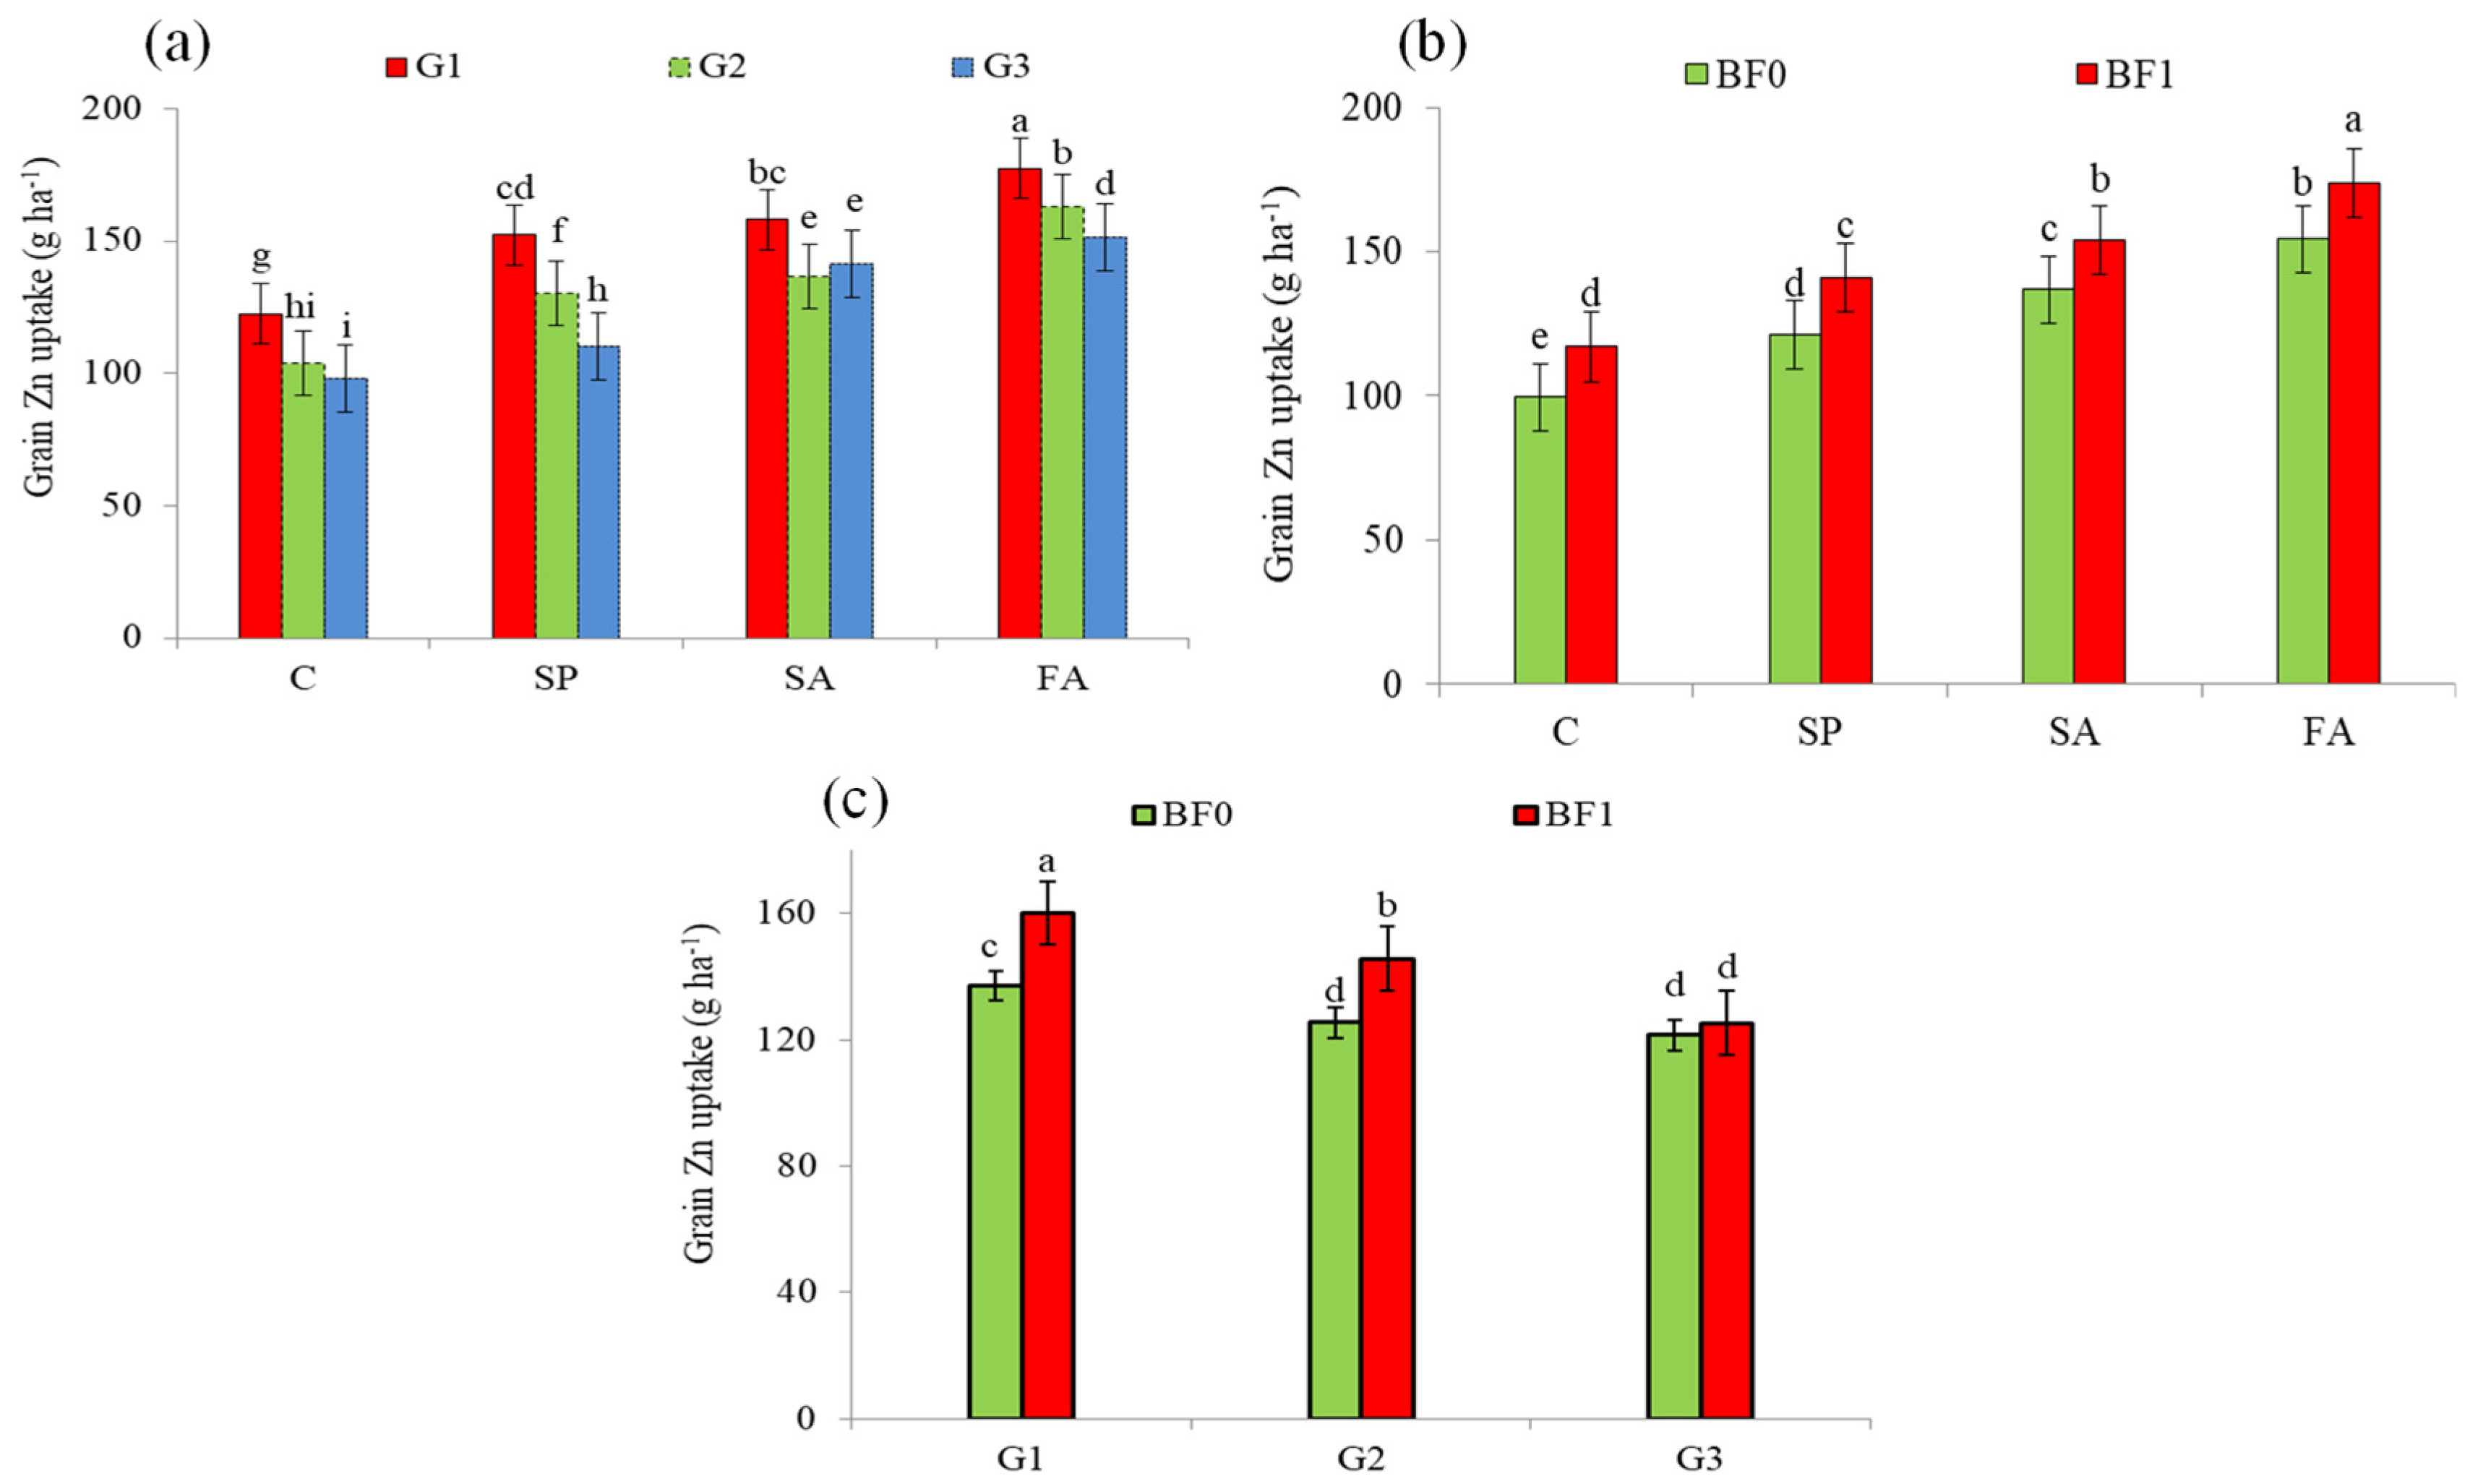
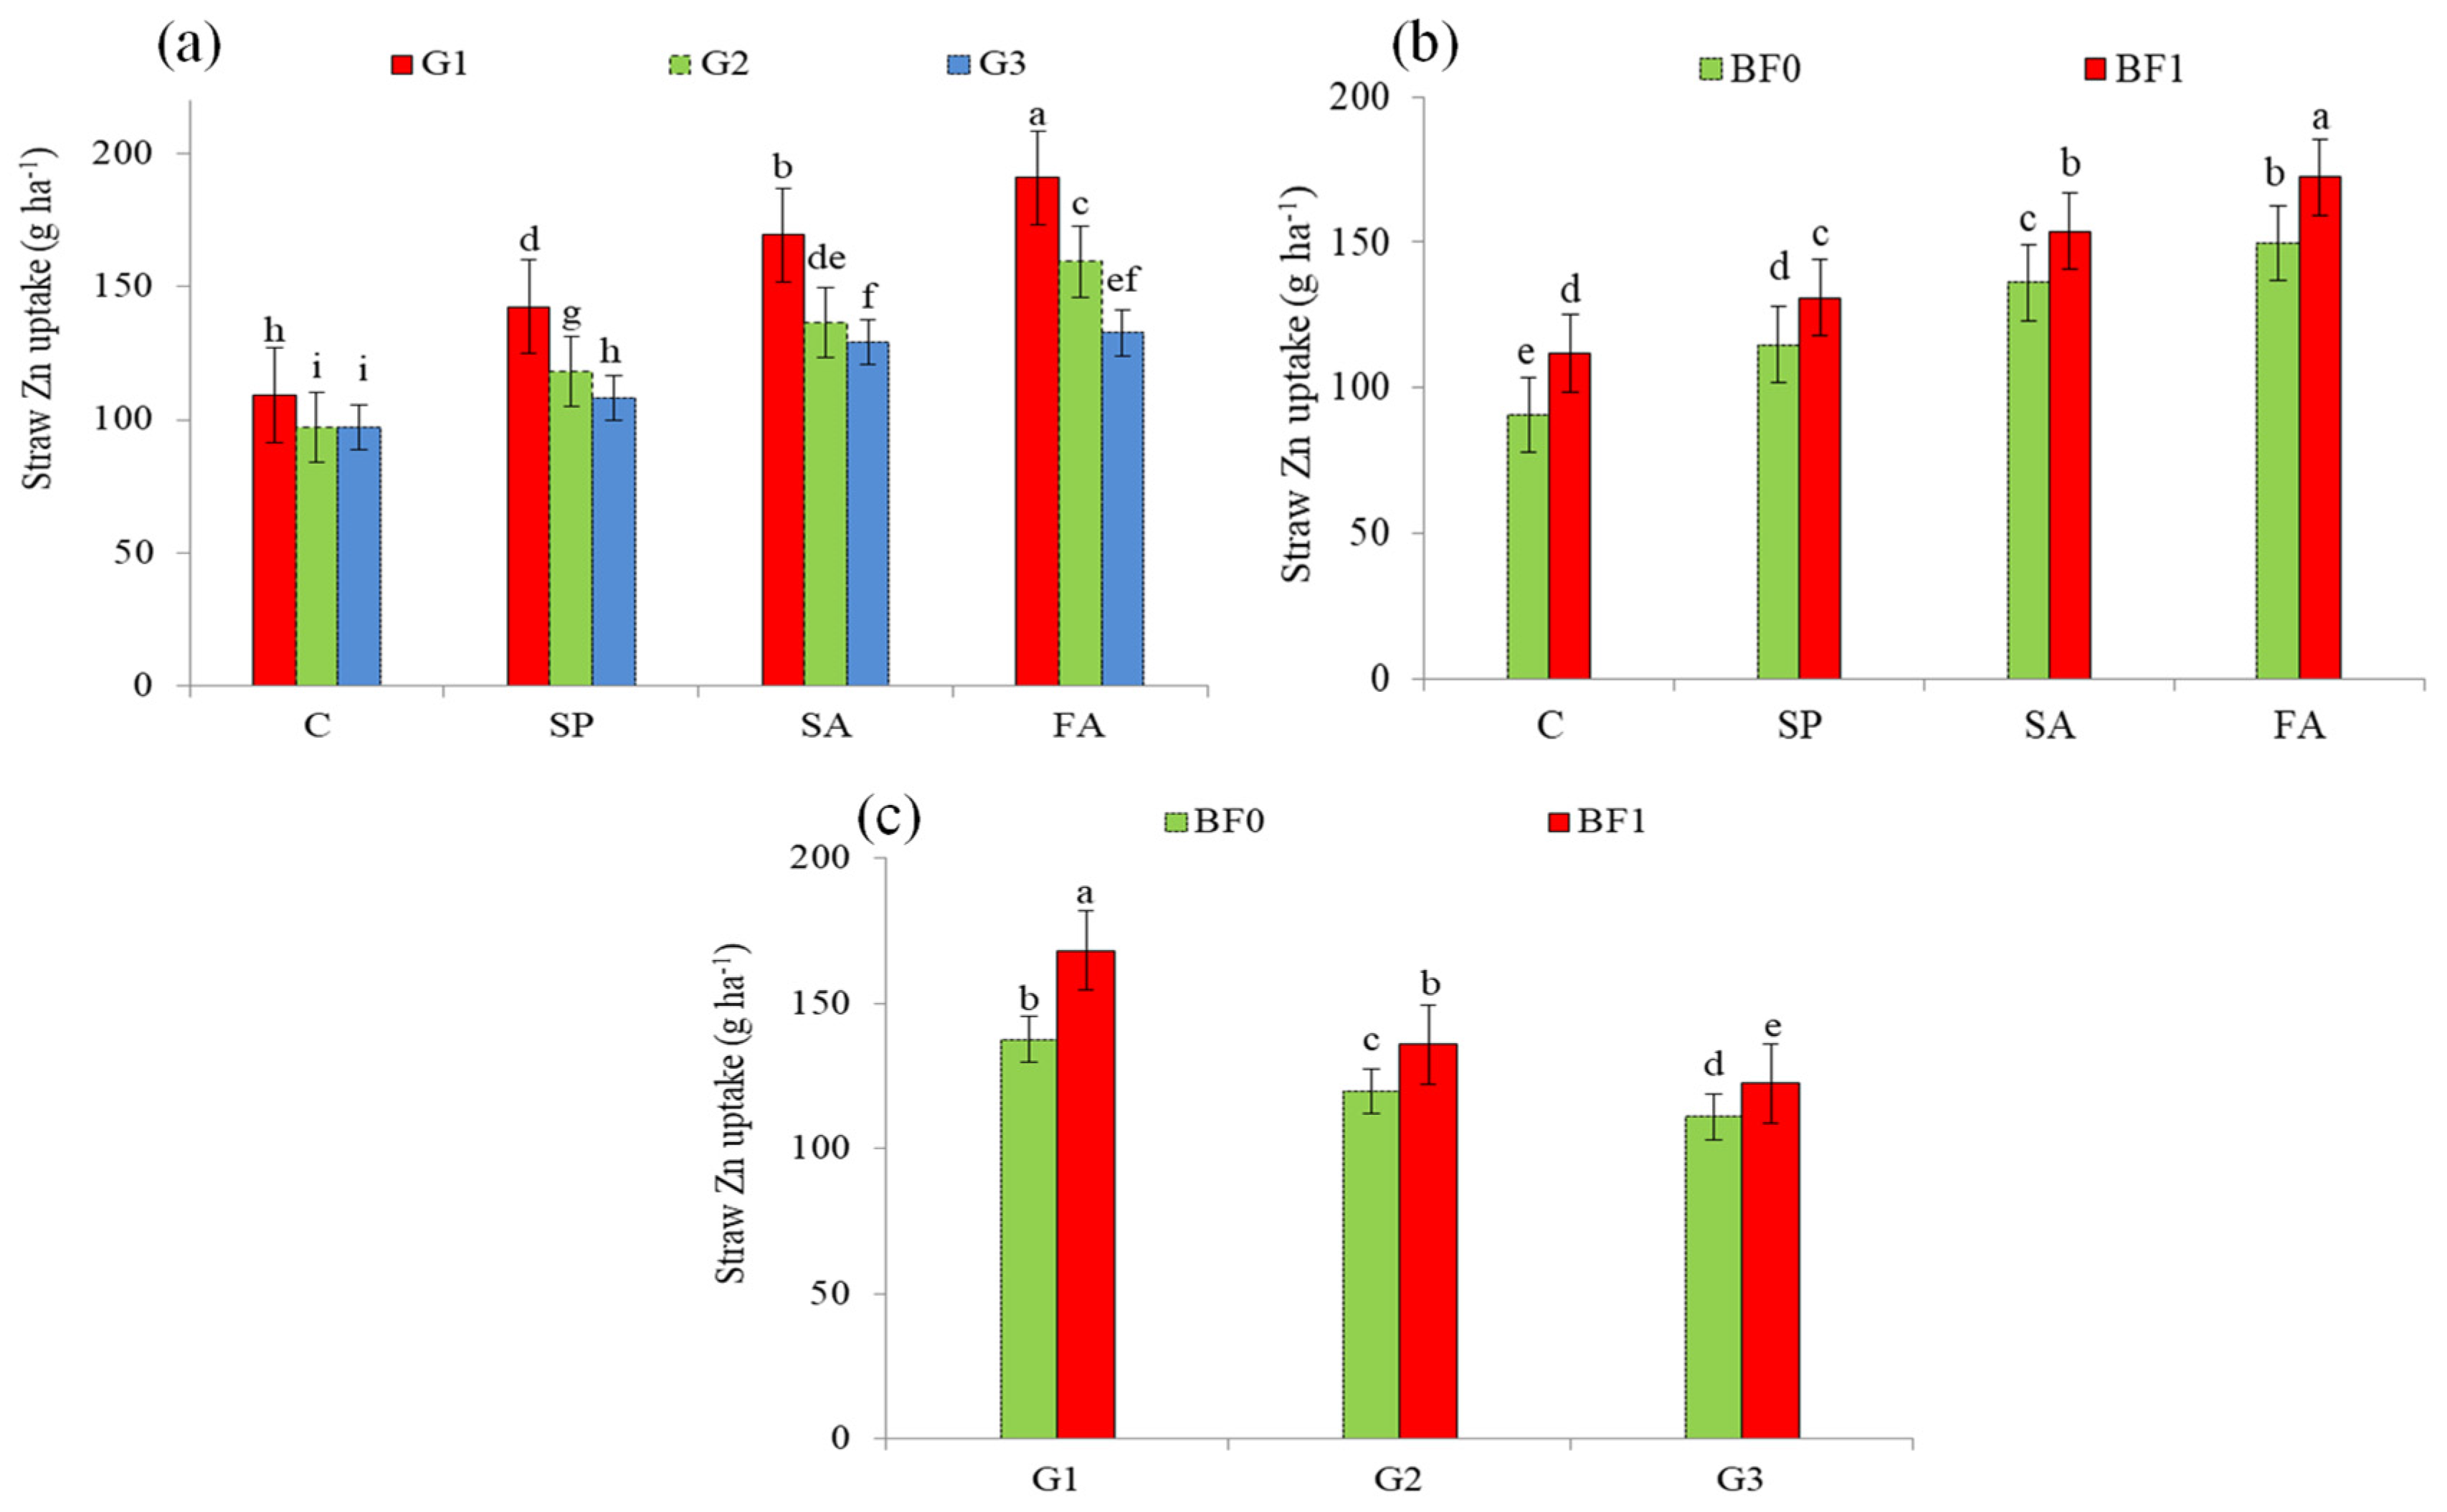
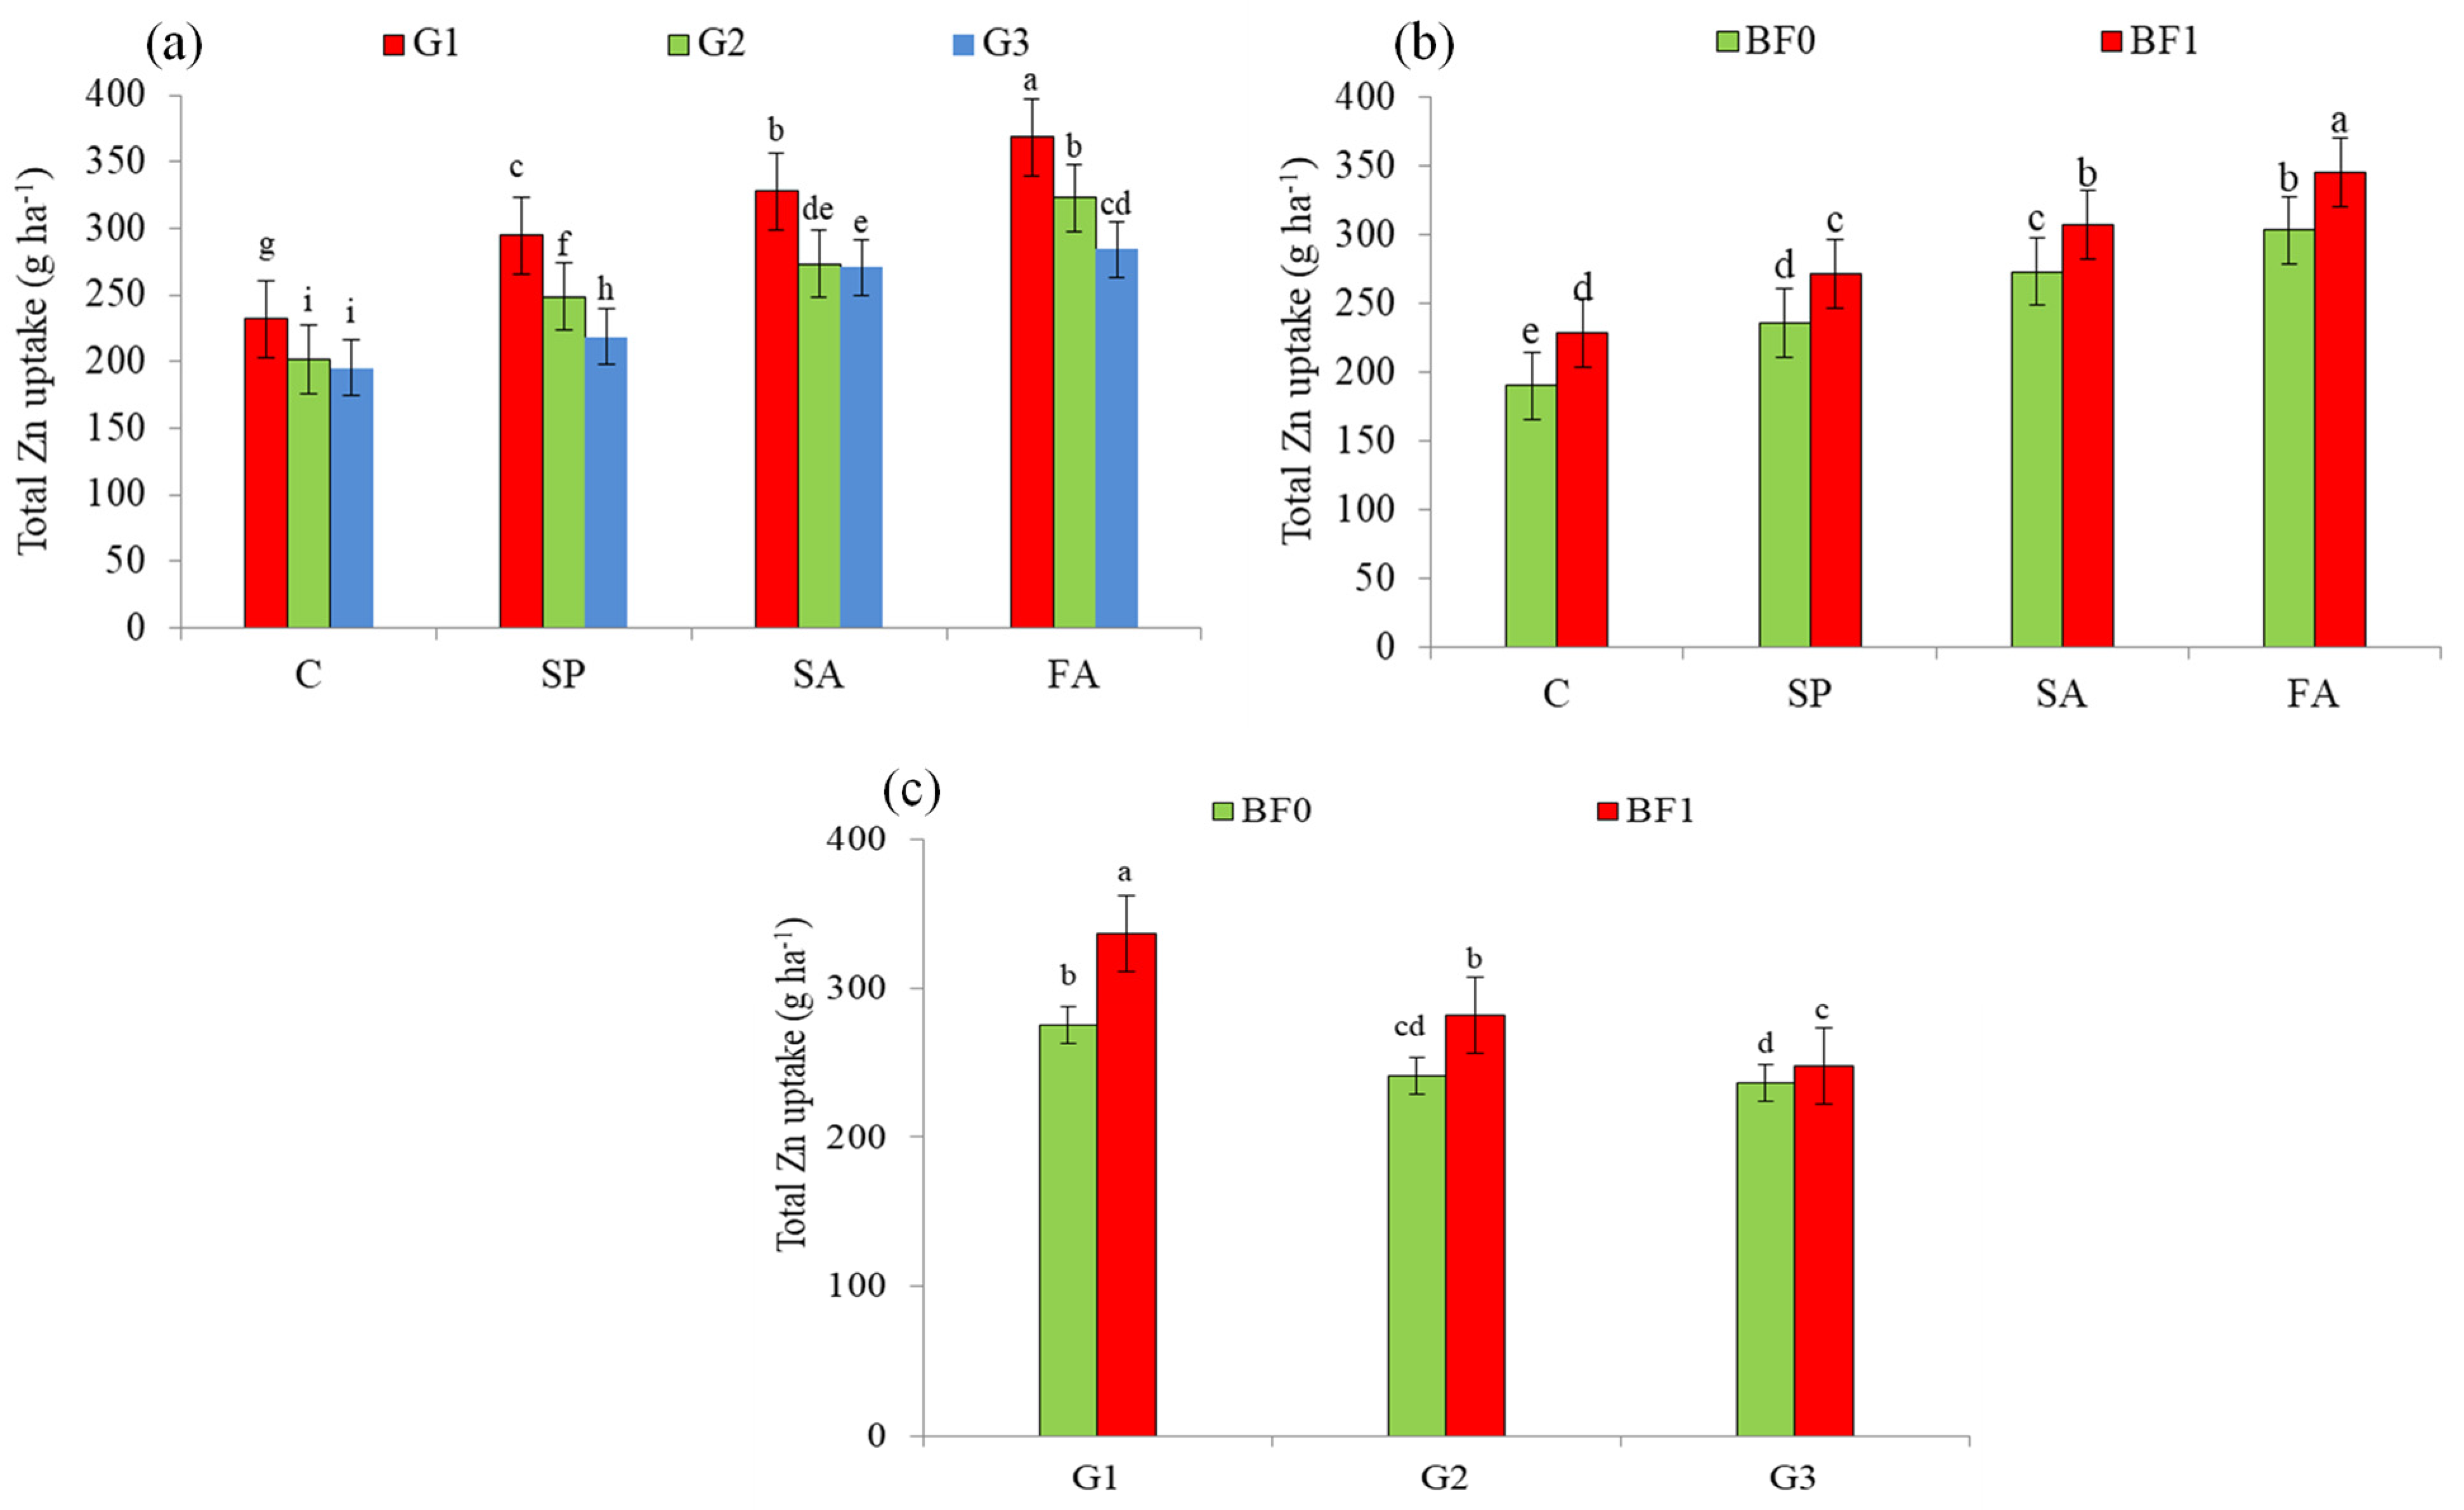
3.2. Grain, Straw and Total Zn Uptake g ha−1

Genotypes, Zn application methods, and ZSB enhanced significantly the grain and straw Zn uptake in wheat (Table 2). Significant interactions were observed for grain Zn uptake (G × AM, G × ZSB, G × AM × ZSB, Y × AM, Y × G × AM, and Y × AM × ZSB) (Figure 4) and significant interactions were found (G × AM, G × ZSB, G × AM × ZSB, and Y × G × AM) (Figure 5) for straw Zn uptake. The grain Zn uptake varied significantly among different wheat genotypes, the mean values for grain Zn uptake were determined for each genotype, and the results show that TRB-72-311 had the highest mean uptake, followed by TRB-89-348 and PS-19. Among the application methods, the highest mean grain Zn uptake was observed in the ‘Zn Foliar sprays at 0.5%’ treatment, followed by the ‘Zn soil Zn applied at the rate of 10 kg ha−1’ method and the ‘Zn seed priming at 0.5%’ approaches. In contrast, the ‘no Zn application’ treatment showed the lowest mean grain Zn uptake. Overall, the average grain Zn uptake for the ‘With ZSB’ treatment was notably higher than the average grain Zn uptake for the ‘Without ZSB’ treatment over the two years.
Straw Zn uptake among the genotypes, TRB-72-311 had higher straw Zn uptake than TRB-89-348 and PS-19 in both years. Among the application methods, the highest straw Zn uptake was observed in the Zn foliar spraying at 0.5% treatment. The Zn soil Zn applied at the rate of 10 kg ha−1 treatment had a slightly higher straw Zn uptake. Comparatively, the Zn seed priming at the 0.5% method exhibited comparatively lower straw Zn uptake. However, lowest straw Zn uptake was observed in the no Zn application treatment in both years. The straw Zn uptake was lower in without ZSB, whereas with the application of ZSB, the average straw Zn uptake increased in both years.
The study investigated the influence of wheat genotypes, Zn application methods, and ZSB on total Zn uptake and phytic acid content in wheat (Table 3). The results reveal significant interactions for total Zn uptake in the following cases: G × AM, G × ZSB, G × AM × ZSB, and Y × G × AM (Figure 6). For phytic acid content, significant interactions were observed only between G × AM (Figure 7). However, some interactions did not show significant effects. TRB-72-311 had the highest total uptake, followed by TRB-89-348, and PS-19 had the lowest total uptake in both years. The application method with no Zn application resulted in the lowest total Zn uptake, while Zn seed priming at 0.5% increased the total uptake slightly. Soil-applied Zn at 10 kg ha−1 further increased the total Zn uptake, and Zn foliar spraying at 0.5% showed the highest total uptake in both years. Similarly, With ZSB, there was a higher total Zn uptake than without ZSB in both years.

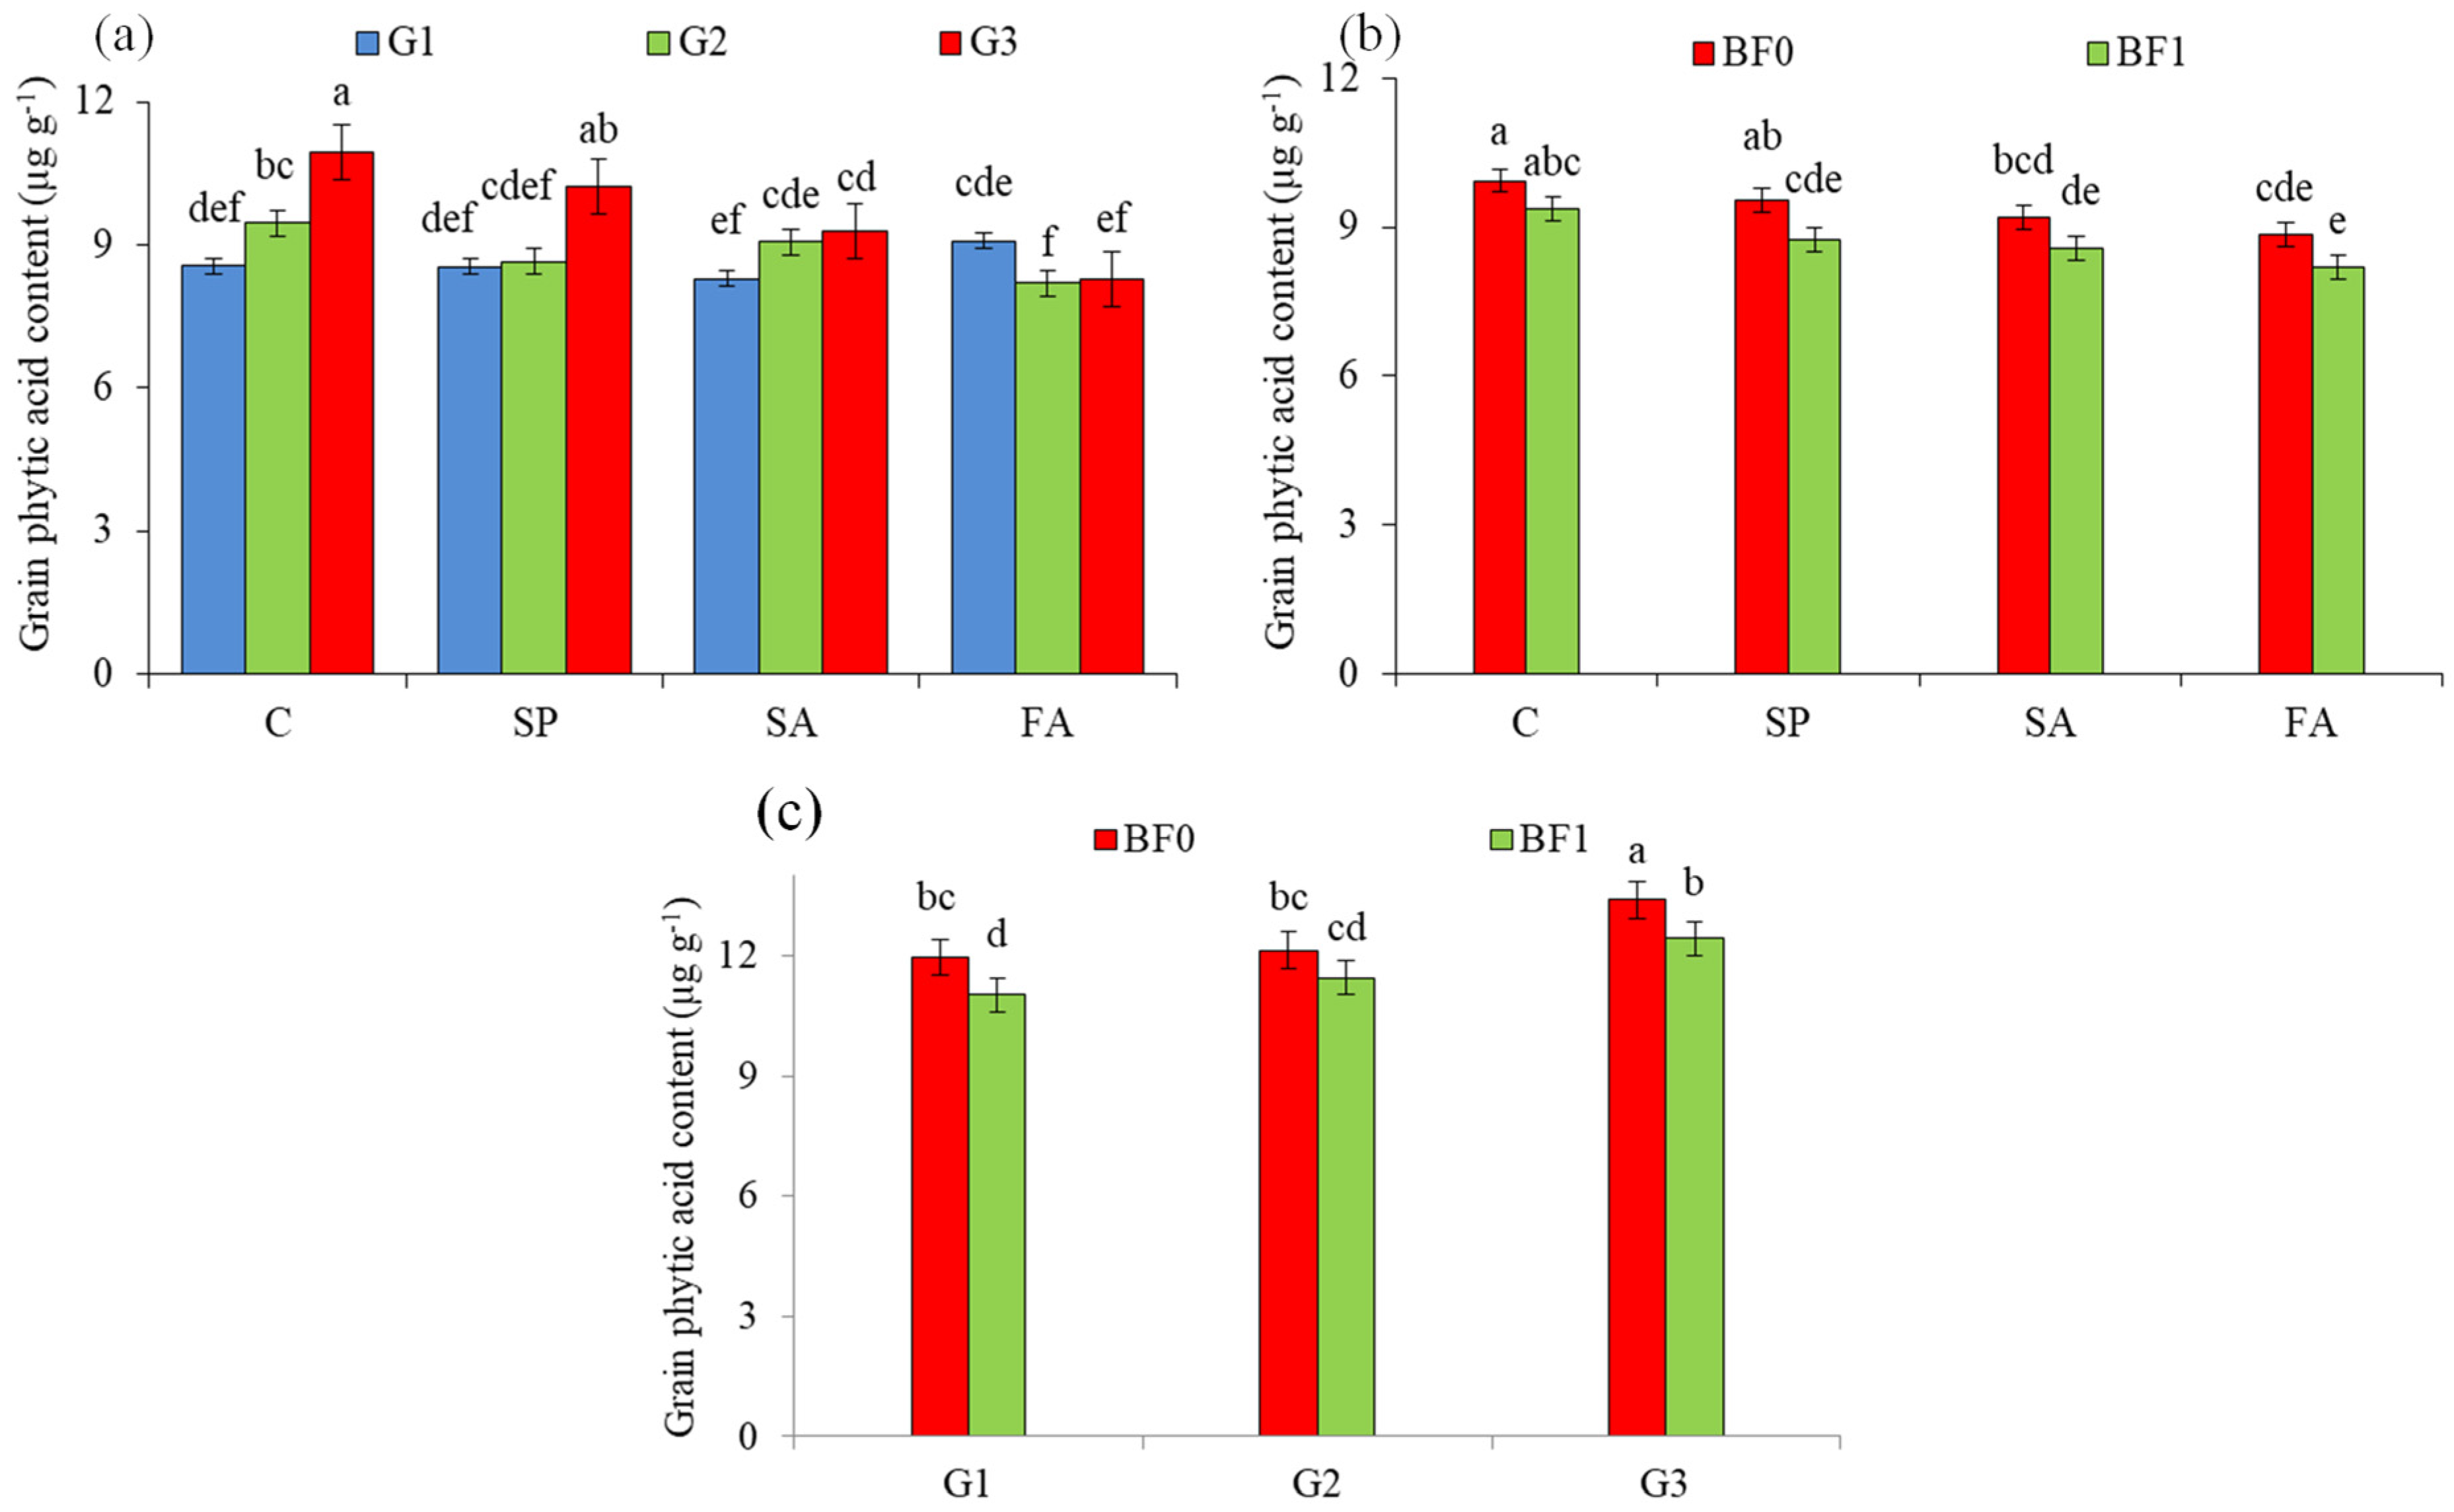
3.3. Grain Phytic Acid µg g−1

The phytic acid content of wheat grain significantly improved due to the wheat genotypes, Zn fertilization, and ZSB application (Table 3). In the first year, 2021–22, TRB-72-311 exhibited the lowest phytic acid content, TRB-89-348 had a higher content, and PS-19 showed the highest content. This trend was similarly observed in the subsequent year, 2022–23. The highest mean phytic acid content was observed in the treatment with no Zn application. The 0.5% Zn seed priming method exhibited slightly lower phytic acid content. The application of Zn to the soil at a rate of 10 kg ha−1 further decreased grain phytic acid content. However, the Zn foliar spraying at a 0.5% concentration method showed the lowest phytic acid content in both years. Likewise, the mean phytic acid content for wheat was higher without the application of ZSB and lower with ZSB application.

3.4. Grains Yield t ha−1

Grains yield of wheat was significantly affected by genotypes, Zn fertilization, and ZSB application. Significant interactions were observed for grain yield (Table 4). These interactions included G × AM, G × ZSB, G × AM × ZSB, Y × G, Y × AM, Y × G × AM, Y × ZSB, Y × AM × ZSB, and Y × G × AM × ZSB (Figure 8). Among the wheat genotypes, the TRB-72-311 synthetic hexaploid genotype yielded the highest grain yield in both years, with a significant increase in mean (17.7%), followed by the TRB-89-348 advanced line, which showed a slight but significant increase in mean (5.1%) compared to the Pirsabak-19-approved variety. Regarding the Zn application methods, the foliar application method significantly increased wheat grain yield by mean (28.8%), followed by the soil applied 10 kg Zn ha−1 and 0.5% Zn seed priming, which led to increases in mean (19.5%) and (10.7%), respectively, over the no Zn application approach in both years. The presence of ZSB enhanced the mean grain yield by mean (8.2%) compared to its absence.

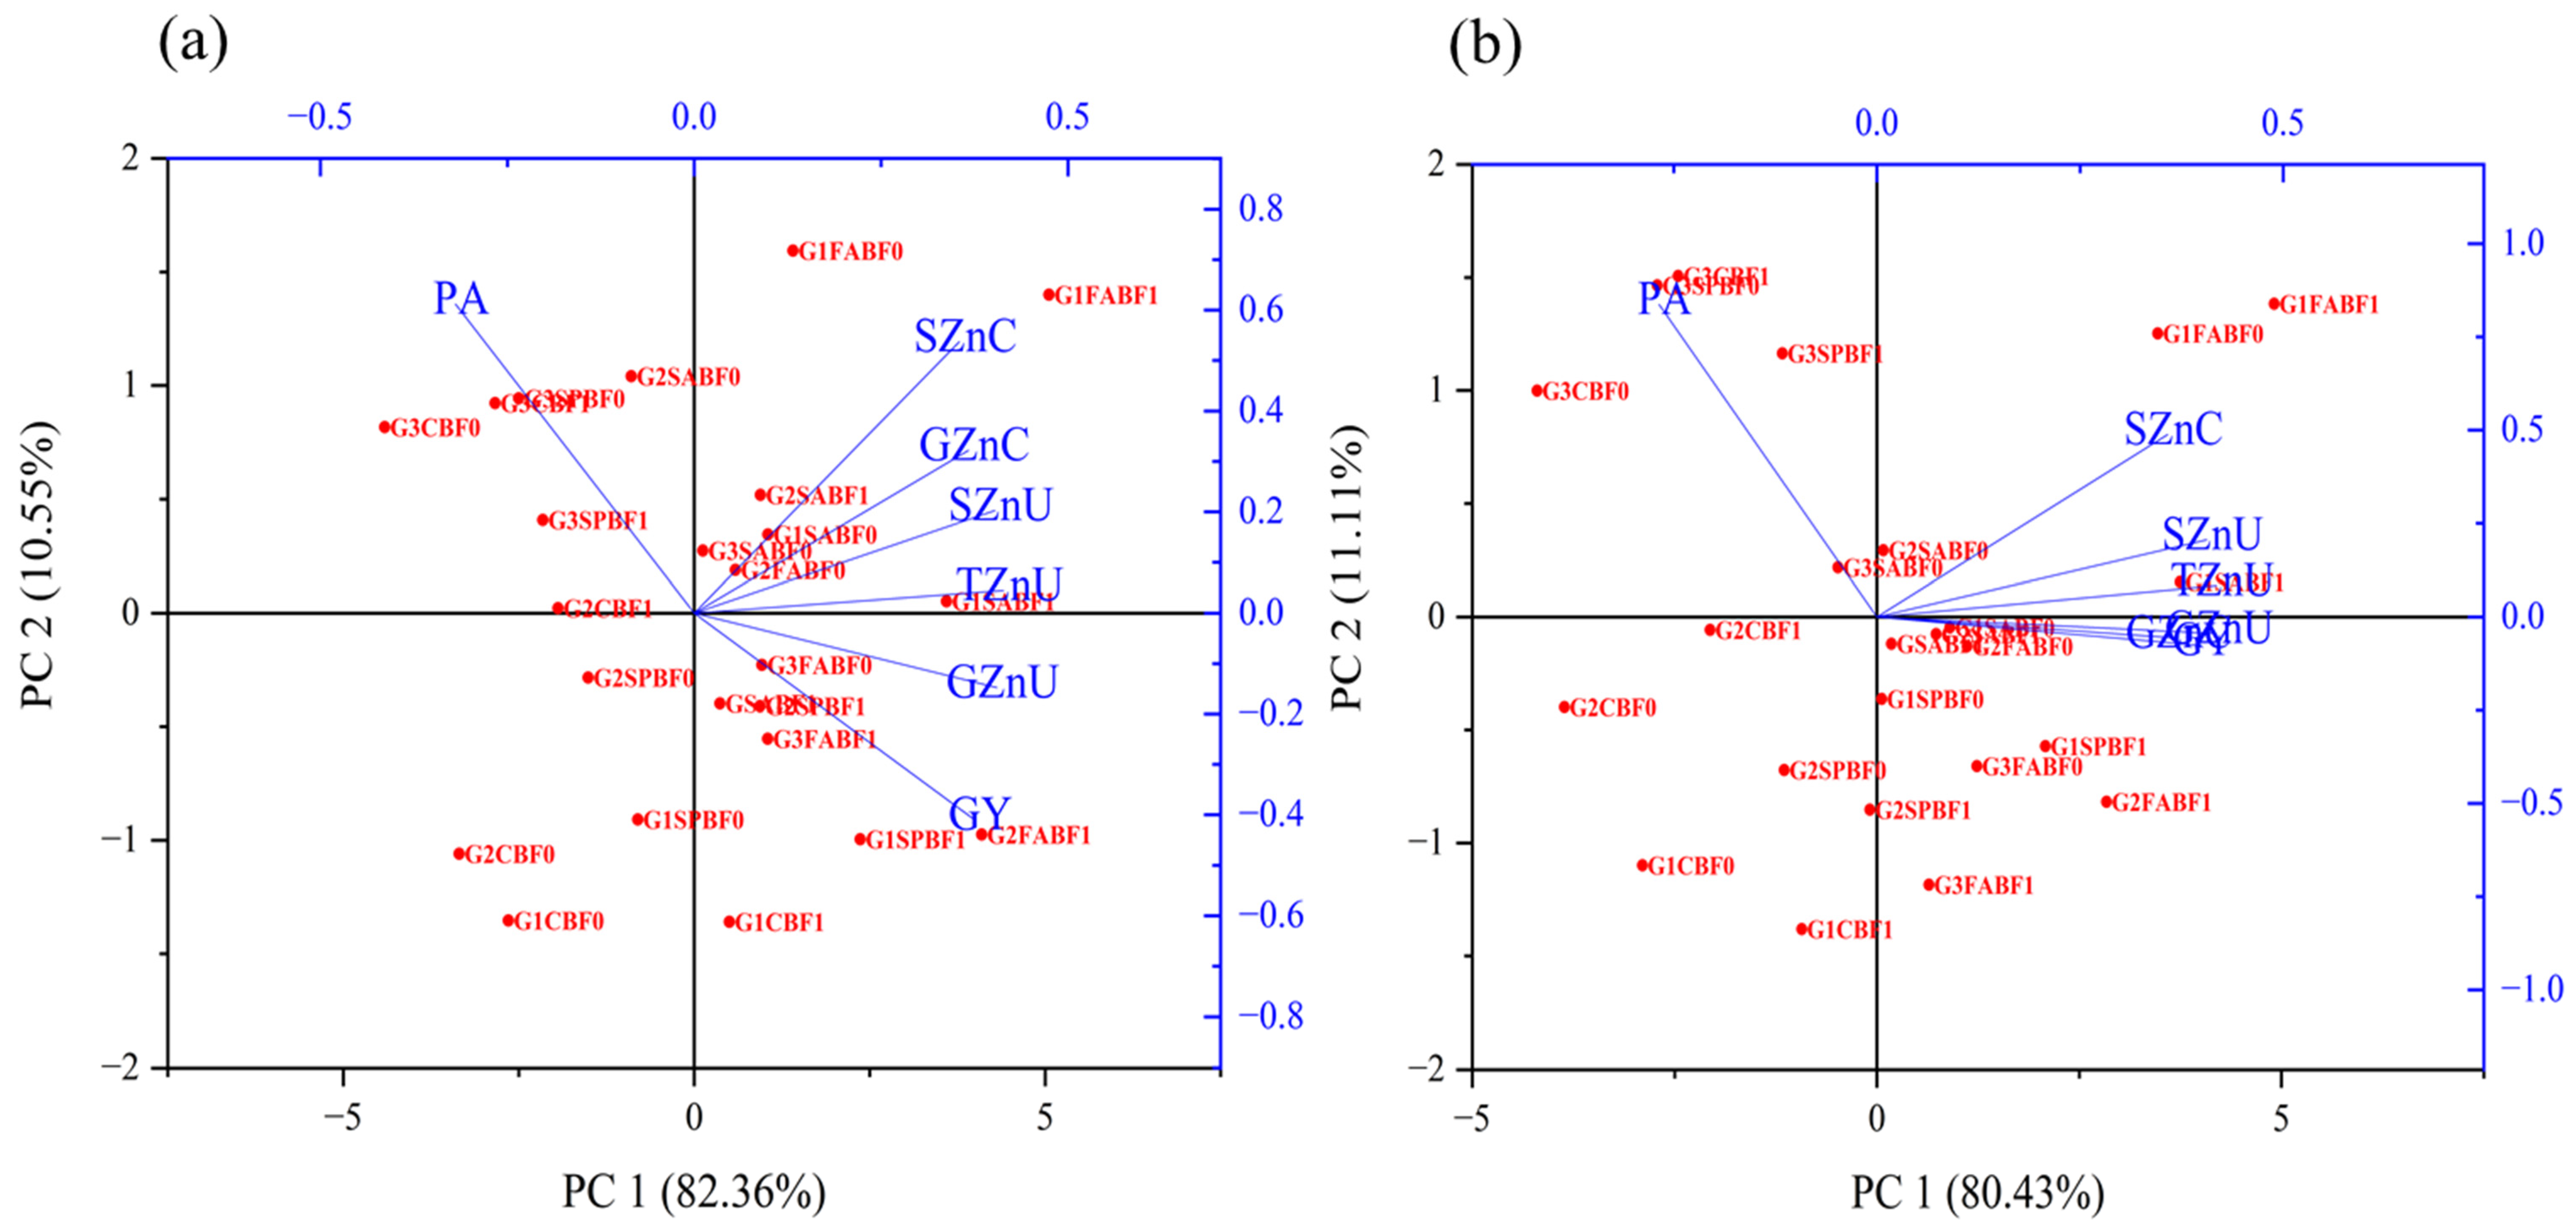
3.5. Correlations and PCA

The results of the correlation analysis reveal a significant strong correlation between various Zn-related variables in the crops different in colors and size, the largest circle revealed the strongest correlation among the variables (Figure 9). Grain Zn content exhibited strong correlation with grain Zn uptake, total Zn uptake, and grain yield. Furthermore, straw Zn content displayed strong positive correlations with straw Zn uptake, and total Zn uptake. Moreover, grain Zn uptake demonstrated strong positive correlations with grain Zn content, straw Zn uptake, total Zn uptake, and grain yield. Additionally, straw Zn uptake shows a significant positive correlation with straw Zn content and total Zn uptake. Finally, grain yield and the Zn content in grain and straw exhibited a significantly low negative correlation with grain phytic acid content. However, the grain, straw, and total Zn uptake showed a highly significant negative correlation with grain phytic acid content. The results of the principal component analysis (PCA) reveal important patterns in the dataset. PC1, the first principal component, is primarily influenced positively by variables such as grain Zn content, straw Zn content, grain Zn uptake, straw Zn uptake, total Zn uptake, and grain yield. This suggests that these variables are positively correlated and contribute significantly to the primary source of variation in the data. On the other hand, PC1 is negatively influenced by grain phytic acid, indicating an inverse relationship with the other variables. PC2, the second principal component, is positively influenced by straw Zn content, straw Zn uptake, and negatively influenced by grain Zn content and grain yield. These findings can help researchers understand the underlying relationships and structure within the dataset, which can be valuable for further analysis and decision-making in the context of the studied factors. Biplot further revealed that the greater variance is explained by PC1 (82.36%) and PC2 (10.55%) in first year and PC1 (80.43%) and PC2 (11.11%) in second year (Figure 10a,b). Moreover, high PC1 and PC2 revealed that the good quality of relation for most of the variation in Zn content and uptake under the study is due to treatments.

3.6. Zn Use Efficiency

Zn use efficiencies of wheat under various Zn application methods were shown for the years 2021–22 and 2022–23 (Table 5). Zn foliar spraying at 0.5% significantly exhibited the highest agronomic efficiency, followed by Zn seed priming. Zn soil application at 10 kg ha−1 had the lowest agronomic efficiency in both years. The physiological efficiency of Zn treatments in wheat varied during the years 2021–22 and 2022–23. Soil Zn application at the rate 10 kg ha−1 demonstrated significantly the highest physiological efficiency in both years; however, Zn foliar spray at 0.5% and Zn seed priming at 0.5% showed lower physiological efficiency and they were at par except in 2022–23. The apparent recovery efficiency of treatments for Zn utilization in wheat varied during the years 2021–22 and 2022–23. Zn foliar spraying at 0.5% significantly demonstrated the highest efficiency, followed by Zn seed priming at 0.5% showed slightly lower. Zn soil application at 10 kg ha−1 had the lowest apparent recovery efficiency in both years (Table 5). The partial factor productivity of treatments for Zn utilization in wheat varied during both years (Table 5). The 2021–22 year of experiment Zn seed priming at 0.5% significantly exhibited the maximum partial factor productivity, followed by Zn foliar spraying at 0.5%, but Zn soil applied at 10 kg ha−1 had the lowest efficiency of partial factor productivity. In the 2022–23 year of the experiment, Zn foliar spray at 0.5% produced significantly the highest partial factor productivity, followed by Zn seed priming at 0.5%, and the lowest partial factor productivity was produced by Zn soil applied at 10 kg ha−1 in wheat.

4. Discussion

The experiments supported the hypothesis that the genotypes, Zn fertilization, along with ZSB would enhance the grain and straw Zn content, Zn uptake, and Zn use efficiency and the genetic differences among wheat genotypes contribute to significant variations in grain and straw Zn content (Table 1) (Figure 2 and Figure 3). Among the test genotypes, TRB-72-311 showed the highest grain and straw Zn content, followed by TRB-89-348 as compared to PS-19. TRB-72-311 had 3.5% higher Zn content in grain and 7.8% in straw than PS-19, which accumulated a comparatively lesser amount of Zn in grain and straw while TRB-89-348 was approximately 1.3% higher in grain and 2.0% in straw. Zn transporters in wheat genotypes differ, affecting Zn uptake and accumulation in grains. ENA1 and ENA2 genes play a crucial role in Zn transport and uptake through efflux transporters of nicotianamine; identification of phytosiderophore efflux transporters revealed the final piece in the molecular machinery of iron acquisition in grass plants [34]. Ref. [35] also reported similar genotypic variation in the translocation and accumulation of Zn in wheat, attributed to genetic variation in the plant. Similarly, Foliar spraying at 0.5% resulted in the highest grain and straw Zn content by mean 17.8% and 23.2%, respectively, as compared to control due to its efficient and rapid uptake. Soil application at 10 kg ha−1 and seed priming increased grain and straw Zn content by mean approximately 12.7%, 18.3%, 9.3%, and 10.0%, respectively, compared to the control. The higher Zn content in plants from foliar, soil applied, and seed priming methods compared to the control is due to their efficient uptake mechanisms. Foliar spraying enables rapid Zn absorption through the leaves. Soil application and seed priming provide a sustained supply of Zn, enhancing root uptake. Foliar Zn application increases Zn availability during critical growth stages, resulting in greater Zn accumulation in the wheat and rice grains [36,37,38]. Moreover, ZSB play a vital role, with their presence increasing grain Zn content by around 1.78 µg g−1 and 5.62%. The increase in Zn levels in wheat is attributed to the facilitation of nutrient accessibility by ZSB through various mechanisms, including the release of nutrients fixed in the soil, reduction in soil pH, and the production of specific hormones [27,39,40].
The results present the importance of considering various factors that influence Zn uptake in wheat (Table 2) (Figure 4, Figure 5 and Figure 6). The study observed complex interactions between different variables, emphasizing the need for comprehensive agricultural practices and crop management strategies to improve Zn uptake in wheat crops. Notably, the grain, straw, and total Zn uptake varied significantly among different wheat genotypes, indicating genetic differences in Zn absorption and utilization. Compared to the PS-19, TRB-72-311 showed approximately 21.79% higher grain, 31.0% higher straw, and 26.2% higher total Zn uptake. Similarly, TRB-89-348 exhibited 6.56% higher grain, 9.4% higher straw, and 7.95% higher total Zn uptake. These differences in Zn uptake could be attributed to the genetic traits and characteristics of each genotype, resulting in superior Zn accumulation in both grain and straw [28]. Significant increases in grain, straw, and total Zn uptake compared to the control were observed with different application methods, influenced by factors such as uptake mechanism, timing, nutrient mobility, soil conditions, and genotype specificity. The utilization of Zn fertilizer leads to a substantial improvement in Zn accessibility, thereby promoting increased absorption of Zn and enhancing the uptake of Zn by plants [25,41,42]. In particular, Zn foliar spraying at 0.5% resulted in a 51.60% increase in grain Zn uptake, 59.15% increase in straw Zn uptake, and 55.0% increase in total Zn uptake. Similarly, Zn soil applied at 10 kg ha−1 exhibited 34.34% higher grain, 43.1% higher straw, and 38.57% higher total Zn uptake. Zn seed priming at 0.5% produced 21.0% higher grain, 21.15% higher straw, and 21.16% higher total Zn uptake. These application methods enhanced Zn availability to the plants, leading to increased Zn accumulation in both grain and straw compared to the control [27,43,44]. The application of ZSB significantly increased the grain, straw, and total Zn uptake of wheat as compared to without the application of ZSB. The results indicate that the presence of ZSB increased 14.43%, 15.81%, and 15.02% grain, straw, and total Zn uptake compared to the absence of ZSB. This demonstrates the beneficial effect of ZSB in enhancing Zn uptake and accumulation in both grain and straw, contributing to overall higher Zn content in the plant. The higher Zn uptake by the plant after ZnSB strain application resulted in enhanced microbial activity, potential soil pH reduction, and redistribution among Zn pools, leading to increased Zn availability for the crops [27,45,46]. Furthermore, ZSB application enhanced Zn uptake by improving nutrient cycling, transformation, and root morphology, resulting in increased Zn absorption in wheat grains [47,48]. Endophyte inoculation had nearly identical effects on both low and high Zn accumulating genotypes [49]. The variations in phytic acid content among different wheat genotypes, compared to PS-19, for TRB-72-311 had approximately a 10.95% lower mean phytic acid content, while TRB-89-348 had approximately an 8.68% lower mean phytic acid content (Table 3) (Figure 7). Phytic acid, though indigestible in humans, plays a crucial role in grain vitality and plant processes. It functions as a cation provider, a precursor to the cell wall, and stores energy and phosphorus within the grain. However, the high content of phytic acid in grains can reduce the availability of micronutrients such as Zn to humans, representing its only negative effect, and significant variation among wheat genotypes existed when subjected to agronomic Zn biofortification [50,51]. The results indicate that Zn application methods reduced phytic acid content in wheat compared to the control. Reduction percentages for seed priming at 0.5%, soil application at 10 kg ha−1, and Zn foliar spraying at 0.5% were 5.38%, 7.97%, and 11.70%, respectively. In this study, the reduction in phytic acid content might be attributed to changes in phosphorus (P) absorption from the soil and its translocation within the plant. The increase in bioavailable Zn could be linked to the decline in phytic acid. This decrease in phytic acid resulted in higher Zn content in the plant [52]. Foliar application of Zn enhances Zn bioavailability by reducing anti-nutrient presence in the grain, resulting in lower phytic acid content and improved Zn availability due to reduced phytate content [5,53]. These results indicate the beneficial impact of ZSB biofertilizer application on reducing phytic acid content in wheat. In the first year, the phytic acid content was reduced by approximately 7.84%, and in the second year, it was reduced by approximately 5.90%. Zn use efficiency in wheat significantly varied with the Zn application method (Table 5). We found that use efficiencies were higher with 0.5% concentration foliar spray. Foliar, seed priming, and soil application of Zn improved the availability of Zn and distribution of Zn to crops, which led to an increase in use efficiencies [54]. It is also clear that higher Zn rates expressed the lower Zn use efficiency with high Zn rate due to poor distribution and formation of unavailable products of Zn applied at high rates [5,55,56]. Moreover, Zn efficiencies improved through the application of both Zn and ZSB in chickpeas, while temporal nitrogen application enhanced nutrient use efficiencies in maize [57,58].

5. Conclusions

The improvements observed in grain and straw Zn content, Zn uptake in grain and straw, total Zn uptake, grain yield, along with traits related to Zn use efficiency, suggest that when wheat genotypes are subjected to Zn fertilization with ZSB application, they can enhance the bioavailability of Zn up to a certain threshold. The genotypes exhibited the most significant response to Zn fertilization at a 0.5% concentration in foliar spraying, 10 kg Zn ha−1 soil application, and 0.5% seed priming with the presence of ZSB when compared to without ZSB application in the control group. Additionally, this combination reduced wheat grain phytic acid. The strongest positive correlations were found in Zn-related traits, while negative correlations were observed between phytic acid and both Zn content and uptake. The TRB-72-311 synthetic hexaploid genotype, when subjected to 0.5% foliar Zn spray along with ZSB application, exhibited higher grain yield, maximum Zn content in both grain and straw, increased grain, straw, and total Zn uptake, and lower grain phytic acid levels compared to the PS-19-approved variety without Zn application and ZSB application. Thus, we recommend the use of TRB-72-311 in conjunction with 0.5% foliar Zn application and ZSB to enhance crop Zn content, uptake, and use efficiency while reducing grain phytic acid content through Zn biofortification.

Author Contributions

A.K. (Azizullah Khalili) conducted the research study, compiled the data and completed the write-up. A.Q. helped in the preparation of the inoculum. A.Q. and A.K. (Ahlam Khalofah) helped in the analysis of data. A.Q., S.U.K. and I.U. supervised the research work. All authors have read and agreed to the published version of the manuscript.

Funding

This research received no external funding.

Data Availability Statement

The data presented in this study are available upon fair request from the corresponding authors.

Acknowledgments

The authors extend their appreciation to the Deanship of Scientific Research at King Khalid University for funding this work through large group Research Project under grant number RGP2/280/44.

Conflicts of Interest

The authors declare no conflict of interest.

References

  1. Fanzo, J. Healthy and sustainable diets and food systems: The key to achieving Sustainable Development Goal 2? Food Ethics 2019, 4, 159–174. [Google Scholar] [CrossRef]
  2. Biesalski, H.K. Obesity, vitamin D deficiency and old age a serious combination with respect to coronavirus disease-2019 severity and outcome. Curr. Opin. Clin. Nutr. Metab. Care 2021, 24, 18–24. [Google Scholar] [CrossRef] [PubMed]
  3. Abbaspour, N.; Hurrell, R.; Kelishadi, R. Review on iron and its importance for human health. J. Res. Med. Sci. Off. J. Isfahan Univ. Med. Sci. 2014, 19, 164. [Google Scholar]
  4. Krężel, A.; Maret, W. The biological inorganic chemistry of zinc ions. Arch. Biochem. Biophys. 2016, 611, 3–19. [Google Scholar] [CrossRef]
  5. Zulfiqar, U.; Hussain, S.; Ishfaq, M.; Matloob, A.; Ali, N.; Ahmad, M.; Alyemeni, M.N.; Ahmad, P. Zinc-induced effects on productivity, zinc use efficiency, and grain biofortification of bread wheat under different tillage permutations. Agronomy 2020, 10, 1566. [Google Scholar] [CrossRef]
  6. Manzeke, M.G.; Mtambanengwe, F.; Watts, M.J.; Hamilton, E.M.; Lark, R.M.; Broadley, M.R.; Mapfumo, P. Fertilizer management and soil type influence grain zinc and iron concentration under contrasting smallholder cropping systems in Zimbabwe. Sci. Rep. 2019, 9, 6445. [Google Scholar] [CrossRef]
  7. Prasad, A.S. Impact of the discovery of human zinc deficiency on health. J. Trace Elem. Med. Biol. 2014, 28, 357–363. [Google Scholar] [CrossRef]
  8. Alloway, B.J. Zn in Soil and Crop Nutrition, 2nd ed.; International Zinc Association (IZA) and International Fertilizer Association (IFA): Brussels, Belgium; Paris, France, 2008; p. 33. [Google Scholar]
  9. Bhatt, R.; Hossain, A.; Sharma, P. Zinc biofortification as an innovative technology to alleviate the zinc deficiency in human health: A review. Open Agric. 2020, 5, 176–187. [Google Scholar] [CrossRef]
  10. Singh, B.; Dheeravathu, S.N.; Usha, K. Micronutrient deficiency: A global challenge and physiological approach to improve grain productivity under low zinc availability. Plant Stress 2010, 4, 76–93. [Google Scholar]
  11. FAOSTAT. Food and Agriculture Organization of the United Nations FAOSTAT Database; FAOSTAT: Rome, Italy, 2021. [Google Scholar]
  12. Li, P.; Ma, B.; Palta, J.A.; Ding, T.; Cheng, Z.; Lv, G.; Xiong, Y. Wheat breeding highlights drought tolerance while ignores the advantages of drought avoidance: A meta-analysis. Eur. J. Agron. 2021, 122, 126196. [Google Scholar] [CrossRef]
  13. Rabieyan, E.; Alipour, H. NGS-based multiplex assay of trait-linked molecular markers revealed the genetic diversity of Iranian bread wheat landraces and cultivars. Crop Pasture Sci. 2021, 72, 173–182. [Google Scholar] [CrossRef]
  14. Rabieyan, E.; Bihamta, M.R.; Moghaddam, M.E.; Mohammadi, V.; Alipour, H. Genome-wide association mapping and genomic prediction of agronomical traits and breeding values in Iranian wheat under rain-fed and well-watered conditions. BMC Genom. 2022, 23, 831. [Google Scholar] [CrossRef]
  15. Rehman, A.; Farooq, M.; Ullah, A.; Nadeem, F.; Im, S.Y.; Park, S.K.; Lee, D.J. Agronomic biofortification of zinc in Pakistan: Status, benefits, and constraints. Front. Sustain. Food Syst. 2020, 4, 591–722. [Google Scholar] [CrossRef]
  16. Szerement, J.; Szatanik-Kloc, A.; Mokrzycki, J.; Mierzwa-Hersztek, M. Agronomic biofortification with Se, Zn, and Fe: An effective strategy to enhance crop nutritional quality and stress defense—A review. J. Soil Sci. Plant Nutr. 2022, 22, 1129–1159. [Google Scholar] [CrossRef]
  17. Velu, G.; Ortiz-Monasterio, I.; Cakmak, I.; Hao, Y.; Singh, R.Á. Biofortification strategies to increase grain zinc and iron concentrations in wheat. J. Cereal Sci. 2015, 59, 365–372. [Google Scholar] [CrossRef]
  18. Bashir, A.; Khan, Q.U.; Alem, A.; Hendi, A.A.; Zaman, U.; Khan, S.U.; ur Rehman, K.; Ali Khan, A.; Ullah, I.; Anwar, Y.; et al. Zinc and Potassium Fertilizer Synergizes Plant Nutrient Availability and Affects Growth, Yield, and Quality of Wheat Genotypes. Plants 2023, 12, 2241. [Google Scholar] [CrossRef] [PubMed]
  19. Yadav, A.K.; Seth, A.; Kumar, V.; Datta, A. Agronomic biofortification of wheat through proper fertilizer management to alleviate zinc malnutrition: A review. Commun. Soil Sci. Plant Anal. 2023, 54, 154–177. [Google Scholar] [CrossRef]
  20. Cakmak, I. Enrichment of cereal grains with zinc: Agronomic or genetic biofortification? Plant Soil 2008, 302, 1–17. [Google Scholar] [CrossRef]
  21. Jan, B.; Bhat, T.A.; Sheikh, T.A.; Wani, O.A.; Bhat, M.A.; Nazir, A.; Fayaz, S.; Mushtaq, T.; Farooq, A.; Wani, S.; et al. Agronomic bio-fortification of rice and maize with iron and zinc: A review. Int. Res. J. Pure Appl. Chem. 2020, 21, 28–37. [Google Scholar] [CrossRef]
  22. Ramzan, Y.; Hafeez, M.B.; Khan, S.; Nadeem, M.; Batool, S.; Ahmad, J. Biofortification with zinc and iron improves the grain quality and yield of wheat crop. Int. J. Plant Prod. 2020, 14, 501–510. [Google Scholar] [CrossRef]
  23. Nadeem, F.; Farooq, M.; Ullah, A.; Rehman, A.; Nawaz, A.; Naveed, M. Influence of Zn nutrition on the productivity, grain quality and grain biofortification of wheat under conventional and conservation rice–wheat cropping systems. Arch. Agron. Soil Sci. 2020, 66, 1042–1057. [Google Scholar] [CrossRef]
  24. Kalyani, S.F.; Siosemardeh, A.; Hosseinpanahi, F.; Jalali-Honarmand, S.; Ghobadi, M.E. Effect of seed priming on grain yield, protein content, and concentration of some nutrients in dryland wheat grain. Cereal Biotechnol. Biochem. 2022, 1, 87–99. [Google Scholar]
  25. Kumar, S.; Verma, G.; Dhaliwal, S.S.; Sharma, V. Influence of zinc fertilization levels and frequencies on crop productivity, zinc uptake and buildup of soil zinc in maize–wheat system. J. Plant Nutr. 2022, 45, 1774–1785. [Google Scholar] [CrossRef]
  26. Rasul, M.; Yasmin, S.; Suleman, M.; Zaheer, A.; Reitz, T.; Tarkka, M.T.; Islam, E.; Mirza, M.S. Glucose dehydrogenase gene containing phosphobacteria for biofortification of Phosphorus with growth promotion of rice. Microbiol. Res. 2019, 223, 1–12. [Google Scholar] [CrossRef] [PubMed]
  27. Khalid, S.; Amanullah; Ahmed, I. Enhancing Zinc Biofortification of Wheat through Integration of Zinc, Compost, and Zinc-Solubilizing Bacteria. Agriculture 2022, 12, 968. [Google Scholar] [CrossRef]
  28. Rehman, A.; Farooq, M.; Naveed, M.; Nawaz, A.; Shahzad, B. Seed priming of Zn with endophytic bacteria improves the productivity and grain biofortification of bread wheat. Eur. J. Agron. 2018, 94, 98–107. [Google Scholar] [CrossRef]
  29. Ullah, A.; Farooq, M.; Nadeem, F.; Rehman, A.; Hussain, M.; Nawaz, A.; Naveed, M. Zinc application in combination with zinc solubilizing Enterobacter sp. MN17 improved productivity, profitability, zinc efficiency, and quality of desi chickpea. J. Soil Sci. Plant Nutr. 2020, 20, 2133–2144. [Google Scholar] [CrossRef]
  30. Wright, R.J.; Stuczynski, T. Atomic absorption and flame emission spectrometry. Methods Soil Anal. Part 3 Chem. Methods 1996, 5, 65–90. [Google Scholar]
  31. Haug, W.; Lantzsch, H.J. Sensitive method for the rapid determination of phytate in cereals and cereal products. J. Sci. Food Agric. 1983, 34, 1423–1426. [Google Scholar] [CrossRef]
  32. Shivay, Y.S.; Kumar, D. A Practical Manual of Field Crops Management; Division of Agronomy, Indian Agricultural Research Institute: New Delhi, India, 2008; 120p. [Google Scholar]
  33. Fageria, N.K. The Use of Nutrients in Crop Plants; CRC Press: Boca Raton, FL, USA, 2009. [Google Scholar]
  34. Nozoye, T.; Nagasaka, S.; Kobayashi, T.; Takahashi, M.; Sato, Y.; Sato, Y.; Uozumi, N.; Kobayashi, T.; Nishizawa, N.K. Iron uptake, translocation, and regulation in higher plants. Annu. Rev. Plant Biol. 2012, 63, 131–152. [Google Scholar]
  35. Ghasal, P.C.; Shivay, Y.S.; Pooniya, V.; Choudhary, M.; Verma, R.K. Response of wheat genotypes to zinc fertilization for improving productivity and quality. Arch. Agron. Soil Sci. 2017, 63, 1597–1612. [Google Scholar] [CrossRef]
  36. Khan, H.R.; McDonald, G.K.; Rengel, Z. Zn fertilization improves water use efficiency, grain yield and seed Zn content in chickpea. Plant Soil 2003, 249, 389–400. [Google Scholar] [CrossRef]
  37. Shivay, Y.S.; Prasad, R.; Singh, R.K.; Pal, M. Relative efficiency of zinc-coated urea and soil and foliar application of zinc sulphate on yield, nitrogen, phosphorus, potassium, zinc and iron biofortification in grains and uptake by basmati rice (Oryza sativa L.). J. Agric. Sci. 2015, 7, 161. [Google Scholar] [CrossRef]
  38. Paramesh, V.; Dhar, S.; Dass, A.; Kumar, B.; Kumar, A.; El-Ansary, D.O.; Elansary, H.O. Role of integrated nutrient management and agronomic fortification of zinc on yield, nutrient uptake and quality of wheat. Sustainability 2020, 12, 3513. [Google Scholar] [CrossRef]
  39. Maheshwari, D.K.; Kumar, S.; Maheshwari, N.K.; Patel, D.; Saraf, M. Nutrient availability and management in the rhizosphere by microorganisms. In Bacteria in Agrobiology: Stress Management; Springer: Berlin/Heidelberg, Germany, 2012; pp. 301–326. [Google Scholar]
  40. Naz, I.; Ahmad, H.; Khokhar, S.N.; Khan, K.; Shah, A.H. Impact of zinc solubilizing bacteria on zinc contents of wheat. Am. Euras. J. Agric. Environ. Sci 2016, 16, 449–454. [Google Scholar]
  41. Alloway, B.J. Soil factors associated with zinc deficiency in crops and humans. Environ. Geochem. Health 2009, 31, 537–548. [Google Scholar] [CrossRef]
  42. Zou, C.Q.; Zhang, Y.Q.; Rashid, A.; Ram, H.; Savasli, E.; Arisoy, R.Z.; Ortiz-Monasterio, I.; Simunji, S.; Wang, Z.G.; Sohu, V.; et al. Biofortification of wheat with zinc through zinc fertilization in seven countries. Plant Soil 2012, 361, 119–130. [Google Scholar] [CrossRef]
  43. Wu, C.Y.; Lu, L.L.; Yang, X.E.; Feng, Y.; Wei, Y.Y.; Hao, H.L.; Stoffella, P.J.; He, Z.L. Uptake, translocation, and remobilization of zinc absorbed at different growth stages by rice genotypes of different Zn densities. J. Agric. Food Chem. 2010, 58, 6767–6773. [Google Scholar] [CrossRef]
  44. Li, M.; Yang, X.W.; Tian, X.H.; Wang, S.X.; Chen, Y.L. Effect of nitrogen fertilizer and foliar zinc application at different growth stages on zinc translocation and utilization efficiency in winter wheat. Cereal Res. Commun. 2014, 42, 81–90. [Google Scholar] [CrossRef]
  45. Ramesh, A.; Sharma, S.K.; Sharma, M.P.; Yadav, N.; Joshi, O.P. Inoculation of zinc solubilizing Bacillus aryabhattai strains for improved growth, mobilization and biofortification of zinc in soybean and wheat cultivated in Vertisols of central India. Appl. Soil Ecol. 2014, 73, 87–96. [Google Scholar] [CrossRef]
  46. Abaid-Ullah, M.; Nadeem, M.; Hassan, M.; Ganter, J.; Muhammad, B.; Nawaz, K.; Sessitsch, A.; Hafeez, F.Y. Plant growth promoting rhizobacteria: An alternate way to improve yield and quality of wheat (Triticum aestivum). Int. J. Agric. Biol. 2015, 17, 51–60. [Google Scholar]
  47. Rana, A.; Joshi, M.; Prasanna, R.; Shivay, Y.S.; Nain, L. Biofortification of wheat through inoculation of plant growth promoting rhizobacteria and cyanobacteria. Eur. J. Soil Biol. 2012, 50, 118–126. [Google Scholar] [CrossRef]
  48. Wang, C.; Yuan, N.; Pei, Y. Effect of pH on metal lability in drinking water treatment residuals. J. Environ. Qual. 2014, 43, 389–397. [Google Scholar] [CrossRef] [PubMed]
  49. Singh, D.; Rajawat, M.V.S.; Kaushik, R.; Prasanna, R.; Saxena, A.K. Beneficial role of endophytes in biofortification of Zn in wheat genotypes varying in nutrient use efficiency grown in soils sufficient and deficient in Zn. Plant Soil 2017, 416, 107–116. [Google Scholar] [CrossRef]
  50. Erdal, I.; Yilmaz, A.; Taban, S.; Eker, S.; Torun, B.; Cakmak, I. Phytic acid and phosphorus concentrations in seeds of wheat cultivars grown with and without zinc fertilization. J. Plant Nutr. 2002, 25, 113–127. [Google Scholar] [CrossRef]
  51. Velu, G.; Singh, R.P.; Crespo-Herrera, L.; Juliana, P.; Dreisigacker, S.; Valluru, R.; Stangoulis, J.; Sohu, V.S.; Mavi, G.S.; Mishra, V.K.; et al. Genetic dissection of grain zinc concentration in spring wheat for mainstreaming biofortification in CIMMYT wheat breeding. Sci. Rep. 2019, 8, 13526. [Google Scholar] [CrossRef]
  52. Huang, C.; Barker, S.J.; Langridge, P.; Smith, F.W.; Graham, R.D. Zinc deficiency up-regulates expression of high-affinity phosphate transporter genes in both phosphate-sufficient and-deficient barley roots. Plant Physiol. 2000, 124, 415–422. [Google Scholar] [CrossRef]
  53. Cakmak, I.; Kalayci, M.; Kaya, Y.; Torun, A.A.; Aydin, N.; Wang, Y.; Arisoy, Z.; Erdem, H.; Yazici, A.; Gokmen, O.; et al. Biofortification and localization of zinc in wheat grain. J. Agric. Food Chem. 2010, 58, 9092–9102. [Google Scholar] [CrossRef]
  54. Zhang, R.; Zhang, H.; Tu, C.; Hu, X.; Li, L.; Luo, Y.; Christie, P. Phytotoxicity of ZnO nanoparticles and the released Zn (II) ion to corn (Zea mays L.) and cucumber (Cucumis sativus L.) during germination. Environ. Sci. Pollut. Res. 2015, 22, 11109–11117. [Google Scholar] [CrossRef]
  55. Genc, Y.; McDonald, G.K.; Graham, R.D. Critical deficiency concentration of zinc in barley genotypes differing in zinc efficiency and its relation to growth responses. J. Plant Nutr. 2002, 25, 545–560. [Google Scholar] [CrossRef]
  56. Fageria, N.K.; Moreira, A. The role of mineral nutrition on root growth of crop plants. Adv. Agron. 2011, 110, 251–331. [Google Scholar]
  57. Khalili, A.; Dhar, S.; Dass, A.; Mukhar, A.F.; Eldo, V. Agronomic indices of nitrogen use efficiency and maize yield response to various rates, time of application and their interaction effect in Kandahar region of Afghanistan. Ann. Agric. Res. New Ser. 2018, 39, 347–353. [Google Scholar]
  58. Ullah, A.; Farooq, M.; Hussain, M. Improving the productivity, profitability and grain quality of kabuli chickpea with co-application of zinc and endophyte bacteria Enterobacter sp. MN17. Arch. Agron. Soil Sci. 2020, 66, 897–912. [Google Scholar] [CrossRef]
Figure 1. Agro-meteorological conditions during winter seasons 2021–2022 and 2022–2023.
Agronomy 13 02677 g001
Figure 2. Interaction effects of genotypes and Zn application methods (a), Zn application methods and ZSB (b), and ZSB and genotype (c) on grain Zn content. The data represent the replicated mean with standard error bar, and the different letters within columns indicate significant differences at p ≤ 0.05, as determined by the least significant difference test and treatment: G1; TRB-72-311; G2: TRB-89-348; G3: Pirsabak-19; C: control; SP: seed priming of Zn at 0.5% concentration; SA: soil applied Zn at the rage of 10 kg ha−1; FA: foliar applied Zn at 0.5% concentration; BF0: without ZSB; and BF1: with ZSB.
Agronomy 13 02677 g002
Figure 3. Interaction effects of genotypes and Zn application methods (a), Zn application methods and ZSB (b), and ZSB and genotypes (c) on straw Zn content. The data represent the replicated mean with the standard error bar, and the different letters within columns indicate significant differences at p ≤ 0.05, as determined by the least significant difference test and treatment: G1; TRB-72-311; G2: TRB-89-348; G3: Pirsabak-19; C: control; SP: seed priming of Zn at 0.5% concentration; SA: soil applied Zn at the rate of 10 kg ha-1; FA: foliar applied Zn at 0.5% concentration; BF0: without ZSB; and BF1: with ZSB.
Agronomy 13 02677 g003
Figure 4. Interaction effects of genotypes and Zn application methods (a), Zn application methods and ZSB (b), ZSB, and genotype (c) on grain Zn uptake. The data represent the replicated mean with the standard error bar, and the different letters within columns indicate significant differences at p ≤ 0.05, as determined by the least significant difference test and treatment: G1; TRB-72-311; G2: TRB-89-348; G3: Pirsabak-19; C: control; SP: seed priming of Zn at 0.5% concentration; SA: soil applied Zn at the rate of 10 kg ha−1; FA: foliar applied Zn at 0.5% concentration; BF0: without ZSB; and BF1: with ZSB.
Agronomy 13 02677 g004
Figure 5. Interaction effects of genotypes and Zn application methods (a), Zn application methods and ZSB (b), and ZSB and genotype (c) on straw Zn uptake. The data represent the replicated mean with standard error bar, and the different letters within columns indicate significant differences at p ≤ 0.05, as determined by the least significant difference test and treatment: G1; TRB-72-311; G2: TRB-89-348; G3: Pirsabak-19; C: control; SP: seed priming of Zn at 0.5% concentration; SA: soil applied Zn at the rate of 10 kg ha−1; FA: foliar applied Zn at 0.5% concentration; BF0: without ZSB; and BF1: with ZSB.
Agronomy 13 02677 g005
Figure 6. Interaction effects of genotypes and Zn application methods (a), Zn application methods and ZSB (b), and ZSB and genotype (c) on total Zn uptake. The data represent the replicated mean with the standard error bar, and the different letters within columns indicate significant differences at p ≤ 0.05, as determined by the least significant difference test and treatment: G1; TRB-72-311; G2: TRB-89-348; G3: Pirsabak-19; C: control; SP: seed priming of Zn at 0.5% concentration; SA: soil applied Zn at the rate of 10 kg ha−1; FA: foliar applied Zn at 0.5% concentration; BF0: without ZSB; and BF1: with ZSB.
Agronomy 13 02677 g006
Figure 7. Interaction effects of genotypes and Zn application methods (a), Zn application methods and ZSB (b), and ZSB and genotype (c) on phytic acid. The data represent the replicated mean with the standard error bar, and the different letters within columns indicate significant differences at p ≤ 0.05, as determined by the least significant difference test and treatment: G1; TRB-72-311; G2: TRB-89-348; G3: Pirsabak-19; C: control; SP: seed priming of Zn at 0.5% concentration; SA: soil applied Zn at the rate of 10 kg ha−1; FA: foliar applied Zn at 0.5% concentration; BF0: without ZSB; and BF1: with ZSB.
Agronomy 13 02677 g007
Figure 8. Interaction effects of genotypes and Zn application methods (a), Zn application methods and ZSB (b), and ZSB and genotype (c) on grain yield. The data represent the replicated mean with standard error bar, and the different letters within columns indicate significant differences at p ≤ 0.05, as determined by the least significant difference test and treatment: G1; TRB-72-311; G2: TRB-89-348; G3: Pirsabak-19; C: control; SP: seed priming of Zn at 0.5% concentration; SA: soil applied Zn at the rate of 10 kg ha−1; FA: foliar applied Zn at 0.5% concentration; BF0: without ZSB; and BF1: with ZSB.
Agronomy 13 02677 g008
Figure 9. Pearson correlations method analysis between various Zn-related variables of wheat; correlation is significant at the 0.05 level. GZnC: grain Zn content; SZnC: straw Zn content; GZnU: grain Zn uptake; SZnU: straw Zn uptake; TZnU: total Zn uptake; PA: phytic acid of grain; and GY: grain yield.
Agronomy 13 02677 g009
Figure 10. PCA analysis showing correlation among different Zn-related traits variables for first year (a) and for second year (b) influenced by genotypes, Zn fertilization with ZSB, where G1; TRB-72-311; G2: TRB-89-348; G3: Pirsabak-19; C: control; SP: seed priming of Zn at 0.5% concentration; SA: soil applied Zn at the rate of 10 kg ha−1; FA: foliar applied Zn at 0.5% concentration; BF0: without ZSB; BF1: with ZSB; GZnC: grain Zn content; SZnC: straw Zn content; GZnU: grain Zn uptake; SZnU: straw Zn uptake; TZnU: total Zn uptake; PA: phytic acid of grain; and GY: grain yield.
Agronomy 13 02677 g010
Table 1. Wheat genotypes, Zn application methods, and ZSB influenced the grain and straw Zn content µg g−1 of wheat.
TreatmentGrain Zn ContentMeanStraw Zn ContentMean
YearYear
2021–222022–23 2021–222022–23
Genotypes (G)
G133.10 a
(4.1%)
33.17 a
(3.0%)
33.14 a
(3.5%)
24.84 a
(9.1%)
25.84 a
(6.5%)
25.34 a
(7.8 %)
G232.52 b
(2.2%)
32.27 b
(0.2%)
32.45 b
(1.4%)
23.53 b
(3.3%)
24.37 b
(0.5%)
23.95 b
(1.9%)
G331.81 c32.20 c32.01 c 22.77 c24.26 c23.51 c
LSD (0.05)0.560.470.36 0.600.600.46
Application methods (AM)
C29.72 d29.44 d29.58 d 20.75 d22.25 d21.50 d
SP32.18 c
(8.3%)
32.53 c (10.5%)32.35 c
(9.4%)
22.55 c
(8.7%)
24.76 c
(11.3%)
23.66 c (10.0%)
SA33.42 b (12.4%)33.26 b (13.0%)33.34 b
(12.7)
25.21 b (21.5%)25.64 b
(15.2%)
25.43 b (18.3%)
FA34.60 a (16.4%)35.11 a (19.3%)34.85 a (17.8%) 26.33 a (26.9%)26.63 a
(19.7%)
26.48 a (23.2%)
LSD (0.05)0.650.540.41 0.700.690.53
Biofertilizer (ZSB)
BF031.49 b31.79 b31.64 b 22.98 b23.96 b23.47 b
BF133.47 a
(6.3%)
33.38 a
(5.0%)
33.42 a
(5.6%)
24.45 a
(6.4%)
25.68 a
(7.2%)
25.06 a
(6.8%)
LSD (0.05)0.460.380.29 0.490.490.38
Year means32.48 a32.58 aNS 23.71 b24.82 a0.000
Interactions effectsp value p value p value p value
G × AM0.000Y × AMNSG × AM0.000Y × AM0.000
G × ZSB0.000Y × G × AM0.000G × ZSB0.045Y × G × AMNS
AM × ZSB0.000Y × ZSBNSAM × ZSB0.000Y × ZSBNS
G × AM × ZSBNSY × AM × ZSBNSG × AM × ZSB0.026Y × AM × ZSBNS
Y × GNSY × G × ZSB0.012Y × GNSY × G × ZSBNS
Y × G × AM × ZSB0.000 Y × G × AM × ZSBNS
The data represent the replicated mean, and the different letters within columns indicate significant differences at p ≤ 0.05, as determined by the least significant difference test (LSD). The data in parentheses indicate percentage increase in grain and straw Zn content in comparison to their control. Treatment: G1; TRB-72-311; G2: TRB-89-348; G3: Pirsabak-19; C: control; SP: seed priming of Zn at 0.5% concentration; SA: soil applied Zn at the rate of 10 kg ha−1; FA: foliar applied Zn at 0.5% concentration; BF0: without ZSB; and BF1: with ZSB; NS: not significant.
Table 2. Wheat genotypes, Zn application methods, and ZSB influenced the grain and straw Zn uptake g ha−1 of wheat.
TreatmentGrain Zn UptakeMean Straw Zn UptakeMean
Year Year
2021–222022–23 2021–222022–23
Genotypes (G)
G1147.06 a (20.0%)158.31 a (23.5%)152.68 a (21.8%) 148.50 a (32.0%)157.42 a
(30.0%)
152.96 a (31.0%)
G2131.58 b (7.4%)135.57 b
(5.7%)
133.58 b (6.6%) 123.66 b (9.9%)132.01 b
(9.0%)
127.83 b (9.4%)
G3122.50 c128.22 c125.36 c 112.49 c121.11 c116.80 c
LSD (0.05)4.584.333.06 5.853.933.80
Application methods (AM)
C110.10 d106.51 d108.30 d 96.07 d106.47 d101.27 d
SP129.42 c (17.5%)132.56 c (24.5%)130.99 c (21.0%) 116.50 c (21.3%)129.36 c
(21.5%)
122.93 c (21.4%)
SA139.66 b (26.8%)151.27 b (42.0%145.46 b (34.3%) 142.25 b (48.1%)147.67 b
(38.7%)
144.96 b (43.1%)
FA155.67 a (41.4%)172.46 a (61.9%)164.07 a (51.5%) 158.05 a (64.5%)163.89 a
(53.9%)
160.97 a (59.0%)
LSD (0.05)5.295.003.53 6.754.544.39
Biofertilizer (ZSB)
BF0121.74 b134.29 b128.02 b 117.62 b128.01 b122.82 b
BF1145.68 a (19.7%)147.11 a
(9.5%)
146.39 a (14.3%) 138.81 a (18.0%)145.69 a
(13.8%)
142.25 a (15.8%)
LSD (0.05)3.743.542.50 4.773.213.11
Year means133.71140.700.000 128.21136.840.000
Interactions effectsp value p value p value p value
G × AM0.000Y × AM0.000G × AM0.000Y × AMNS
G × ZSB0.000Y × G × AM0.001G × ZSB0.000Y × G × AM0.017
AM × ZSBNSY × ZSB0.000AM × ZSBNSY × ZSBNS
G × AM × ZSB0.000Y × AM × ZSB0.004G × AM × ZSB0.009Y × AM × ZSBNS
Y × GNSY × G × ZSB0.000Y × GNSY × G × ZSBNS
Y × G × AM × ZSB0.006 Y × G × AM × ZSBNS
The data represent the replicated mean, and the different letters within columns indicate significant differences at p ≤ 0.05, as determined by the least significant difference test (LSD). The data in parentheses indicate percentage increase in grain and straw Zn uptake in comparison to their control. Treatment: G1; TRB-72-311; G2: TRB-89-348; G3: Pirsabak-19; C: control; SP: seed priming of Zn at 0.5% concentration; SA: soil applied Zn at the rate of 10 kg ha−1; FA: foliar applied Zn at 0.5% concentration; BF0: without ZSB; and BF1: with ZSB; NS: not significant.
Table 3. Wheat genotypes, Zn application methods, and ZSB influenced the total Zn uptake g ha−1 and phytic acid µg g−1 of wheat.
TreatmentTotal Zn UptakeMean Phytic AcidMean
Year Year
2021–222022–23 2021–222022–23
Genotypes (G)
G1295.57 a
(25.8%)
315.73 a (26.6%)305.65 a (26.2%) 8.58 c (−11.7%)8.66 c
(−10.2%)
8.62 c (−11.0%)
G2255.23 b
(8.6%)
267.59 b (7.3%)261.41 b (7.9%) 8.87 b (−8.7%)8.81 b
(−8.6%)
8.84 b (−8.7%)
G3234.98 c249.33 c242.16 c 9.72 a9.64 a9.68 a
LSD (0.05)8.886.985.83 0.660.530.59
Application methods (AM)
C206.17 d212.97 d209.57 d 9.74 a9.56 a9.65 a
SP245.92 c
(19.3%)
261.92 c (23.0%)253.92 c (21.2%) 9.16 b (−6.0%)9.11 b
(−4.7%)
9.13 b (−5.4%)
SA281.90 b
(36.7%)
298.94 b (40.4%)290.42 b (38.6%) 8.86 c (−9.0%)8.90 c
(−6.9%)
8.88 c (−8.0%)
FA313.72 a
(52.2%)
336.36 a (57.9%)325.04 a (55.1%) 8.47 d (−13.0%)8.57 d
(−10.4%)
8.52 d (−11.7%)
LSD (0.05)10.268.066.74 0.770.610.68
Biofertilizer (ZSB)
BF0239.37 b262.30 b250.84 b 9.43 a9.31 a9.37 a
BF1284.49 a
(18.8%)
292.79 a (11.6%)288.64 a (15.1%) 8.69 b (−7.8%)8.76 b
(−5.9%)
8.72 b (−6.9%)
LSD (0.05)7.255.708.65 0.540.430.48
Year means261.92277.540.000 9.059.03NS
Interactions effectsp value p value p value p value
G × AM0.000Y × AMNSG × AM0.000Y × AMNS
G × ZSB0.000Y × G × AM0.001G × ZSBNSY × G × AMNS
AM × ZSBNSY × ZSB0.002AM × ZSBNSY × ZSBNS
G × AM × ZSB0.000Y × AM × ZSB0.009G × AM × ZSBNSY × AM ×ZSBNS
Y × GNSY × G × ZSB0.019Y × GNSY × G × ZSBNS
Y × G × AM × ZSBNS Y × G × AM × ZSBNS
The data represent the replicated mean, and the different letters within columns indicate significant differences at p ≤ 0.05, as determined by the least significant difference test (LSD). The data in parentheses indicate percentage increase in total uptake and percentage decrease in grain phytic acid content in comparison to their control. Treatment: G1; TRB-72-311; G2: TRB-89-348; G3: Pirsabak-19; C: control; SP: seed priming of Zn at 0.5% concentration; SA: soil applied Zn at the rate of 10 kg ha−1; FA: foliar applied Zn at 0.5% concentration; BF0: without ZSB; and BF1: with ZSB; NS: not significant.
Table 4. Wheat genotypes, Zn application methods, and ZSB influenced the grain yield t ha−1 of wheat.
TreatmentGrain YieldMean
Year
2021–222022–23
Genotypes (G)
G14.42 a (15.4%)4.73 a (19.7%)4.58 a (17.7%)
G24.02 b (5.0%)4.17 b (5.6%)4.09 b (5.1%)
G33.83 c3.95 c3.89 c
LSD (0.05)0.110.120.08
Application methods (AM)
C3.69 d3.61 d3.65 d
SP4.01 c (8.7%)4.07 c (12.7%)4.04 c (10.7%)
SA4.17 b (13.0%)4.55 b (26.0%)4.36 b (19.5%)
FA4.48 a (21.4%)4.91 a (36.0%)4.70 a (28.8%)
LSD (0.05)0.140.130.10
Biofertilizer (ZSB)
BF03.86 b4.18 b4.02 b
BF14.32 a (11.9%)4.38 a (4.8%)4.35 a (8.2%)
LSD (0.05)0.090.090.06
Year means4.08 b4.28 a0.000
Interactions effectsp value p value
G × AM0.000Y × AM0.000
G × ZSB0.000Y × G × AM0.000
AM × ZSBNSY × ZSB0.000
G × AM × ZSB0.000Y × AM × ZSB0.016
Y × G0.032Y × G × ZSBNS
Y × G × AM × ZSB0.000
The data represent the replicated mean, and the different letters within columns indicate significant differences at p ≤ 0.05, as determined by the least significant difference test (LSD). The data in parentheses indicate a percentage increase in grain yield in comparison to their control. Treatment: G1; TRB-72-311; G2: TRB-89-348; G3: Pirsabak-19; C: control; SP: seed priming of Zn at 0.5% concentration; SA: soil applied Zn at the rate of 10 kg ha−1; FA: foliar applied Zn at 0.5% concentration; BF0: without ZSB; and BF1: with ZSB; NS: not significant.
Table 5. Wheat genotypes, Zn application methods, and ZSB influenced the Zn use efficiency of wheat.
TreatmentYearMeanYearMeanYearMeanYearMean
2021
−22
2022
−23
2021
−22
2022
−23
2021
−22
2022
−23
2021
−22
2022
−23
AE (kg kg−1)PE (kg kg−1)AR efficiency (%)PFP (kg kg−1)
C------------
SP106.01 b152.67 b129.15 b26.05 b18.66 b22.35 b6.44 a8.68 b7.56 b1336.37 a1356.00 b1346.19 a
SA48.05 c93.54 c70.74 c35.96 a20.71 a28.33 a2.96 c4.47 c3.71 c417.15 c454.54 c435.85 b
FA226.62 a371.22 a298.76 a24.51 b19.82 a22.17 b10.32 a18.84 a15.93 a1281.22 b1402.65 a1341.93 a
LSD (0.05)38.9742.3831.919.551.874.993.361.541.1631.8236.2625.63
The data represent the replicated mean, and the different letters within columns indicate significant differences at p ≤ 0.05, as determined by the least significant difference test (LSD). Treatment: C: control; SP: seed priming of Zn at 0.5% concentration; SA: soil applied Zn at the rate of 10 kg ha−1; FA: foliar applied Zn at 0.5% concentration; AE: agronomic efficiency; PE: physiological efficiency; AR: recovery efficiency; and PFP: partial factor productivity.
Disclaimer/Publisher’s Note: The statements, opinions and data contained in all publications are solely those of the individual author(s) and contributor(s) and not of MDPI and/or the editor(s). MDPI and/or the editor(s) disclaim responsibility for any injury to people or property resulting from any ideas, methods, instructions or products referred to in the content.

