Article

Dynamics of Mineral Uptake and Plant Function during Development of Drug-Type Medical Cannabis Plants

Institute of Soil Water and Environmental Sciences, Volcani Center, Rishon LeZion 7505101, Israel
*
Author to whom correspondence should be addressed.
Agronomy 2023, 13(12), 2865; https://doi.org/10.3390/agronomy13122865
Submission received: 7 November 2023 / Revised: 14 November 2023 / Accepted: 15 November 2023 / Published: 21 November 2023

Abstract

:
Recent studies have demonstrated dose-responses of the cannabis plant to supply of macronutrients. However, further development of precision nutrition requires a high-resolution understanding of temporal trends of plant requirements for nutrients throughout the developmental progression, which is currently not available. As plant function changes during development, temporal information on nutrient uptake should be considered in relation to gradients in developmental-related physiological activity. Therefore, the present study investigated tempo-developmental trends of nutritional demands in cannabis plants, and in relation to physiological performance. Three cultivars differing in phenotype and chemotype were analyzed to evaluate genotypic variability. The results demonstrate that nutrient acquisition and deposition rates change dramatically during plant development. Uptake of individual minerals generally increased with the progression of both vegetative and reproductive development and the increase in plant biomass, while the deposition rates into the plant demonstrated nutrient specificity. The average concentrations of N, P, and K in the shoots of the different cultivars were 2.33, 4.90, and 3.32 times higher, respectively, at the termination of the reproductive growth phase, compared to the termination of the vegetative growth phase. Surprisingly, the uptake of Ca was very limited during the second part of the reproductive growth phase for two cultivars, revealing a decrease in Ca demand at this late developmental stage. Root-to-shoot translocation of most nutrients, including P, K, Mg, Mn, and Zn, as well as Na, is higher during the reproductive than the vegetative growth phase, and Fe, Mn, Zn, Cu, and Na displayed very little root-to-shoot translocation. The physiological characteristics of the plants, including gas exchange parameters, membrane leakage, osmotic potential, and water use efficiency, changed over time between the vegetative and the reproductive phases and with plant maturation, demonstrating a plant-age effect. The revealed tempo-developmental changes in nutritional requirements of the cannabis plant are a powerful tool required for development of a nutritional protocol for an optimal ionome.

1. Introduction

Considerable progress has recently been made in our understanding of the ‘drug-type’ (medical) cannabis plant ionome. Ample information is already available concerning the plant responses to fertilization [1,2,3,4,5,6], and numerous studies reported effects of additional cultivation conditions including exposure to light [7,8,9,10,11], salinity [12], root zone systems [13], planting density [14], and plant architecture manipulations [15,16].
Cannabis sativa is a dioecious, annual, short-photoperiod plant [17,18]. In short-day plants, the photoperiod controls steps of the flowering mechanism such as flower induction or inflorescence elongation. These plants thereby develop vegetatively under long photoperiod and require nights longer than a critical threshold for reproductive development [19]. The physiological performance and hence agronomic requirements often vary between the vegetative and the reproductive phases of development, and with plant maturation [20,21,22]. In C. sativa, a short photoperiod is required for inflorescence development, and therefore, the cultivation cycle of cannabis as well is composed of two distinct developmental phases: A vegetative growth-phase under long-photoperiod establishes the vegetative infrastructure of the plants, which is followed by a reproductive growth phase under short-photoperiod for development of the inflorescence yield.
The environmental conditions suitable for optimal plant development and function are known to be phase-specific for many crops, and optimal cultivation requires phase-specific adjustments of agronomic inputs such as light intensity and quality [23,24,25] and mineral supply [1,26]. Furthermore, as the metabolic, physiological, and developmental activity during the flowering (reproductive) phase in cannabis is not uniform over time, inputs may need to vary within this phase to facilitate optimal plant function. Medical cannabis flower maturation under short photoperiod is composed of two main sub-phases: 1. At the first 1–3 weeks, vegetative growth is accompanied by initiation of inflorescences, with relatively low secondary metabolism. 2. At the following 4–6 weeks, the vegetative growth ceases and is replaced by intensive inflorescence production and secondary metabolism [3,27,28,29]. These temporal changes in plant growth, development, and metabolic activity throughout the reproductive phase are no doubt accompanied by changes to physiological function, and dictate corresponding variations in requirements for exogenous inputs such as mineral nutrients. Indeed, gas-exchange parameters were shown to vary during the reproductive growth phase in cannabis [3,10], and the photosynthetic ability of the leaves of industrial hemp were shown to change with leaf age [30].
Plants require mineral elements as nutrients for their growth and reproduction throughout their life cycle. It is reasonable that the demand and, therefore, the uptake of nutrients by the plant will increase in times of rapid growth or flower/fruit development and decrease during growth deceleration, leaf senescence, and dormancy. It is well established that nutrient uptake and the concentration of nutrients in the plant change with plant age and development [31,32,33]. Moreover, the accumulation of nutrients in the plant differs between plant organs and changes over time to meet the plant’s demands [34,35,36,37]. The nutrients taken up by the root are translocated to the shoot, under a rate of translocation that changes over time according to the plant’s physiological state, and demonstrate mineral specificity that is affected by environmental factors such as root temperature and leaf transpiration [38,39,40,41]. As medical cannabis plants tend to have a rapid vegetative growth under long photoperiod [26,42,43], which proceeds to intensive inflorescence production under a short photoperiod [44,45], it is likely that the plant’s nutritional demands will alter during plant development.
An increasing body of information is available on the impact of nutritional regimes on medical cannabis plants. Optimal supply concentrations were determined for N at the vegetative [42] and the reproductive [5] phases, and for NH4/NO3 ratios [4]; for K at the vegetative [26] and the reproductive [1] phases; for P at the vegetative [43] and the reproductive phases [3]; for Mg at the vegetative phase [6]; and for combinations of macronutrients [2,46]. A field experiment with fiber hemp showed that the accumulation of most nutrients was higher in the leaves > stem and that their uptake and partitioning to plant organs were affected by cultivar characteristics and plant yield [47]. Despite the substantial progress in understanding the nutritional requirements of ‘drug-type’ cannabis, the available studies were performed for one growth phase (vegetative or reproductive); and plant response was demonstrated for only one or two time points. No study has elaborated on, and compared responses of the cannabis crop plant throughout the growth cycle, or investigated the nutritional requirement of the plant over time.
The present study was therefore set forth to examine how the nutritional demands of ‘drug-type’ cannabis change during plant development throughout the vegetative and the reproductive phases, and in relation to the physiological performance of the plants. The hypothesis guiding the work plan was that nutritional demands and physiological functions change during plant development, between the two growth phases, and during the flowering phase. To this end, we have analyzed changes in nutrient uptake, nutrient deposition rate, and root-to-shoot nutrient translocation throughout plant development, in parallel to changes in plant morphology (root:shoot ratio), biomass accumulation, and plant function traits. Responses of three genotypes of ‘drug-type’ medical cannabis were analyzed to compare genotypic variability. The information gained on temporal rates of mineral uptake into the cannabis plant, in conjunction with the understanding of changes in plant function throughout the cultivation cycle can guide the development of precision mineral nutrition regimes. Development of an optimal fertigation practice will improve the ability of cannabis growers to stabilize plant cultivation, optimize the ionome, minimize agricultural inputs, and improve yield quality and quantity.

2. Materials and Methods

2.1. Plant Material and Growing Conditions

Three genotypes of medical cannabis (Cannabis sativa L.) were used as a model system in this study: ‘Royal medic’ (RM) and ‘Desert queen’ (DQ) (Teva Adir Ltd., Israel), and Annapurna (ANP) (Canndoc Ltd., Herzliya, Israel). The plants were propagated from cuttings that were rooted in coconut fiber plugs (Jiffy International AS, Kristiansand, Norway). After rooting, the plants were transferred to 3 L plastic pots with a perlite 2-1-2 cultivation media (Agrekal, Habonim, Israel). In order to examine responses at the vegetative growth phase, the plants were grown for one month under 18/6 h light/dark photoperiod in a controlled environment growing room. Light was supplied by Metal Halide bulbs (380 μmol·m−2·s−1; Solis Tek Inc., Carson, CA, USA). In order to examine the reproductive growth phase, a parallel set of plants was propagated and grown as is described above, and after one week of vegetative growth under long photoperiod (two weeks for ANP), they were transferred to a short photoperiod for the induction of inflorescence development. For the remainder of the experiment and until flower maturation, the plants were grown under 12:12 light/dark photoperiod using High-Pressure Sodium bulbs (860 μmol·m−2·s−1, Greenlab by Hydrogarden, Petah Tikva, Israel). Light intensity, light quality, and the photoperiod at the various phases of plant development were designed to follow conventional practices for cannabis cultivation [11,48]. Flower maturation occurred 51, 57, and 74 days after the transfer to the short photoperiod for the DQ, ANP, and RM genotypes, respectively. Flower maturation, and the time of the final harvest, was determined following the conventional agronomic practice for these varieties, as the stage at which ~50% of the trichomes of the inflorescences were of amber color. Temperatures in the cultivation rooms were 27/25 °C during the day/night, respectively; relative humidity was 58/48%, respectively; and CO2 was at ambient levels. Irrigation was supplied via 1 L h−1 discharge-regulated drippers (Netafim, Tel-Aviv, Israel), one dripper per pot, to allow 30% drainage. Mineral nutrients were supplied dissolved in the irrigation solution, from final (pre-mixed) solutions, which were monitored throughout the experiment duration. During the vegetative growth phase, nitrogen (N) phosphorus (P), and potassium (K) concentrations were 16.3, 2.0, and 2.3 mM for RM and DQ, and 11.1, 1.9, and 4.6 mM for ANP, respectively. During the reproductive growth phase, N, P, and K concentrations were 16, 1.8, and 2.3 mM for RM and DQ, and 11.4, 2.0, and 2.7 mM for ANP, respectively. The complete composition of the irrigation solutions, including their pH and electric conductivity (EC), is detailed in Table S1. Zinc, Cu, and Mn were supplied chelated with EDTA, and Fe as chelated with EDDHSA. Mo and B were added as a part of the fertilizers Bar-Koret and B-7000, respectively (Israel chemicals, Tel-Aviv, Israel). During the last week before harvest, the plants were irrigated with distilled water without fertilizers as is routinely practiced in the commercial cultivation of medical cannabis. The experiment was arranged in a complete randomized design; all measurements were conducted with five replicates per genotype following the experimental design; and results are presented as averages ± standard errors (S.E.).

2.2. Plant Biomass and Inorganic Mineral Analysis

Biomass of the plant organs, i.e., inflorescences, inflorescence leaves, fan leaves, stem, and root biomass, was evaluated several times throughout plant development by destructive sampling of the plants. During the vegetative growth phase, the cultivars RM and DQ were sampled five times: 0, 7, 14, 21, and 29 days after the beginning of the vegetative growth phase; and ANP was sampled three times: 0, 14, and 31 days after the beginning of vegetative growth. During the reproductive growth phase, all three cultivars were sampled destructively three times (days are counted from the transfer to the short-photoperiod): 0, 30, and 74 days for RM; 0, 30, and 51 days for DQ; and 0, 29, and 57 days for ANP. Shoot biomass was calculated as the integration of the biomass of the above-ground organs, i.e., the inflorescences, inflorescence leaves, fan leaves, and stem biomass. Root biomass was evaluated for all samplings of the reproductive growth phase and for the last destructive sampling of the vegetative growth phase. Root:shoot ratio was calculated by dividing the root dry biomass by the shoot dry biomass. Dry weights were determined after drying for 48 h at 64 °C (128 h for the inflorescences). The results are averages ± SE for five replicated plants per cultivar. The plant material that was destructively sampled for biomass determination was used for the analyses of inorganic mineral contents in the plant organs, as is described by Saloner et al. [26]. In short, the plant samples were analyzed for concentrations of N, P, K, Ca, Mg, Fe, Mn, Zn, Cu, and Na. Two different procedures were applied for extraction of the various inorganic mineral elements from ground plant tissue. For the analysis of Ca, Mg, Fe, Zn, Cu, and Mn, the ground tissue was digested with HNO3 (65%) and HClO4 (70%), and the elements were analyzed with an atomic absorption spectrophotometer, AAnalyst 400 AA Spectrometer (PerkinElmer, Waltham, MA, USA). For the analysis of N, P, K, and Na, the dry tissue was digested with H2SO4 (98%) and H2O2 (70–72%). Na and K were analyzed by flame photometer (410 Flame Photometer Range, Sherwood Scientific Limited, The Paddocks, UK), and N and P were analyzed by an autoanalyzer (Lachat Instruments, Milwaukee, WI, USA). Mineral analysis of the irrigation solution was performed as described for the plant extraction and digestion solutions [26,49].

2.3. Physiological Parameters

The physiological activity of the plants was analyzed three times, once at the vegetative growth phase and twice during the reproductive growth phase. The timing of the analyses was chosen to represent three developmental stages: 1. Vegetative growth; 2. Early flowering stage; 3. Late flowering stage (near harvest). Royal Medic plants were analyzed 24 days after the beginning of the vegetative growth phase, and 67 days after the beginning of the reproductive growth phase. Desert Queen plants were analyzed 24 days after the beginning of the vegetative growth phase, and 24 and 45 days after the beginning of the reproductive growth phase. Annapurna plants were analyzed 32 days after the beginning of the vegetative growth phase, and 24 and 45 days after the beginning of the reproductive growth phase.
All measurements were conducted with five replicates each from a different plant, following the experimental design. In both growth phases, the youngest fully developed fan leaf on the main stem, located at the fourth node from the plant’s top, was analyzed. Photosynthetic pigments and membrane leakage analyses were conducted following Saloner et al. [26] and pigment concentrations were calculated following Lichtenthaler and Wellburn [50]. The two most peripheral leaflets were used for the analysis of osmotic potential, as was previously described [26], and relative water content (RWC) was analyzed and calculated following Bernstein et al. [51]. Leaf gas exchange, i.e., photosynthesis, transpiration, stomatal conductance, and intercellular CO2 concentration, was measured using a Licor 6400 XT system (LI-COR, Lincoln, NE, USA). Leaf water use efficiency (WUEi) was calculated using the photosynthesis and stomatal conductance results, as the net photosynthetic rate divided by the stomatal conductance [42].

2.4. Calculation of Nutrient Uptake, Deposition, and Translocation

For characterization of the uptake, deposition, and translocation of the mineral nutrients in the plant, three calculations were conducted. (i) Uptake Curves: An uptake curve of a mineral presents the changes over time of the total amount of the mineral in the shoot throughout plant development. It was calculated by multiplying the concentration of the mineral in each shoot’s organs (fan leaves, stem, inflorescence leaves, and inflorescence) by the organ’s dry weight, and summing the amounts in the various organs to receive the shoot mineral uptake. (ii) Deposition rate Curves: A deposition curve of a mineral presents the daily rate of deposition of a mineral into the shoot. The deposition rates were calculated as the differentials of the shoot concentrations over time periods throughout plant development, as per Equation (1). (iii). Translocation Factor (TF): The translocation factor is the ratio between a mineral concentration in the shoot and the root, which reflects on root-to-shoot translocation. Translocation factor (TF) >1 means that the concentration of the specific nutrient is greater in the shoot than in the root, marking a higher accumulation of the nutrient in the shoot, and vice versa [43]. It was analyzed twice, at the termination of the vegetative growth phase, and at the termination of the reproductive growth phase, using Equation (2), following Shiponi and Bernstein [43].
D e p o s i t i o n   r a t e   g d a y = S h o o t   m i n e r a l   c o n t e n t   o n   d a y   X S h o o t   m i n e r a l   c o n t e n t   o n   d a y   X + n N o .   o f   d a y s   b e t w e e n   d a y   X   a n d   d a y   X + n
T r a n s l o c a t i o n   f a c t o r   T F   o f   a   m i n e r a l = C o n c e n t r a t i o n   o f   t h e   m i n e r a l   i n   t h e   s h o o t C o n c e n t r a t i o n   o f   t h e   m i n e r a l   i n   t h e   r o o t

2.5. Statistical Analyses

The data were subjected to two-way analysis of variance (ANOVA) followed by Tukey’s HSD test. The analysis was performed with the Jump software, version 16 (SAS 2016, Cary, NC, USA). The two factors analyzed in the two-way ANOVA are sampling time (T) and genotype (G).

3. Results and Discussion

The present study examined the dynamics of mineral nutrients uptake and plant function of cannabis plants throughout their cultivation cycle, and achieved a temporal resolution and better understanding of the plant’s nutritional demands, and in relation to its physiological activity. The results facilitated the development of temporal trends of mineral uptake and deposition rates for the improvement of precision fertilization, minimizing agricultural inputs, reduced environmental pollution, and obtaining higher yields.

3.1. Plant Development: Biomass Accumulation and Visual Appearance

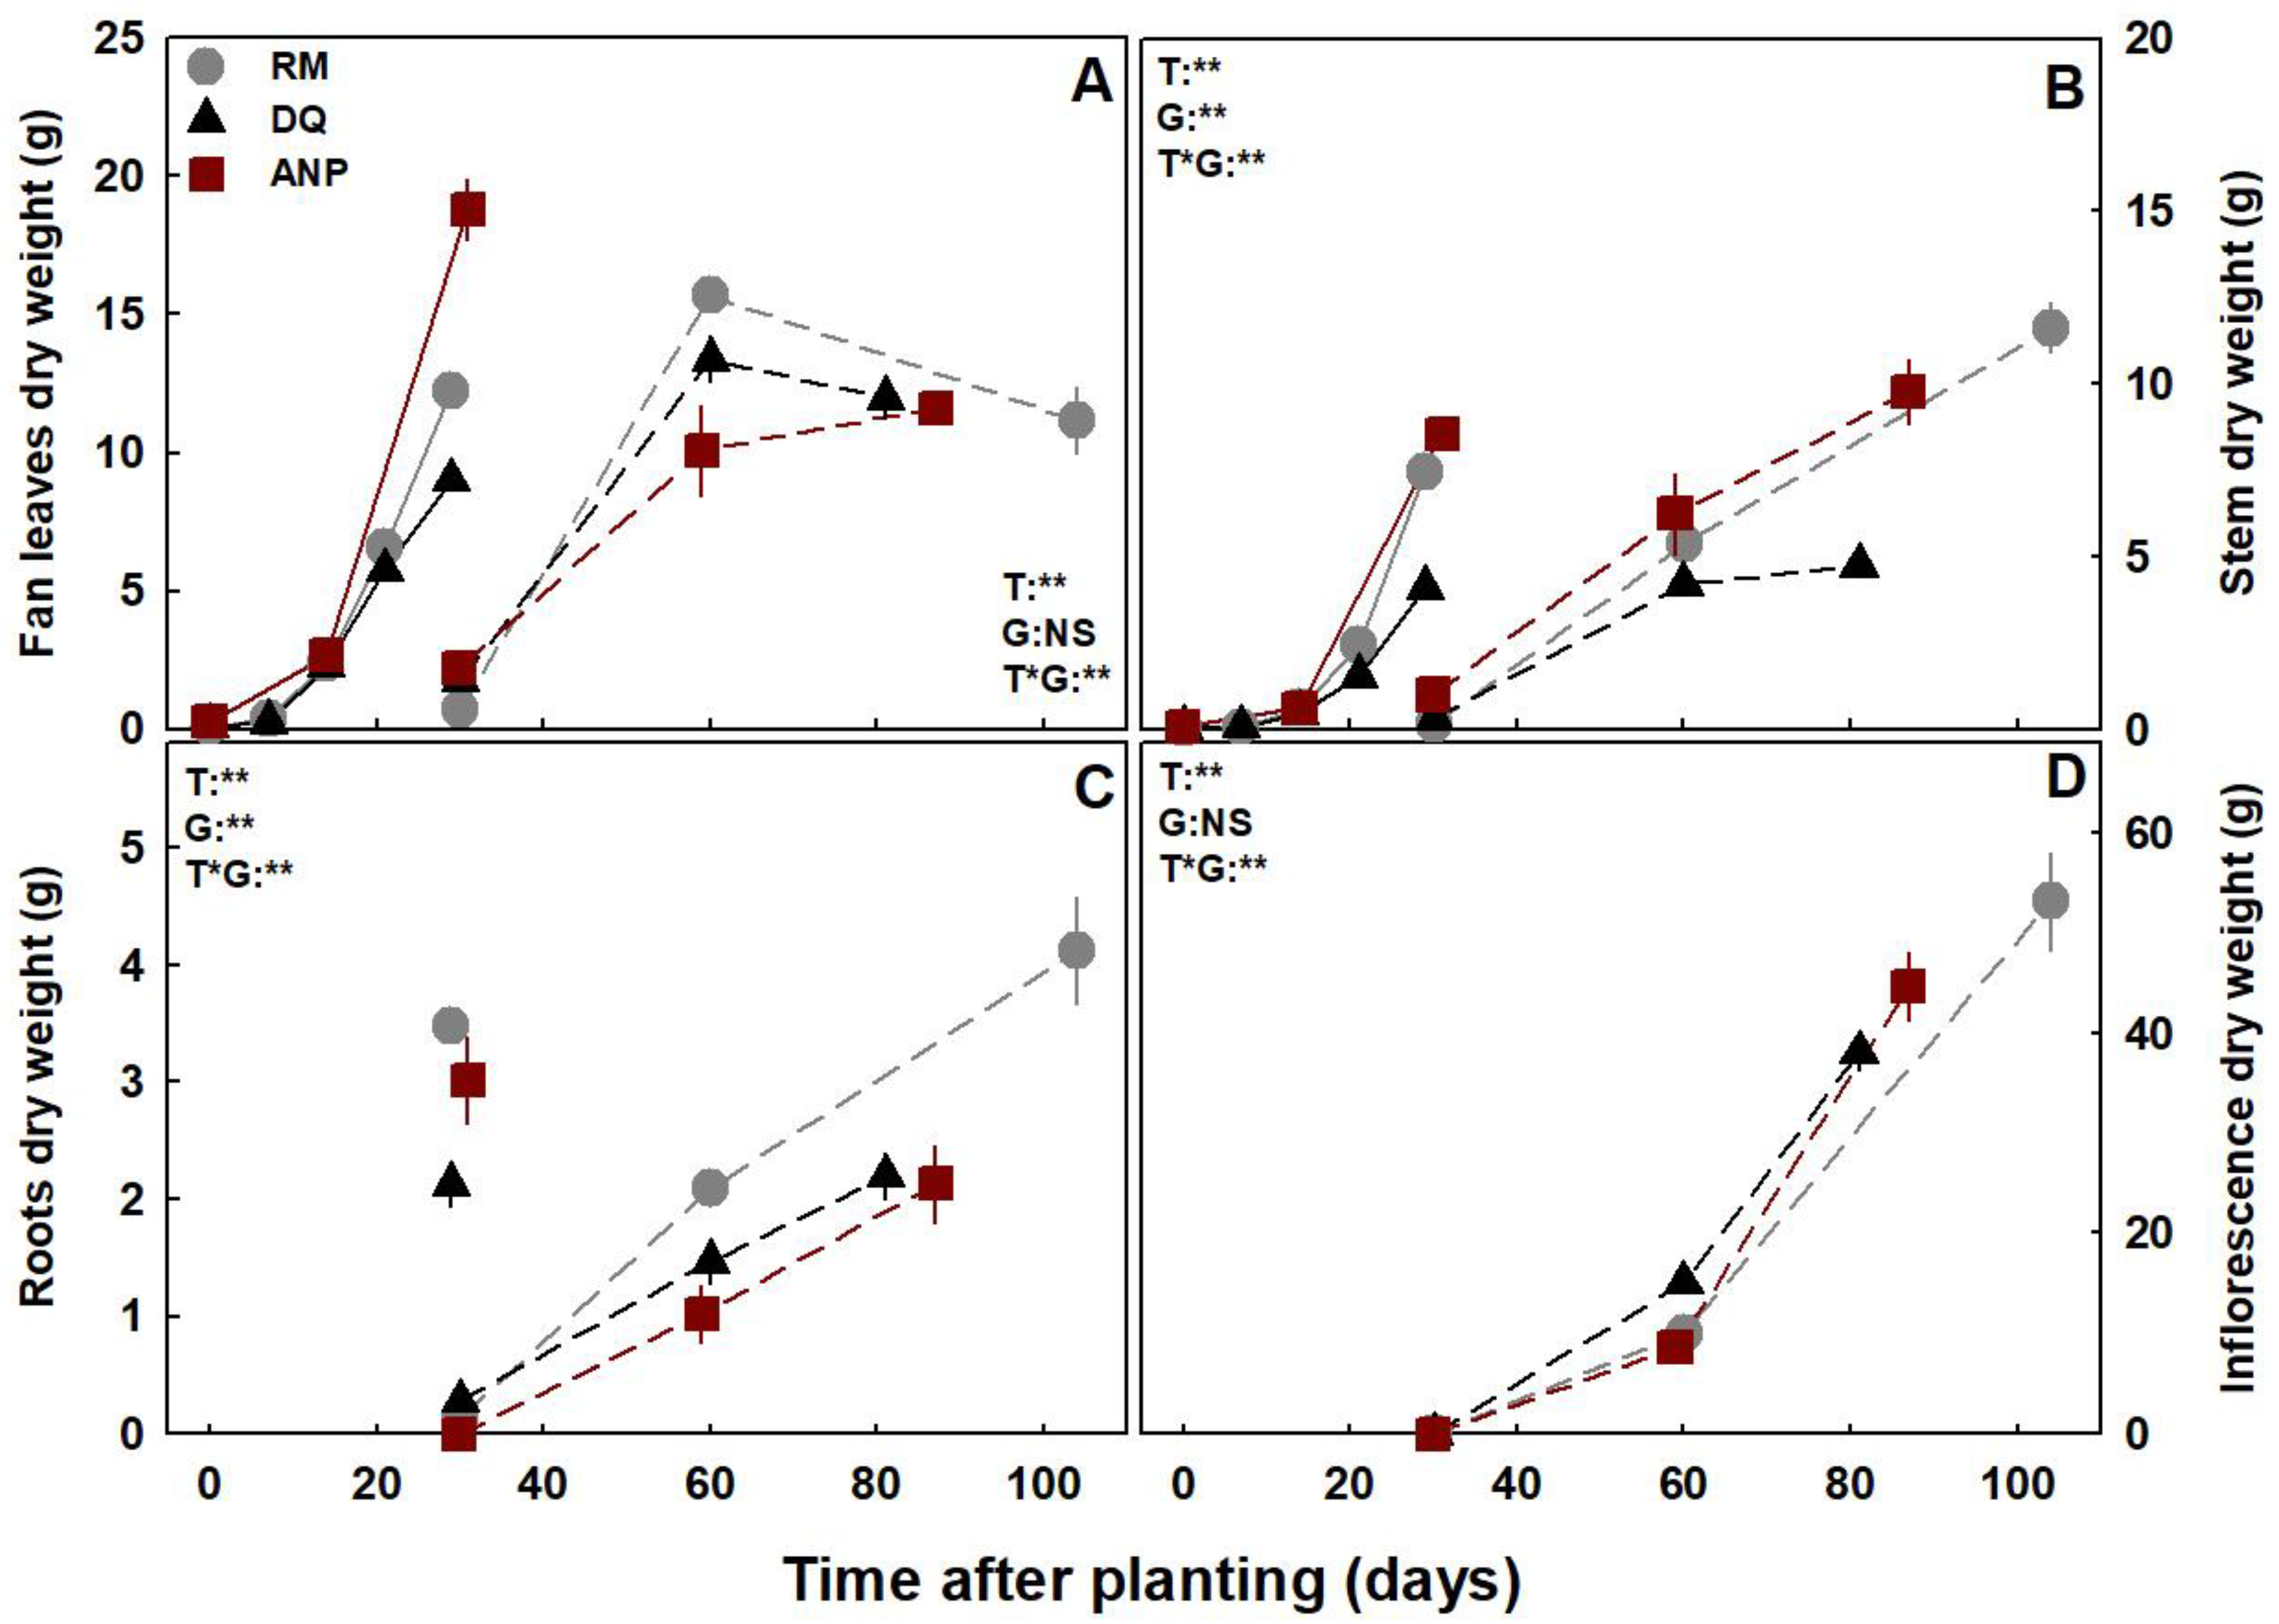
Modern cannabis cultivars have a diverse genetic background, and consequently demonstrate considerable morphological and chemical diversity that may impact the plant’s growth and yield potential [52,53] as well as the requirements for mineral nutrients. A morphological and physiological variability was also reflected in the three cultivars investigated in the present study, which demonstrated a considerable variability in key parameters such as plant height and the exposure time to short photoperiod required for maturation (Figure 1). RM is the tallest variety and has a longer maturation period than DQ, which is shorter (Figure 1). ANP plants are of intermediate height and maturation period (the ANP plants appear high in Figure 2 as they began the reproductive phase taller than the other two cultivars). Nevertheless, the biomass accumulation patterns of the three cultivars are very similar, as the shoot biomass increased steadily over time during both the vegetative and the reproductive phases (Figure 2A), in accord with the steady increase in stem and root biomass (Figure 3B,C), and the increase in leaves biomass during the vegetative growth phase (Figure 3A). In all cultivars, leaf biomass accumulation became more moderate and even decreased with the progression of the reproductive growth phase, likely due to allocation of resources toward development of inflorescences (Figure 3A). This is supported by the result that the decrease in leaves biomass in the second half of the reproductive growth phase paralleled a substantial increase in inflorescences biomass in all cultivars (Figure 3D). These opposing trends suggest that inflorescences development is the cause of the decrease in leaves biomass production and of leaf senescence, as is also common for other plant species under reproductive development [54,55]. In addition, the root:shoot ratio substantially decreased with the transition from vegetative to reproductive growth and further decreased as the inflorescences evolved (Figure 2B), demonstrating that growth of inflorescences and stems was not in line with root growth, a phenomenon well known to occur in plants [56,57,58]. As mineral nutrients are required for the production of new tissue, i.e., to support new growth, ample mineral supply to the developing inflorescences is required to facilitate the intensive reproductive development. Such supply can be achieved via root uptake during the reproductive stage, or by in planta remobilization from storage pools in other plant organs, as will be further discussed.

3.2. Gas Exchange, Water Relations, and Photosynthetic Pigments

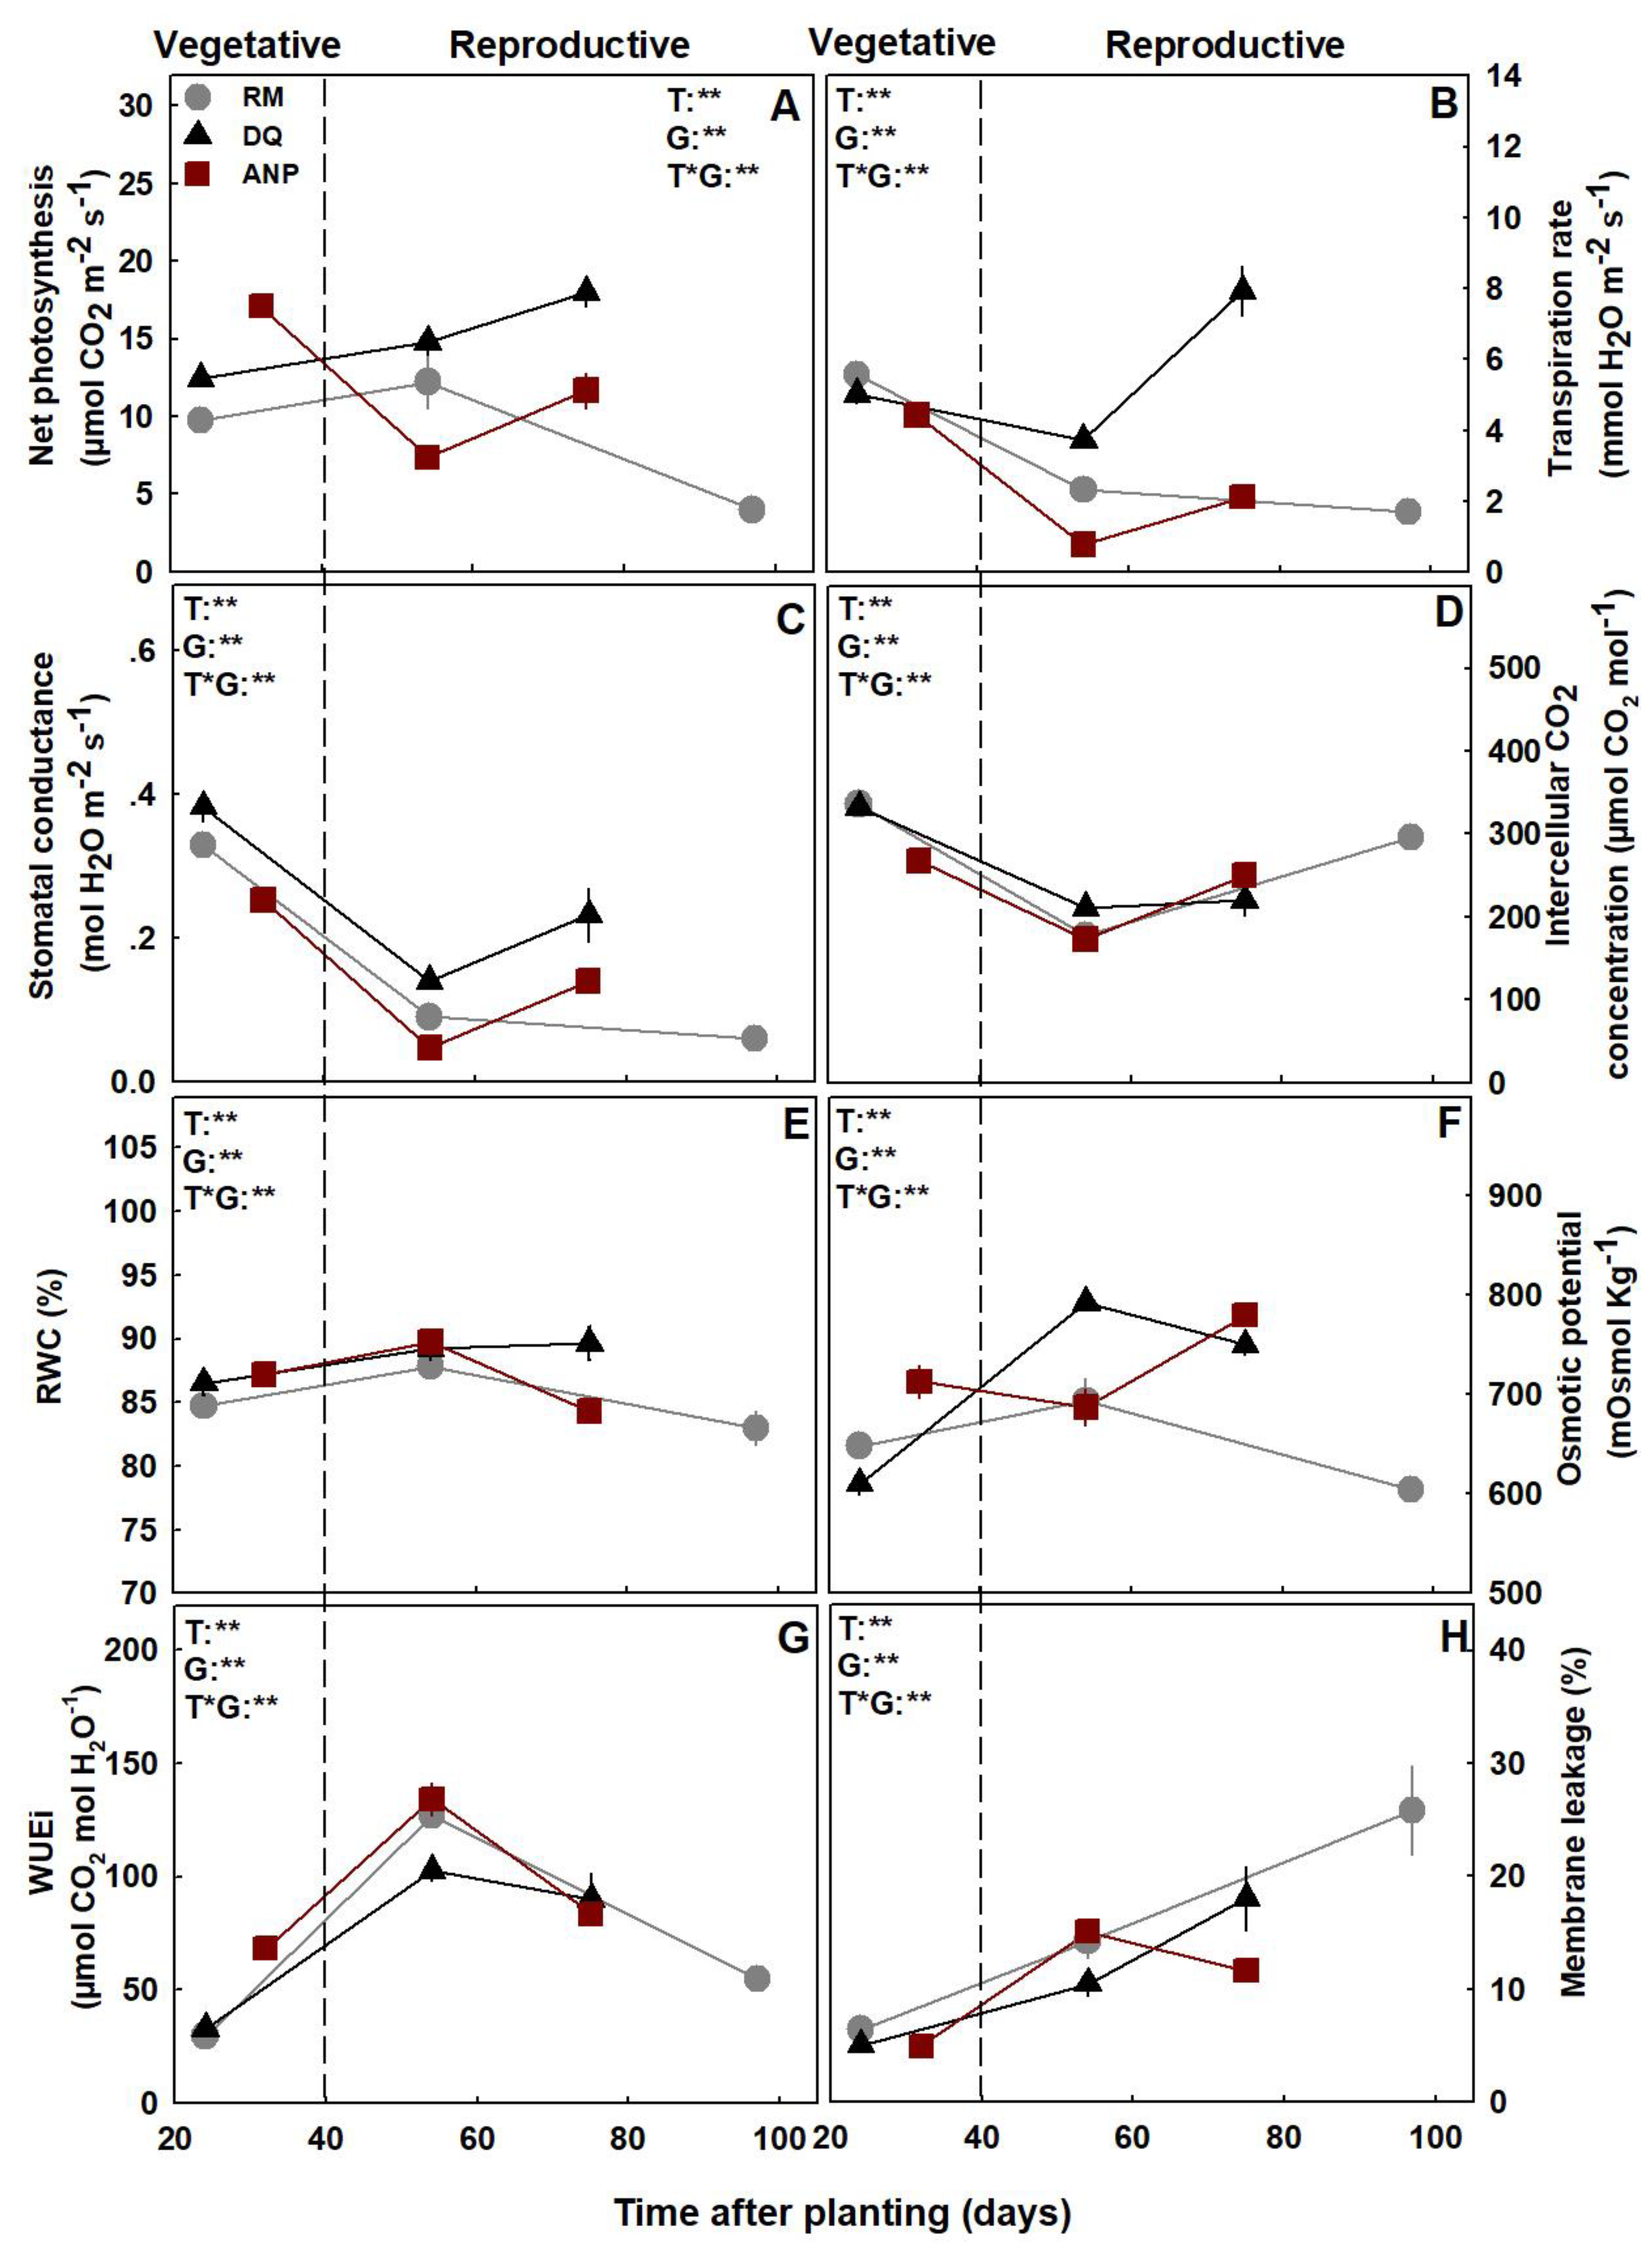
The three cultivars tested differ in physiological function and the way it changes over time during plant development (Figure 4): (i) RM generally performed best under vegetative growth, and its physiological function declined under reproductive growth and with the progression of the reproductive stage; (ii) ANP as well performed best at the vegetative growth phase, but its function declined in the middle of the reproductive growth phase and increased again before harvest; and (iii) DQ’s performance was generally lowest under vegetative growth, increased at the reproductive growth phase, and was highest before harvest. These data indicate that trends of physiological function vary between cannabis cultivars and throughout plant development, as was also reported for oil palm [59], corn [60], and olives [61]. The differences in physiological activity between cultivars may result from variations in the duration of exposure to short-photoperiod required for maturation. There were no significant differences between cultivars in activity levels at the vegetative growth phase since all plants (and inspected leaves) were of the same age (Figure 4 and Figure 5). At the reproductive growth phase, although DQ demonstrated higher gas exchange activity than ANP, as was reflected by higher rates of photosynthesis, transpiration, and stomatal conductance, they both demonstrated an increase in these parameters with the progression of the reproductive stage (Figure 4A–C). As RM has a longer reproductive development phase than ANP and DQ, it was analyzed later than the other cultivars and was, therefore, older during the last measurement. Hence, it is not surprising that an older plant (and leaf) demonstrated lower physiological function, as is already well documented for a range of plant species [22,62,63,64,65].
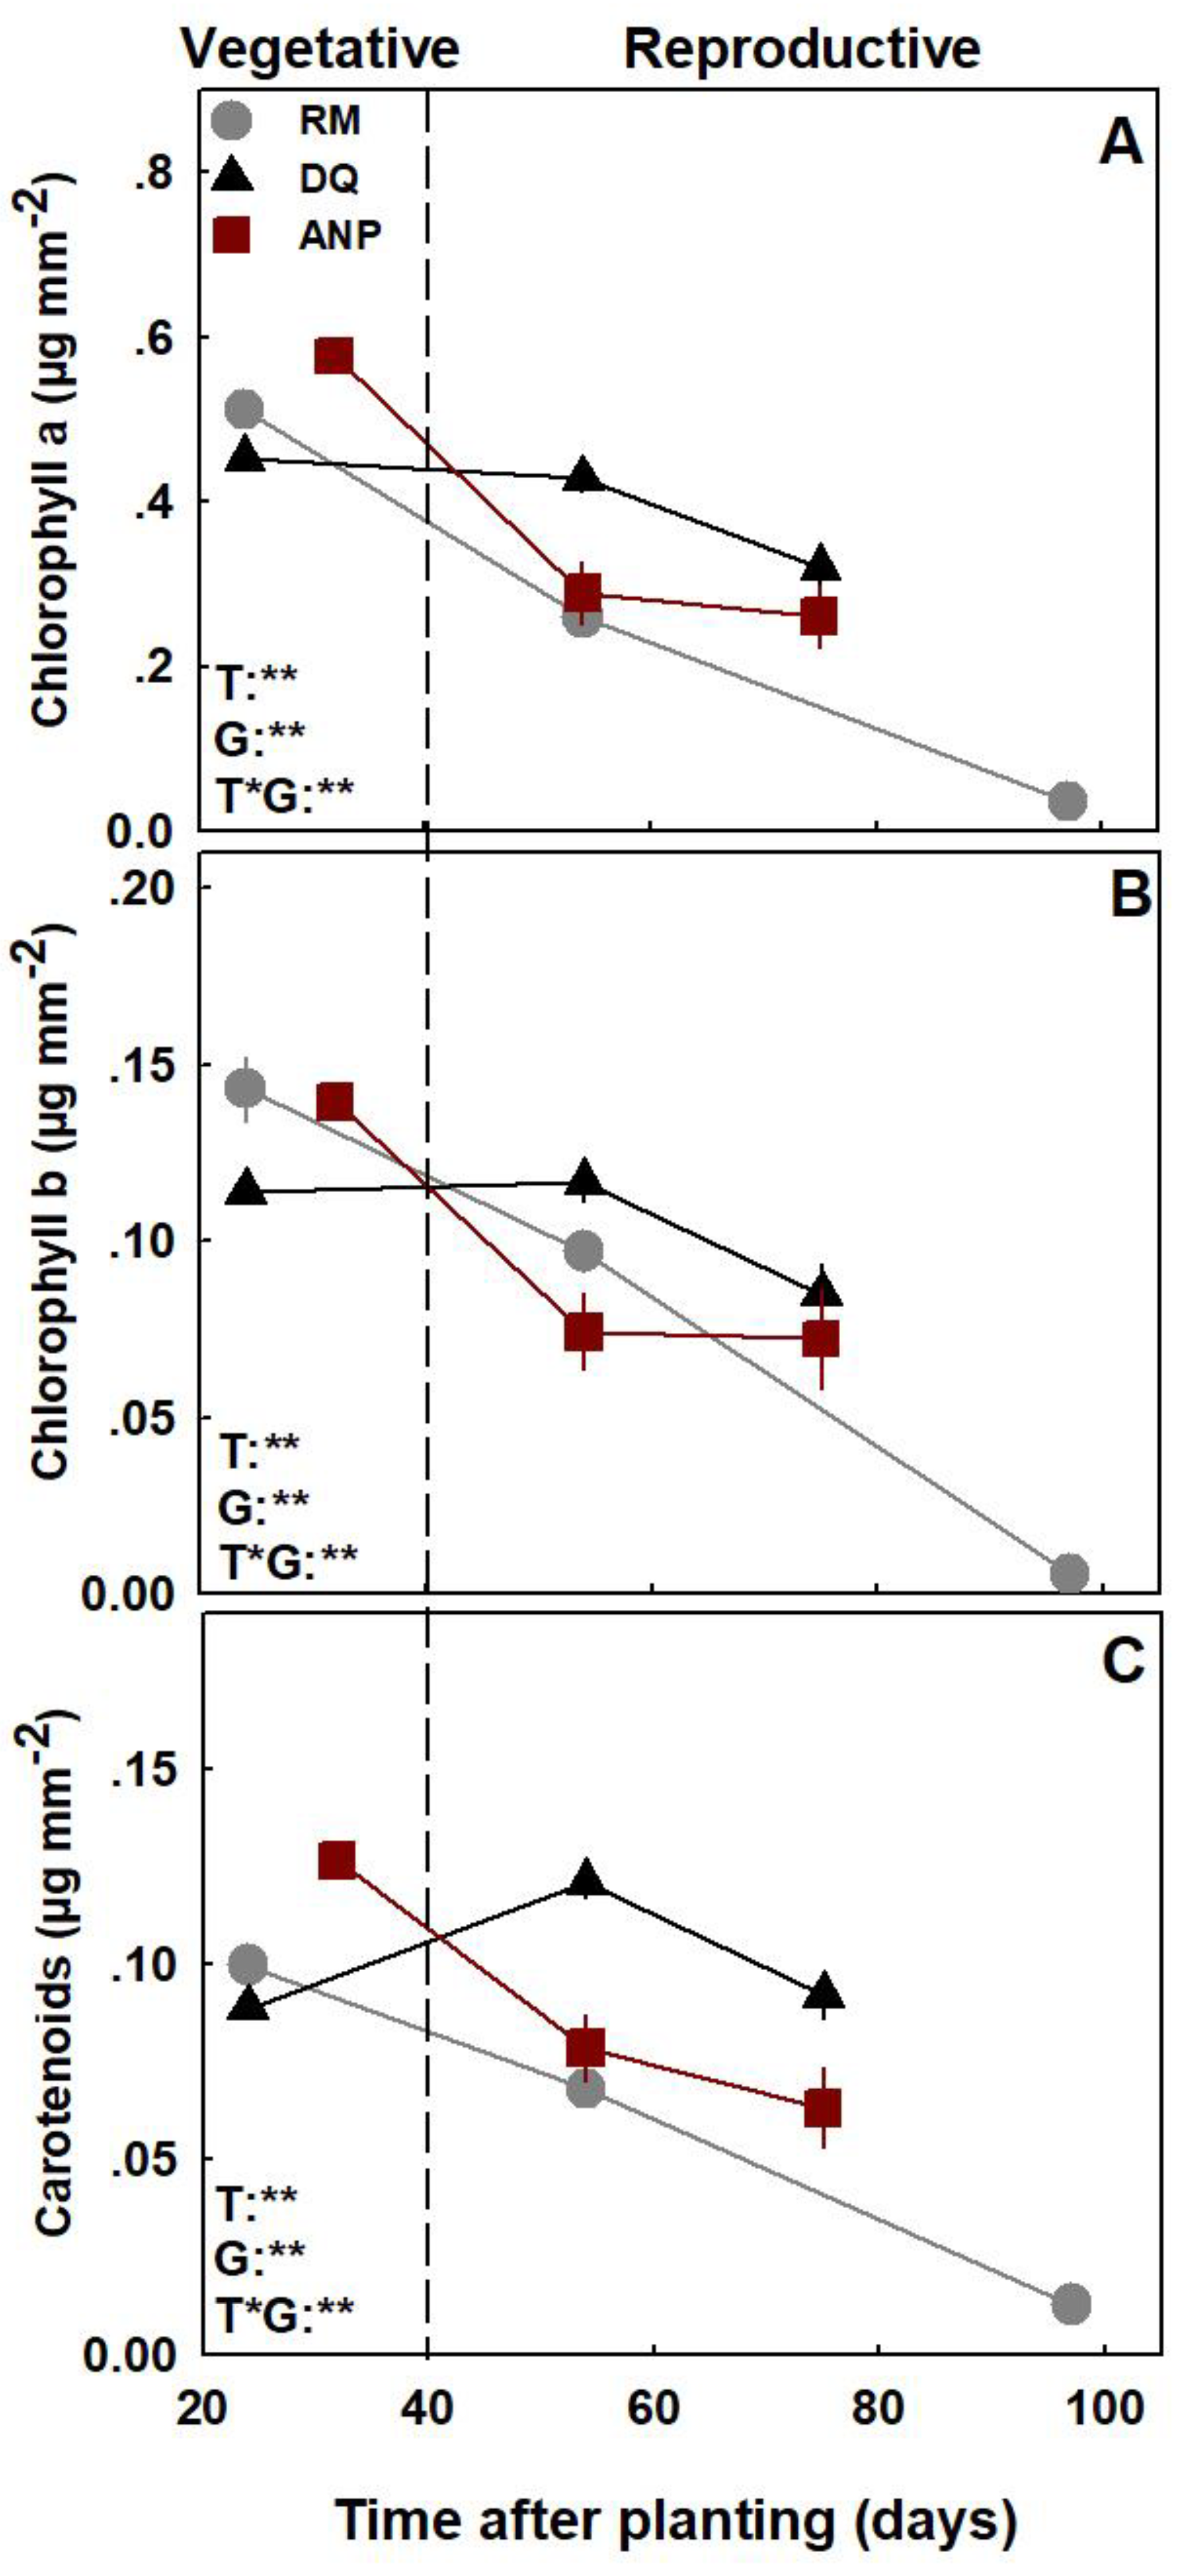
However, some of the physiological parameters demonstrated a uniform trend across cultivars: Intercellular CO2 concentration was lowest in the middle of the reproductive growth phase (Figure 4D); relative water content (RWC) and water-use efficiency (WUEi) were highest in the middle of the reproductive phase (Figure 4E); membrane leakage was lowest at the vegetative growth phase and increased over time (Figure 4H); and photosynthetic pigment contents were highest at the vegetative growth phase and decreased over time (Figure 5). The temporal changes in the physiological function of the plants over time may reflect developmental trends characteristic of annual plants [66]. Toward the end of the reproductive development, it is inevitable that source-sink relationships and resource partitioning in the plant will change, and the translocation of nutrients and carbohydrates from vegetative to reproductive organs will increase, to support inflorescence and seed development. This mechanism, which has already been demonstrated in other plant species [67,68,69], correlates with the substantial increase in inflorescence production (Figure 3D) and the cessation of leaf production (Figure 3A) in the second half of the reproductive phase. Taken together, these data suggest that the leaves’ physiological function decreases by the end of the reproductive growth phase on account of divergence of resources to the reproductive inflorescences, as can be seen for the RM cultivar (Figure 3 and Figure 4). As DQ and ANP were harvested after a shorter duration of reproductive development than DQ, they had less time to translocate resources from leaves to inflorescences. Thus, they still demonstrate high performance before harvest (Figure 4). We suggest that had they been grown for a longer duration, their gas exchange activity would have likely decreased similarly to RM (Figure 4), and their mineral uptake would have changed accordingly.
The second reason for the relatively high physiological performance of the plants at the vegetative growth phase compared to the reproductive growth phase is the difference in light spectrum and light intensity. During the vegetative growth phase, the plants received lighting from Metal Halide bulbs, which supply a relatively enriched blue light spectrum with an intensity of 380 μmol·m−2·s−1. During the reproductive phase, the plants received lighting from High-Pressure Sodium bulbs, which supply a spectrum enriched in the red range with an intensity of 860 μmol·m−2·s−1. As the light intensity and the red:blue ratio increased with the transition to reproductive growth, the photosynthetic and gas exchange mechanisms could have reduced. This is supported by our finding that concentrations of photosynthetic pigments were generally highest under the vegetative growth conditions (Figure 5), potentially to increase light capture per unit leaf area since light intensity was lower at that phase. It is important to note that the relative decrease in plant function under reproductive growth conditions might have resulted from the high light intensity, which could have caused photo-inhibition damages and induced oxidative stress that damaged cell homeostasis [70,71]. Indeed, our results show that membrane stability was lower and electrolyte leakage from the cell membrane was higher under the reproductive growth conditions (Figure 4H), as was already shown to occur in other plant species [72,73].

3.3. Nutrient Uptake and Deposition

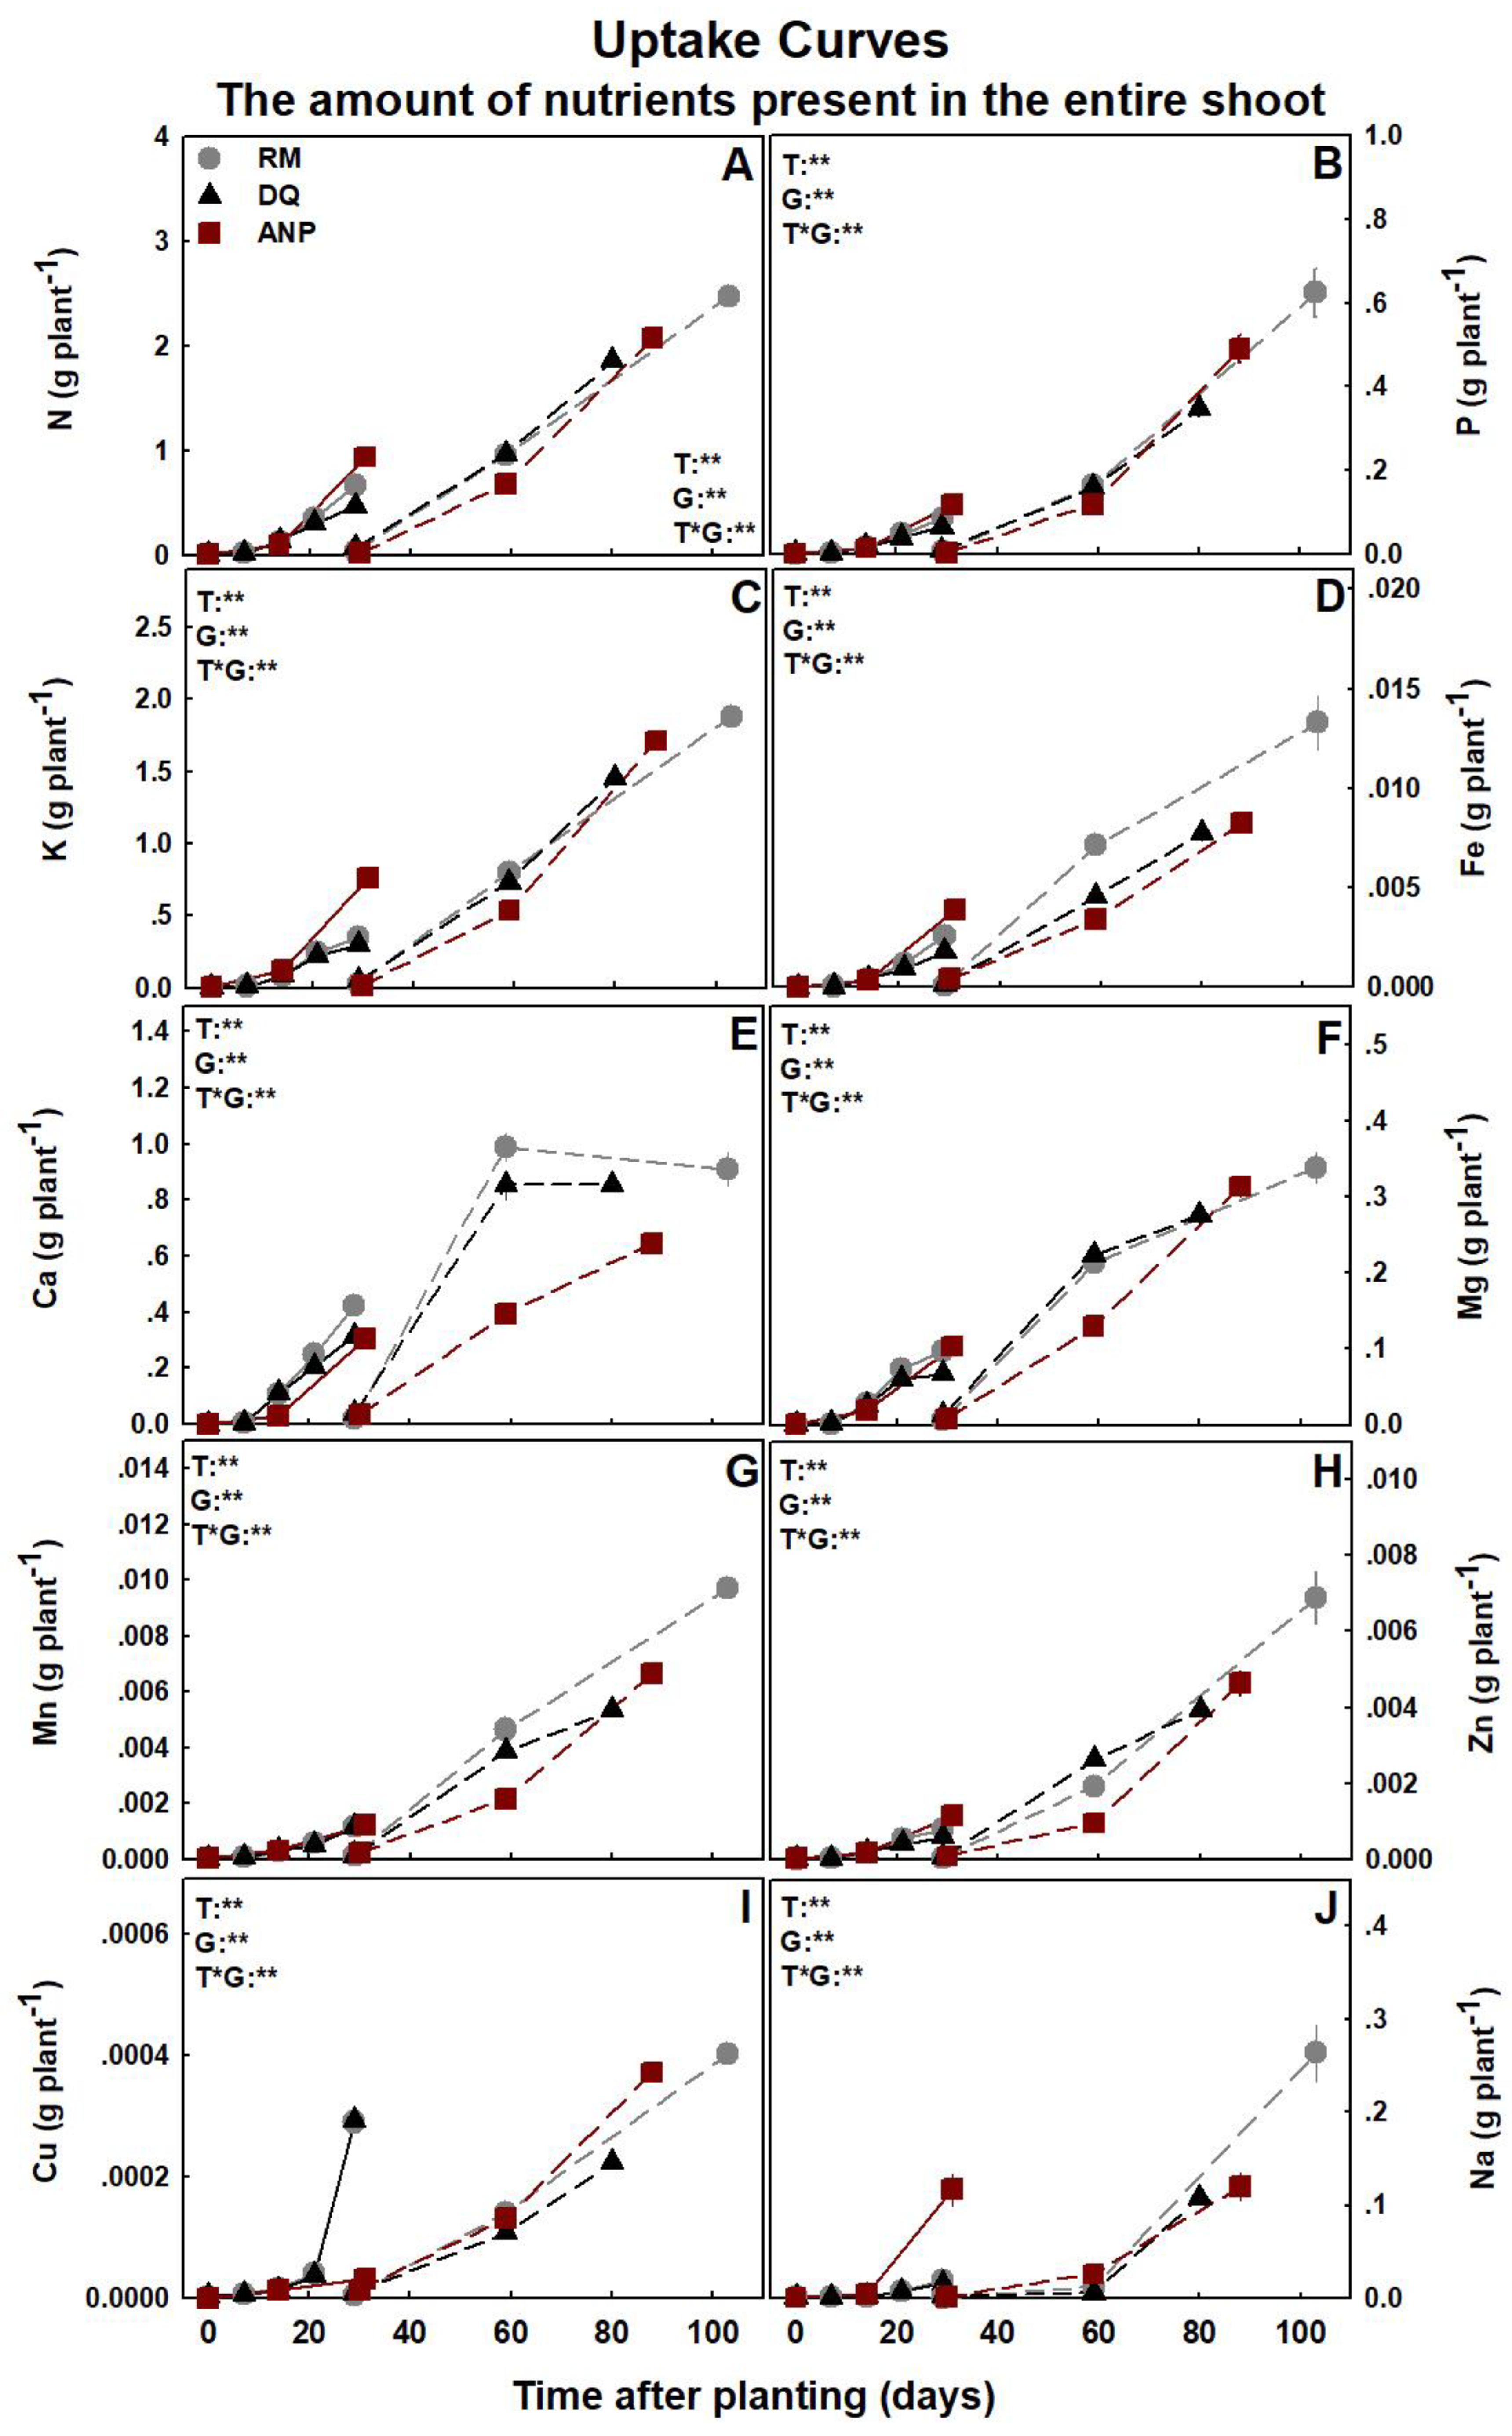
Nutrient uptake and distribution in the plant body are selective and essential metabolic processes performed by all plants throughout their development [32,74,75]. As the need for mineral uptake into plants lies in their necessity for vital growth and metabolic activity of plant cells, it is not surprising that mineral uptake is a selective process and is affected by the plant’s need for nutrients [32,33,76]. In this study, two parameters related to nutrient accumulation are reported: nutrient uptake, which presents the total amount of individual minerals present in the plant at a specific time (Figure 6); and nutrient deposition rate, which presents the rate of accumulation of individual minerals into the plant over a defined period of time, e.g., mg per day (Figure 7).
As arises from Figure 6, the amount of each of the examined nutrients, excluding Ca, increased gradually over time in the plant during both growth phases. As the data match the trend obtained for shoot biomass production (Figure 2A), it is concluded that for most minerals, the plant’s biomass production is the governing factor for their uptake into the plant. Also, the uptake of most nutrients into the plant, including N, P, Fe, Mn, and Zn, was relatively similar between cultivars, as is apparent from the comparable amounts in the plant (Figure 6). A specific difference was obtained for Ca uptake at the second stage of the reproductive growth phase (Figure 6E): for RM and DQ, Ca uptake was very limited, as is also apparent from the zero Ca deposition at that stage, while for ANP, the deposition rate of Ca only mildly decreased at that stage, as Ca uptake continued (Figure 6E and Figure 7E). Another significant difference is the contradicting trends of Na and Cu accumulation during the vegetative growth phase, as RM and DQ accumulated more Cu and less Na, and ANP presented an opposing trend (Figure 6I,J). In addition, ANP accumulated more K than the other cultivars during the vegetative growth phase (Figure 6C). The differences between cultivars can be explained by the differences in the fertilization regime that RM and DQ received compared to ANP (Table S1); RM and DQ were supplied and thus accumulated more Ca and Cu and less K and Na than ANP (Figure 6C,E,I,J). This is supported by recent results for medical cannabis by our group and others that demonstrated that when the supply of a specific nutrient is elevated, its accumulation tends to increase, and vice versa [3,4,5,6,26,42,43,77]. Furthermore, as the uptake curves of RM and DQ are highly similar for most nutrients (including N, P, K, Mg, Cu, and Na; Figure 6A–C,F,I,J), although their physiological function and time to maturation differ, we conclude that the fertilization regime governs the plant nutrient uptake, in addition to biomass accumulation.
Since mineral uptake (the total amount of minerals in the plant) is derived from the plant size and biomass, it should be addressed that bigger plants will show higher mineral accumulation, and thus growth practices and plant architectural manipulations may affect mineral uptake. Therefore, in order to understand the in-plant changes in mineral uptake over time, nutrient deposition rates need to be examined. The rates of mineral deposition into the cannabis plants were indeed highly affected by plant age, and were nutrient-specific (Figure 7). At the vegetative growth phase, the deposition rate of most minerals increased gradually over time (Figure 7), reflecting the increase in plant biomass (Figure 2A). The cultivars RM and DQ demonstrated unexpected trends of deposition rates for K, Mg, and Zn, as the rates decreased at the end of the vegetative growth phase (Figure 7C,F,H). At the reproductive growth phase, the deposition rates for N, P, K, Zn, and Na generally increased with time, whereas the deposition rates of Ca and Mg decreased, and Fe and Cu deposition was steady (Figure 7).
The differences found in the rates of mineral deposition between time points likely reflect different plant demands during the growing season. The differences between minerals, point to selective absorption following plant demand. This observation correlates with the known ability of plants to regulate specific ion uptake following plant requirements [32,78,79]. However, it should not be overlooked that plants may overconsume some minerals, and cannabis has already been shown to take up more K than is required for optimal function, without affecting plant performance [26]. Despite the differences in physiological performance and maturation periods, the deposition rates of RM and DQ were similar for most nutrients (Figure 7). ANP, which received a different fertilization regime, demonstrated different uptake curves than RM and DQ (Figure 6), and consequently, its deposition rates for the minerals differed from RM and DQ (Figure 7). These results suggest again that the differences between cultivars are not an outcome of genetic differences, but arise from the variability of environmental factors (fertilization regimes) to which the plants were subjected. Resolving this issue will require evaluation of trends of changes in nutrient deposition rates into genetically different cultivars, under a range of fertilization conditions.

3.4. Nutrient Translocation and Root:Shoot Ratio

For nutrients to arrive at the leaves and inflorescences, they must first be absorbed into the root and translocated to the shoot. Deficient supply of nutrients to shoot organs can thereby result from limited root uptake as well as restricted root-to-shoot translocation or remobilization of nutrients in the shoot [80,81,82]. Therefore, this study examined the translocation of individual nutrients from root to the shoot in cannabis plants using a calculated translocation factor (Figure 8). A clear trend arising from the analysis is that the translocation of most nutrients, including P, K, Mg, Mn, Zn, and Na, was higher during reproductive than vegetative growth (Figure 8B,C,F–H,J). Specifically, the translocation of P and Mg was about three times higher under reproductive than vegetative growth in all cultivars, demonstrating a substantial increase in translocation to the shoot (Figure 8B,F). Iron, Ca, and Cu translocation was generally higher under vegetative growth, compared to reproductive growth (Figure 8D,E,I), while N translocation did not substantially change between growth phases (Figure 8A).
Another important trend is that root–shoot translocation of all micronutrients was small, as their TF were all <1 (Figure 8). Specifically, Fe, Mn, Zn, Cu, and Na accumulated to higher concentrations in the root in all cultivars (Figure 8D,G–J). Moreover, the TF of Fe and Na was ~0.2, reflecting that the concentration in the root was five times higher than in the shoot (Figure 8D,J). On the contrary, the TF of most macronutrients, including N, K, Ca, and Mg, was ≥1, reflecting that they generally tended to accumulate in the shoot and not in the root (Figure 8A,C,F–G). These findings concerning the high accumulation of micronutrients in the roots, and higher translocation of macronutrients to the shoot are not surprising, as similar trends were identified in numerous plant species [34,36,37,83,84]. Furthermore, these results align with results published by our group in previous studies, showing that cannabis plants tend to accumulate micronutrients such as Fe, Cu, and Zn in the root > shoot, and to accumulate macronutrients such as N, K, Ca, and Mg in the shoot > root [3,5,6,26,43].
The changes in mineral translocation between growth phases reflect on the physiological performance, and provide indications for the requirements and roles of individual nutrients in the plant. The root:shoot ratio was dramatically smaller under reproductive growth, revealing that the increase in shoot development was higher than of the root during reproductive growth (Figure 2B). As the translocation of the majority of nutrients to the shoot increased in parallel to the decrease in root:shoot ratio (Figure 2B and Figure 8), we suggest that this escalation was required to support the increase in shoot development, and specifically the substantial increase in inflorescences biomass (Figure 3D). The argument that an increase in the shoot’s demand for nutrients promotes the translocation of essential nutrients to the shoot in general, and to the reproductive organs in particular, is supported by similar trends identified for other plant species [41,85]. Interestingly, the decrease in Fe, Ca, and Cu with the transition to reproductive growth and the decrease in root:shoot ratio (Figure 2B and Figure 8D,E,I) may imply that these micronutrients do not play a significant role in increasing shoot (and inflorescence) development over root formation. Alternatively, it may reflect that their concentration is more affected by other parameters, such as water movement [86] and availability of chelates [87], which are frequently correlated with Ca and Fe translocation, respectively. As N concentration was generally stable and did not vary between growth phases (Figure 8A), we conclude that its demand and deposition are more stable, and it is less involved in the physiological transition of the decrease in root:shoot ratio and inflorescence formation. This is supported by findings of our latest studies, which revealed that the demand of cannabis for N, and therefore N supply, is similar for the vegetative and the reproductive growth phases [5,42].

3.5. Agronomic Considerations

The results of this study that demonstrate substantial changes in accumulation and deposition rates of minerals into cannabis plants over time have agronomic implications. First, the deposition rate of most nutrients increases over time while Ca deposition decreases at the second stage of the reproductive growth phase, revealing that the fertilization regime needs to be adjusted accordingly. Second, as nutrient supply was one of the main factors affecting uptake of nutrients by the plants, an optimal and uniform nutritional regime between cultivation batches is required for standardization and optimization of plant growth and secondary metabolism. Third, as the accumulation of most nutrients increases with the increase in biomass production, it is concluded that bigger plants require larger amounts of nutrients for their overall development regardless of genotype. Furthermore, the demand of the cannabis plant for nutrients continues up to plant maturation and does not stop at the second stage of the reproductive growth phase, raising the question whether the “flushing” practice performed by cannabis cultivators (i.e., irrigating with water without nutrients at the last 7–10 days prior to harvest) is necessary, beneficial, or harmful. This issue is currently under investigation in our laboratory. Finally, while using the nutritional requirements shown in this study, possible effects of cultivation conditions including growth media, climatic conditions, plant architecture manipulations, and plant phenotypical traits that may differ between agricultural systems, need to be considered.

4. Conclusions

The present study examined trends of uptake, deposition, and translocation of mineral nutrients during the vegetative and reproductive development of three medical cannabis cultivars. The results, which include also the analyses of temporal trends of physiological activity, demonstrate that (i) The uptake of most nutrients increases gradually during plant development. (ii) The mineral deposition rate is nutrient-specific and highly sensitive to the plant’s nutritional regime. (iii) Root-to-shoot translocation is nutrient-specific as well, but most nutrients demonstrated higher translocation during reproductive growth as the inflorescence biomass rose and root:shoot ratio decreased. (iv) The length of the maturation period of a cultivar, and plant age, were identified as key factors for the observed differences in physiological activity between cultivars. The results provide a first step toward understanding the plant’s temporal physiological activity and nutritional requirements over the crop cultivation cycle.

Supplementary Materials

The following supporting information can be downloaded at: https://www.mdpi.com/article/10.3390/agronomy13122865/s1, File S1: p values for the results presented in the figures; Table S1. Mineral composition of the irrigation solutions during the vegetative and the reproductive growth phases.

Author Contributions

N.B., conceptualization, funding acquisition, methodology, recourses, supervision, writing; A.S., formal analysis, data curation, writing. All authors have read and agreed to the published version of the manuscript.

Funding

This study was funded by the Chief Scientist Fund of the Ministry of Agriculture in Israel, grant no. 20-03-0018.

Data Availability Statement

The data is contained within the manuscript.

Acknowledgments

We thank Yael Sade, Nadav Danziger, Sivan Shiponi, Geki Shoef, Ayana Neta, and Dalit Morad for technical assistance, and Shiran Cohen for assistance with N and P analysis. We thank Rami Levy, Neri Barak, and Adriana Kamma from Canndoc Ltd., the largest certified medical cannabis commercial cultivator in Israel, and Gerry Kolin from Teva Adir Ltd., for cooperation and for the supply of the plant material for the study.

Conflicts of Interest

The authors declare no conflict of interest.

References

  1. Saloner, A.; Bernstein, N. Effect of potassium (K) supply on cannabinoids, terpenoids and plant function in medical cannabis. Agronomy 2022, 12, 1242. [Google Scholar] [CrossRef]
  2. Bevan, L.; Jones, M.; Zheng, Y. Optimisation of nitrogen, phosphorus, and potassium for soilless production of Cannabis sativa in the flowering stage using response surface analysis. Front. Plant Sci. 2021, 12, 764103. [Google Scholar] [CrossRef]
  3. Shiponi, S.; Bernstein, N. The highs and lows of P supply in medical cannabis: Effects on cannabinoids, the ionome, and morpho-physiology. Front. Plant Sci. 2021, 12, 657323. [Google Scholar] [CrossRef]
  4. Saloner, A.; Bernstein, N. Nitrogen source matters: High NH4/NO3 ratio reduces cannabinoids, terpenoids, and yield in medical cannabis. Front. Plant Sci. 2022, 13, 830224. [Google Scholar] [CrossRef]
  5. Saloner, A.; Bernstein, N. Nitrogen supply affects cannabinoid and terpenoid profile in medical cannabis (Cannabis sativa L.). Ind. Crops Prod. 2021, 167, 113516. [Google Scholar] [CrossRef]
  6. Morad, D.; Bernstein, N. Response of medical cannabis to magnesium (Mg) supply at the vegetative growth phase. Plants 2023, 12, 2676. [Google Scholar] [CrossRef] [PubMed]
  7. Danziger, N.; Bernstein, N. Light matters: Effect of light spectra on cannabinoid profile and plant development of medical cannabis (Cannabis sativa L.). Ind. Crops Prod. 2021, 164, 113351. [Google Scholar] [CrossRef]
  8. Eichhorn Bilodeau, S.; Wu, B.S.; Rufyikiri, A.S.; MacPherson, S.; Lefsrud, M. An update on plant photobiology and implications for cannabis production. Front. Plant Sci. 2019, 10, 296. [Google Scholar] [CrossRef] [PubMed]
  9. Rodriguez-Morrison, V.; Llewellyn, D.; Zheng, Y. Cannabis inflorescence yield and cannabinoid concentration are not increased with exposure to short-wavelength ultraviolet-B radiation. Front. Plant Sci. 2021, 12, 725078. [Google Scholar] [CrossRef]
  10. Rodriguez-Morrison, V.; Llewellyn, D.; Zheng, Y. Cannabis yield, potency, and leaf photosynthesis respond differently to increasing light levels in an indoor environment. Front. Plant Sci. 2021, 12, 456. [Google Scholar] [CrossRef] [PubMed]
  11. Westmoreland, M.; Kusuma, P.; Bugbee, B. Cannabis lighting: Decreasing blue photon fraction increases yield but efficacy is more important for cost effective production of cannabinoids. PLoS ONE 2021, 16, e0248988. [Google Scholar] [CrossRef]
  12. Yep, B.; Gale, N.V.; Zheng, Y. Aquaponic and hydroponic solutions modulate NaCl-induced stress in drug-type Cannabis sativa L. Front. Plant Sci. 2020, 11, 1169. [Google Scholar] [CrossRef] [PubMed]
  13. Yep, B.; Gale, N.V.; Zheng, Y. Comparing hydroponic and aquaponic rootzones on the growth of two drug-type Cannabis sativa L. cultivars during the flowering stage. Ind. Crops Prod. 2020, 157, 112881. [Google Scholar] [CrossRef]
  14. Danziger, N.; Bernstein, N. Too dense or not too dense: Higher planting density reduces cannabinoid uniformity but increases yield/area in drug-type medical cannabis. Front. Plant Sci. 2022, 13, 713481. [Google Scholar] [CrossRef]
  15. Danziger, N.; Bernstein, N. Plant architecture manipulation increases cannabinoid standardization in ‘drug-type’ medical cannabis. Ind. Crops Prod. 2021, 167, 113528. [Google Scholar] [CrossRef]
  16. Danziger, N.; Bernstein, N. Shape matters: Plant architecture affects chemical uniformity in large-size medical cannabis plants. Plants 2021, 10, 1834. [Google Scholar] [CrossRef]
  17. Clarke, R.C.; Merlin, M.D. Cannabis domestication, breeding history, present-day genetic diversity, and future prospects. CRC. Crit. Rev. Plant Sci. 2017, 35, 293–327. [Google Scholar] [CrossRef]
  18. Moher, M.; Jones, M.; Zheng, Y. Photoperiodic response of in vitro Cannabis sativa plants. HortScience 2021, 56, 108–113. [Google Scholar] [CrossRef]
  19. Weller, J.L.; Kendrick, R.E. Photomorphogenesis and photoperiodism in plants. In Photobiology: The Science of Life and Light, 2nd ed.; Björn, L.O., Ed.; Springer: New York, NY, USA, 2008; pp. 417–463. ISBN 9780387726540. [Google Scholar]
  20. Vitale, L.; Arena, C.; Carillo, P.; di Tommasi, P.; Mesolella, B.; Nacca, F.; de Santo, A.V.; Fuggi, A.; Magliulo, V. Gas exchange and leaf metabolism of irrigated maize at different growth stages. Plant Biosyst. Int. J. Deal. Asp. Plant Biol. 2011, 145, 485–494. [Google Scholar] [CrossRef]
  21. Reekie, E.G.; Bazzaz, F.A. Reproductive effort in plants. 3. Effect of reproduction on vegetative activity. Am. Nat. 1987, 129, 907–919. [Google Scholar] [CrossRef]
  22. Bielczynski, L.W.; Łaçki, M.K.; Hoefnagels, I.; Gambin, A.; Croce, R. Leaf and plant age affects photosynthetic performance and photoprotective capacity. Plant Physiol. 2017, 175, 1634–1648. [Google Scholar] [CrossRef] [PubMed]
  23. Murray, G.A. The relationship of light quality, duration, and intensity to vegetative and reproductive growth in alfalfa (Medicago sativa L.). PhD Thesis, The University of Arizona, Tucson, AZ, USA, 1967. [Google Scholar]
  24. Nadalini, S.; Zucchi, P.; Andreotti, C. Effects of blue and red LED lights on soilless cultivated strawberry growth performances and fruit quality. Eur. J. Hortic. Sci. 2017, 82, 12–20. [Google Scholar] [CrossRef]
  25. Schwarz, D.; Thompson, A.J.; Kläring, H.P. Guidelines to use tomato in experiments with a controlled environment. Front. Plant Sci. 2014, 5, 625. [Google Scholar] [CrossRef] [PubMed]
  26. Saloner, A.; Sacks, M.M.; Bernstein, N. Response of medical cannabis (Cannabis sativa L.) genotypes to K supply under long photoperiod. Front. Plant Sci. 2019, 10, 1369. [Google Scholar] [CrossRef]
  27. Muntendam, R.; Happyana, N.; Erkelens, T.; Bruining, F.; Kayser, O. Time dependent metabolomics and transcriptional analysis of cannabinoid biosynthesis in Cannabis sativa var. Bedrobinol and Bediol grown under standardized condition and with genetic homogeneity. Online Int. J. Med. Plant Res 2012, 1, 31–40. [Google Scholar] [CrossRef]
  28. Apicella, P.V.; Sands, L.B.; Ma, Y.; Berkowitz, G.A. Delineating genetic regulation of cannabinoid biosynthesis during female flower development in Cannabis sativa. Plant Direct 2022, 6, e412. [Google Scholar] [CrossRef] [PubMed]
  29. Aizpurua-Olaizola, O.; Soydaner, U.; Öztürk, E.; Schibano, D.; Simsir, Y.; Navarro, P.; Etxebarria, N.; Usobiaga, A. Evolution of the cannabinoid and terpene content during the growth of Cannabis sativa plants from different chemotypes. J. Nat. Prod. 2016, 79, 324–331. [Google Scholar] [CrossRef]
  30. Bauerle, W.L.; McCullough, C.; Iversen, M.; Hazlett, M. Leaf age and position effects on quantum yield and photosynthetic capacity in hemp crowns. Plants 2020, 9, 271. [Google Scholar] [CrossRef] [PubMed]
  31. Smith, P.F. Mineral analysis of plant tissues. Annu. Rev. Plant Physiol. 1962, 13, 81–108. [Google Scholar] [CrossRef]
  32. White, P.J. Ion uptake mechanisms of individual cells and roots: Short-distance transport. In Marschner’s Mineral Nutrition of Higher Plants, 3rd ed.; Marchner, P., Ed.; Academic Press: London, UK, 2012; pp. 7–47. ISBN 9780123849052. [Google Scholar]
  33. Wang, H.; Inukai, Y.; Yamauchi, A. Root development and nutrient uptake. CRC Crit. Rev. Plant Sci. 2006, 25, 279–301. [Google Scholar] [CrossRef]
  34. Nestby, R.; Lieten, F.; Pivot, D.; Raynal Lacroix, C.; Tagliavini, M. Influence of mineral nutrients on strawberry fruit quality and their accumulation in plant organs: A review. Int. J. fruit Sci. 2008, 5, 139–156. [Google Scholar] [CrossRef]
  35. Garcia, C.B.; Grusak, M.A. Mineral accumulation in vegetative and reproductive tissues during seed development in Medicago truncatula. Front. Plant Sci. 2015, 6, 622. [Google Scholar] [CrossRef] [PubMed]
  36. Hawkesford, M.; Horst, W.; Kichey, T.; Lambers, H.; Schjoerring, J.; Skrumsager Møller, I.; White, P. Functions of macronutrients. In Marschner’s Mineral Nutrition of Higher Plants; Marschner, P., Ed.; Academic Press: London, UK, 2012; pp. 135–190. ISBN 9780123849052. [Google Scholar]
  37. Vittori Antisari, L.; Carbone, S.; Gatti, A.; Vianello, G.; Nannipieri, P. Uptake and translocation of metals and nutrients in tomato grown in soil polluted with metal oxide (CeO2, Fe3O4, SnO2, TiO2) or metallic (Ag, Co, Ni) engineered nanoparticles. Environ. Sci. Pollut. Res. 2015, 22, 1841–1853. [Google Scholar] [CrossRef] [PubMed]
  38. Wu, C.Y.; Lu, L.L.; Yang, X.E.; Feng, Y.; Wei, Y.Y.; Hao, H.L.; Stoffella, P.J.; He, Z.L. Uptake, translocation, and remobilization of zinc absorbed at different growth stages by rice genotypes of different Zn densities. J. Agric. Food Chem. 2010, 58, 6767–6773. [Google Scholar] [CrossRef] [PubMed]
  39. Akhter, M.F.; Macfie, S. Species-specific relationship between transpiration and cadmium translocation in lettuce, barley and radish. J. Plant Stud. 2012, 1, 2. [Google Scholar] [CrossRef]
  40. Clarkson, D.T.; Hanson, J.B. The mineral nutrition of higher plants. Annu. Rev. Plant Physiol. 1980, 31, 239–298. [Google Scholar] [CrossRef]
  41. Engels, C.; Marschner, H. Root to shoot translocation of macronutrients in relation to shoot demand in maize (Zea mays L.) grown at different root zone temperatures. Z. Pflanzenernähr. Bodenkd. 1992, 155, 121–128. [Google Scholar] [CrossRef]
  42. Saloner, A.; Bernstein, N. Response of medical cannabis (Cannabis sativa L.) to nitrogen supply under long photoperiod. Front. Plant Sci. 2020, 11, 1517. [Google Scholar] [CrossRef]
  43. Shiponi, S.; Bernstein, N. Response of medical cannabis (Cannabis sativa L.) genotypes to P supply under long photoperiod: Functional phenotyping and the ionome. Ind. Crops Prod. 2021, 161, 113154. [Google Scholar] [CrossRef]
  44. Hall, J.; Bhattarai, S.P.; Midmore, D.J. Review of flowering control in industrial hemp. J. Nat. Fibers 2012, 9, 23–36. [Google Scholar] [CrossRef]
  45. Clarke, R. Botany of the genus Cannabis. In Advances in Hemp Research; Haworth Press: Binghamton, NY, USA, 1999; pp. 1–19. [Google Scholar]
  46. Bernstein, N.; Gorelick, J.; Zerahia, R.; Koch, S. Impact of N, P, K, and humic acid supplementation on the chemical profile of medical cannabis (Cannabis sativa L.). Front. Plant Sci. 2019, 10, 736. [Google Scholar] [CrossRef]
  47. Angelini, L.; Tavarini, S.; Cestone, B.; Beni, C. Variation in mineral composition in three different plant organs of five fibre hemp (Cannabis sativa L.) cultivars. Agrochimica 2014, 58, 1–18. [Google Scholar]
  48. Small, E. Cannabis: A Complete Guide; CRC Press: Boca Raton, FL, USA, 2016; ISBN 9781315367583. [Google Scholar]
  49. Bernstein, N.; Ioffe, M.; Bruner, M.; Nishri, Y.; Luria, G.; Dori, I.; Matan, E.; Philosoph-Hadas, S.; Umiel, N.; Hagiladi, A. Effects of supplied nitrogen form and quantity on growth and postharvest quality of Ranunculus asiaticus flowers. HortScience 2005, 40, 1879–1886. [Google Scholar] [CrossRef]
  50. Lichtenthaler, H.K.; Wellburn, A.R. Determinations of total carotenoids and chlorophylls a and b of leaf extracts in different solvents. Biochem. Soc. Trans. 1983, 11, 591–592. [Google Scholar] [CrossRef]
  51. Bernstein, N.; Shoresh, M.; Xu, Y.; Huang, B. Involvement of the plant antioxidative response in the differential growth sensitivity to salinity of leaves vs roots during cell development. Free Radic. Biol. Med. 2010, 49, 1161–1171. [Google Scholar] [CrossRef]
  52. Chouvy, P.A. Cannabis cultivation in the world: Heritages, trends and challenges. In EchoGéo; OpenEdition Press: Marseille, France, 2019. [Google Scholar] [CrossRef]
  53. Small, E. Botanical Classification and Nomenclatural Issues. In Cannabis: A Complete Guide; CRC Press: Boca Raton, FL, USA, 2016; pp. 477–504. [Google Scholar]
  54. Munné-Bosch, S.; Alegre, L. Die and let live: Leaf senescence contributes to plant survival under drought stress. Funct. Plant Biol. 2004, 31, 203–216. [Google Scholar] [CrossRef]
  55. Wingler, A.; Purdy, S.; MacLean, J.A.; Pourtau, N. The role of sugars in integrating environmental signals during the regulation of leaf senescence. J. Exp. Bot. 2006, 57, 391–399. [Google Scholar] [CrossRef]
  56. Wolstenholme, B.N. Root, shoot or fruit. South Afr. Avocado Grow. Assoc. Yearb. 1981, 4, 27–29. [Google Scholar]
  57. Bonifas, K.D.; Walters, D.T.; Cassman, K.G.; Lindquist, J.L. Nitrogen supply affects root:shoot ratio in corn and velvetleaf (Abutilon theophrasti). Weed Sci. 2005, 53, 670–675. [Google Scholar] [CrossRef]
  58. Iwasa, Y.; Roughgarden, J. Shoot/root balance of plants: Optimal growth of a system with many vegetative organs. Theor. Popul. Biol. 1984, 25, 78–105. [Google Scholar] [CrossRef]
  59. Tezara, W.; Domínguez, T.S.T.; Loyaga, D.W.; Ortiz, R.N.; Chila, V.H.R.; Ortega, M.J.B. Photosynthetic activity of oil palm (Elaeis guineensis) and interspecific hybrid genotypes (Elaeis oleifera × Elaeis guineensis), and response of hybrids to water deficit. Sci. Hortic. 2021, 287, 110263. [Google Scholar] [CrossRef]
  60. Haldimann, P. Low growth temperature-induced changes to pigment composition and photosynthesis in Zea mays genotypes differing in chilling sensitivity. Plant. Cell Environ. 1998, 21, 200–208. [Google Scholar] [CrossRef]
  61. Bacelar, E.A.; Moutinho-Pereira, J.M.; Gonçalves, B.C.; Lopes, J.I.; Correia, C.M. Physiological responses of different olive genotypes to drought conditions. Acta Physiol. Plant. 2009, 31, 611–621. [Google Scholar] [CrossRef]
  62. Bond, B.J. Age-related changes in photosynthesis of woody plants. Trends Plant Sci. 2000, 5, 349–353. [Google Scholar] [CrossRef]
  63. Niinemets, Ü. Stomatal conductance alone does not explain the decline in foliar photosynthetic rates with increasing tree age and size in Picea abies and Pinus sylvestris. Tree Physiol. 2002, 22, 515–535. [Google Scholar] [CrossRef]
  64. Kennedy, R.A.; Johnson, D. Changes in photosynthetic characteristics during leaf development in apple. Photosynth. Res. 1981, 2, 213–223. [Google Scholar] [CrossRef]
  65. Munné-Bosch, S.; Alegre, L. Plant aging increases oxidative stress in chloroplasts. Planta 2002, 214, 608–615. [Google Scholar] [CrossRef]
  66. Bonini, S.A.; Premoli, M.; Tambaro, S.; Kumar, A.; Maccarinelli, G.; Memo, M.; Mastinu, A. Cannabis sativa: A comprehensive ethnopharmacological review of a medicinal plant with a long history. J. Ethnopharmacol. 2018, 227, 300–315. [Google Scholar] [CrossRef]
  67. Sklensky, D.E.; Davies, P.J. Resource partitioning to male and female flowers of Spinacia oleracea L. in relation to whole-plant monocarpic senescence. J. Exp. Bot. 2011, 62, 4323–4336. [Google Scholar] [CrossRef]
  68. Fan, K.; Zhang, Q.; Liu, M.; Ma, L.; Shi, Y.; Ruan, J. Metabolomic and transcriptional analyses reveal the mechanism of C, N allocation from source leaf to flower in tea plant (Camellia sinensis L.). J. Plant Physiol. 2019, 232, 200–208. [Google Scholar] [CrossRef]
  69. Clifford, P.E.; Neo, H.H.; Hew, C.S. Regulation of assimilate partitioning in flowering plants of the monopodial orchid Aranda Noorah Alsagoff. New Phytol. 1995, 130, 381–389. [Google Scholar] [CrossRef]
  70. Poulson, M.E.; Thai, T. Effect of high light intensity on photoinhibition, oxyradicals and artemisinin content in Artemisia annua L. Photosynthetica 2015, 53, 403–409. [Google Scholar] [CrossRef]
  71. Allen, R.D.; Webb, R.P.; Schake, S.A. Use of transgenic plants to study antioxidant defenses. Free Radic. Biol. Med. 1997, 23, 473–479. [Google Scholar] [CrossRef] [PubMed]
  72. Faisal, M.; Anis, M. Changes in photosynthetic activity, pigment composition, electrolyte leakage, lipid peroxidation, and antioxidant enzymes during ex vitro establishment of micropropagated Rauvolfia tetraphylla plantlets. Plant Cell. Tissue Organ Cult. 2009, 99, 125–132. [Google Scholar] [CrossRef]
  73. Cakmak, I.; Kurz, H.; Marschner, H. Short-term effects of boron, germanium and high light intensity on membrane permeability in boron deficient leaves of sunflower. Physiol. Plant. 1995, 95, 11–18. [Google Scholar] [CrossRef]
  74. Maathuis, F.J. Physiological functions of mineral macronutrients. Curr. Opin. Plant Biol. 2009, 12, 250–258. [Google Scholar] [CrossRef]
  75. Mitra, G. Essential plant nutrients and recent concepts about their uptake. In Essential Plant Nutrients; Naeem, M., Ansari, A., Gill, S., Eds.; Springer: Cham, Switzerland, 2017; pp. 3–36. ISBN 9783319588414. [Google Scholar]
  76. Bassirirad, H. Kinetics of nutrient uptake by roots: Responses to global change. New Phytol. 2000, 147, 155–169. [Google Scholar] [CrossRef]
  77. Cockson, P.; Schroeder-Moreno, M.; Veazie, P.; Barajas, G.; Logan, D.; Davis, M.; Whipker, B.E. Impact of phosphorus on Cannabis sativa reproduction, cannabinoids, and terpenes. Appl. Sci. 2020, 10, 7875. [Google Scholar] [CrossRef]
  78. Pardo, J.M.; Quintero, F.J. Plants and sodium ions: Keeping company with the enemy. Genome Biol. 2002, 3, 1–4. [Google Scholar] [CrossRef]
  79. Monaci, F.; Leidi, E.O.; Mingorance, M.D.; Valdés, B.; Oliva, S.R.; Bargagli, R. Selective uptake of major and trace elements in Erica andevalensis, an endemic species to extreme habitats in the Iberian Pyrite Belt. J. Environ. Sci. 2011, 23, 444–452. [Google Scholar] [CrossRef]
  80. Qin, S.; Liu, H.; Nie, Z.; Rengel, Z.; Gao, W.; Li, C.; Zhao, P. Toxicity of cadmium and its competition with mineral nutrients for uptake by plants: A review. Pedosphere 2020, 30, 168–180. [Google Scholar] [CrossRef]
  81. Drechsler, N.; Zheng, Y.; Bohner, A.; Nobmann, B.; von Wirén, N.; Kunze, R.; Rausch, C. Nitrate-dependent control of shoot K homeostasis by the nitrate transporter1/peptide transporter family member NPF7.3/NRT1.5 and the Stelar K+ outward rectifier SKOR in arabidopsis. Plant Physiol. 2015, 169, 2832–2847. [Google Scholar] [CrossRef] [PubMed]
  82. White, P.J. Long-distance Transport in the Xylem and Phloem. In Marschner’s Mineral Nutrition of Higher Plants, 3rd ed.; Marchner, P., Ed.; Elsevier Ltd.: Amsterdam, The Netherlands, 2012; pp. 49–70. ISBN 9780123849052. [Google Scholar]
  83. Broadley, M.; Brown, P.; Cakmak, I.; Rengel, Z.; Zhao, F. Function of nutrients: Micronutrients. In Marschner’s Mineral Nutrition of Higher Plants; Marschner, P., Ed.; Academic Press: Cambridge, MA, USA, 2012; pp. 191–248. ISBN 9780123849052. [Google Scholar]
  84. Rahman, H.; Sabreen, S.; Alam, S.; Kawai, S. Effects of nickel on growth and composition of metal micronutrients in barley plants grown in nutrient solution. J. Plant Nutr. 2007, 28, 393–404. [Google Scholar] [CrossRef]
  85. Siebrecht, S.; Herdel, K.; Schurr, U.; Tischner, R. Nutrient translocation in the xylem of poplar—Diurnal variations and spatial distribution along the shoot axis. Planta 2003, 217, 783–793. [Google Scholar] [CrossRef]
  86. Mclaughlin, S.B.; Wimmer, R. Calcium physiology and terrestrialecosystem processes. New Phytol. 1999, 142, 373–417. [Google Scholar] [CrossRef]
  87. Kobayashi, T.; Nishizawa, N.K. Iron uptake, translocation, and regulation in higher plants. Annu. Rev. Plant Biol. 2012, 63, 131–152. [Google Scholar] [CrossRef] [PubMed]
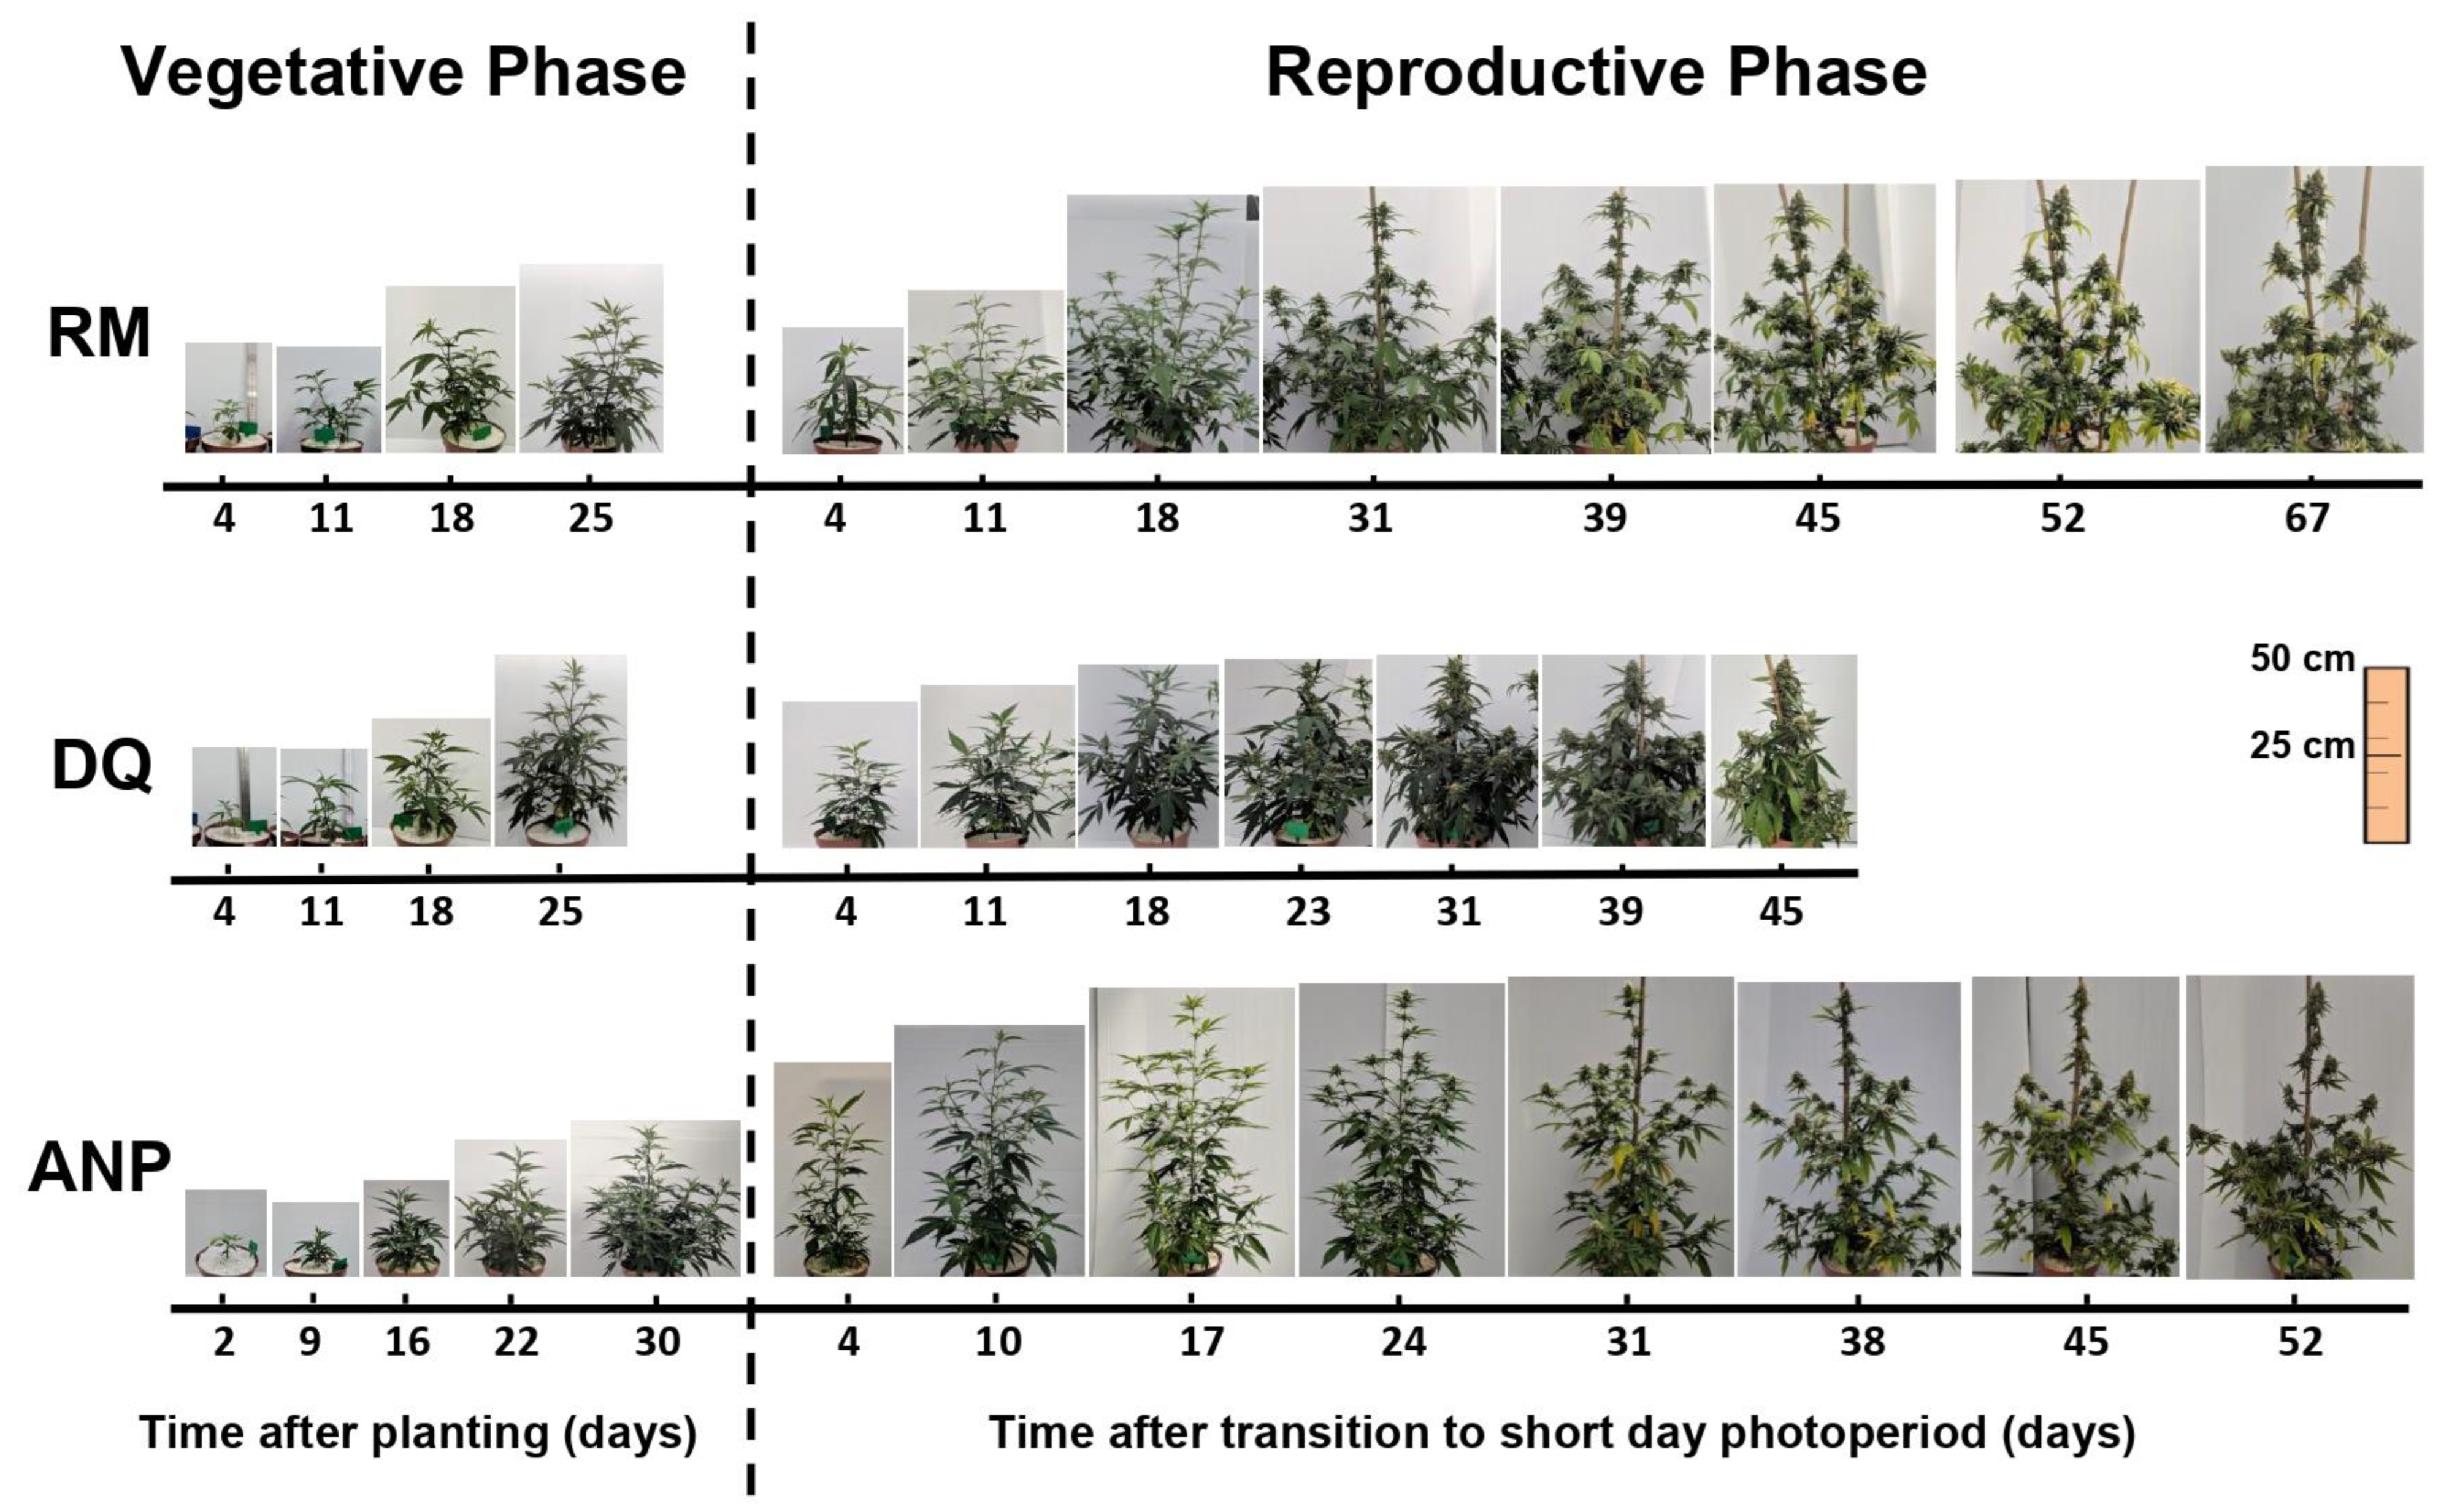
Figure 1. Visual appearance of three medical cannabis cultivars Royal Medic (RM—top row), Desert Queen (DQ—middle row), and Annapurna (ANP—bottom row) during vegetative and reproductive development.
Agronomy 13 02865 g001
Figure 2. Biomass accumulation in three medical cannabis cultivars (RM, DQ, ANP) during vegetative and reproductive development: Plant dry weight (A) and root:shoot ratio (B). In (A), solid lines represent vegetative growth (long photoperiod); scattered lines represent reproductive growth (short photoperiod). In (B), the dashed line marks the transition to the reproductive growth phases. Presented data are averages ± SE (n = 5). Results of two-way ANOVA indicated as ** p < 0.05, F-test; NS, not significant p > 0.05, F-test. In the ANOVA results, T*G represents the interaction between time and genotype. p values are presented at the Supplementary Materials, File S1.
Agronomy 13 02865 g002
Figure 3. Biomass accumulation in organs of three medical cannabis cultivars (RM, DQ, ANP) during vegetative and reproductive development: Dry weights of fan leaves (A), stem (B), roots (C), and inflorescences (D). Solid lines represent vegetative growth (long photoperiod); dashed lines represent reproductive growth (short photoperiod). Presented data are averages ± SE (n = 5). Root biomass was measured once at the vegetative phase. Results of two-way ANOVA indicated as **, p < 0.05, F-test; NS, not significant p > 0.05. In the ANOVA results, T*G represents the interaction between time and genotype. p values are presented at the Supplementary Materials, File S1.
Agronomy 13 02865 g003
Figure 4. Gas exchange activity and physiological characteristics of three medical cannabis cultivars (RM, DQ, ANP) during vegetative and reproductive development: Photosynthesis (A), transpiration (B), stomatal conductance (C), intercellular CO2 concentration (D), relative water content (RWC) (E), osmotic potential (F), intrinsic water-use efficiency (WUEi) (G), and membrane leakage (H). Dashed line marks the transition to the reproductive growth phases. Presented data are averages ± SE (n = 5). Results of two-way ANOVA indicated as ** p < 0.05, F-test; NS, not significant p > 0.05, F-test. T*G represents the interaction between time and genotype. p values are presented at the Supplementary Materials, File S1.
Agronomy 13 02865 g004
Figure 5. Changes in concentrations of photosynthetic pigments throughout the development of cannabis plants, in three cultivars of medical cannabis (RM, DQ, ANP), during vegetative and reproductive development: Chlorophyll a (A), chlorophyll b (B), and carotenoids (C). The dashed line marks the transition to the reproductive growth phases. Presented data are averages ± SE (n = 5). Results of two-way ANOVA indicated as ** p < 0.05, F-test; NS, not significant p > 0.05, F-test. T*G represents the interaction between time and genotype. The p value for G (genotype) was 0.0123 in subfigure B, and <0.001 for all other variables in all subfigures.
Agronomy 13 02865 g005
Figure 6. Uptake curves. The amount of nutrients present in the shoot of cannabis plants during vegetative and reproductive development, for three medical cannabis cultivars (RM, DQ, ANP): N (A), P (B), K (C), Fe (D), Ca (E), Mg (F), Mn (G), Zn (H), Cu (I), and Na (J). Solid lines—vegetative growth (long photoperiod); scattered lines—reproductive growth (short photoperiod). Presented data are averages ± SE (n = 5). Results of two-way ANOVA indicated as ** p < 0.05, F-test; NS, not significant p > 0.05, F-test. T*G represents the interaction between time and genotype. p values are presented at the Supplementary Materials, File S1.
Agronomy 13 02865 g006
Figure 7. Deposition Rate Curves. Deposition rates of minerals into cannabis plants, for three medical cannabis cultivars (RM, DQ, ANP). Presented data are the daily amounts of minerals taken up by a plant, throughout the vegetative and reproductive development: N (A), P (B), K (C), Fe (D), Ca (E), Mg (F), Mn (G), Zn (H), Cu (I), and Na (J). Solid lines represent vegetative growth, and scattered lines—reproductive growth. Presented data are averages ± SE (n = 5). Results of two-way ANOVA indicated as ** p < 0.05, F-test; NS, not significant p > 0.05. In the ANOVA results, T*G represents the interaction between time and genotype. p values are presented at the Supplementary Materials, File S1.
Agronomy 13 02865 g007
Figure 8. Translocation factor (TF) of three medical cannabis cultivars (RM, DQ, ANP) during vegetative and reproductive development: N (A), P (B), K (C), Fe (D), Ca (E), Mg (F), Mn (G), Zn (H), Cu (I), and Na (J). Presented data are averages ± SE (n = 5). Results of two-way ANOVA indicated as ** p < 0.05, F-test; NS, not significant p > 0.05. P*G represents the interaction between growth phase (P) and genotype (G). p values are presented at the Supplementary Materials, File S1.
Agronomy 13 02865 g008
Disclaimer/Publisher’s Note: The statements, opinions and data contained in all publications are solely those of the individual author(s) and contributor(s) and not of MDPI and/or the editor(s). MDPI and/or the editor(s) disclaim responsibility for any injury to people or property resulting from any ideas, methods, instructions or products referred to in the content.