Article

Influence of Interannual Climate Conditions on the Composition of Olive Oil from Centenarian Olive Trees

1
Centro de Investigação de Montanha (CIMO), Instituto Politécnico de Bragança, Campus de Santa Apolónia, 5300-253 Bragança, Portugal
2
Laboratório Associado para a Sustentabilidade e Tecnologia em Regiões de Montanha (SusTEC), Instituto Politécnico de Bragança, Campus de Santa Apolónia, 5300-253 Bragança, Portugal
3
Departamento de Ingeniería Agrária, Universidad de Léon, Av. Portugal, n° 41, 24071 Léon, Spain
4
LAQV/REQUIMTE, Laboratory of Bromatology and Hydrology, Faculty of Pharmacy, University of Porto, Rua de Jorge Viterbo Ferreira, 228, 4050-313 Porto, Portugal
*
Author to whom correspondence should be addressed.
Agronomy 2023, 13(12), 2884; https://doi.org/10.3390/agronomy13122884
Submission received: 17 October 2023 / Revised: 17 November 2023 / Accepted: 22 November 2023 / Published: 24 November 2023
(This article belongs to the Special Issue Climate Change and Agriculture—Sustainable Plant Production)

Abstract

:
In recent years, occurrences of heat waves and drought have become increasingly frequent, highlighting the undeniable impact of climate change. The rise in temperatures and decline in rainfall have had severe repercussions on olive trees’ behavior and olive oil production. This study aims to evaluate the effects of two-year climate variations on olive oils from centenarian olive trees situated in the Côa Valley region of Northern Portugal. A selection of 25 centenarian plants was made, and the climate influence on fatty acid content, tocopherols, individual phenols, oxidative stability, and antioxidant activity was assessed over two consecutive years. During the second year of the study, a significant variation (p-value < 0.05) in the proportion of palmitic acid was observed, which increased from 12.9% to 13.6%. Conversely, stearic and arachidic acids exhibited a decrease from 2.7% to 2.3% and from 0.37% to 0.35%, respectively. Analysis of the oils revealed a noteworthy difference (p-value < 0.05) in the concentration of β-tocopherol. The concentration of oils derived from hydroxytyrosol and tyrosol significantly decreases (p-value < 0.005) during the second year. Additionally, significant differences (p-value < 0.005) were observed in the total phenol content and the percentage of ABTS inhibition, both of which decreased in the second year. These findings reinforce the notion that climatic conditions play a key role in shaping the composition of olive oils.

1. Introduction

In recent years, agriculture has been significantly affected by climate change, resulting in negative consequences for crop yield, product composition, and overall food security [1,2,3,4]. These global changes have had a noticeable impact on various regions, including the Mediterranean, where frequent occurrences of higher temperatures, erratic precipitation patterns, and extreme winter and summer droughts have been observed [5,6]. These events have raised concerns about the ability of traditional crops, particularly the olive tree (Olea europaea L.), which thrives in both hot and dry summers and moderately cold and wet winters, to cope with the adverse effects of climate change [7,8,9,10,11].
Numerous studies have investigated the influence of climate conditions on the chemical properties of olive oils [12,13,14,15,16,17]. The composition of olive oil primarily consists of triglycerides, other glycerol esters, and some free fatty acids, accounting for approximately 99% of the oil’s content. It also contains high amounts of phenols [18,19], sterols, fat-soluble vitamins, chlorophylls and carotenoids, which are synthesized through various biosynthetic pathways, triglycerides [20], sterols [21], tocopherols, and fatty acids [20,22,23], among other compounds. The concentrations and types of compounds present in olive oil are influenced by genetic factors, as well as geographic and climatic conditions, cultivation practices, tree age, olive maturation at harvest, extraction methods, and storage [24,25]. Generally, olive oils obtained from olives grown in colder regions tend to have higher levels of antioxidants and monounsaturated fatty acids (MUFA, such as oleic acid and the oleic/linoleic acid ratio), while oils produced in warmer regions are richer in saturated (SFA) and polyunsaturated acids (PUFA) like palmitic and linolenic acids, respectively [26,27,28,29]. The relationship between rainfall and the inhibition of phenol and tocopherol synthesis has also been explored, revealing an increase in their contents under stressful conditions. There have been several works that have studied the oils obtained from centenary olive trees in order to enhance this heritage [30,31,32,33]. Furthermore, several authors have reported that centenarian olive trees produce fruits that originate oils with exceptional nutritional and sensory characteristics [29,33,34].
Considering the constant climatological situations, it is crucial to assess the production performance of different olive tree cultivars under diverse climate conditions. Therefore, the objective of this study is to evaluate the effects of climate conditions in the Vale do Côa region on the composition of olive oil obtained from centenarian olive trees. The study spanned two consecutive years and recorded changes in vital bioactive compounds closely linked to the oils’ nutritional quality and oxidative stability. The observed variations in the examined physicochemical parameters can be primarily attributed to climatic conditions, as each olive oil sample was extracted using the same pilot scale extraction facility and processing conditions (e.g., temperature and malaxation time). Additionally, the olives were manually harvested from a selection of 25 centenarian trees at the same maturation stage.

2. Materials and Methods

2.1. Selection, Harvest, and Extraction

A total of twenty-five specimens of centenarian olive trees were selected and georeferenced in eight dispersed plots in the Côa Valley region (Portugal). The selection was based on several parameters that indicate its advanced age, such as structural integrity, general appearance, and information provided by the producers. Each plant was selected, marked, and georeferenced which allowed their harvest in the in the different years of study. The plants integrate the traditional olive groves of the region, which are rainfed and follow similar agronomic practices and low vegetative development. In general, plants were only slightly pruned every year, with slight impacts on production, and no major annual fluctuations were observed. The selected plants are uncharacterized centenarian specimens, and no information is available about the variety. The soil is a schist leptosol, with a very thin and poor layer, with an approximate slope of 20 to 30%; the plants are planted at 10 × 10 m, with 100 plants per hectare. In the years under study, no phytosanitary treatment was carried out, the soil was mobilized in spring and autumn to control weeds, and in April, fertilization was applied using a compound fertilizer (7:14:14), consisting of 7% N (5% ammoniacal N and 2% urea N), 14% P2O5 (11% water soluble), and 14% K2O. The plants were analyzed over two consecutive seasons (2020 and 2021). For a comprehensive analysis, approximately 4–5 kg of olives per specimen were collected to ensure a representative sample. The harvest period occurred from 25th to 31st of October in 2020, and from 2nd to 10th of November in 2021, approximately 150 to 160 days after the flowering. The fruits were collected when they reached a maturity index between M2 and M3, as per the guidelines set by the International Olive Council [35]. These indices are characterized by fruit skins with red spots covering less than half (M2) or more than half (M3) of the olive. Within 24 h of harvesting, oils were extracted using an Abencor pilot plant (Comercial Abengoa S.A., Seville, Spain).
The milling process employed the MC2 MM100 hammer mill (Seville, Spain), equipped with a 5.5 mm diameter sieve and a 1.5 kW single-phase motor. Subsequently, the resulting olive paste underwent temperature-controlled malaxation in a MC2 Thermo-Mixer TB-100 (Seville, Spain). This machine offered eight work stations and eight mixing flasks, each with temperature control and individual blades to ensure thorough mixing. Finally, the olive paste underwent centrifugation using the MC2 Centrifugal Machine CF-100 (Seville, Spain). This machine featured a stainless-steel drum rotating at 3500 rpm, driven by a 1.5 kW three-phase motor, and included an automatic timer. To eliminate solid particles and residual water, the samples were filtered using Whatman no. 4 paper over anhydrous sodium sulfate. Finally, the extracted oil was stored in 125 mL dark glass bottles and kept in a dark place at room temperature situated between 20 and 25 °C for subsequent analysis.

2.2. Meteriological Data

In order to assess the impact of yearly climate conditions on the quality of olive oil, parameters like the temperature (minimum—TMIN, average—TAVE, and maximum—TMAX), and precipitation for the two harvest years (2020 and 2021) were collected for the months of fruit development and fruit maturation. The meteorological data used in this study were obtained from the IPMA—Portuguese Institute for the Sea and the Atmosphere. These data were collected from weather stations located closest to the study areas, specifically the Moncorvo station (Station No.: 0654; Latitude: 41.1899°; Longitude: −7.0185°; Altitude: 539 m). The collected data covers the months from June to November (2020 and 2021), as shown in Figure 1.

2.3. Fatty Acid Profile

The relative percentages of fatty acid levels were determined using chromatography, following the guidelines outlined in document COI/T.20/Doc. No 28/Rev. 3, dated November 2022 [36]. The analysis was conducted using a Chrompack CP 9001 (Burladingen, Germany) chromatograph equipped with a split-splitless injector set at 230 °C, an FID detector at 250 °C, and an automatic sampler Chrompack CP-9050 (Burladingen, Germany). For the analysis, a 1 μL injection (at a 1:50 proportion) was made, and separation was achieved using a fused silica capillary column (Select FAME: 50 m × 0.25 mm i.d. Varian, Palo Alto, CA, USA) manufactured by Agilent. Helium was employed as the carrier gas, with an internal pressure maintained at 140 kPa. The determination of relative percentages was carried out by internally normalizing the chromatographic peak area between myristic and lignoceric methyl esters. To identify and quantify the peaks, a standard mixture of certified fatty acid methyl esters obtained from Sigma (Barcelona, Spain) was used.

2.4. Tocopherol Contents

The determination of α-, β-, and γ-tocopherol levels was conducted utilizing high-performance liquid chromatography (HPLC) following the methodology outlined in ISO 9936:2016 [37], with certain modifications. To begin, 50 mg of filtered and diluted olive oil in n-hexane (Sigma-Aldrich, Germany) was combined with the internal standard tocol (2-methyl-2-(4,8,12-trimethyltridecyl) chroman-6-ol from Matreya Inc. (Pleasant Gap, PA, USA). Subsequently, the mixture underwent centrifugation at room temperature, with a speed of 13,000 rpm for 5 min, and the resulting supernatant was collected for HPLC analysis. The HPLC equipment employed a normal phase silica column (SupelcosilTM LC-SI; dimensions: 7.5 cm × 3 mm; particle size: 3 μm, from Supelco, Bellefonte, PA, USA) maintained at a temperature of 23 °C. Elution was performed using a mobile phase consisting of 1,4-dioxane (Sigma-Aldrich—Allentown, PA, USA) in n-hexane (2.5%, v/v) at a flow rate of 0.75 mL/min. Analysis of the data was carried out utilizing the ChromNAV Control Center program—JASCO Chromatography Data Station (Jasco, Tokyo, Japan), and the identification of compounds was achieved by comparing their retention times with authentic standards obtained from Sigma (Barcelona, Spain). The final results were expressed as milligrams per kilogram (mg/kg) of olive oil and the content of vitamin E was calculated as the sum of concentrations of α-, β-, and γ-tocopherols.

2.5. Olive Oils Total Content of Hydroxytyrosol and Tyrosol Derivatives after Acid Hydrolysis of Secoiridoids

The phenolic profile of oils obtained from centenary olive trees in different years was evaluated following the methodology described by Marx et al. [38]. For this, an HPLC-DAD system from Jasco (Tokyo, Japan) was used with a data transmitter (LC–NetII/ADC), two integrated pumps (PU–4180), an automatic sampler (AS–4050), a column oven (ECOM Eco2000, Zlin, Czech Republic), and the DAD (MD–4010). The separation of compounds was performed on a C18 reversed phase column (Kinetex C18; particle size: 2.6 μm; pore size: 100 Å; LC length: 100 mm; internal diameter: 3.00 mm, Phenomenex, Madrid, Spain), at 35 °C, using a mobile phase composed of water and acetonitrile, both with 0.1% formic acid, at a flow rate of 0.8 mL/min for 20 min. All samples were injected in duplicates. The total contents of hydroxytyrosol or tyrosol after hydrolysis were expressed as the individual sum in mg of hydroxytyrosol or tyrosol, respectively, per kg of oil. Calibration curves of hydroxytyrosol and tyrosol (R2 = 0.9992 and 0.9990, respectively) were prepared in methanol/water (80:20, v/v) in a concentration range of 0.00031 to 0.0160 mg/mL.

2.6. Oxidative Stability, Total Reducing Capacity, and Antioxidant Activity

The Rancimat 743 equipment (Metrohm CH, Herisau, Switzerland) was used to assess the oxidative stability (OS) of the samples. Three grams of olive oil were heated at a temperature of 120.0 ± 1.6 °C, while clean, filtered, and dry air was supplied at a flow rate of 20 L/h. Volatile compounds released during heating were collected in water, and the water conductivity (μS/cm) was continuously monitored. The point at which the conductivity curve exhibited an inflection corresponded with the OS value (in h).
To determine the total phenolic compounds, extracts of the oils were obtained through methanol–water microextraction. The evaluation was performed using a UV-Vis spectrophotometer (VIS/UV-1280 Shimadzu) at 765 nm, as previously described [39]. For the microextraction, 1 mL of methanol–water and 0.5 g of oil were combined in an Eppendorf tube, vigorously mixed on a vortex for 1 min, and then centrifuged for 5 min at 13,200 rpm. The resulting supernatant was collected and transferred to a 10 mL vial. This centrifugation process was repeated two more times, with an additional 1 mL of methanol–water added before each repetition. The supernatants were collected and combined in the same vial, ensuring a final volume of 5 mL with methanol–water. Next, a solution was prepared by adding 1500 μL of ultrapure water, 0.1 μL of Folin–Ciocalteu reagent, and 100 μL of the extract. The mixture was vortexed and allowed to stand in the dark for 3 min. Afterward, 300 μL of 20% (w/v) sodium carbonate solution was added, vortexed again, and kept in the dark for 1 h at room temperature (20–22 °C). Finally, the absorbance of the sample was measured at 765 nm, and the quantification was made using a calibration curve correlating the absorbance with the gallic acid concentration of a methanolic solution (R2 ≥ 0.9999). The results were expressed as milligrams of gallic acid equivalents [GAE] per kilogram of oil.
The antioxidant activity of the samples was evaluated by measuring their total reducing power and ABTS (2,2′-azinobis (3-ethylbenzothiazoline-6-sulfonic acid)) scavenging ability. The total reducing power was determined by assessing the elimination of the DPPH (2,2-diphenyl-1-picrylhydrazyl) radical using a spectrophotometer (UV-VIS/UV-1280 Shimadzu spectrophotometer) at 517 nm and 20 °C. For this analysis, sample extraction was conducted using methanol–water microextraction. A DPPH control solution was prepared by mixing 0.1 mL of methanol with 3.9 mL of DPPH (0.06 mM) and allowing it to stand in the dark for 30 min before measuring the absorbance. For the olive oil samples, 0.1 mL of the methanolic extract was added to 3.9 mL of DPPH (0.06 mM), and the solution was left in the dark for 30 min before measuring the absorbance. The results were expressed as the percentage reduction in DPPH activity. The ability of the samples to inhibit the ABTS radical, in comparison to a standard antioxidant reference (trolox), was determined following the methodology previously described [40]. To generate the ABTS radical, 440 μL of K2S2O8 (140 mM) was added to 25 mL of ABTS (7 mM), and the solution was kept in the dark for 12–16 h, at room temperature. After the specified time, the solution was diluted in ethanol until the absorbance, at 734 nm, reached 0.70 ± 0.02. Finally, 100 μL of olive oil was added to 2 mL of the adjusted ABTS solution, and the average absorbance was measured at 734 nm. The results were expressed as the percentage of inhibition.

2.7. Statistical Analysis

The statistical differences in the composition and characteristics of the oils between two consecutive harvest years (2020 and 2021) were assessed using the t-Student test. The application of the Welch’s correction depended on whether equal or unequal variances between the groups could be assumed, as determined by the F-test. PCA was employed as an unsupervised pattern recognition tool to determine if the evaluated composition and characteristics of the olive oils (such as OS, antioxidant activity, tocopherols and phenolics contents, and fatty acids profile) could differentiate the oils based on the crop year. Additionally, LDA was used, in conjunction with the SA algorithm to identify the most influential non-redundant discriminative parameters. These parameters were selected based on the best correct classification performances (i.e., sensitivities) achieved during training and LOO-CV internal validation. The statistical analysis was conducted using the R statistical program, specifically the open-source packages available in RStudio version 2021.09.0, also known as the “Ghost Orchid” Release (077589bc, 20 September 2021); the significance level was set at 5%.

3. Results and Discussion

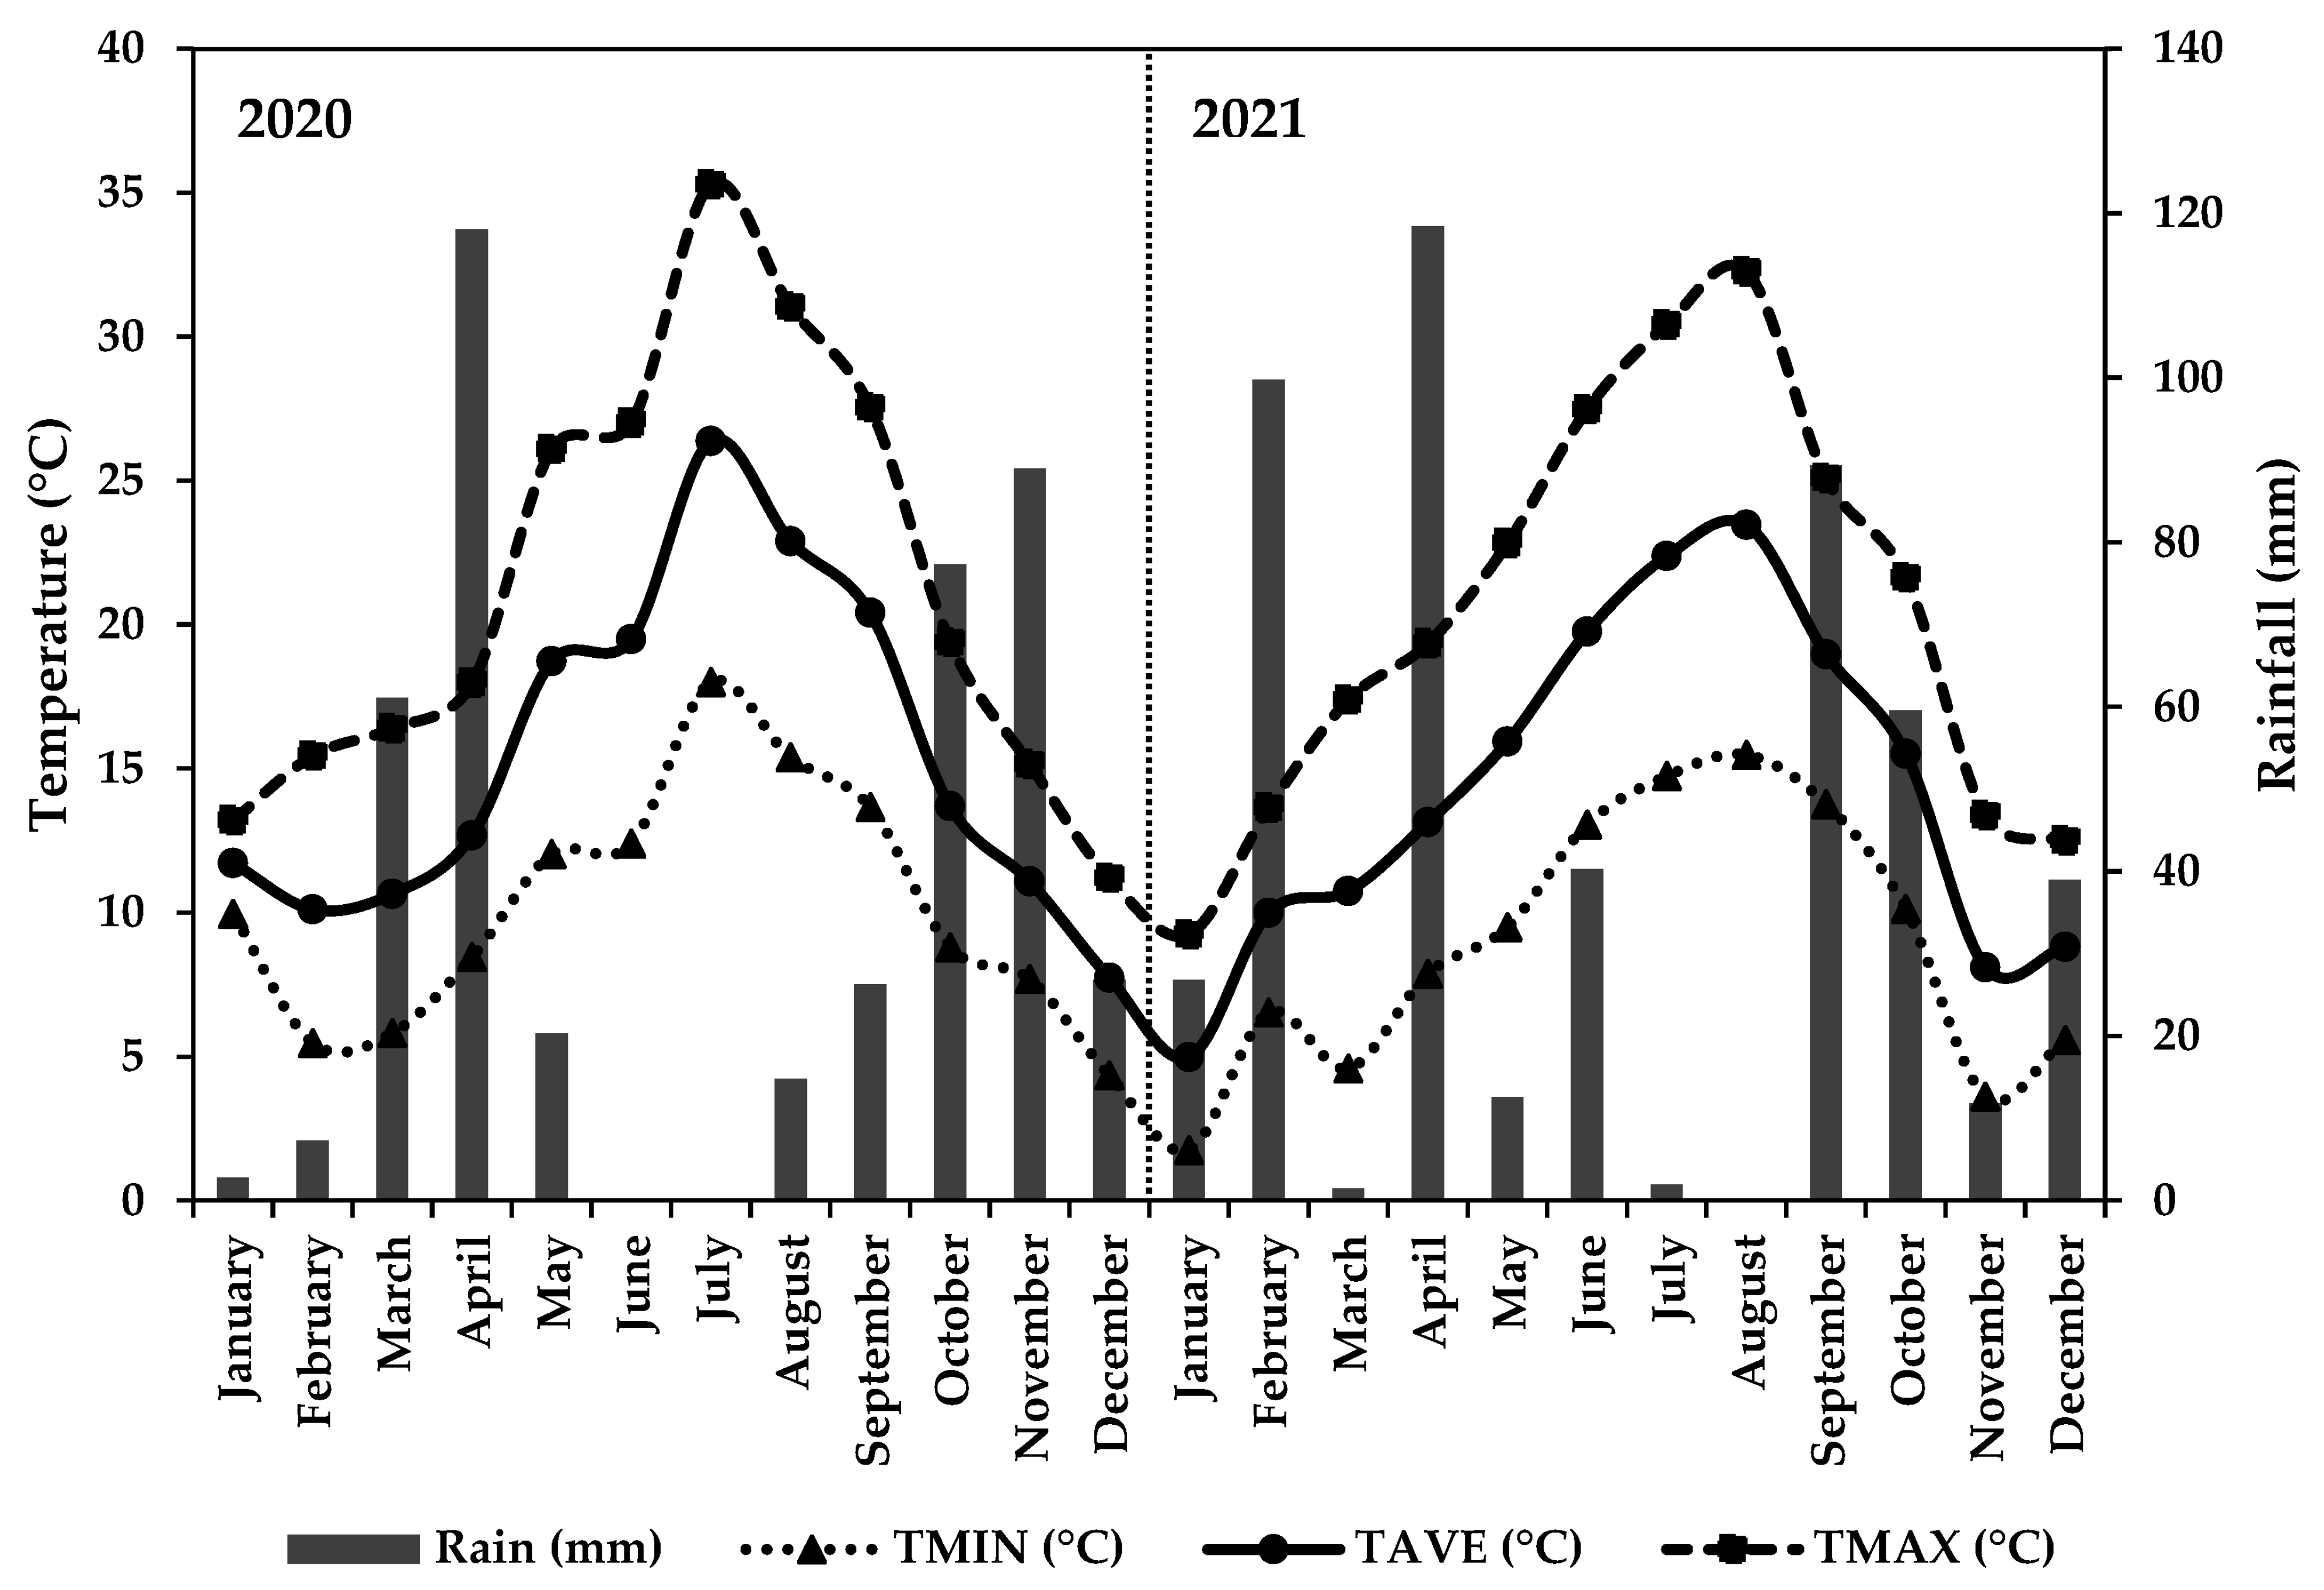
3.1. Meteorological Data

The meteorological data uncovered variations in both the volume and temporal distribution of rainfall and temperature across the time-periods considered for both years (Figure 1). Specifically, in 2020, the distribution of rainfall followed a more consistent pattern, characterized by a dry period in June and a gradual increase in precipitation starting from August and culminating in a peak in November (88.9 mm). Conversely, 2021 exhibited significant rainfall levels in June (40.30 mm), followed by a dry phase and a subsequent surge in precipitation, with the highest amounts observed in September (89.30 mm).
Additionally, differences in temperature were observed between the two years. In 2020, the warmest period occurred in July, registering maximum temperatures of 35.9 °C, followed by a gradual decline in subsequent months, reaching the lowest minimum in November (7 °C). Conversely, in 2021, temperatures remained elevated, with the highest value recorded in August (32.26 °C) and notable minimums in November (3.6 °C).
By examining the maximum temperatures within the time periods, it became evident that the peak temperature in the second year was slightly delayed compared to the first year. In 2020, July stood out as the hottest month, while in 2021, the maximum temperatures were observed in August. Overall, temperatures were generally higher in 2020.

3.2. Fatty Acid Composition

This study aimed to investigate the impact of climatic conditions on the concentration of fatty acids in olive oil. To achieve this, olive oil samples were obtained from olive trees aged over 100 years during two consecutive harvest seasons, namely 2020 and 2021. All samples met the concentration standards set by the International Olive Council [36]. The fatty acid composition, expressed as relative percentages, exhibited typical proportions of major fatty acids found in olive oils. The most abundant fatty acid was oleic acid (59–79%), followed by palmitic acid (9–16%) and linoleic acid (2–18%). On the other hand, stearic acid (1–3%), palmitoleic acid (0.5–2%), linolenic acid (0.6–1.2%), arachidic acid (0.2–0.4%), and eicosenoic acid (0.2–0.3%) were present in the lowest concentrations (Table 1).
The results of the study indicated that the composition of the oils was influenced by the year of harvest. Specifically, a significant variation (p-value < 0.05) was observed in the proportion of palmitic acid, which increased from 12.9% to 13.6%. Individually, it was observed that 44% of the studied plants increased their palmitic acid content in the second year of harvest. It was found that 8% of the plants had a lower content of this compound, and 48% of the plants did not observe any effects during the year (Table S1 of the Supplementary Materials). In contrast, stearic acid concentrations decreased by 2.7–2.3%, i.e., 84% of the studied plants dropped their content in the second year. The same was observed for arachidonic acid, which decreased by 0.37–0.35%; that is, 44% of the plants under study (Table S1). No significant variations were observed in the remaining fatty acids or proportion of total saturated (SFA), monounsaturated (MUFA), and polyunsaturated (PUFA) fatty acids (Table 1). These findings are consistent with other studies conducted in different regions [15,31,41]. Rey-Giménez et al. [15] reported similar observations, noting that warmer years, particularly during the fruit development period, led to higher concentrations of palmitic acid, reaching up to 15.2%. In colder climates, concentrations were found to be around 13.5%.
These studies, along with others, suggest that such conditions may increase the levels of SFA and PUFA, while decreasing MUFA [28]. In extreme temperatures and arid climates, such as in desert regions, palmitic acid levels may exceed the permissible 20% threshold, while oleic acid values may fall below 50% [26]. The region’s climatic data were analyzed over two years, revealing consistent patterns in temperature and precipitation during 2020. Rainfall began in August with a total of 14.8 mm and reached its peak in November at 88.9 mm. Concurrently, temperatures gradually decreased from 35 °C in July to 19.3 °C in October and 15.1 °C in November (Figure 1). In contrast, 2021 exhibited irregularities, with rainfall occurring early in June at 40.3 mm and reaching its maximum level in September at 89.9 mm. The rainfall values for July, August, and September were abnormal for this time, resulting from a storm that caused heavy rains. Excessive water from storms was not infiltrated into the soil, depriving the crops of the benefits of precipitation during this period. This phenomenon of heavy rainfall induced by storms is a consequence of climate change experienced in recent years. In August, high temperatures and dry conditions were observed, with a peak temperature of 32.2 °C. Compared to the previous year, October and November saw a temperature increase of 2 °C, measuring 21.6 °C and 17.6 °C, respectively (Figure 1). Additionally, the 2 °C temperature rise and significant decrease in precipitation during the harvest period in October and November could have affected the synthesis of palmitic acid. The reduction in the concentration of stearic acid in 2021 might be attributed to its association with the elongation of palmitic acid [42]. Conversely, the concentrations of arachidonic acid, which were already low, were easily influenced by the erratic climatic conditions experienced throughout the year. Some authors state that genetic factors determine the composition of fatty acids in olive oil, while others state that climatic conditions also have a significant impact. Therefore, it is essential to study the oil content of centenarian olive trees in different regions with varying climates to understand their resilience and unique composition. For example, a study conducted by Rodrigues et al. [33] investigated centenarian olive trees in Portugal during a period from August to September, characterized by intense droughts and less than 30 mm of precipitation. They observed significant variations in the concentration of palmitic acid in the olive oils, depending on the specific olive cultivar. The cv. Redondal exhibited an increase in palmitic acid concentration of 12–13%, while the cv. Madural showed a decrease by 11–12%. The levels of stearic acid and arachidic acid found in this study were consistent with previous findings, ranging from 1–3% and 0.3–0.5%, respectively. Similarly, Hijawi [41] examined centenarian olive trees in Palestine and discovered fluctuations in oils’ fatty acid concentration based on the year. Palmitic acid levels ranged from 11.9–14.6% in one year and 10.9–14.9% in another, while stearic acid concentrations ranged from 2.2–4.5% and 3.7–4.4%, respectively. The levels of arachidic acid were 0.3–0.7% in one year and 0.6–0.9% in another, indicating high levels of this compound.
The fruit growth phase occurs from June to August, followed by oil formation and fruit maturation from September to November. In 2021, unusual rainfall patterns were observed during these months. While the normal fruit formation period experienced 40.3 mm of rainfall in June, the maturation months saw a shift in rainfall to September (89.9 mm), October (59.6 mm), and November (11.8 mm). These rainfall values in August and September deviate from the typical pattern and were the result of two stormy days with heavy rains. It is known that droughts during the maturation phase, which usually starts in September, negatively affect the fat content of the fruits [28,43]. The increased rainfall in October and November, combined with a 2 °C temperature rise compared to 2020, may have influenced the higher level of palmitic acid. However, due to the high intensity of rainfall, the water ran off without infiltrating the soil, resulting in the plants being unable to utilize this water effectively or create a water reservoir for their needs. Temperature conditions between flowering and harvesting also impact fruit characteristics [44]. Elevated temperatures during the maturation period generally lead to higher levels of SFA and PUFA but lower levels of MUFA [26,45,46]. However, in the present study, for these parameters, no significant differences were observed between years. However, a more detailed analysis of the results, genotype by genotype, can be found in the tables included in the Supplementary Materials. These tables show that there are some significant inter-annual differences on the oils’ compositions, being the observed changes depending on the genotype, i.e., increasing/decreasing trends were observed and differ from genotype to genotype. However, for the main compounds, similar trends (increasing/decreasing) for the majority of the studied genotypes were observed. For example, regarding the fatty acid’s relative abundance, for SFA, MUFA, and PUFA, the year had a significant effect in the related contents found in 20%, 48%, and 76% of the oils/genotypes. Concerning tocopherols, the year showed a significant effect on the vitamin E content of the oils extracted in 68% of the studied genotypes, with an increasing content observed in 60% of those genotypes. Also, although the annual variation of the total content of hydroxytyrosol + tyrosol after acids hydrolysis was genotype-dependent, a decreasing trend was observed in 64% of the oils extracted from each single genotype. On the other hand, the oxidative stability and the total phenolic content showed an increasing trend with the year in the oils extracted from 60% and 88% of the studied genotypes, but the DPPH and ABTS antioxidant capacities showed a decreasing trend for 88% and 68% of the oils extracted from the studied genotypes.

3.3. Tocopherols Content

The total amounts of vitamin E are variable, clearly depending on several factors, such as the cultivar, fruit maturation, environmental conditions, agronomic factors (for example, irrigation, fertilization, incidence of pests and diseases), and the conditions used during production of oil extraction, storage, etc. [13]. The analysis of the olive oils revealed the presence of α-, β-, and γ- vitamers, which were quantified. Among these vitamers, α-tocopherol was the predominant form in olive oils, constituting over 90% of the total amount as expected in olive oil [10]. Analysis of data from 2020 and 2021 (Table 2) showed that α-tocopherol levels ranged from 121 to 362 mg/kg in 2020 and from 134 to 323 mg/kg in 2021, with no significant differences between the two crop years. However, a significant difference related to the crop year (p-value < 0.05) was observed for β-tocopherol, which increased from 1.3 to 2.0 mg/kg; that is, 68% of the plants under study increased the content of this compound in the second year (Table S2). Although no significant differences in α-tocopherol were observed in the present study, there are several authors who report that there are certain factors that affect the amount of this vitamer, namely the maturation of the fruit influences the amount, decreasing during ripening [17], the cultivar [13], low temperatures, and precipitation also influence the amount of vitamer (less precipitation, higher content) [47].
The average concentration of vitamin E in the oils was 260 mg/kg, with a maximum value of 369 mg/kg (Table 2). These findings align with the existing literature on olive oils, where vitamin E concentrations typically range from 80 to 500 mg/kg [17], and β-tocopherol concentrations typically vary from 1 to 2 mg/kg, consistent with previous studies [34].
Examining climate data for the two crop years, special attention is given to 2021, characterized by higher temperatures in compared to July (Figure 1). These rainfall values are unusually high for this period, which typically experiences no rainfall. These fluctuations during the months of oil accumulation and fruit ripening may have contributed to a significant decrease in β-tocopherol levels. It is known that β-tocopherol declines during ripening and can exhibit significant variations due to external conditions, particularly considering its naturally low concentration [48]. Previous studies have emphasized the influence of climate on tocopherol composition, suggesting that regions with lower rainfall levels tend to have higher levels of α-tocopherol, due to the plant’s synthesis of this compound in response to water stress. Additionally, low temperatures during the harvest period can negatively impact tocopherol concentrations [25].
In non-Mediterranean climates, olive oils have been found to have higher concentrations of β-tocopherol compared to the present study, ranging from 2 to 6 mg/kg, while alpha-tocopherol concentrations were below 250 mg/kg. These variations were attributed to different climatic and extraction conditions [45,49]. In locations characterized by high temperatures, such as olive groves in Egypt, the α-tocopherol concentrations in oils can reach nearly 800 mg/kg [50].
In previous studies, the concentration of vitamin E in olive oils extracted from centenarian olive trees in Portugal exhibited a range of 140 to 354 mg/kg, depending on the specific cultivar and harvest year. Notably, the cvs. Lentisca and Madural closely matched the values obtained in this study, averaging at 224–335 mg/kg [29].
Although tocopherols are present in olive oils as minor compounds, they play a crucial role in protecting the oil against autoxidation and possess biological activity when consumed in the human diet. Besides their stability-enhancing function, it is vital to explore the potential health benefits associated with tocopherols to enhance the value of olive oils derived from centenarian trees. Since the composition of tocopherols is influenced by various factors, documenting the variations in tocopherol composition among these specimens under different climatic conditions is of utmost importance.

3.4. Olive Oils Total Content of Hydroxytyrosol and Tyrosol Derivatives

This study aimed to analyze the effect of the year on the levels of two families of phenolic acids, hydroxytyrosol- and tyrosol-based in two different years. The research revealed a noteworthy decline (p-value < 0.05) in the concentrations of these compounds from the first year to the second year. Hydroxytyrosol compounds’ values ranged from 290 to 220 mg/kg, while tyrosol ones exhibited a decrease from 170 to 135 mg/kg. The concentration range for these compounds was found to be 130–400 mg/kg and 36.5–427 mg/kg, respectively (Table 3). It was observed that this decrease occurred in 68% of the plants for hydroxytyrosol and 56% of the plants for tyrosol (Table S3).
Jiménez-Herrera et al. [51] conducted an investigation focusing on the impact of water stress, specifically drought, on the levels of phenolic acids in traditional olive groves. The motivation behind this study stemmed from water scarcity issues in Mediterranean countries, which led to losses in the olive industry. The researchers observed that under drought conditions and high temperatures, particularly during fruit growth, the concentration of hydroxytyrosol and tyrosol decreased, while the total phenol content benefited from these conditions. In the present study, the climatic conditions during fruit development were analyzed. It was noted that in 2020, the initial month’s experienced dryness, with rainfall, gradually increasing until harvest. Conversely, in 2021, droughts occurred in June and August, accompanied by high temperatures during harvesting months and high precipitation in October (59.6 mm) and November (11.8 mm) (Figure 1). These conditions likely contributed to a higher degradation of these compounds rather than their synthesis, potentially explaining the negative impact on phenolic acid concentrations in 2021.
Anticipating the effects of climate change on water availability, Faghim et al. [52] investigated the response of olive trees in Tunisian olive groves, located in arid and semi-arid regions, under different irrigation conditions. They found lower levels of hydroxytyrosol and tyrosol in oils obtained from non-irrigated olive groves compared to oils from irrigated olive groves. The difference was statistically significant (p-value < 0.05), with a reduction of the contents for both compounds being observed. Specifically, hydroxytyrosol levels decreased from 290.2 to 220.5 mg/kg, while tyrosol levels decreased from 170.3 to 135.9 mg/kg. Among the olive tree varieties, cv. Chemlali exhibited higher levels of tyrosol compared to hydroxytyrosol, aligning with findings reported by other researchers [45]. However, Uslu et al. [53], who evaluated the influence of irrigation over a two-year period, found high concentrations of these compounds in Mediterranean varieties. They observed a wide range of hydroxytyrosol levels, ranging from 307.3 to 1449.1 mg/kg. Additionally, they noticed that irrigated varieties exhibited the greatest reduction in tyrosol levels from one year to the next. The demand for high-quality olive oil with distinct phenolic compound concentrations is increasing [54]. The presence of phenolic acids in olive oil can vary due to various factors, including the genotype, ripening stage of the fruit, agroclimatic conditions, production year, and geographical origin [55]. Given the significant variation in hydroxytyrosol and tyrosol concentrations in olive oils, it is crucial to characterize them. Furthermore, there is a possibility of discovering previously unknown centenarian olive trees with favorable phenolic acid values and observing their potential adaptation to climate change.

3.5. Oxidative Stability, Antioxidant Activity, and Total Reducing Capacity

The antioxidant capacity of the olive oils was evaluated by measuring oxidative stability, total phenolic compounds, and antioxidant activity using the DPPH and ABTS methods. Significant differences (p-value < 0.005) were observed only for total phenols and the ABTS inhibition percentage with the crop year. Over the period from 2020 to 2021, the average concentration of total phenols increased from 375 to 569 mg/kg and reached a maximum value of 965 mg/kg. It was found that this increase occurred in 72% of the plants under study (Table S4). These findings align with previous studies that reported levels ranging from 50 to 1000 mg/kg [56]. The maximum value of ABTS inhibition was 54.7%, but there was a decline from 40.8% to 35.0% between the first and second years (Table 4). This decrease was observed for 60% of the plants under study (Table S4). In terms of weather conditions, it is observed that the levels of total phenols generally tend to rise, while the concentrations of phenolic acids and other compounds with antioxidant capacity may decrease. The increase in phenolic compounds can be attributed to higher concentrations of oleuropein, a phenolic compound responsible for the characteristic bitter taste in olive oils [51,57]. The ripening process of the fruit involves various chemical and enzymatic reactions, which lead to the production of free phenols and changes in the quantity of different phenolic compounds [58]. Interestingly, unlike hydroxytyrosol and tyrosol compounds, the total phenols exhibited an increase in 2021 under the analyzed conditions. This particular year was characterized by irregularities in temperature and precipitation. Stress-inducing factors, such as early rains in June and September, potentially accelerated fruit ripening, while low precipitation and higher temperatures in August, October, and November may have influenced the synthesis of certain phenolic compounds.
In 2021, there was a decline observed in both the radical inhibition capacity and the presence of phenolic acids, which are closely associated with the antioxidant properties of the olive oil. Moroccan olive oils also exhibited significant variations in total phenolic content across different crop years, primarily influenced by climatic factors, particularly precipitation [20]. A similar trend was noticed in the oils of cv. Koroneiki, with phenolic contents ranging from 493.7 to 566.3 mg/kg [20]. Once phenolic compounds could act as a defense against trees or plants, the cumulative rainfall can play a crucial role in shaping the phenolic composition of olives, as water deficit creates a stressful environment for the olive trees that stimulates the production of these beneficial compounds [25,58]. Phenolic compounds play a vital role in preventing oxidation and are directly linked to the oxidative stability values [59]. No notable differences were observed in the present study regarding oils from Portuguese centenarian olive trees, with the average oxidative stability ranging from 18 to 19 h and a maximum value of 44.5 h. Similar findings have been reported for olive oils produced in other geographical regions [13,20,40]. On the other hand, the DPPH antioxidant method consistently yielded values between the years, with the average inhibition ranged from 53 to 57%. The presence of different phenolic compounds in varying concentrations contributes to the unique characteristics of an olive oil, including its flavor, aroma, quality, as well as its relevance in terms of nutrition and shelf-life [60]. Exploring the antioxidant activity offers promising prospects in characterizing centenarian olive trees.

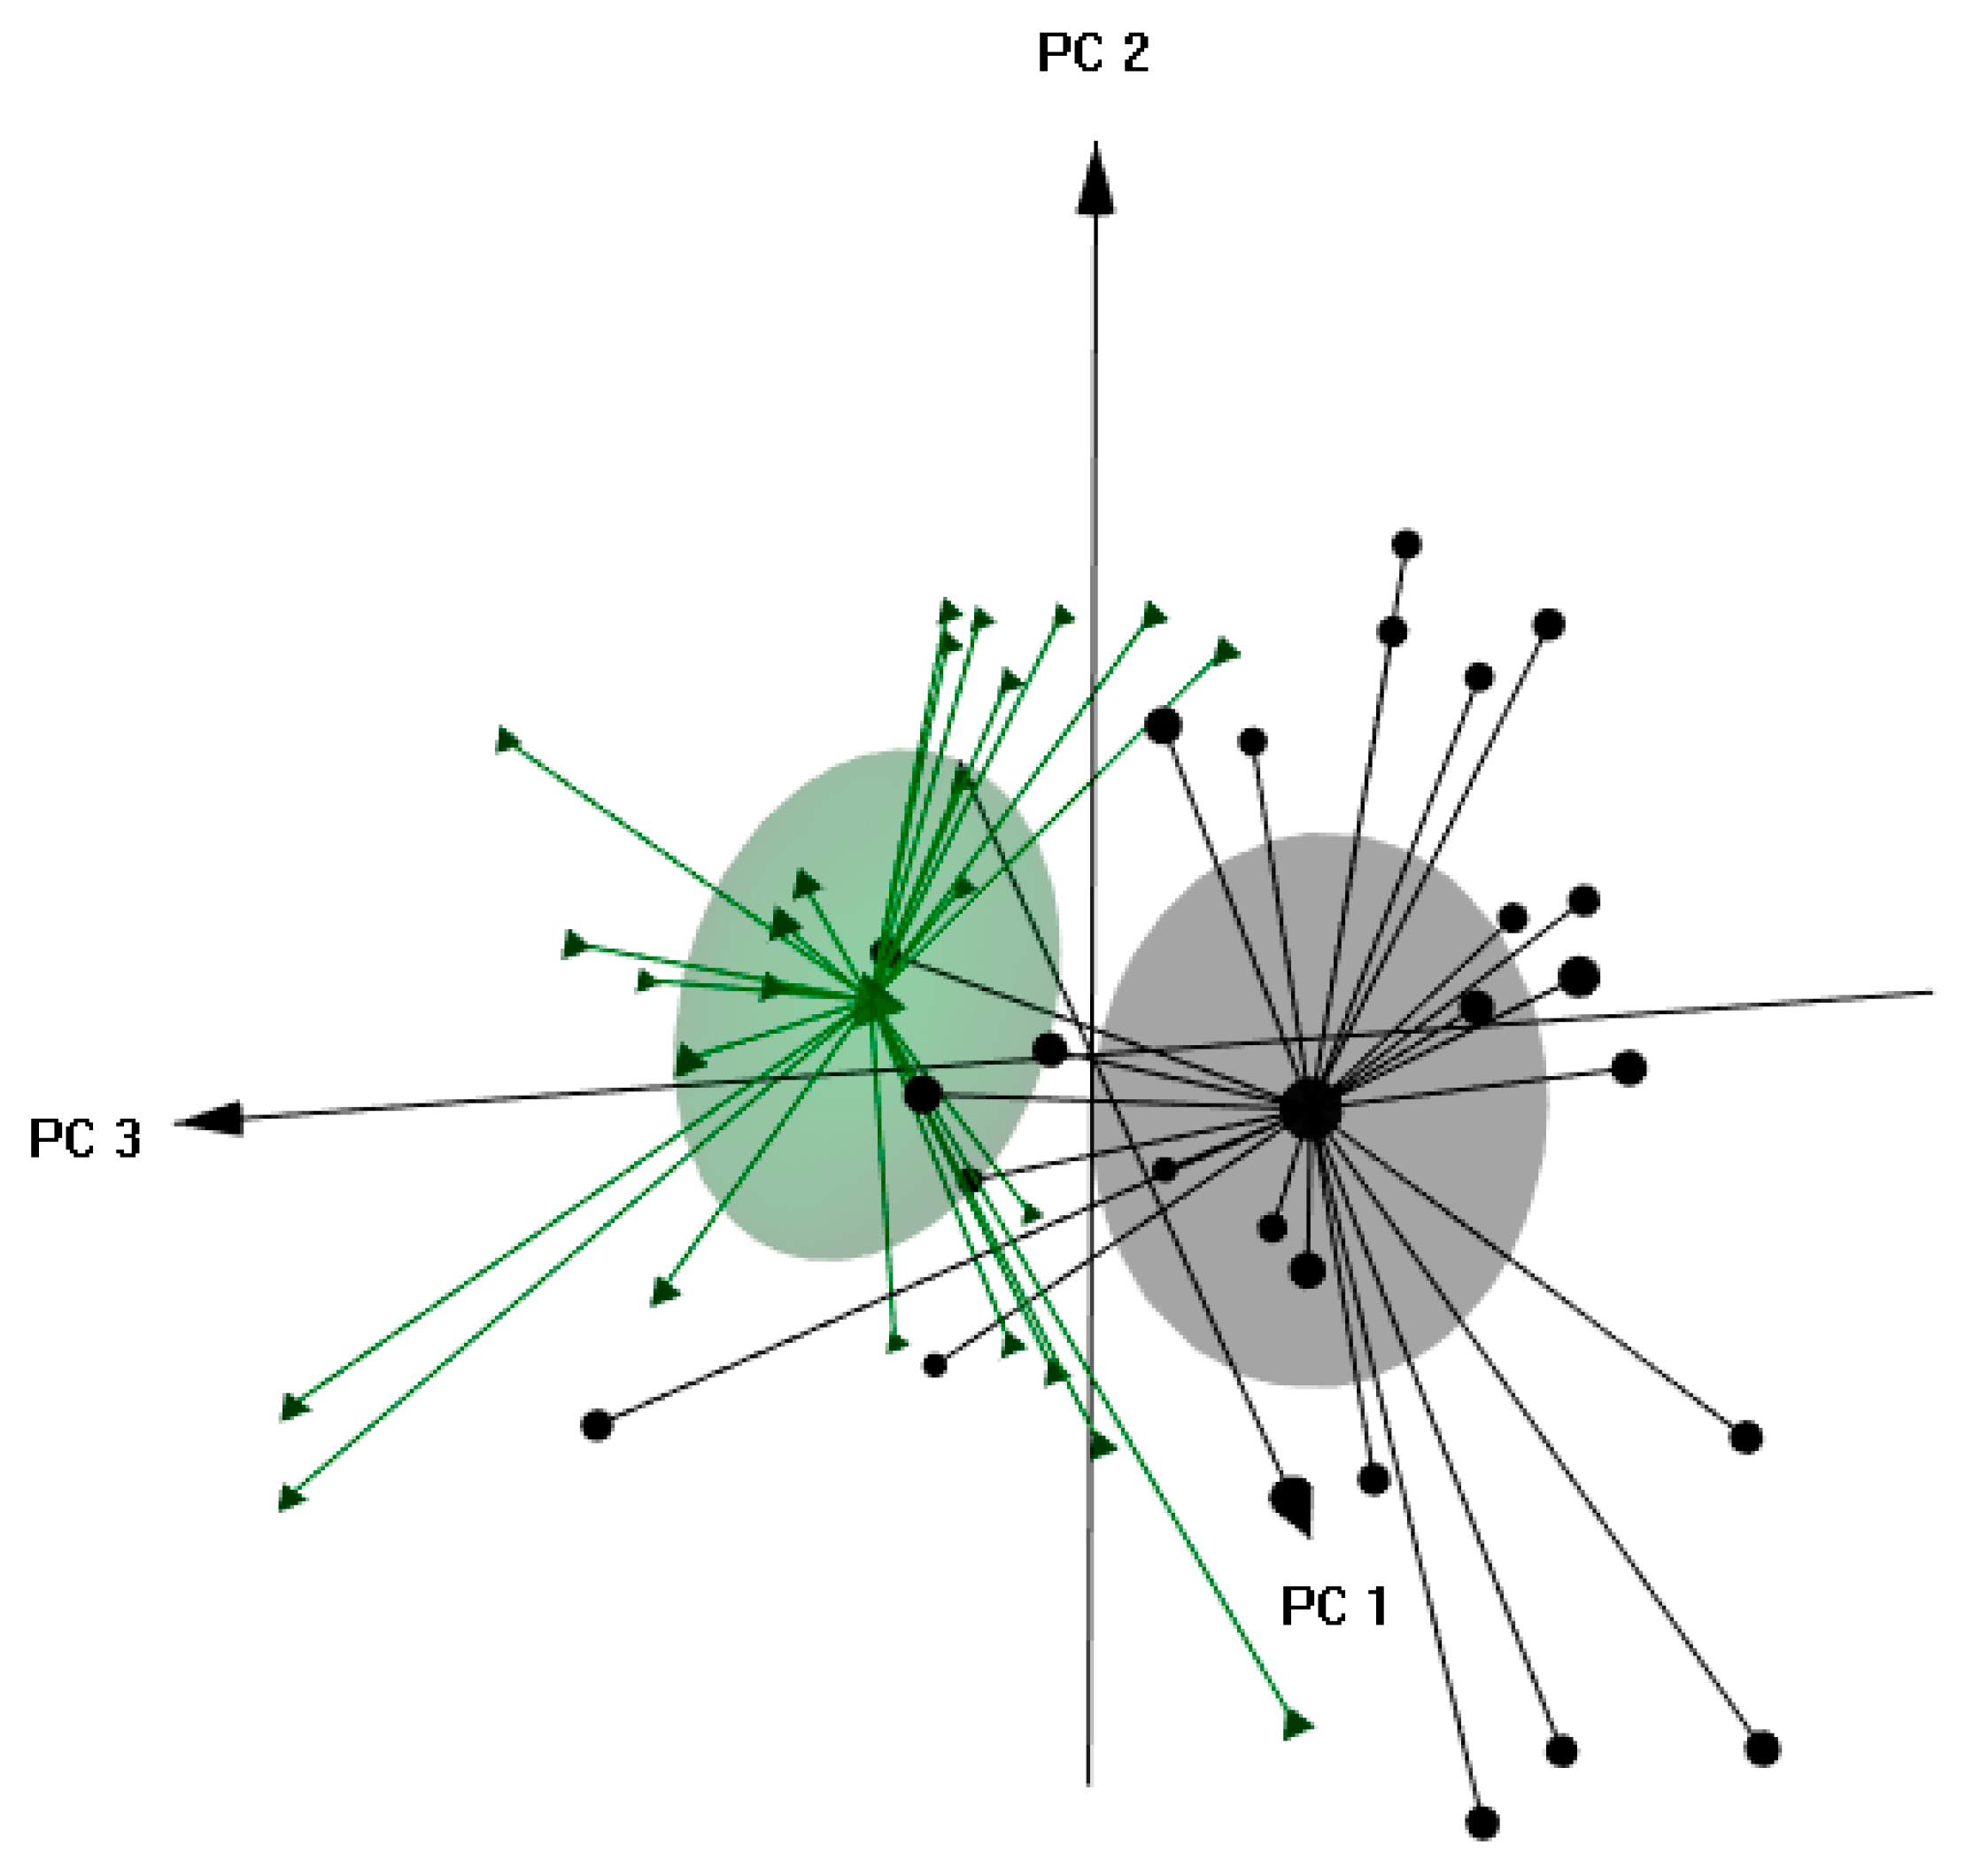
3.6. Discrimination of Olive Oils by Crop Year

The observed climate variations in 2020 and 2021 had a noticeable impact on the composition of the studied olive oils. Specifically, the fatty acids, tocopherols, phenolic acids, and antioxidant activity of the oils were affected. These effects provide an opportunity to differentiate the oils based on their crop year using principal component analysis (PCA). The PCA analysis, which considered 17 independent variables (OS; DPPH; ABTS; hydroxytyrosol; tyrosol; α-, β-, and γ-tocopherol; TPC; C16:0, C16:1, C18:0, C18:1, C18:2, C18:3, C20:0, and C20:1), revealed three main components: PC1, PC2, and PC3. These components accounted for 37.0%, 16.5%, and 12.3% of the data variability, respectively. Consequently, it became possible to distinguish different batches of olive oil based on the harvest years, as depicted in Figure 2. Olive oils harvested in 2020 were positioned in the positive quadrant of PC1 and negatively in terms of PC2 and PC3. Conversely, olive oils from the 2021 harvest exhibited an opposite pattern, with positive values for PC2 and PC3, and negative values for PC1.
To further validate the effectiveness of the unsupervised classification, linear discriminant analysis (LDA) was employed in combination with the simulated annealing (SA) variable selection algorithm. This approach aimed to identify the most relevant variables among the initial 17 used in PCA, focusing on those with the highest discriminatory power. By utilizing data from seven selected variables (ABTS; α-, β-, and γ-tocopherol; TPC; C16:0, and C18:0), a classification LDA-SA model was developed.
This model successfully discriminated the analyzed oils based on their respective harvest year (2020 or 2021), achieving sensitivities of 100% and 98% for the training and leave-one-out cross-validation (LOO-CV) procedures, respectively. Notably, in the LOO-CV validation, only one oil from 2021 was misclassified as belonging to 2020.

4. Conclusions

The primary objective of this study was to examine how interannual climatic conditions influence the composition of olive oil derived from centenarian olive trees. These trees have endured diverse environmental conditions throughout the years and possess genetic potential to enhance agroecosystem resilience. Over a two-year period, the impact of yearly variations on the oils extracted from 25 centenarian olive trees of the Côa Valley region was analysed. The findings revealed significant effects of climatic variations observed during the years 2020 and 2021, particularly on fatty acids, tocopherols, phenolic acids, and antioxidant activity in the oils under investigation. During warmer years, especially during the fruit development period, the concentration of palmitic acid, the most variable compound, reached 15.22%, while in colder climates, it reached 13.53%. Regarding tocopherols, only the influence of the year was observed for β-tocopherol. Furthermore, abnormal rainfall caused by storms was found to potentially alter the composition of phenolic compounds. Water scarcity creates a state of stress that increases the production of phenolics in olive oils. Excess water will lead to a decrease in phenolic content. Although these results are preliminary, they provide a foundation for future studies exploring the response of centenarian olive trees to different scenarios. Understanding these changes is crucial for informed decision making.

Supplementary Materials

The following supporting information can be downloaded at: https://www.mdpi.com/article/10.3390/agronomy13122884/s1, Table S1: Mean ± standard deviation (%) of the relative abundance of fatty acids determined in olive oils extracted from olives of centenarian olive trees located in the Côa Valley, Portugal, for two consecutive crop years (2020 and 2021); Table S2: Tocopherols (α-, β-, and γ-) and total vitamin E mass contents (mean ± standard deviation, mg/kg of olive oil) for olive oils extracted from olives of centenarian olive trees located in the Côa Valley (Portugal), for two consecutive crop years (2020 and 2021); Table S3: Hydroxytyrosol, tyrosol and total hydroxytyrosol + tyrosol based compounds (mean ± standard deviation, mg/kg of olive oil) for olive oils extracted from olives of centenarian olive trees located in the Côa Valley (Portugal), for two consecutive crop years (2020 and 2021); Table S4: Oxidative stability (hours). DPPH and ABTS (inhibition %) and total reduction capacity (mg GAE per kg of oil) (mean ± standard deviation) for the olive oils extracted from olives of centenarian olive trees located in the Côa Valley (Portugal) for two consecutive crop years (2020 and 2021).

Author Contributions

Conceptualization, N.R. and P.B.; methodology, L.B., R.C. and N.R.; software, A.M.P.; formal analysis, L.B., R.C., S.C. and N.R.; investigation, L.B., S.C., R.C., A.M.P., P.B. and N.R.; resources, N.R.; writing—original draft preparation, L.B.; writing—review and editing, N.R., S.C., A.M.P. and P.B.; supervision, N.R. and P.B.; project administration, N.R. and P.B.; funding acquisition, N.R. All authors have read and agreed to the published version of the manuscript.

Funding

This research was funded by Foundation for Science and Technology (FCT, Portugal) financial support from national funds FCT/MCTES to CIMO (UIDB/00690/2020 and UIDP/00690/2020), SusTEC (LA/P/0007/2020) and to LAQV/Requimte (UIDB/50006/2020 and UIDP/50006/2020); to the Project “OLIVECOA—Centennial Olive Trees in the Côa Valley Region: rediscovering the past to enhance the future” (ref.COA/BRB/0035/2019). Nuno Rodrigues and Rebeca Cruz thanks the FCT- Foundation for Science and Technology, P.I., for the National funding through the institutional program contract for scientific employment.

Data Availability Statement

Data available on request. The data are not publicly available due to [Data are contained within the article].

Acknowledgments

The authors acknowledge the collaboration of the Instituto Português do Mar e da Atmosfera (IPMA) for providing the meteorological data.

Conflicts of Interest

The authors declare no conflict of interest. The funders had no role in the design of the study; in the collection, analyses, or interpretation of data; in the writing of the manuscript; or in the decision to publish the results.

References

  1. Langsdorf, S.; Löschke, S.; Möller, V.; Okem, A.; Officer, S.; Rama, B.; Belling, D.; Dieck, W.; Götze, S.; Kersher, T.; et al. Terrestrial and Freshwater Ecosystems and Their Services. In Climate Change 2022: Impacts, Adaptation and Vulnerability. In Contribution of Working Group II to the Sixth Assessment Report of the Intergovernmental Panel on Climate Change; IPCC: Cambridge, UK, 2022; pp. 197–377. [Google Scholar] [CrossRef]
  2. Rickards, L.; Howden, S.M. Transformational Adaptation: Agriculture and Climate Change. Crop Pasture Sci. 2012, 63, 240–250. [Google Scholar] [CrossRef]
  3. Campbell, B.M.; Vermeulen, S.J.; Aggarwal, P.K.; Corner-Dolloff, C.; Girvetz, E.; Loboguerrero, A.M.; Ramirez-Villegas, J.; Rosenstock, T.; Sebastian, L.; Thornton, P.K.; et al. Reducing Risks to Food Security from Climate Change. Glob. Food Sec. 2016, 11, 34–43. [Google Scholar] [CrossRef]
  4. Nugroho, A.D.; Prasada, I.Y.; Lakner, Z. Comparing the Effect of Climate Change on Agricultural Competitiveness in Developing and Developed Countries. J. Clean. Prod. 2023, 406, 137139. [Google Scholar] [CrossRef]
  5. Amassaghrou, A.; Barkaoui, K.; Bouaziz, A.; Alaoui, S.B.; Fatemi, Z.E.A.; Daoui, K. Yield and Related Traits of Three Legume Crops Grown in Olive-Based Agroforestry under an Intense Drought in the South Mediterranean. Saudi J. Biol. Sci. 2023, 30, 103597. [Google Scholar] [CrossRef]
  6. Temani, F.; Bouaziz, A.; Daoui, K.; Wery, J.; Barkaoui, K. Olive Agroforestry Can Improve Land Productivity Even under Low Water Availability in the South Mediterranean. Agric. Ecosyst. Environ. 2021, 307, 107234. [Google Scholar] [CrossRef]
  7. Arenas-Castro, S.; Gonçalves, J.F.; Moreno, M.; Villar, R. Projected Climate Changes Are Expected to Decrease the Suitability and Production of Olive Varieties in Southern Spain. Sci. Total Environ. 2020, 709, 136161. [Google Scholar] [CrossRef]
  8. Fraga, H.; Moriondo, M.; Leolini, L.; Santos, J.A. Mediterranean Olive Orchards under Climate Change: A Review of Future Impacts and Adaptation Strategies. Agronomy 2020, 11, 56. [Google Scholar] [CrossRef]
  9. Arias Montevechio, E.; Crispin Cunya, M.; Fernández Jorquera, F.; Rendon, E.; Vásquez-Lavin, F.; Stehr, A.; Ponce Oliva, R.D. Traditional Crops and Climate Change Adaptation: Insights from the Andean Agricultural Sector. Clim. Dev. 2023, 15, 723–737. [Google Scholar] [CrossRef]
  10. Deiana, P.; Motroni, A.; Filigheddu, M.R.; Dettori, S.; Nieddu, G.; Mercenaro, L.; Alfei, B.; Culeddu, N.; Santona, M. Effect of Pedoclimatic Variables on Analytical and Organoleptic Characteristics in Olive Fruit and Virgin Olive Oil. Eur. J. Agron. 2023, 148, 126856. [Google Scholar] [CrossRef]
  11. Fraga, H.; Guimarães, N.; Freitas, T.R.; Malheiro, A.C.; Santos, J.A. Future Scenarios for Olive Tree and Grapevine Potential Yields in the World Heritage Côa Region, Portugal. Agronomy 2022, 12, 350. [Google Scholar] [CrossRef]
  12. Valente, S.; Machado, B.; Pinto, D.C.G.A.; Santos, C.; Silva, A.M.S.; Dias, M.C. Modulation of Phenolic and Lipophilic Compounds of Olive Fruits in Response to Combined Drought and Heat. Food Chem. 2020, 329, 127191. [Google Scholar] [CrossRef] [PubMed]
  13. Rodrigues, N.; Casal, S.; Cruz, R.; Peres, A.M.; Baptista, P.; Pereira, J.A. GxE Effects on Tocopherol Composition of Oils from Very Old and Genetically Diverse Olive Trees. JAOCS J. Am. Oil Chem. Soc. 2020, 97, 497–507. [Google Scholar] [CrossRef]
  14. Lodolini, E.M.; Ali, S.; Mutawea, M.; Qutub, M.; Arabasi, T.; Pierini, F.; Neri, D. Complementary Irrigation for Sustainable Production in Olive Groves in Palestine. Agric. Water Manag. 2014, 134, 104–109. [Google Scholar] [CrossRef]
  15. Rey-Giménez, R.; Sánchez-Gimeno, A.C. Crop Year, Harvest Date and Clone Effects on Fruit Characteristics, Chemical Composition and Olive Oil Stability from an Empeltre Clonal Selection Grown in Aragon. J. Sci. Food Agric. 2022, 102, 5778–5786. [Google Scholar] [CrossRef]
  16. Aparicio, R.; Ferreiro, L.; Alonso, V. Effect of Climate on the Chemical Composition of Virgin Olive Oil. Anal. Chim. Acta 1994, 292, 235–241. [Google Scholar] [CrossRef]
  17. Beltrán, G.; Jiménez, A.; del Rio, C.; Sánchez, S.; Martínez, L.; Uceda, M.; Aguilera, M.P. Variability of Vitamin E in Virgin Olive Oil by Agronomical and Genetic Factors. J. Food Compos. Anal. 2010, 23, 633–639. [Google Scholar] [CrossRef]
  18. Bengana, M.; Bakhouche, A.; Lozano-Sánchez, J.; Amir, Y.; Youyou, A.; Segura-Carretero, A.; Fernández-Gutiérrez, A. Influence of Olive Ripeness on Chemical Properties and Phenolic Composition of Chemlal Extra-Virgin Olive Oil. Food Res. Int. 2013, 54, 1868–1875. [Google Scholar] [CrossRef]
  19. Bongiorno, D.; Di Stefano, V.; Indelicato, S.; Avellone, G.; Ceraulo, L. Bio-Phenols Determination in Olive Oils: Recent Mass Spectrometry Approaches. Mass Spectrom. Rev. 2021, 42, 1462–1502. [Google Scholar] [CrossRef]
  20. Mansouri, F.; Moumen, A.B.; Belhaj, K.; Richard, G.; Marie-Laure Fauconnier, G.R.; Sindic, M.; Ahmed Elamrani, H.S.C. Effect of Crop Season on the Quality and Composition of Extra Virgin Olive Oils from Greek and Spanish Varieties Grown in the Oriental Region of Morocco. Emir. J. Food Agric. 2018, 30, 549–562. [Google Scholar] [CrossRef]
  21. Rey-Giménez, R.; Sánchez-Gimeno, A.C. Authenticity in Olive Oils from an Empeltre Clonal Selection in Aragon (Spain): How Environmental, Agronomic, and Genetic Factors Affect Sterol Composition. Foods 2022, 11, 2587. [Google Scholar] [CrossRef]
  22. Romero, M.P.; Tovar, M.J.; Ramo, T.; Motilva, M.J. Effect of Crop Season on the Composition of Virgin Olive Oil with Protected Designation of Origin “Les Garrigues”. J. Am. Oil Chem. Soc. 2003, 80, 423–430. [Google Scholar] [CrossRef]
  23. Giuffrè, A.M. The Effects of Cultivar and Harvest Year on the Fatty Alcohol Composition of Olive Oils from Southwest Calabria (Italy). Grasas Aceites 2014, 65, e011. [Google Scholar] [CrossRef]
  24. Mele, M.A.; Islam, M.Z.; Kang, H.M.; Giuffre, A.M. Pre-and Post-Harvest Factors and Their Impact on Oil Composition and Quality of Olive Fruit. Emir. J. Food Agric. 2018, 30, 592. [Google Scholar] [CrossRef]
  25. Lechhab, T.; Lechhab, W.; Cacciola, F.; Salmoun, F. Sets of Internal and External Factors Influencing Olive Oil (Olea Europaea L.) Composition: A Review. Eur. Food Res. Technol. 2022, 248, 1069–1088. [Google Scholar] [CrossRef]
  26. Rouina, Y.B.; Zouari, M.; Zouari, N.; Rouina, B.B.; Bouaziz, M. Olive Tree (Olea Europaea L. Cv. Zelmati) Grown in Hot Desert Climate: Physio-Biochemical Responses and Olive Oil Quality. Sci. Hortic. 2020, 261, 108915. [Google Scholar] [CrossRef]
  27. Oğraş, Ş.Ş.; Kaban, G.; Kaya, M. The Effects of Geographic Region, Cultivar and Harvest Year on Fatty Acid Composition of Olive Oil. J. Oleo Sci. 2016, 65, 889–895. [Google Scholar] [CrossRef] [PubMed]
  28. Beltrán, G.; Del Rio, C.; Sánchez, S.; Martínez, L. Influence of Harvest Date and Crop Yield on the Fatty Acid Composition of Virgin Olive Oils from Cv. Picual. J. Agric. Food Chem. 2004, 52, 3434–3440. [Google Scholar] [CrossRef]
  29. Squeo, G.; Silletti, R.; Mangini, G.; Summo, C.; Caponio, F. The Potential of Apulian Olive Biodiversity: The Case of Oliva Rossa Virgin Olive Oil. Foods 2021, 10, 369. [Google Scholar] [CrossRef]
  30. Rodrigues, N.; Casal, S.; Peres, A.M.; Baptista, P.; Pereira, J.A. Seeking for Sensory Differentiated Olive Oils? The Urge to Preserve Old Autochthonous Olive Cultivars. Food Res. Int. 2020, 128, 108759. [Google Scholar] [CrossRef]
  31. Alowaiesh, B.; Singh, Z.; Fang, Z.; Kailis, S.G. Harvest Time Impacts the Fatty Acid Compositions, Phenolic Compounds and Sensory Attributes of Frantoio and Manzanilla Olive Oil. Sci. Hortic. 2018, 234, 74–80. [Google Scholar] [CrossRef]
  32. Petruccelli, R.; Giordano, C.; Salvatici, M.C.; Beghè, D.; Rodolfi, M.; Fabbri, A.; Benelli, C. Characterization and Conservation of “Olivo Della Strega”: An Ancient Olive Tree, Precious Resource for Natural and Cultural Heritage. Rend. Lincei 2021, 32, 311–324. [Google Scholar] [CrossRef]
  33. Rodrigues, N.; Casal, S.; Pinho, T.; Cruz, R.; Peres, A.M.; Baptista, P.; Pereira, J.A. Fatty Acid Composition from Olive Oils of Portuguese Centenarian Trees Is Highly Dependent on Olive Cultivar and Crop Year. Foods 2021, 10, 496. [Google Scholar] [CrossRef] [PubMed]
  34. Sabetta, W.; Mascio, I.; Squeo, G.; Gadaleta, S.; Flamminii, F.; Conte, P.; Di Mattia, C.D.; Piga, A.; Caponio, F.; Montemurro, C. Bioactive Potential of Minor Italian Olive Genotypes from Apulia, Sardinia and Abruzzo. Foods 2021, 10, 1371. [Google Scholar] [CrossRef] [PubMed]
  35. International Olive Council. Guide for the Determination of the Characteristics of Oil-Olives; COI/OH/Doc. No 1; International Olive Council: Madrid, Spain, 2011; p. 39. [Google Scholar]
  36. International Olive Council. Determination of the Content of Waxes and Fatty Acid Ethyl Esters by Capillary Gas Chromatography; COI/T.20/Doc. No 28/Rev. 3 November 2022; International Olive Council: Madrid, Spain, 2022; pp. 1–21. [Google Scholar]
  37. ISO 9936:2016; Animal and Vegetable Fats and Oils—Determination of Tocopherol and Tocotrienol Contents by High-Performance Liquid Chromatography. ISO: Geneva, Switzerland, 2016.
  38. Marx, Í.M.G.; Casal, S.; Rodrigues, N.; Veloso, A.C.A.; Pereira, J.A.; Peres, A.M. Estimating Hydroxytyrosol-Tyrosol Derivatives Amounts in Cv. Cobrançosa Olive Oils Based on the Electronic Tongue Analysis of Olive Paste Extracts. LWT 2021, 147, 111542. [Google Scholar] [CrossRef]
  39. Cherif, M.; Rodrigues, N.; Veloso, A.C.A.; Pereira, J.A.; Peres, A.M. Kinetic Study of the Microwave-induced Thermal Degradation of Cv. Arbequina Olive Oils Flavored with Lemon Verbena Essential Oil. J. Am. Oil Chem. Soc. 2021, 98, 1021–1032. [Google Scholar] [CrossRef]
  40. Samaniego Sánchez, C.; Troncoso González, A.M.; García-Parrilla, M.C.; Quesada Granados, J.J.; López García de la Serrana, H.; López Martínez, M.C. Different Radical Scavenging Tests in Virgin Olive Oil and Their Relation to the Total Phenol Content. Anal. Chim. Acta 2007, 593, 103–107. [Google Scholar] [CrossRef] [PubMed]
  41. Hijawi, T. Characterizing of Oil Quality and Fatty Acid Profiles of Old Olive Trees in Palestine. J. Oleo Sci. 2021, 70, 1585–1606. [Google Scholar] [CrossRef]
  42. Portarena, S.; Farinelli, D.; Lauteri, M.; Famiani, F.; Esti, M.; Brugnoli, E. Stable Isotope and Fatty Acid Compositions of Monovarietal Olive Oils: Implications of Ripening Stage and Climate Effects as Determinants in Traceability Studies. Food Control 2015, 57, 129–135. [Google Scholar] [CrossRef]
  43. Ângelo, M.; Carlos, R.; Correia, M. Manual da Safra e Contra Safra Olival; Instituto Politécnico: Bragança, Portugal, 2009. [Google Scholar]
  44. Borges, T.H.; López, L.C.; Pereira, J.A.; Cabrera-Vique, C.; Seiquer, I. Comparative Analysis of Minor Bioactive Constituents (CoQ10, Tocopherols and Phenolic Compounds) in Arbequina Extra Virgin Olive Oils from Brazil and Spain. J. Food Compos. Anal. 2017, 63, 47–54. [Google Scholar] [CrossRef]
  45. García-Inza, G.P.; Castro, D.N.; Hall, A.J.; Rousseaux, M.C. Responses to Temperature of Fruit Dry Weight, Oil Concentration, and Oil Fatty Acid Composition in Olive (Olea europaea L. Var. ‘Arauco’). Eur. J. Agron. 2014, 54, 107–115. [Google Scholar] [CrossRef]
  46. Ayton, J.; Mailer, R.J.; Haigh, A.; Tronson, D.; Conlan, D. Quality and oxidative stability of australian olive oil according to harvest date and irrigation. J. Food Lipids 2007, 14, 138–156. [Google Scholar] [CrossRef]
  47. Ben Hmida, R.; Gargouri, B.; Chtourou, F.; Abichou, M.; Sevim, D.; Bouaziz, M. Study on the Effect of Climate Changes on the Composition and Quality Parameters of Virgin Olive Oil “Zalmati” Harvested at Three Consecutive Crop Seasons: Chemometric Discrimination. ACS Omega 2022, 7, 40078–40090. [Google Scholar] [CrossRef] [PubMed]
  48. Giuffrè, A.M. The Evolution of Free Acidity and Oxidation Related Parameters in Olive Oil during Olive Ripening from Cultivars Grown in the Region of Calabria, South Italy. Emir. J. Food Agric. 2018, 30, 539–548. [Google Scholar]
  49. Yu, L.; Wang, Y.; Wu, G.; Jin, J.; Jin, Q.; Wang, X. Chemical and Volatile Characteristics of Olive Oils Extracted from Four Varieties Grown in Southwest of China. Food Res. Int. 2021, 140, 109987. [Google Scholar] [CrossRef] [PubMed]
  50. Benincasa, C.; Russo, A.; Romano, E.; Elsorady, M.E.; Perri, E.; Muzzalupo, I. Chemical and sensory analysis of some Egyptian virgin olive oils. J. Nutr. Food Sci. 2011, 5, 118. [Google Scholar] [CrossRef]
  51. Jiménez-Herrera, R.; Pacheco-López, B.; Peragón, J. Water Stress, Irrigation and Concentrations of Pentacyclic Triterpenes and Phenols in Olea Europaea L. Cv. Picual Olive Trees. Antioxidants 2019, 8, 294. [Google Scholar] [CrossRef] [PubMed]
  52. Faghim, J.; Mohamed, M.B.; Bagues, M.; Nagaz, K.; Triki, T.; Guasmi, F. Irrigation Effects on Phenolic Profile and Extra Virgin Olive Oil Quality of “Chemlali” Variety Grown in South Tunisia. S. Afr. J. Bot. 2021, 141, 322–329. [Google Scholar] [CrossRef]
  53. Uslu, N.; Özcan, M.M. The Effect of Irrigation and Harvest Time on Bioactive Properties of Olive Fruits Issued from Some Olive Varieties Grown in Mediterranean Region. Eur. Food Res. Technol. 2020, 246, 2587–2599. [Google Scholar] [CrossRef]
  54. Wani, T.A.; Masoodi, F.A.; Gani, A.; Baba, W.N.; Rahmanian, N.; Akhter, R.; Wani, I.A.; Ahmad, M. Olive Oil and Its Principal Bioactive Compound: Hydroxytyrosol—A Review of the Recent Literature. Trends Food Sci. Technol. 2018, 77, 77–90. [Google Scholar] [CrossRef]
  55. Famiani, F.; Farinelli, D.; Rollo, S.; Camposeo, S.; Di Vaio, C.; Inglese, P. Evaluation of Different Mechanical Fruit Harvesting Systems and Oil Quality in Very Large Size Olive Trees. Span. J. Agric. Res. 2014, 12, 960–972. [Google Scholar] [CrossRef]
  56. Baccouri, B.; Sieren, T.; Mohamed, S.N.; Willenberg, I. Fingerprinting of Tocopherol, Phenolic Compounds and Oxidative Properties of Unstudied Minor and Rare Tunisian Olive Oils. S. Afr. J. Bot. 2023, 156, 54–64. [Google Scholar] [CrossRef]
  57. García-Garví, J.M.; Sánchez-Bravo, P.; Hernández, F.; Sendra, E.; Corell, M.; Moriana, A.; Burgos-Hernández, A.; Carbonell-Barrachina, Á.A. Effect of Regulated Deficit Irrigation on the Quality of “Arbequina”; Extra Virgin Olive Oil Produced on a Super-High-Intensive Orchard. Agronomy 2022, 12, 1892. [Google Scholar] [CrossRef]
  58. Ben Brahim, S.; Kelebek, H.; Ammar, S.; Abichou, M.; Bouaziz, M. LC–MS Phenolic Profiling Combined with Multivariate Analysis as an Approach for the Characterization of Extra Virgin Olive Oils of Four Rare Tunisian Cultivars during Ripening. Food Chem. 2017, 229, 9–19. [Google Scholar] [CrossRef] [PubMed]
  59. Reboredo-Rodríguez, P.; González-Barreiro, C.; Cancho-Grande, B.; Valli, E.; Bendini, A.; Gallina Toschi, T.; Simal-Gandara, J. Characterization of Virgin Olive Oils Produced with Autochthonous Galician Varieties. Food Chem. 2016, 212, 162–171. [Google Scholar] [CrossRef] [PubMed]
  60. Nenadis, N.; Mastralexi, A.; Tsimidou, M.Z. Physicochemical Characteristics and Antioxidant Potential of the Greek PDO and PGI Virgin Olive Oils (VOOs). Eur. J. Lipid Sci. Technol. 2019, 121, 1800172. [Google Scholar] [CrossRef]
Figure 1. Meteorological data of average rainfall values and the minimum, average, and maximum temperatures (TMIN, TAVE, and TMAX, respectively) collected at the Moncorvo station for the years of 2020 and 2021.
Agronomy 13 02884 g001
Figure 2. 3D PCA plot (PC1: 37%, PC2: 16.5%, and PC3: 1.2%): olive oils extracted from olives of centenarian olive trees located in the Côa Valley (Portugal) unsupervised differentiation according to the harvest year (2020: black •; 2021: green ▲) based on 17 independent variables (OS; DPPH; ABTS; hydroxytyrosol; tyrosol; α-, β-, and γ-tocopherol; TPC; C16:0, C16:1, C18:0, C18:1, C18:2, C18:3, C20:0, and C20:1).
Agronomy 13 02884 g002
Table 1. Mean ± standard deviation (%) of the relative abundance of fatty acids determined in olive oils extracted from olives of centenarian olive trees located in the Côa Valley, Portugal, for two consecutive crop years (2020 and 2021), and the corresponding percentage change with the crop year (Δ, in %).
Fatty Acid Relative Abundance (%)Crop Yearp-ValueΔ (%)
20202021
Palmitic acid (C16:0)12.9 ± 1.6 b
(9.7–17.3)
13.6 ± 1.2 a
(10.7–16.4)
0.0114 *+5.4
Palmitoleic acid (C16:1)0.9 ± 0.3 a
(0.5–2.0)
0.9 ± 0.3 a
(0.6–1.4)
0.9339 **+1.1
Stearic acid (C18:0)2.7 ± 0.4 a
(1.7–3.6)
2.3 ± 0.3 b
(1.6–2.9)
<0.0001 *−14.8
Oleic acid (C18:1)71.6 ± 6.1 a
(59.4–79.1)
72.3 ± 5.3 a
(64.3–79.8)
0.4910 **+1.0
Linoleic acid (C18:2)9.8 ± 5.1 a
(3.4–18.6)
8.8 ± 4.6 a
(2.9–16.4)
0.3221 **−10.2
Linolenic acid (C18:3)0.9 ± 0.2 a
(0.7–1.2)
0.9 ± 0.2 a
(0.6–1.2)
0.9250 **0.0
Arachidic acid (C20:0)0.4 ± 0.0 a
(0.3–0.5)
0.4 ± 0.0 b
(0.3–0.5)
0.0138 *−5.4
Eicosenoic acid (C20:1)0.3 ± 0.0 a
(0.2–0.4)
0.3 ± 0.0 a
(0.2–0.4)
0.3072 **+3.6
SFA16.3 ± 4.0 a
(13.0–20.5)
16.4 ± 4.0 a
(13.3–19.5)
0.3958 **+0.6
MUFA73.0 ± 6.1 a
(61.1–80.6)
74.4 ± 5.5 a
(67.2–81.4)
0.2195 **+2.0
PUFA10.7 ± 5.2 a
(4.1–19.5)
9.4 ± 4.6 a
(3.7–16.0)
0.2041 **−11.9
* t-Student test with Welch’s correction (unequal variances according to the F-test). ** t-Student test without correction (equal variances according to the F-test). p-values for the t-Student test. Different letters in the same row show statistically differences from the given mean (p < 0.05).
Table 2. Tocopherols (α-, β-, and γ-) and total vitamin E mass contents (mean ± standard deviation, mg/kg of olive oil) for olive oils extracted from olives of centenarian olive trees located in the Côa Valley (Portugal), for two consecutive crop years (2020 and 2021), and respective variation with crop-year (Δ, in %).
Tocopherol Concentration (mg/kg)Crop Yearp-ValueΔ (%)
20202021
α-tocopherol254.3 ± 70.1 a
(121.0–362.3)
252.3 ± 63.1 a
(134.0–323.3)
0.8820 **−0.8
β-tocopherol1.3 ± 0.6 b
(0.1–2.1)
2.0 ± 0.6 a
(1.0–2.9)
<0.0001 *+54.2
γ-tocopherol4.5 ± 3.3 a
(0.4–14.6)
5.0 ± 2.2 a
(2.0–9.6)
0.3650 **+11.4
Vitamin E260.1 ± 72.5 a
(122.7–369.3)
259.3 ± 64.8 a
(138.0–342.8)
0.9552 **−0.3
* t-Student test with Welch’s correction (unequal variances according to the F-test). ** t-Student test without correction (equal variances according to the F-test). p-values for the t-Student test. Different letters in the same row show statistically differences from the given mean (p < 0.05).
Table 3. Hydroxytyrosol, tyrosol, and total hydroxytyrosol + tyrosol based compounds (mean ± standard deviation, mg/kg of olive oil) for olive oils extracted from olives of centenarian olive trees located in the Côa Valley (Portugal), for two consecutive crop years (2020 and 2021), and respective variations with crop-year (Δ in %).
Phenolic Acids Concentration (mg/kg)Crop Yearp-ValueΔ (%)
20202021
Hydroxytyrosol290.2 ± 68.0 a
(130.5–400.1)
220.50 ± 62.22 b
(130.80–380.30)
<0.0001 *−24.0
Tyrosol170.3 ± 92.0 a
(36.5–427.3)
135.93 ± 59.19 b
(41.80–338.40)
0.0169 *−20.2
Hydroxytyrosol + Tyrosol460.6 ± 142.4 a
(167.4–772.7)
356.4 ± 98.7 b
(179.5–532.3)
<0.0001 *−3.3
* t-Student test with Welch’s correction (unequal variances according to the F-test). p-values for the t-Student test. Different letters in the same row show statistically differences from the given mean (p < 0.05).
Table 4. Oxidative stability (hours), DPPH and ABTS (inhibition %) and total reduction capacity (mg GAE per kg of oil) (mean ± standard deviation) for the olive oils extracted from olives of centenarian olive trees located in the Côa Valley (Portugal), for two consecutive crop years (2020 and 2021), and respective variation with crop-year (Δ, in %).
Antioxidant ActivityCrop Yearp-ValueΔ (%)
20202021
Oxidative stability18.2 ± 8.3 a
(6.6–31.6)
19.0 ± 9.1 a
(8.0–44.5)
0.6472 **+4.7
Total reduction capacity375.2 ± 160.6 b
(61.3–710.7)
569.5 ± 189.5 a
(234.1–965.7)
2.32 × 10⁻⁷ *+51.8
DPPH57.1 ± 17.7 a
(12.6–84.1)
53.2 ± 18.0 a
(17.1–88.6)
0.2922 **−6.8
ABTS40.8 ± 8.5 a
(21.1–54.7)
35.0 ± 5.6 b
(23.9–45.8)
9.07 × 10⁻⁵ *−14.2
* t-Student test with Welch’s correction (unequal variances according to the F-test). ** t-Student test without correction (equal variances according to the F-test). p-values for the t-Student test. Different letters in the same row show statistically differences from the given mean (p < 0.05).
Disclaimer/Publisher’s Note: The statements, opinions and data contained in all publications are solely those of the individual author(s) and contributor(s) and not of MDPI and/or the editor(s). MDPI and/or the editor(s) disclaim responsibility for any injury to people or property resulting from any ideas, methods, instructions or products referred to in the content.

