Article

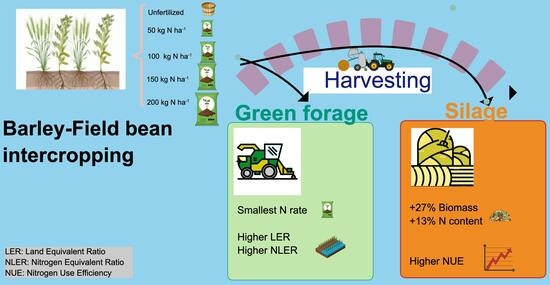
Better Land and Nitrogen Complementarity for Green Forage Than for Silage in Barley–Field Bean Intercropping

by
Francesco Giovanni Salvo Angeletti
1,
Silvia Pampana
2,*,
Sergio Saia
1 and
Marco Mariotti
1
1
Department of Veterinary Science, University of Pisa, 56124 Pisa, Italy
2
Department of Agriculture, Food and Environment, University of Pisa, 56124 Pisa, Italy
*
Author to whom correspondence should be addressed.
Agronomy 2023, 13(12), 2886; https://doi.org/10.3390/agronomy13122886
Submission received: 6 November 2023 / Revised: 21 November 2023 / Accepted: 22 November 2023 / Published: 24 November 2023

Abstract

:
Biomass and nitrogen (N) accumulation in intercrops for forage production under different fertilizations have seldom been assessed and, more occasionally, have been investigated at different stages. The biomass and N contents of barley (Hordeum vulgare L.) and field bean (Vicia faba L. var minor) grown as sole crops and intercrops, with five N rates from 0 to 200 kg ha−1, both at the heading and early dough stage of the cereal, for green forage and silage purposes, were determined in a two-year field experiment in Central Italy. We discovered differences between the two harvests both in their biomass production and N content as, at the latter stage, they, respectively, increased by 27 and 13%. The sole and intercropped crops showed differences at the two stages, essentially in the response of their inflorescences. N fertilization was more effective at the latter stage, because of the barley’s response to the nutrient availability. However, while nitrogen use efficiency improved with crop ageing, the values of the land equivalent ratio and the nitrogen land equivalent ratio declined; thus, a better complementarity in the use of land and N between the two species seemed to be achieved when the intercrop was grown for green forage purposes.

Graphical Abstract

1. Introduction

Forage is a major source of nutrition for milk or meat livestock; thus, the combination of forage quantity and quality is pivotal for both fostering livestock productivity and reducing the consequences of animal production on climate change [1]. The continuous allocation of forage in adequate quantities with an acceptable nutritional content is one of the main concerns in the herbivorous livestock value chain [2,3]. However, supporting adequate yields in simplified forage systems requires high inputs, such as fertilizers and agrochemicals, posing environmental concerns [4].
The sustainable intensification of forage cropping systems should recruit fewer inputs for higher crop yields and can be achieved through agroecosystem diversification and legume introduction [5,6]. The cultivation of more than one crop on the same field, an antique strategy called intercropping (IC) [7], is coherent with these concepts, as it may allow land sparing and, at the same time, raising the yields. More specifically, intercropping a cereal with a legume may deliver several ecological services and support sustainable animal production, because the morphological and physiological differences between the two species benefit their mutual association [8]. Compared to sole crops (SC), this agronomic practice establishes several advantages like an improved soil fertility with the symbiotic fixation of nitrogen (N), a better land use efficiency, a superior yield stability, soil conservation, a higher light, water, and nutrient use efficiency, and a lower occurrence of weeds, insects, or diseases [9,10,11,12,13]. Mixing cereal and legumes has been corroborated to increase forage production and quality [14,15,16,17] because cereals provide high dry-matter yields, and, in turn, legumes have a superior content of crude protein [2,3,18].
More specifically, intercropping barley (Hordeum vulgare L.) and field bean (Vicia faba L. var minor) has proven to be a suitable cropping system to increase both the quantity and the quality of forage production in Central Italy [14]. In Mediterranean areas, seasonal climatic variations and low summer rainfall entail the greatest herbage production in winter and spring. Unbalanced seasonal forage distribution can be addressed by farmers by storing high quality cellulose feed such as hay or silage (i.e., the harvest and storage of crops as fermented materials) for ruminants [19,20]. Accordingly, mixtures of annual legumes and cereals are commonly used both for herbage production and ensiling [2], but the harvesting time for mixed cereal and leguminous crops is usually based on the stage of the cereal component, with the optimal dry matter content for cereal harvesting ranging between 33% and 50%, depending on the climate and agronomic practices [21]. Consequently, the heading and dough stages of growth are considered as targets, respectively, for herbage and silage production. It has been demonstrated that intercropping legumes with cereals modifies yield distribution throughout the season [22] and that a deferred harvest time may provide higher yields, but forage has somewhat lower energy and protein levels.
In addition to the stage of harvest, agronomic practices, such as sowing time, planting pattern, and fertilizer application can affect both the relative competitive abilities of each crop and their growth pattern. The N transfer from the legume crop to a companion, intercropped species is very low [23], and N fertilization is required for intercropping to sustain the cereal yield [24,25], and this is even more mandatory in Mediterranean soils that are typically poor in nitrogen content. Therefore, in a companion paper [14], we focused on the appropriate rate of N fertilizer for barley–field bean intercropping, since a low N availability can strongly penalize cereal production, while excess N fertilizer can depress nodule formation and N fixation [26,27,28].
However, the competition for soil N between the cereal and the legume could be differently affected by increasing N availability due to fertilization, which likely alters the dynamics of biomass production and N uptake of the companion crops, both in time and in intensity.
Accordingly, we hypothesized that the N rates modified both the biomass accumulation and the N content in sole crops and intercrops, but that temporal changes could occur between the two harvesting stages for green forage and silage production, in such a way that the better system for biomass and N accumulation should differ.
To test these hypotheses, the present paper specifically aimed to achieve the following: (i) evaluate the optimal harvesting stage (i.e., green forage and silage) for barley and field bean sole crop and intercrop either for biomass production or N accumulation; and (ii) assess the differences in N resource use by the two cropping systems when harvested both for green forage and silage.

2. Materials and Methods

2.1. Site Characteristics and Experimental Design

The experiment was carried out on two consecutive seasons (Year I: 2014–2015 and Year II: 2015–2016) at the Department of Agriculture, Food, and Environment of the University of Pisa, Italy (43°40′ N, 10°19′ E), which has a Mediterranean (Csa) climate, with mean annual maximum and minimum daily air temperatures of 20.2 °C and 9.5 °C, and a mean annual rainfall of 971 mm.
The soil was Typic Xerofluvents and its main properties over the two years were similar and have been summarized in Table 1.
In the two experimental years, rainfall was similarly distributed in the period from sowing to heading and from heading to early dough; the values were slightly lower than the long-term mean for the site (−13 and 9%, respectively, in Year I and II). Overall, the air temperatures of both years were in line with the long-term average, and they marginally differed in the two cropping seasons, ranging from 4.2 to 22 °C in Year I and from 5.4 to 18.9 °C in Year II. The maximum temperatures in the period heading–early dough were somewhat higher in the first growing season and prompted a higher GDD accumulation (Table 2).
Each year, we compared five rates of nitrogen fertilizer (NR) and three cropping systems (CS) with a randomized complete block design, replicated three times. The five N fertilization rates were as follows: 0, 50, 100, 150, and 200 kg ha−1 (N0, N50, N100, N150, and N200). The three cropping systems were a barley sole crop, a field bean sole crop, and intercropped barley and field bean. The plots were about 21 m2, 3.5 m long with a width of 20 rows of barley, 10 rows of field bean, or 30 rows of barley–field bean.
The forage production was sampled both in the sole crops and intercrops at two stages of harvesting (SH) corresponding to the beginning of the heading and the early dough of the cereal, matching with the cuts made for green forage and silage, respectively (Table 3). The scale of the Biologische Bundesanstalt, Bundessortenamt and CHemical industry (BBCH) was used to identify the phenological development stages of the crops [29].

2.2. Crop Management

Apart from the experimental treatments, the plots were managed with the usual practices adopted by local farmers. The preceding crop was Brassica spp., and the soil was plowed at 30 cm in October, followed by two (disc and rotating) harrowings. Phosphorus and potassium were applied to all the crops pre-sowing, as triple superphosphate and potassium sulfate (150 kg ha−1 of P2O5 and 150 kg ha−1 of K2O), while nitrogen was applied at different rates, in agreement with the experimental design. Thus, N0 did not have any N fertilization, while the other treatments received the total N amount as urea split into the following two quotas: 25 kg N ha−1 at sowing and the remaining (i.e., 25, 75, 125, and 175 kg ha−1) at the stem elongation stage of the barley (BBCH 30) [29], on the 14 February 2015 and 22 February 2016, with the incorporation of the fertilizer in the top 3–5 cm of the soil, by hoeing. The same N rates were applied both to the sole and intercropped crops to allow for proper comparisons.
The crops were seeded on the 18th and 12th of November in the two years, using cultivars Ketos for the barley and Chiaro di Torrelama for the field bean. The seeding rates of the two sole crops were those commonly adopted (400 seeds m−2 for the barley and 70 seeds m−2 for the field bean), whilst intercropping followed an additive design (i.e., equivalent plant density in the intercrops and in the sole crops), so each component crop was seeded at a 1:1 ratio.

2.3. Sampling Procedures and Measurements

Phenological phases were monitored following the BBCH scale [29] to identify the precise growth stages for top-dressing inorganic N application and for the two harvests. Each year, at both harvests (Table 2), six, three, and six + three adjacent 100 cm long rows were collected, respectively, in the barley and field bean sole crops and in the intercrops. The plants were manually cut at the ground level, and those from IC were divided into the two species and then partitioned into leaves, stems, and spikes or pods; all the plant parts were oven-dried at 65 °C to a constant weight, and the dry weights (DW) were determined. Then, the samples were analyzed for their N concentration (Kjeldhal method). The N content was obtained multiplying the N concentration by the dry matter (DM).
Combined forage is defined as the forage produced by barley and field bean either as the sole crops or by intercropping together in the equivalent unit area (i.e., one hectare of intercropping and the sum of half a hectare of barley and field bean sole crops). To report to the same surface area for the SC (Equation (1)), the values of the two crops were averaged, whereas, for the IC, the values were pooled (Equation (2)).
Combined forage of sole crop = (DM yield of barley sole crop + DM yield of field bean sole crop)/2
Combined forage of intercrop = DM yield of barley component + DM yield of field bean component
The proportion (%) of leaves in the total dry matter was the following:
DM of leaves/total DM × 100
The land equivalent ratio (LER), i.e., the total land required under a sole crop to give the yields obtained in an intercrop was calculated following [7], as shown below.
LER = LERB + LERF
LERB = YBF/YB
LERF = YFB/YF
where:
  • LERB and LERF are the partial LERs of barley (B) and field bean (F);
  • YBF is the dry matter production of the intercropped barley;
  • YFB is the dry matter production of the intercropped field bean;
  • YB and YF are the dry matter production of the barley and field bean sole crops, respectively.
An aggressivity index (A) was used to evaluate which of the two crops dominated in the yield, by determining the relative yield increase in the intercropped barley (B) over the field bean (F) and was determined following [30].
AB = (YBF/(YB × ZBF)) − (YFB/(YF × ZFB))
AF = (YFB/(YF × ZFB)) − (YBF/(YB × ZBF))
where:
  • YBF, YFB, YB, and YF are the dry matter productions as defined above for the LER;
  • ZBF and ZFB are the proportions of barley and field bean in the intercropping system, respectively;
  • AB and AF are the barley’s and field bean’s aggressivity, respectively.
The competition between species has been estimated by means of the competitive ratio (CR) to indicate the number of times by which one component crop is more competitive than the other, calculated following [31], as shown below.
CRB = (LERB/LERF) × (ZFB/ZBF)
CRF = (LERF/LERB) × (ZBF/ZFB)
where:
  • CRB and CRF are the competitive ratios of barley (B) and field bean (F), respectively;
  • ZBF and ZFB are the proportions of barley and field bean in the intercropping system, respectively.
The competitive balance index (Cb), which measures the competitive ability of one component in a mixture to obtain limiting resources, compared to its ability to use these resources when grown in pure stands, was determined for both species according to [32], as shown below.
CbB = ln ((NYBF/NYB)/(NYFB/NYF))
CbF = ln ((NYFB/NYF)/(NYBF/NYB))
where:
  • CbB and CbF are the barley and field bean’s competitive balance indices, respectively;
  • NYBF, NYFB, NYB, and NYF have the same meaning as mentioned previously for the LER.
A Cb value of 0 indicates equal competitive abilities between components, whereas any positive (or negative) value indicates that the species for which the calculation was performed has a greater (or lower) competitive ability compared to the other species.
We determined the same indexes of intercropping performances for N yield to assess the N use advantage of intercropping. The equations of LER, A, CR, and Cb were used to assess the complementarity and competition between the companion crops for N uptake and were based on the total N content in the sole crops and intercropping, i.e., nitrogen equivalent ratio (N-LER), nitrogen aggressivity Index (N-A), nitrogen competitive ratio (N-CR), and nitrogen competitive balance index (N-Cb).
Finally, to evaluate the efficiency in nitrogen use of the sole and intercropped species, the index of nitrogen use efficiency (NUE) was determined according to the fertilizers-based approach [33] as shown below.
NUE = NY/FN
where:
  • NY is amount of N yield through forage (kg ha−1);
  • FN is the rate of N fertilizer applied (kg ha−1).

2.4. Statistical Analysis

Prior to our analyses, we verified the normality of the data using Shapiro–Wilk tests and the homogeneity of variances through Levene’s tests.
A first analysis of variance (ANOVA) did not reveal any significant effect of the year on the variables nor its interactions with other treatments to be statistically significant. Accordingly, a combined ANOVA over the years was then performed, as the homogeneity of variance over the two years was verified with Bartlett’s test. To determine whether the N rate (NR) could exert different effects on forage productivity and N efficiency in the different cropping system (CS), depending on the stage of harvesting (SH), data were analyzed with a split-split-split-plot design, with the N rates allocated as the main plots, the cropping systems as the subplots, and the stages of harvesting as the sub-subplots. According to Little and Hills [34], the SH factor was assigned to the sub-sub plots, as successive observations on the same plots can allow a more precise evaluation of the treatment and its interactions. When a main effect or interaction was significant, differences among the treatment means were separated at the 0.05 probability level using Tukey’s HSD Test.

3. Results

Even though the analysis of variance revealed statistical differences among the treatments and their interactions for several parameters (Supplementary Table S1), in the present paper we focused on the major results on the effects of the stage of the harvest for rational forage production. Because the main effect of the year and its interactions were not significant, the data are reported as the mean of the two years. The results are described both for each companion crop and for the combined forage, as above defined.

3.1. Accumulation of Biomass

In barley, the biomass of the leaves did not differ between the two stages of harvest and averaged 1325 kg ha−1, whilst the NR × SH interaction significantly affected the biomass accumulated in the stems, in the inflorescences, and in the whole aerial plant parts of the barley (Figure 1). The stems of the unfertilized barley had a similar biomass at the two stages but increased more (23%) at the latter stage in the plants fertilized with the highest N rate (Figure 1a). The inflorescences (Figure 1b) at heading were not different from the early dough in the unfertilized plants; contrariwise, when fertilized at the early dough stage, they accumulated more biomass. This was reflected on the total aerial biomass, which, similarly, did not differ between the two stages with N0 but increased by 31% with N200 (Figure 1c). Moreover, the biomass of the barley inflorescences was also changed by the CS × SH interaction, and their biomass increased more at the early dough stage in the intercropped (216%) than in the sole (197%) barley (Figure 2a).
As seen in the cereal, also the biomass of the legume inflorescences showed a significant CS × SH interaction, as, at the heading stage, it was similar in the sole and intercropped legume, and it increased by 5-fold in the field bean sole crops and by 4-fold in the intercropped field bean at the later stage (Figure 2b).
Also, the biomass of the field bean’s leaves, stems, and total aerial biomass was affected by the stage of harvesting and was higher at the early dough than at the heading by 10, 12, and 25%, respectively, and, finally, because of the scarce increase in leaves, their percentage at the latter stage diminished (Table 4).
The biomass of the leaves of the combined forage did not appreciably increase from the heading to the early dough stage (2327 and 2372 kg ha−1, respectively). Conversely, that of the stems significantly increased from 4988 to 5751 kg ha−1 (+15%); consequently, at the latter stage, the % of the leaves on the total biomass decreased from 29% to 23%.
As a result of the tendency of the two companion crops, the inflorescences of the combined forage also varied due the CS × SH interaction (Figure 2c): their biomass was similar in the SC and IC systems at the earlier harvesting stage but differently increased in the two systems with maturity; so, at the later stage, the biomass of the inflorescences was significantly superior in the combined forage of the intercrops (+22%).
Overall, the aerial biomass of the crops increased by 27%, but there was also a significant NR × SH interaction (Figure 3), and the unfertilized crops had a similar biomass at the two stages: those fertilized with N50 at the heading stage showed a lesser increase (18%) than at the early dough stage (42%), whilst, with the highest N rate, the spread was 1.62-fold higher at the latter stage (+4299 kg dry matter ha−1).

3.2. Nitrogen Concentration and Content

The N concentration of the stems of the barley plants was not affected by the stage of harvest, nor by the NR × SH, CS × SH, NR × CS × SH interactions; thus, as a mean of years, NR, and CS, it averaged 0.78%. Conversely, the SH significantly changed the N concentration in the leaves, inflorescences, and aerial biomass as it decreased significantly with the advancing of the phenological stage by about 10% in each plant part (Table 5).
The nitrogen content of the barley’s aerial biomass augmented by 21% from the heading to the early dough; this was because, although the N content slightly (+11%) increased in the stems and was conversely diminished in leaves (−17%), the inflorescences had their N content more than doubled from the heading to the early dough (13.4% vs. 29.6%).
Furthermore, the N content of the inflorescences increased differently at the latter stage among the N rates and between the sole crops and intercrops (i.e., the CS × SH and NR × SH interactions were statistically significant). At the early dough stage, it increased by 125% in the barley grown as sole crops and by 113% in the intercropped cereal, compared to that at the heading stage (Figure 4a). When the barley was unfertilized (i.e., N0), the N content of the inflorescences was similar between the two stages. Furthermore, the N rates progressively increased the N content; at the heading stage, there were no significant differences among the N rates for the N uptake, while, at the early dough stage, the highest N rate prompted an 87% increase in the N uptake compared to the lowest N rate (Figure 4b).
The N concentration of the field bean’s aerial biomass significantly decreased throughout the crop cycle (−10%), and the variation was produced by a decline in all plant fractions (−34% in stems, −18% in leaves, and −25% in inflorescences).
Furthermore, the N content of the legume’s aerial biomass was higher at the early dough stage (+11%) than at the heading stage (Table 6). This variation should be ascribed to the N content of the inflorescences that, from one stage to the other, increased from 7.9 to 37.6 kg ha−1 (+80%), whilst the N content in the leaves and stems decreased by 10% and 16%, respectively. However, the CS × SH interaction also affected this character, and, in both cropping systems, the inflorescences’ N content increased from the first to the second harvesting stage, but the rise resulted to be higher in the field bean sole crop (+404%) than in the intercropped field bean (+337%) (Figure 5).
The nitrogen concentration of the combined forage was affected by the SH main effect. As a mean of the cropping systems and N rates, from heading to early dough, the % of N of the leaves, stems, and aerial biomass decreased significantly by 14, 20, and 11%, respectively (Table 7), while that of the inflorescences did not vary and averaged 2.4%.
The N content of the aerial biomass of the combined forage was boosted at the later stage (+13%) (Table 7), triggered by the inflorescences, because the leaves showed a decrease (−13%), and no variation was observed in the stems (mean value 49.0 kg ha−1). In addition, the CS × SH interaction affected the N content of the inflorescences, as follows: at the heading stage, the sole and intercropped plants had similar N contents, which were differently boosted at the early dough stage, when the IC recorded higher (+36%) values than the SC (Figure 6).

3.3. Intercropping Evaluation and Nitrogen Use Efficiency

The total land equivalent ratio (LER) was higher than 1 whenever the crops were harvested; however, a higher value was achieved earlier (i.e., at the heading), and this was because the partial value of the barley dropped with the crop’s development, while that of the field bean remained unchanged (Table 8). The aggressivity index was very close to 0, thus denoting a reduced competitiveness between the crops; however, at heading, the barley was more aggressive than the field bean, while, at the early dough, the opposite result occurred. The competitive ratio (CR) confirmed that, at the heading, the barley was the most competitive species (CR = 1.17), while, at the early dough stage, it was the field bean (CR = 1.11). Similarly, from heading to early dough, the competitive balance index (Cb) decreased and was negative in the cereal, whereas it increased in the legume (Cb > 0).
Regardless of the treatment, the total N-LER resulted always remarkably greater than 1, but it significantly diminished (−8%) during the crops’ growth from heading to early dough (Table 9). The partial N-LER of the barley similarly reduced at the early dough stage, while that of the field bean remained unchanged between the harvest stages, and it appeared to be higher than 0.5. The aggressivity index (N-A), competitive ratio (N-CR), and competitive balance index (N-Cb) computed for the N content were not altered by the SH. So far, in the barley, there was a slight tendence to a decrease in all the indices, while in the field bean there was a tendency to increase.
Both the barley and the field bean improved their NUE from heading to early dough (+18% and +17%, respectively), similarly to the intercrop (+17%), likely because of the increase in biomass production and N uptake (Table 10).

4. Discussion

Determining the optimal harvest time for cereal and legume intercropping for forage production is pivotal, because the crop cycle of consociated species is often not harmonized [35,36], and a compromise for the optimal harvesting time-point between the two crops should be found. In our research, at the harvesting of the crops for green forage production, set up as the beginning of the heading stage of barley, the field bean was at its first visible pods. This corroborates our previous findings that, at this stage, the crop is about 10 days before its stage of maximum forage yield [37], because, at the early dough stage (i.e., 16 days later, from late April to early May, and with about 220° GDD accumulated), we found that the dry weight accumulation increased by 25%.

4.1. Accumulation of Biomass and Forage Quality

We hypothesized that biomass accumulation and N content in sole and intercrops could differ between the two harvesting stages (i.e., for green forage or for silage production) at varying N rates because of the contrasting growth pattern of each crop and the role of N availabilities on these growth patterns. Our results did not confirm this assumption, because, averaged over the two growing seasons, the dry matter biomass of the combined forage, irrespective of cropping systems, was boosted by about 2159 kg ha−1, and the N content increased by 18 kg ha−1 in just a few days over two weeks. This was because both the barley and the field bean similarly accumulated more biomass at the early dough stage (i.e., 1743 and 1450 kg ha−1, respectively, for the barley and the field bean). Furthermore, the leaf proportion of the combined forage was lower at the early dough stage. Therefore, the overall quality of the forage decreased with the advancement of plant maturity as, according to Villalba and their collaborators [38], an abridged leaf-to-stem ratio produces a decline in forage quality with maturity. In our research, this was mainly due to the decrease in leaf percentage in the field bean, confirming the findings of Luo et al., who found a diminishing trend in the biomass allocated in the leaves of intercropped fava bean [39].

4.2. Accumulation of Nitrogen

We found that, in combined forage, the N concentration decreased at the early dough compared to the heading stage and that this was likely because the weather conditions could support the biomass’ growth and N uptake at contrasting rates. So, the N concentration reduced as the biomass increased with plant growth, due to an apparent dilution effect [40]. This is a major issue for farmers and sustaining yield whilst improving tissue N concentration remains an imperative goal of mixed forage management [41].
However, the accumulation of N was consistent with that of the biomass, so the increase in biomass production over time caused a related, higher nutrient content of the forage of both the companion and combined crops. Thus, a postponed harvest could expand the N removal in harvested crop parts, likely lessening soil mineral N content and reducing the potential N leaching [42]. In turn, the harvested N would be eaten by livestock and reprocessed, and the rumen fermentation may generate greenhouse gasses like methane [43], and N could be excreted into the environment also as ammonia or urea [44].
In the present study, we discovered a significant NR × SH interaction in barley inflorescences and higher N rates increased the biomass partitioned to the inflorescences, in agreement with Arisnabarreta and their collaborators [45]. Most N uptake in the above-ground parts of barley occurs post-anthesis [46], but, conversely to our findings, it has been associated with a lower N utilization efficiency and a higher N concentration [47].
Our results also showed that the most rational N application rates should depend on the forage use, as follows: for green forage (early harvest, in our work), the N rate could be reduced (50 kg N ha−1 in our work), since the lower growth of the crop, and especially the barley, would not allow the uptake of higher amounts of N; for silage (late harvest in our work), at least a double rate (100 kg N ha−1 in our work) should be ensured to allow the crops to support the barley’s growth, whereas the legume’s growth is supported via the biological N2 fixation.
However, as expected, the cereal was differently responsive to N fertilization at the two stages, while the field bean was unaffected, in accordance with Corre-Hellou et al. [48], likely because of the faster, finer, and deeper root system of the cereal, which allowed a more efficient exploitation of the soil volume and a higher nutrient uptake in the earlier stages [49,50]. Consequently, in our research, the combined forage achieved a higher biomass and N content when intercropped than when sole cropped. This reflected the inflorescences’ behavior, and we could infer that the translocation of the biomass and nitrogen from the stems and leaves to the spike and pods (inflorescences) provided the basis for this result.

4.3. Complementarity of Crops and Intercropping Performances

As a further confirmation of the IC benefits, we found both LER and N-LER values higher than 1 in both harvests, suggesting that, probably, the N saving due to intercropping is largely due to an increased productivity per unit of land, and a complementarity for N use between the crops. Likewise, the high total N-LER values confirmed that intercropping uses less N to produce the same yields or, alternatively, that forage may be increased using intercropping with a similar amount of N applied to the corresponding sole crops. However, greater beneficial effects of intercropping at heading than at early dough were revealed by higher LERs values and may be attributed to less competition for growth resources between the companion species, as confirmed with both CR and Cb. Additionally, the N-LER was 1.84 at heading, while a lower value of 1.69 was obtained later, indicating that 84% more area was required in a sole crop system at heading to equal the yield of intercropping, while only 69% more area was required at the early dough stage. This result indicates that, at the earliest stage, there was a better complementarity for N uptake in the barley–field-bean intercropping, though the agronomic efficiency of the N fertilizer (NUE) for all the crops was boosted with crop growth. According to the values obtained for A, CR, and Cb, the barley was the dominant species only, at least, up to the heading stage, while, at early dough, the field bean became dominant. This was likely because both species required substantial amounts of N at this stage, but, what is more, during seed filling, the legume could have continued its vegetative growth (because of its indeterminate habit), whilst the nodules’ fixation activity could have decreased [51,52], driving the crop to rely more on soil N. Also, we applied the top-dressed N fertilization at the stem elongation stage, so, at the early dough stage, soil-N availability was likely significantly reduced, and, at these lower N levels in the soil, the legume could exert a higher interspecific ability, as also revealed by Ghaley et al. [24] in a wheat–pea intercrop.
In this research, a 47% greater area requirement (LER = 1.47) and an 84% greater N requirement (N-LER = 1.84) for sole crops were displayed at heading, while, later (i.e., early dough), intercropping had only a 39% greater relative yield (LER = 1.39) and a 69% greater relative N content (N-LER = 1.69). This entails a greater efficiency for N than for land in barley–field bean intercropping, corroborating a lower competition for N between cereals and legumes in intercropping [53] because of a strong potential for niche differentiation, mainly owing to the N-fixing capacity of legumes but also to the diverse abilities of the component crops to exploit soil layers. This was further confirmed by our findings showing that barley–field bean intercropping has the potential to achieve high LER and N-LER values also at low N rates (i.e., a not significant NR × SH interaction). However, we also discovered that temporal changes in the relationships between crops exist and that delaying the harvest has a negative effect on both LER and N-LER.

5. Conclusions

We established that harvesting at the early dough stage can be recommended for intercropping of barley–field bean for forage production in Central Italy, when compared to the heading stage, to obtain a higher biomass yield and a greater N content. However, the optimal N rate differed between the two stages of harvest and was 100 kg ha−1 and 50 kg ha−1 at the early dough and heading, respectively, suggesting that the type of forage used should be considered in nutrient management.
Moreover, whatever the N fertilizer applied, the N uptake from the soil was lower at the earlier stage (heading), so delaying the harvest at the early dough stage may allow the crop to use more nitrogen more efficiently, as confirmed by the increased nitrogen use efficiency, even if the complementarity between the crops for N uptake declined (as revealed with the total N-LER), likely driven by an increased competition of the field bean (i.e., greater CR and Cb).
In our field experiment, we could not evaluate the N dynamics that, in intercropping systems, may be affected by interspecific root interactions and should be addressed in future research.
Our results provided a theoretical basis for the optimization of harvest and nutrient management, for barley–field bean intercropping cultivated for forage and a practical guidance for mixed-forage farmers.

Supplementary Materials

The following supporting information can be downloaded at: https://www.mdpi.com/article/10.3390/agronomy13122886/s1. Supplementary Table S1: Analysis of variance (ANOVA) for variables on the biomass and N traits of barley, field bean, and combined forage with the source of variation, degrees of freedom, and F values for the main effects and the interactions. The sources of variations are the rate (NR), cropping system (CS), and stage of harvesting (SH).

Author Contributions

Conceptualization, M.M. and S.P.; methodology, M.M. and S.P.; validation, S.P. and F.G.S.A.; formal analysis, S.P. and F.G.S.A.; investigation, M.M., F.G.S.A. and S.P.; resources, S.S.; data curation, S.P., M.M. and F.G.S.A.; writing—original draft preparation, S.P.; writing—review and editing, M.M., F.G.S.A., S.S. and S.P.; visualization, S.P. and S.S.; supervision, M.M.; project administration, S.S.; funding acquisition, S.S. All authors have read and agreed to the published version of the manuscript.

Funding

This research received no external funding.

Data Availability Statement

Data are contained within the article and Supplementary Materials.

Conflicts of Interest

The authors declare no conflict of interest.

References

  1. Holman, J.D.; Obour, A.K.; Assefa, Y.; Johnson, S. Nutritive Value and Net Return of Forage Crop Rotations in the Central Great Plains. Agron. J. 2023, 115, 1399–1414. [Google Scholar] [CrossRef]
  2. Anil, L.; Park, J.; Phipps, R.H.; Miller, F.A. Temperate Intercropping of Cereals for Forage: A Review of the Potential for Growth and Utilization with Particular Reference to the UK. Grass Forage Sci. 1998, 53, 301–317. [Google Scholar] [CrossRef]
  3. Strydhorst, S.M.; King, J.R.; Lopetinsky, K.J.; Harker, K.N. Forage Potential of Intercropping Barley with Faba Bean, Lupin, or Field Pea. Agron. J. 2008, 100, 182–190. [Google Scholar] [CrossRef]
  4. Tabacco, E.; Comino, L.; Borreani, G. Production Efficiency, Costs and Environmental Impacts of Conventional and Dynamic Forage Systems for Dairy Farms in Italy. Eur. J. Agron. 2018, 99, 1–12. [Google Scholar] [CrossRef]
  5. Malézieux, E.; Beillouin, D.; Makowski, D. Feeding the World Better: Crop Diversification to Build Sustainable Food Systems. Perspective 2022, 58, 1–4. [Google Scholar] [CrossRef]
  6. Antichi, D.; Pampana, S.; Tramacere, L.G.; Biarnes, V.; Stute, I.; Kadžiulienė, Ž.; Howard, B.; Duarte, I.; Balodis, O.; Bertin, I.; et al. An Experimental Dataset on Yields of Pulses across Europe. Sci. Data 2023, 10, 708. [Google Scholar] [CrossRef] [PubMed]
  7. Willey, R.W. Intercropping—It’s Important and Research Needs. Part 1. Competition and Yield Advantages. Field Crop Abstr. 1979, 32, 1–10. [Google Scholar]
  8. Ghosh, P.K.; Manna, M.C.; Bandyopadhyay, K.K.; Ajay; Tripathi, A.K.; Wanjari, R.H.; Hati, K.M.; Misra, A.K.; Acharya, C.L.; Subba Rao, A. Interspecific Interaction and Nutrient Use in Soybean/Sorghum Intercropping System. Agron. J. 2006, 98, 1097–1108. [Google Scholar] [CrossRef]
  9. Xu, Z.; Li, C.; Zhang, C.; Yu, Y.; van der Werf, W.; Zhang, F. Intercropping Maize and Soybean Increases Efficiency of Land and Fertilizer Nitrogen Use; A Meta-Analysis. Field Crops Res. 2020, 246, 107661. [Google Scholar] [CrossRef]
  10. Monti, M.; Pellicanò, A.; Pristeri, A.; Badagliacca, G.; Preiti, G.; Gelsomino, A. Cereal/Grain Legume Intercropping in Rotation with Durum Wheat in Crop/Livestock Production Systems for Mediterranean Farming System. Field Crops Res. 2019, 240, 23–33. [Google Scholar] [CrossRef]
  11. Daryanto, S.; Fu, B.; Zhao, W.; Wang, S.; Jacinthe, P.-A.; Wang, L. Ecosystem Service Provision of Grain Legume and Cereal Intercropping in Africa. Agric. Syst. 2020, 178, 102761. [Google Scholar] [CrossRef]
  12. Stomph, T.; Dordas, C.; Baranger, A.; de Rijk, J.; Dong, B.; Evers, J.; Gu, C.; Li, L.; Simon, J.; Jensen, E.S. Designing Intercrops for High Yield, Yield Stability and Efficient Use of Resources: Are There Principles? Adv. Agron. 2020, 160, 1–50. [Google Scholar]
  13. Gu, C.; Bastiaans, L.; Anten, N.P.R.; Makowski, D.; van der Werf, W. Annual Intercropping Suppresses Weeds: A Meta-Analysis. Agric. Ecosyst. Environ. 2021, 322, 107658. [Google Scholar] [CrossRef]
  14. Pampana, S.; Arduini, I.; Andreuccetti, V.; Mariotti, M. Fine-Tuning N Fertilization for Forage and Grain Production of Barley–Field Bean Intercropping in Mediterranean Environments. Agronomy 2022, 12, 418. [Google Scholar] [CrossRef]
  15. Carr, P.M.; Martin, G.B.; Caton, J.S.; Poland, W.W. Forage and Nitrogen Yield of Barley—Pea and Oat—Pea Intercrops. Agron. J. 1998, 90, 79–84. [Google Scholar] [CrossRef]
  16. Carr, P.M.; Horsley, R.D.; Poland, W.W. Barley, Oat, and Cereal–Pea Mixtures as Dryland Forages in the Northern Great Plains. Agron. J. 2004, 96, 677–684. [Google Scholar] [CrossRef]
  17. Pappa, V.A.; Rees, R.M.; Walker, R.L.; Baddeley, J.A.; Watson, C.A. Legumes Intercropped with Spring Barley Contribute to Increased Biomass Production and Carry-over Effects. J. Agric. Sci. 2012, 150, 584–594. [Google Scholar] [CrossRef]
  18. Herbert, S.J.; Putnam, D.H.; Poos-Floyd, M.I.; Vargas, A.; Creighton, J.F. Forage Yield of Intercropped Corn and Soybean in Various Planting Patterns. Agron. J. 1984, 76, 507–510. [Google Scholar] [CrossRef]
  19. Sulc, R.M.; Tracy, B.F. Integrated Crop–Livestock Systems in the US Corn Belt. Agron. J. 2007, 99, 335–345. [Google Scholar] [CrossRef]
  20. Russelle, M.P.; Entz, M.H.; Franzluebbers, A.J. Reconsidering Integrated Crop–Livestock Systems in North America. Agron. J. 2007, 99, 325–334. [Google Scholar] [CrossRef]
  21. Hadjichristodoulou, A. Effect of Genotype and Rainfall on Yield and Quality of Forage Barley and Wheat Varieties in a Semi-Arid Region. J. Agric. Sci. 1976, 87, 489–497. [Google Scholar] [CrossRef]
  22. Sleugh, B.; Moore, K.J.; George, J.R.; Brummer, E.C. Binary Legume–Grass Mixtures Improve Forage Yield, Quality, and Seasonal Distribution. Agron. J. 2000, 92, 24–29. [Google Scholar] [CrossRef]
  23. Pirhofer-Walzl, K.; Rasmussen, J.; Jensen, H.H.; Eriksen, J.; Søegaard, K.; Rasmussen, J. Nitrogen transfer from forage legumes to nine neighbouring plants in a multi-species grassland. Plant Soil 2012, 350, 71–84. [Google Scholar] [CrossRef]
  24. Ghaley, B.B.; Hauggaard-Nielsen, H.; Høgh-Jensen, H.; Jensen, E.S. Intercropping of Wheat and Pea as Influenced by Nitrogen Fertilization. Nutr. Cycl. Agroecosyst. 2005, 73, 201–212. [Google Scholar] [CrossRef]
  25. Kalembasa, D.; Szukała, J.; Symanowicz, B.; Kalembasa, S.; Faligowska, A.; Becher, M. Amount of biologically nitrogen fixed by faba bean and its uptake by winter wheat determined by 15N ID method. Arch. Agron. Soil Sci. 2020, 67, 1875–1888. [Google Scholar] [CrossRef]
  26. van Kessel, C.; Hartley, C. Agricultural Management of Grain Legumes: Has It Led to an Increase in Nitrogen Fixation? Field Crops Res. 2000, 65, 165–181. [Google Scholar] [CrossRef]
  27. Peoples, M.B.; Bowman, A.M.; Gault, R.R.; Herridge, D.F.; McCallum, M.H.; McCormick, K.M.; Norton, R.M.; Rochester, I.J.; Scammell, G.J.; Schwenke, G.D. Factors Regulating the Contributions of Fixed Nitrogen by Pasture and Crop Legumes to Different Farming Systems of Eastern Australia. Plant Soil 2001, 228, 29–41. [Google Scholar] [CrossRef]
  28. Pampana, S.; Masoni, A.; Mariotti, M.; Ercoli, L.; Arduini, I. Nitrogen Fixation of Grain Legumes Differs in Response to Nitrogen Fertilisation. Exp. Agric. 2018, 54, 66–82. [Google Scholar] [CrossRef]
  29. Meyer, U. Growth Stages of Mono-and Dicotyledonous Plants—BBCH Monograph; Federal Biology Research Centre Agriculture Forestry: Berlin/Braunschweig, Germany, 2001. [Google Scholar]
  30. McGilchrist, C.A. Analysis of competition experiments. Biometrics 1965, 21, 975–985. [Google Scholar] [CrossRef]
  31. Willey, R.W.; Rao, M.R. A Competitive Ratio for Quantifying Competition between Intercrops. Exp. Agric. 1980, 16, 117–125. [Google Scholar] [CrossRef]
  32. Wilson, J.B. Shoot Competition and Root Competition. J. Appl. Ecol. 1988, 25, 279–296. [Google Scholar] [CrossRef]
  33. Martinez-Feria, R.A.; Castellano, M.J.; Dietzel, R.N.; Helmers, M.J.; Liebman, M.; Huber, I.; Archontoulis, S.V. Linking Crop- and Soil-Based Approaches to Evaluate System Nitrogen-Use Efficiency and Tradeoffs. Agric. Ecosyst. Environ. 2018, 256, 131–143. [Google Scholar] [CrossRef]
  34. Little, T.M.; Hills, F.J. Agricultural Experimentation Design and Analysis; Wiley: New York, NY, USA, 1978. [Google Scholar]
  35. Lithourgidis, A.S.; Dordas, C.A. Forage Yield, Growth Rate, and Nitrogen Uptake of Faba Bean Intercrops with Wheat, Barley, and Rye in Three Seeding Ratios. Crop Sci. 2010, 50, 2148–2158. [Google Scholar] [CrossRef]
  36. Bo, P.T.; Bai, Y.; Dong, Y.; Shi, H.; Soe Htet, M.N.; Samoon, H.A.; Zhang, R.; Tanveer, S.K.; Hai, J. Influence of Different Harvesting Stages and Cereals–Legume Mixture on Forage Biomass Yield, Nutritional Compositions, and Quality under Loess Plateau Region. Plants 2022, 11, 2801. [Google Scholar] [CrossRef] [PubMed]
  37. Mariotti, M.; Andreuccetti, V.; Arduini, I.; Minieri, S.; Pampana, S. Field Bean for Forage and Grain in Short-Season Rainfed Mediterranean Conditions. Ital. J. Agron. 2018, 11, 1112. [Google Scholar] [CrossRef]
  38. Villalba, J.J.; Ates, S.; MacAdam, J.W. Non-Fiber Carbohydrates in Forages and Their Influence on Beef Production Systems. Front. Sustain. Food Syst. 2021, 5, 566338. [Google Scholar] [CrossRef]
  39. Luo, C.; Zhu, J.; Ma, L.; Guo, Z.; Dong, K.; Dong, Y. Effects of Nitrogen Regulation and Strip Intercropping on Faba Bean Biomass, Nitrogen Accumulation and Distribution, and Interspecific Interactions. Crop Sci. 2021, 61, 4325–4343. [Google Scholar] [CrossRef]
  40. Greenwood, D.J.; Lemaire, G.; Gosse, G.; Cruz, P.; Draycott, A.; Neeteson, J.J. Decline in Percentage N of C3 and C4 Crops with Increasing Plant Mass. Ann. Bot. 1990, 66, 425–436. [Google Scholar] [CrossRef]
  41. Capstaff, N.M.; Miller, A.J. Improving the Yield and Nutritional Quality of Forage Crops. Front. Plant Sci. 2018, 9, 535. [Google Scholar] [CrossRef]
  42. Urbatzka, P.; Graß, R.; Haase, T.; Schüler, C.; Heß, J. Fate of Legume-Derived Nitrogen in Monocultures and Mixtures with Cereals. Agric. Ecosyst. Environ. 2009, 132, 116–125. [Google Scholar] [CrossRef]
  43. Bannink, A.; France, J.; Lopez, S.; Gerrits, W.J.J.; Kebreab, E.; Tamminga, S.; Dijkstra, J. Modelling the Implications of Feeding Strategy on Rumen Fermentation and Functioning of the Rumen Wall. Anim. Feed. Sci. Technol. 2008, 143, 3–26. [Google Scholar] [CrossRef]
  44. Kingston-Smith, A.H.; Davies, T.E.; Edwards, J.E.; Theodorou, M.K. From Plants to Animals; the Role of Plant Cell Death in Ruminant Herbivores. J. Exp. Bot. 2008, 59, 521–532. [Google Scholar] [CrossRef] [PubMed]
  45. Arisnabarreta, S.; Miralles, D.J. Nitrogen and Radiation Effects during the Active Spike-Growth Phase on Floret Development and Biomass Partitioning in 2-and 6-Rowed Barley Isolines. Crop Pasture Sci. 2010, 61, 578–587. [Google Scholar] [CrossRef]
  46. Dordas, C. Variation in Dry Matter and Nitrogen Accumulation and Remobilization in Barley as Affected by Fertilization, Cultivar, and Source–Sink Relations. Eur. J. Agron. 2012, 37, 31–42. [Google Scholar] [CrossRef]
  47. Bulman, P.; Smith, D.L. Post-heading Nitrogen Uptake, Retranslocation, and Partitioning in Spring Barley. Crop Sci. 1994, 34, 977–984. [Google Scholar] [CrossRef]
  48. Corre-Hellou, G.; Brisson, N.; Launay, M.; Fustec, J.; Crozat, Y. Effect of Root Depth Penetration on Soil Nitrogen Competitive Interactions and Dry Matter Production in Pea-Barley Intercrops given Different Soil Nitrogen Supplies. Field Crops Res. 2007, 103, 76–85. [Google Scholar] [CrossRef]
  49. Hauggaard-Nielsen, H.; Gooding, M.; Ambus, P.; Corre-Hellou, G.; Crozat, Y.; Dahlmann, C.; Dibet, A.; von Fragstein, P.; Pristeri, A.; Monti, M.; et al. Pea-Barley Intercropping for Efficient Symbiotic N2-Fixation, Soil N Acquisition and Use of Other Nutrients in European Organic Cropping Systems. Field Crops Res. 2009, 113, 64–71. [Google Scholar] [CrossRef]
  50. Dordas, C.A.; Lithourgidis, A.S. Growth, Yield and Nitrogen Performance of Faba Bean Intercrops with Oat and Triticale at Varying Seeding Ratios. Grass Forage Sci. 2011, 66, 569–577. [Google Scholar] [CrossRef]
  51. Herridge, D.F.; Pate, J.S. Utilization of Net Photosynthate for Nitrogen Fixation and Protein Production in an Annual Legume. Plant Physiol. 1977, 60, 759–764. [Google Scholar] [CrossRef]
  52. Pampana, S.; Masoni, A.; Arduini, I. Grain Legumes Differ in Nitrogen Accumulation and Remobilisation during Seed Filling. Acta Agric. Scand. B Soil Plant Sci. 2016, 66, 127–132. [Google Scholar] [CrossRef]
  53. Ofori, F.; Stern, W.R. Cereal-Legume Intercropping Systems. Adv. Agron. 1987, 41, 41–90. [Google Scholar]
Figure 1. Biomass production (DM kg ha−1) of the (a) stems, (b) inflorescences, and (c) aerial (i.e., above-ground) biomass of the barley as affected by the NR × SH interaction. The values are the means of two years, two cropping systems, and three replicates. The values with the same letter cannot be considered different at p ≤ 0.05. The bars represent the standard error.
Agronomy 13 02886 g001
Figure 2. Biomass (DM kg ha−1) of inflorescences of the (a) barley; (b) field bean, and (c) combined forage as affected by the CS × SH interaction. The values are the mean of two years, five N rates, and three replicates. The values with the same letter cannot be considered different at p ≤ 0.05. The bars represent the standard error. SC, sole crop; IC, intercrop.
Agronomy 13 02886 g002
Figure 3. Aerial biomass (DM kg ha−1) of the combined forage as affected by the NR × SH interaction. The values are the mean of two years, two cropping systems, and three replicates. The values with the same letter cannot be considered different at p ≤ 0.05. The bars represent the standard error.
Agronomy 13 02886 g003
Figure 4. Nitrogen content (kg ha−1) of the barley inflorescences as affected by the (a) CS × SH interaction and the (b) NR × SH interaction. The values are the means of two years, five N rates, and three replicates in (a) and of two years, two cropping systems, and three replicates in (b). The values with the same letter cannot be considered different at p ≤ 0.05. The bars represent the standard error. SC, sole crop; IC, intercrop.
Agronomy 13 02886 g004
Figure 5. Nitrogen content (kg ha−1) of the field bean inflorescences as affected by the CS × SH interaction. The values are the means of two years, five N rates, and three replicates. The values with the same letter cannot be considered different at p ≤ 0.05. The bars represent the standard error. SC, sole crop; IC, intercrop.
Agronomy 13 02886 g005
Figure 6. Nitrogen content (kg ha−1) of the combined forage inflorescences as affected by the CS × SH interaction. The values are the means of two years, five N rates, and three replicates. The values with the same letter cannot be considered different at p ≤ 0.05. The bars represent the standard error. SC, sole crop; IC, intercrop.
Agronomy 13 02886 g006
Table 1. Main chemical and physical characteristics of the soil in the two seasons of the experiment on barley–field bean intercropping, in Central Italy.
ParameterValueUnitsMethod
Sand45.2%Hydrometer (0.05 mm < Ø < 2 mm)
Silt40.6%Hydrometer (0.002 mm < Ø < 0.05 mm)
Clay14.2%Hydrometer (Ø < 0.002 mm)
pH8.5-1:2.5 (m:v) soil/water suspension
Organic matter2.1%Walkley and Black
Total nitrogen1.1g N kg−1Kjeldahl
Available phosphorus20.1mg kg−1 P2O5Olsen
Exchangeable potassium141.1mg kg−1 K2ODirks–Sheffer
Table 2. Rainfall (mm), maximum and minimum temperatures (°C), and growing degree days (°C day−1) during the sowing–heading and heading–early dough periods in the two seasons of the experiment on barley–field bean intercropping, in Central Italy.
PeriodRainfallT MaxT MinGDD * BarleyGDD Field Bean
mm°C°C°C day−1°C day−1
I Year
Sowing–heading **432.214.54.21452.91189.4
Heading–early dough25.622.010.4308.4276.1
Growth cycle457.818.37.31761.31465.5
II Year
Sowing–heading **434.814.85.41624.71351.0
Heading–early dough47.218.98.3190.1166.3
Growth cycle482.016.86.81814.71517.2
* GDD = Growing degree days, the base temperature was 0 °C for barley and 1.7 °C for field bean; ** heading refers to the stage of the barley also for the field bean’s harvest.
Table 3. Stage of harvesting, growth stage of the crops, code of the stage, and date of the two harvests for forage production in the two seasons of the experiment on barley–field bean intercropping, in Central Italy.
Stage of HarvestingGrowth StageCode of StageDate
Green forageBarley: beginning of heading *
Field bean: first pods visible
BBCH 70
BBCH 51
21 April 2015
20 April 2016
SilageBarley: early dough
Field bean: final pods’ development
BBCH 83
BCCH 79
10 May 2015
4 May 2016
* Heading hereafter.
Table 4. Biomass (DM kg ha−1) of the leaves, stems, and aerial biomass of the field bean forage and percent of leaves on aerial biomass as affected by the SH main effect. The values are the means of two years, five N rates, two cropping systems, and three replicates.
Stage of HarvestingBiomass
LeavesStemsAerialLeaves
kg ha−1% on Total Aerial Biomass
Heading1884 b3898 b5930 b31.8 a
Early dough2077 a4373 a7380 a28.1 b
Within a column, the values with the same letter cannot be considered different at p ≤ 0.05.
Table 5. Nitrogen concentration (%) and content (kg ha−1) of the leaves, inflorescences, and aerial biomass of the barley forage as affected by the SH main effect. The values are the means of two years, five N rates, two cropping systems, and three replicates.
Stage of HarvestingNitrogen ConcentrationNitrogen Content
LeavesInflorescencesAerial BiomassLeavesAerial Biomass
%kg ha−1
Heading2.0 a1.7 a1.3 a28.6 a67.3 b
Early dough1.8 b1.5 b1.2 b23.8 b81.4 a
Within a column, the values with the same letter cannot be considered different at p ≤ 0.05.
Table 6. Nitrogen concentration (%) and content (kg ha−1) of the leaves, stems, inflorescences, and aerial biomass of the field bean forage as affected by the SH main effect. The values are the means of two years, five N rates, two cropping systems, and three replicates.
Stage of HarvestingNitrogen ConcentrationNitrogen Content
LeavesStemsInflorescencesAerial BiomassLeavesStemsAerial Biomass
%kg ha−1
Heading4.2 a1.2 a5.4 a2.2 a79.7 a45.7 a133.3 b
Early dough3.4 b0.9 b4.1 b2.0 b71.8 b38.2 b147.6 a
Within a column, the values with the same letter cannot be considered different at p ≤ 0.05.
Table 7. Nitrogen concentration (%) and content (kg ha−1) of the leaves, stems, and aerial biomass of the combined forage as affected by the SH main effect. The values are the means of two years, five N rates, two cropping systems, and three replicates.
Stage of HarvestingNitrogen ConcentrationNitrogen Content
LeavesStemsAerial BiomassLeavesStemsAerial Biomass
%kg ha−1
Heading3.3 a1.0 a1.8 a77.6 a50.90 a143.6 b
Early dough2.9 b0.8 b1.6 b67.7 b47.13 a161.8 a
Within a column, the values with the same letter cannot be considered different at p ≤ 0.05.
Table 8. Partial land equivalent ratio (LER), aggressivity index (A), competitive ratio (CR), and competitive balance index (Cb) of the barley and field bean and total LER for biomass production, as affected by the SH main effect. The values are the means of two years, five N rates, and three replicates.
Stage of HarvestingBarleyField BeanTotal LER
Partial LERACRCbPartial LERACRCb
Heading0. 77 a0.07 a1.17 a0.08 a0.70 a−0.07 b1.00 b−0.08 b1.47 a
Early dough0.67 b−0.04 b0.96 b−0.07 b0.72 a0.04 a1.11 a0.07 a1.39 b
Within a column, the values with the same letter cannot be considered different at p ≤ 0.05.
Table 9. Partial N-land equivalent ratio (LER), N-aggressivity index (N-A), N-competitive ratio (N-CR), and N-competitive balance index (N-Cb) of the barley and field bean and the total N-LER as affected by the SH main effect. The values are the means of two years, five N rates, and three replicates.
Stage of HarvestingBarleyField BeanTotal N-LER
Partial N-LERN-AN-CRN-CbPartial N-LERN-AN-CRN-Cb
Heading1.18 a0.51 a1.86 a0.55 a0.66 a−0.51 a0.62 a−0.55 a1.84 a
Early dough1.04 b0.40 a1.64 a0.44 a0.64 a−0.40 a0.67 a−0.44 a1.69 b
Within a column, the values with the same letter cannot be considered different at p ≤ 0.05.
Table 10. Nitrogen use efficiency (NUE) of the barley, field bean, and combined species as affected by the SH main effect. The values are the means of two years, five N rates, two cropping systems, and three replicates.
Stage of HarvestingNitrogen Use Efficiency
BarleyField BeanCombined Species
kg kg−1
Heading0.7 b1.4 b1.5 b
Early dough0.8 a1.6 a1.7 a
Within a column, the values with the same letter cannot be considered different at p ≤ 0.05.
Disclaimer/Publisher’s Note: The statements, opinions and data contained in all publications are solely those of the individual author(s) and contributor(s) and not of MDPI and/or the editor(s). MDPI and/or the editor(s) disclaim responsibility for any injury to people or property resulting from any ideas, methods, instructions or products referred to in the content.

