Article

Alternative Starter Fertilization Strategies in Maize (Zea mays L.) Cultivation: Agronomic Potential of Microgranular Fertilizer and Plant Growth-Promoting Microorganisms and Their Impact on the Soil Native Microbial Community

1
Leibnitz Centre for Agricultural Landscape Research (ZALF), Eberswalder Str. 84, 15374 Müncheberg, Germany
2
Faculty of Agricultural and Environmental Sciences, University of Rostock, Justus-von-Liebig-Weg 6, 18059 Rostock, Germany
*
Author to whom correspondence should be addressed.
Agronomy 2023, 13(12), 2900; https://doi.org/10.3390/agronomy13122900
Submission received: 25 October 2023 / Revised: 17 November 2023 / Accepted: 24 November 2023 / Published: 25 November 2023

Abstract

:
Phosphorous (P) starter fertilization can increase maize (Zea mays L.) yield. Widespread application in soils with sufficient P availability leads to environmental risks. Subsequently, alternative strategies to support the maize plant’s early development are needed to lower P surpluses. Here, we conducted field experiments comparing standard starter fertilizer diammonium phosphate (DAP) (20.1 kg P ha−1) to microgranular fertilizer (MG) (2.4 kg P ha−1) and combined in-furrow inoculation with Bacillus atrophaeus and mycorrhizal fungi (Rhizoglomus irregulare, Funneliformis mosseae, and Funneliformis caledonium), alone and in combination. The soil microbial community inside and between the maize rows was monitored by quantitative PCR (qPCR)-based quantification of eight fungal and bacterial groups. The yield did not vary between fertilization with DAP or MG and no fertilizer control. The combined microorganism inoculum (MO), however, enhanced the yield by 4.2%. The soil microbial community composition was not affected by the MO application. However, on one field site and inside the rows, it leads to a significant increase in overall microbial gene copy numbers by 9.3% and a significant decrease in the relative abundance of the bacterial phylum of Bacillota (Firmicutes) by 18%. The in-furrow MO application is thus a promising option for starter fertilizer replacement.

1. Introduction

Modern agriculture in Western Europe is characterized by high yields based on high inputs of energy and nutrients. The yearly phosphorous (P) surpluses applied to crops and grasslands in Germany in the past have led to elevated soil P concentrations, especially in areas with high livestock density [1,2]. At present, German agricultural soil surface P balance has been estimated to be roughly neutral on average, while the north-western regions with high livestock density still feature annual P surpluses of up to >10 kg P ha −1 [1,3]. High soil P levels and excessive P application fuel massive nutrient losses and environmental hazards like the eutrophication of surface water bodies [1,4]. Additionally, P is a limited resource whose reserves are unequally distributed worldwide, leading to risks for global food security [5,6]. It is thus of the utmost importance to reduce P fertilizer inputs, especially in regions already exhibiting high soil nutrient levels, and to close P cycles.
In maize (Zea mays L.) cultivation, starter fertilization is used to guarantee a sufficient supply of P in the early growth stages of the plant when its root system is still small. It is usually applied at sowing in a band of 5 cm beneath and 5 cm beside and below the furrow (5 × 5 application). The amount of P applied with the starter fertilizer can vary depending on soil P concentrations. The effect of starter fertilization on yield depends on many factors, leading to inconsistent study results. While some studies find yield-increasing effects of starter fertilizer [7,8], others do not [9,10]. A recent meta-analysis has shown that starter fertilization increases maize yield by 5.2% on average, while this effect diminishes with rising soil test P levels [11]. The yield increase after starter fertilization or whole-field P fertilization reaches values below 1% at soil test P levels of over 15 mg 100 g−1 soil (soil test class E) [11,12]. In Germany, starter fertilization is a widespread practice, even in areas with high P-testing soils. It is thus important to investigate and promote the omission of starter fertilization or replacement with low-nutrient-input alternatives to lower P inputs in soils.
One strategy to reduce the nutrient input is the use of in-furrow starter fertilizers that are directly applied beneath the seed at less than half the N and P application rates of standard 5 × 5 band fertilization [11]. In-furrow starter fertilization has been shown to be equally effective in increasing maize grain yield compared to the 5 × 5 band fertilization when the principal nitrogen (N) fertilizer is given before or at sowing [8,11]. Organomineral microgranular fertilizers (MG) manufactured from waste materials like bone and whey protein have been proposed as in-furrow starter fertilizers. They have been shown to increase the yield and root density of young maize plants in pot experiments [13,14]. Two field studies have found maize yields after MG starter fertilization to be about equal to yields with standard diammonium phosphate (DAP) starter fertilization [15,16]. The widespread usage of MG as a starter fertilizer in maize could simultaneously lower nutrient inputs and be a step towards closing nutrient cycles.
Another strategy to reduce nutrient inputs while maintaining high yields is to make the nutrients in the soil more accessible for the crop. Two options to influence the nutrient availability of the plant are changing the soil pH and applying plant-beneficial microorganisms. Meta-analyses have shown that inoculation with arbuscular mycorrhizal fungi (AMF) and plant growth-promoting rhizobacteria (PGPR) increases cereal yield in field experiments. They reported a maize grain yield increase (13%) after AMF inoculation [17] and a cereal yield increase (13%) after “biofertilizer” (AMF and PGPR) application, with both P and N use efficiency increasing by around 6 kg yield kg−1 N or P [18]. The reported yield increases could be due to increased nutrient availability mediated by the inoculated microorganisms or other plant growth-promoting mechanisms. Plant-associated microbes influence plant growth through the production of phytohormones and signaling molecules, fixation of N, mobilization of P and minerals, pathogen suppression, and stimulation of the plant immune system [19,20,21]. Subsequently, the application of PGPR has been shown to influence root biomass and architecture, influence plant development timepoints, enhance resistance to abiotic and biotic stressors, and even trigger induced systemic resistance against pathogens by activating the pattern recognition receptors [22,23,24,25,26]. AMF and PGPR can be applied in the furrow at sowing and are thus a promising option to act as a partial or complete replacement for starter fertilization.
The soil and rhizosphere microbiome is a complex network composed of a myriad of different fungi, bacteria, oomycetes, and archaea. The bulk soil microbiome is shaped by many different parameters, like soil texture, temperature, moisture, pH, organic matter content, and soil amendments like organic or inorganic fertilizers [27,28,29,30]. The rhizosphere microbiome depends on the bulk soil microbiome [31] and is additionally influenced by plant species, genotype, and development stage [19,32,33,34,35,36,37]. This becomes more complex as one contemplates the network character of the soil and rhizosphere microbiome. For example, AMF interacts with “mycorrhiza helper bacteria” and creates their own hyphosphere, which is mediated by hyphal exudates [38,39]. A recent review showed that fungal and bacterial inoculants have the capacity to either increase or decrease the diversity of native fungal and bacterial communities, while in almost half of the reviewed studies, the native communities’ diversity was not changed following inoculation [40]. Only a few studies have been published on the effect of inoculation with Bacillus strains or consortia containing Bacilli on the native soil microbial community [41].
Changes in the soil microbial community can regularly be detected at the phyla and class levels [42,43,44]. Often, next-generation sequencing is used to measure the relative abundance of bacterial phyla or classes. Quantitative real-time PCR is a cost-effective alternative and has been shown to detect changes in the soil microbial community due to, for example, different environments [45], cattle impacts [46], additions of biochar and readily available carbon [47], and C-mineralization rates [48].
There are few studies investigating the agronomic potential of MG as a starter fertilizer in the field. Also, there are very few studies using in-furrow inoculation with AMF and PGPR [15,16,49,50] as a replacement for starter fertilization. Little is known about the impact of AMF and PGPR inoculation on the native soil microbial community [41], although it plays a pivotal role in nutrient cycles and is an important factor in soil quality.
This study aimed to investigate the potential of starter fertilization with MG and a combined inoculum containing PGBP and AMF to substitute the standard DAP starter fertilization. A second objective was to shed some light on the impact of amendments to DAP, MG, and the microbial inoculum on the native soil microbial community and add to the general understanding of the soil microbiome in the field. Field experiments with a randomized plot design were conducted at two field sites in Wanna, Lower Saxony, Germany. The soil microbial community was monitored by quantitative polymerase chain reaction (qPCR)-based quantification of eight fungal and bacterial groups.

2. Materials and Methods

2.1. Site Description and Weather Data

The experiment was conducted at two field sites near Wanna (Lower Saxony, Germany), “Wanna Sand” (WS) (53.751389, 8.763083) and “Wanna Sand without biogas slurry” (WSo) (53.741333, 8.817417). The WS site was a deep podzol-gley with a 30 cm deep A-horizon, and the WSo site was a plaggic anthrosol above a podzol with a 70 cm deep A/E-horizon. The soil type is weakly silty sand (Su2 in the German Bodenartendiagramm (BK 1994)) at both sites (NIBIS Kartenserver, https://nibis.lbeg.de/cardomap3/, accessed on 25 October 2023). The WS site received a regular application of biogas slurry in the years before the experiment setup, while the WSo site did not. Soil parameters after the biogas application but before the experimental setup are summarized in Table 1.
The region is classified as having a European Atlantic climate [51], characterized by mild winters and moderate summer temperatures. The average precipitation per year for Wanna is 735 mm, and the average annual temperature is 9.9 °C. Usually, more than 45% of annual precipitation falls during the maize crop season from April to September. In April and May, the soil temperatures are often low due to cold night temperatures, which slows down early plant development. The weather data of the experimental year (2021) from the nearest weather station in Steinau (Lower Saxony, Germany) are displayed in Figure S1.

2.2. Preparation of Combined Plant-Beneficial Microorganism Inoculum

The combined microorganism inoculum (MO) was prepared with two different carrier materials: MG and bentonite. The commercially available AMF product INOQ Advantage Pellets (INOQ GmbH, Schnega, Germany) containing the three species Rhizoglomus irregulare, Funneliformis mosseae, and Funneliformis caledonium (144 propagules (ppg) g−1) was ground to obtain a particle size similar to the particle sizes of MG and bentonite. The ground mycorrhiza product was then mixed together with MG or bentonite to reach a concentration of 0.12–0.128 Mio ppg per kg. The resulting mixtures were then sprayed with the commercially available product RhizoVital C5 (Abitep GmbH, Berlin, Germany) containing the strain Bacillus atrophaeus Abi05 (DSM 29418) (3.47 × 10¹⁰ cells ml−1) at a rate of 0.08 L per kg. The product was then air-dried and mixed again.

2.3. Experiment Setup and Field Treatments

At the WS site, biogas slurry containing 4.3 kg m−3 total N, 0.56 kg m−3 of P, and 4.3 kg m−3 of potassium (K) was applied before sowing and experiment setup at a rate of 30 m3 ha−1, resulting in a nutrient input of 129.0 kg N ha−1, 16.9 kg P ha−1 and 128.3 kg K ha−1. The WSo site did not receive biogas slurry.
Startec microgranular fertilizer (De Ceuster Meststoffen NV (DCM), Bannerlaan 79, 2280 Grobbendonk, Belgium) was used as an MG. It can be classified as an organomineral fertilizer, of which 80% (of the original substance) is made up of the organic industrial by-products oil cake and deglued bone meal. The added mineral components comprise ammonium phosphate, ammonium sulfate, ethylenediaminetetraacetic acid chelated iron, manganese, zinc, zinc sulfate, and zinc oxide. The resulting product contains 7.5% nitrogen, 9.6% P, 3.3% K, 4% sulfur, 1.5% zinc, 0.5% iron and 0.5% manganese. DAP is a standard mineral fertilizer produced from rock phosphate and contains 18.0% total nitrogen and 20.1% P.
The plot experiment set up on each field site comprised six different treatments: control without starter fertilization or MO application, DAP, MG, MO, DAP + MO, and MG + MO. Each treatment was carried out with fivefold repetition in 8 × 20 m2 sized plots following a randomized design. Application rates of starter fertilizers and MO, including the resulting nutrient inputs for each treatment, are summarized in Table 2.
The experiment was conducted in the growing season of 2021. The AMAZONE single-grain seeder system (EDX 6000-2C precision air-seeder, Amazonen-Werke H. Dreyer SE Co. KG, Hasbergen, Germany) was used for simultaneous sowing, the application of starter fertilization and the application of microorganisms on 20 April 2021. The maize cultivar Amaroc S230 was sown with an 80 cm row distance and 85,000 seeds ha−1. DAP was applied in a band 5 cm below and 5 cm beside the grain. MG and MO were applied in the furrow a few centimeters beneath the grain. The application rate of MO resulted in an application rate of 6.94 × 10¹³ cells ha−1 Bacillus atrophaeus Abi05 and 3–3.2 Mio ppg ha−1.
According to good agricultural practice, both sites were treated with the herbicides Spectrum Gold, Motivell Forte, Nagano, and Callisto at rates of 1.3 L ha−1, 0.5 L ha−1, 0.5 L ha−1, and 0.5 L ha−1, respectively. The harvest took place with a Krone Big X 780 forage harvester in the version OptiMaize (Maschinenfabrik Bernard KRONE GmbH & Co. KG, Spelle, Germany) with integrated logging of fresh mass yield and several characteristics of the harvested crops via a near-infrared spectroscopy (NIR) sensor. The NIR-Scanner model was the NIR SmartSensor Krone (Dinamica Generale S.p.A., Poggio Rusco (MN), Italy).

2.4. Soil and Root Sampling

Soil samples were taken at three sampling dates in two sampling regimes. The sampling dates were t2 (7 June 21), t3 (20 July 21/21 July 21), and t4 (16 August 21/17 August 21). The development stages of the maize plants according to the German Biologische Bundesanstalt für Land- und Forstwirtschaft, Bundessortenamt und Chemische Industrie (BBCH) scale [52] were 13–19, 33–35, and 69, respectively. In one sampling regime, four soil cores of 0–30 cm depth were taken in each plot near the maize rows and mixed thoroughly to form one sample per plot. This sampling regime was performed at sampling dates t2 and t3, and the resulting samples were used to analyze the nutrient concentrations in the soil. In the second sampling regime, six soil cores of depth 0–30 cm were taken from a small area approximately in the middle of each plot. Three of them were taken in the maize row between four neighboring plants and thus inside the application area of the starter fertilizer and plant-beneficial microorganisms. The other three samples were taken in direct proximity to the first three samples, but in the middle between two rows and thus outside the application area. This sampling regime was performed on sampling dates t3 and t4, and the resulting samples were used for the measurement of soil dry mass content and deoxyribonucleic acid (DNA) extraction. Along with the second sampling regime at sampling date t3, the rootstock of five plants from each treatment was collected from the area of soil sampling.
The soil samples were cooled directly at the site and frozen at −20 °C upon arrival at the laboratory until further preparation. The rootstocks were transported without cooling and cooled at 5 °C upon arrival at the laboratory. Within one week of sample collection, a small heap of fine roots was collected from each rootstock, washed with tap water, and stored in 2 mL tubes filled with deionized water at −20 °C until further use.

2.5. Measurement of Soil Nutrient Concentrations

The plant available P concentration (PDL) and mineral N content (Nmin) in the soil were measured according to the standard protocol from the Association of German Agricultural Analytic and Research Institutes (VDLUFA, Speyer, Germany). To measure PDL, 4 g of air-dried and sieved (2 mm) soil samples were extracted with 200 mL of double-lactate solution (calcium lactate (0.4 M C6H10CaO6 * 5 H2O)) and hydrochloric acid (0.5 M HCl) at pH 3.6. The suspension was shaken overhead for 90 min at 35 rpm. After filtration (cellulose round filter, from 3 to 5 µm), the PDL concentration was determined via inductively coupled plasma–optical emission spectrometry (ICP-OES) (Optima 8300 D, PerkinElmer, Waltham, MA, USA). To determine Nmin, 20 g of fresh soil was suspended in 200 mL of a 12.5 mM CaCl2 solution and shaken overhead for 2 h. Soil extracts were analyzed for nitrate and ammonium via continuous flow analysis (AutoAnalyzer AA3, Seal Analytical, King’s Lynn, UK).

2.6. Measurement of Mycorrhizal Colonisation Rate

The roots were stained using a modification of the method described by Vierheilig and Piché [53]. The roots were thawed at room temperature, then immersed in potassium hydroxide (10%) and shaken overnight in a New Brunswick Innova® 42 incubator shaker (Eppendorf SE, Hamburg, Germany) at 50 °C. The roots were then rinsed with tap water several times and immersed in staining liquid (1:1:1 ratio of distilled water, glycerol, and DL-Lactic acid, 0.05% methyl blue). The flasks containing the roots and staining liquid were boiled in a water bath for 3–4 min. After staining, the roots were rinsed with tap water and stored in 100 µL lactoglycerol at 5 °C. The root mycorrhizal colonization rate was measured by the grid intersect method, as described by Giovannetti and Mosse [54], counting 100 intersects per sample at a SteREO Discovery.V20 microscope (ZEISS, Oberkochen, Germany) with 265× magnification.

2.7. Measurement of Dry Mass Content and DNA Extraction

Thawed soil samples were thoroughly mixed in the sample bag with a sterile spatula. The dry mass content of each sample was measured by drying approximately 5 g of soil at 70 °C in a drying cabinet. The samples were processed along with samples from organic soils not included in this study, leading to the choice of a 70 °C drying temperature [55].
A total of 500 g of fresh soil was used for DNA extraction with the NucleoSpin™ Soil Kit (Macherey Nagel™, Düren, Germany) using the lysis buffer SL1 and no enhancer. The bead tubes were shaken at 5G for 2 × 30 s in a FastPrep-24TM 5G homogenizer (MP Biomedicals, Santa Ana, CA, USA). Before the elution step, the membranes were left to dry at room temperature for 10 min. The DNA was eluted in two steps with 30 µL and 15 µL of the elution buffer. The DNA concentration and A260/A280 ratio of each sample were measured in duplicate with the NanoDropTM Lite Spectrophotometer (Thermo Fisher Scientific Inc., Waltham, MA, USA). The A260/A280 ratio was above 1.8 for all samples. The DNA yield was between approximately 75 ng µL−1 and 200 ng µL−1.

2.8. qPCR Analysis

The extracted DNA was used in nine different qPCR assays to quantify the abundance of six bacterial taxa (Acidobacteria, Actinobacteria, α-Proteobacteria, β-Proteobacteria, Firmicutes, and Cyanobacteria), the total fungi (ITS), the fungal genus Fusarium, and the inoculated bacterial strain Bacillus atrophaeus Abi05 in each soil sample. The qPCR conditions of all assays are summarized in Table A1 in Appendix A. The inoculated strain was quantified by qPCR with primers designed by ABiTEP GmbH. The primers are specific to the strain Abi05 and are able to discriminate it from other B. atrophaeus strains. The qPCR assays were conducted in polypropylene 96-well plates using the QuantStudioTM 12K Flex Real-Time PCR System (Life Technologies, Grand Island, NY, USA). Two technical replicate measurements were performed for each assay and DNA sample. If the measured abundance differed by more than 20% between the replicates, two more replications were performed.
The calibration curves were calculated from a series of dilutions of standard-strain DNA on each plate. Each dilution series consisted of at least five steps and spanned the complete range of template concentrations. The standard strains were bacterial or fungal strains sourced from culture collections of microorganisms of colleagues and the DSMZ (Leibniz Institute DSMZ-German Collection of Microorganisms and Cell Cultures GmbH, Inhoffenstraße 7 B, 38,124 Braunschweig). To obtain standard DNA, the standard strains were grown on agar plates, the cultures were scraped off with a sterile spatula, and their DNA was isolated and quantified in the same manner as the soil samples. The standard DNA was kept at 5 °C; dilutions were freshly made every day in ultra-pure water (ELGA PURELAB® flex 3, Veolia Water Technologies Deutschland GmbH, Celle, Germany).
Each assay’s annealing temperature and time were optimized using melting curves. The specificity of each assay was checked using all the standard strains described in Table A1 and additional strains of Streptomyces avermitilis (Actinobacteria), Rhizobium azooxidifex (α-Proteobacteria), Burkholderia phymatum (β-Proteobacteria), and Paenibacillus uliginis (Firmicutes) as negative/positive controls. Additionally, each assay product was checked for undesired fragments with gel electrophoresis. All assays except the β-Proteobacteria and Acidobacteria produced one band of the expected size. The β-Proteobacteria exhibited two bands that can both be attributed to the targeted group according to the basic local alignment search tool (BLAST). The Acidobacteria-specific assay exhibited several bands. As a 100% specificity was published for the primer pair used in soil samples [45], a reasonable specificity was nonetheless assumed.
qPCR inhibition was detected by spiking with standard DNA when undiluted template DNA was used. No inhibition was detected when template DNA was used in a 1:10 or 1:25 dilution. To correct for the inhibition in assays that use undiluted template DNA, an additional inhibition assay was performed using an artificial DNA fragment and matching primers [56]. The abundance of the artificial DNA fragment was measured in the presence and absence of template DNA, and an inhibition factor (finhib)was calculated for each sample using Formula (1):
f i n h i b = l o g 10 ( A b u i n h i b b a s e ) l o g 10 ( A b u i n h i b s a m p l e ) ,
with Abuinhib-base being the abundance of the DNA fragment measured in the absence of the template DNA and Abuinhib-sample being the abundance of the DNA fragment measured in the presence of the template DNA. Then, the abundances measured with the group-specific qPCR assays in question were corrected according to Formula (2):
A b u k o r r = 10 A b u m e a s × f i n h i b × E f f a s s a y E f f i n h i b ,
with Abumeas being the abundance measured with a group-specific assay, Abukorr being the group-specific abundance corrected for inhibition, Effassay being the average efficiency of the corrected assay, and Effinhib being the average efficiency of the inhibition assay. An average efficiency, calculated from 10 plates of each assay, was used.

2.9. Statistical Analysis

Data organization and visualization were performed using R Statistical Software (v4.2.0; R Core Team 2022). The effects of the treatments on dry mass yield and mycorrhizal colonization rate were analyzed with a three-factorial analysis of variance (ANOVA) with the factors site, MO application, and starter fertilization. The effects of the treatments on soil Nmin and PDL concentrations were analyzed with a four-factorial ANOVA, with sampling date as an additional factor. The ANOVA was followed up by Tukey’s honestly significant difference (HSD) post hoc tests where necessary. The normality of residues and variance homogeneity were checked for every model. HSD was carried out with the rstatix R package [57], and ANOVA and model diagnosis were performed with base R functions.
For analysis of the qPCR data, the genome copy numbers (gcns) measured with the group-specific qPCR assays were summed up to obtain the total genome copy number (tot-gcn). This tot-gcn was used as an indicator of community size, as the bacterial groups monitored comprised many of the typically most abundant phyla in soil bacterial communities. The relative abundances of each group were then calculated by dividing the gcn measured with the group-specific qPCR assays by the tot-gcn. The relative abundances calculated this way are not the relative abundances in the overall bacterial community. Relative abundances were analyzed instead of absolute abundances to correct for size variation in the overall microbial community. This has been shown to help in analyzing qPCR-based microbial compositions [46]. All further analyses were carried out with the software PRIMER (PRIMER-e, Auckland, New Zealand) with the permANOVA add-on. First, the relative abundances were transformed by the natural logarithm (ln). Then, the data were checked for univariate outliers with histograms and for multivariate outliers with non-metric multidimensional scaling (NMDS). Out of 6480 measured abundances, eight very extreme univariate outliers were replaced by the average of the remaining two replicate samples. Out of 720 samples, two that were extreme multivariate outliers were removed from the dataset. Then, averages of the three replicate samples from each plot, sampling date, and sampling area (inside or outside the application area) were calculated for each microbial group. To detect changes in the soil microbial community structure, permutational ANOVA (permANOVA) analysis was performed on the averaged data. The samples inside and outside of the application area were analyzed separately. The permANOVA was carried out with a multifactorial nested design with a fixed-factors site, sampling date, MO application, and type of starter fertilization. An additional random factor plot was needed because of the repeated sampling of every plot and was nested in the factors site, MO application and fertilizer type. Multivariate permANOVA and principal coordinate analysis (PCO) were performed with Bray–Curtis dissimilarity as a distance metric. Univariate permANOVAs of single microbial groups and the tot-gcn were performed using Euclidean distance as a distance metric. A significance level of 5% was chosen. Significant permANOVAs were followed up by post-hoc tests, also using the permANOVA add-on of PRIMER. Significant interactions without significant post-hoc tests were not further considered.
To identify drivers of the maize dry mass yield, the Kendall–Tau correlation coefficients were calculated between the maize yield and the following parameters: soil DM, PDL, Nmin, tot-gcn, and the relative abundances of the individual microbial groups, including the inoculated bacterial strain B. atrophaeus Abi05. The coefficients were separately calculated for each site and sampling date with R.

3. Results

3.1. The Effect of Starter Fertilization and Inoculation with Plant-Beneficial Microorganisms on Concentrations of Soil-Available Nutrients and Maize Yield

After biogas slurry application to the WS site (WSo did not receive biogas slurry), but before sowing, the PDL level in the top 30 cm of the soil was about 20 mg P 100 g−1 soil at both sites (Table 1). Other parameters differed, however (Table 1). For the WS site, the concentrations of Nmin in the top 30 cm of the soil were about double, and the concentration of plant-available Kalium (KDL) was about triple the concentrations found at the WSo site. It is further noticeable that Nmin and PDL concentrations in the 30–60 cm layer are similar to those in the top layer at the WSo site, while the concentrations considerably decrease with depth at the WS site. The soil dry mass content in the top 30 cm was significantly higher at the WSo site compared to the WS site at all sampling dates (p < 0.0001, WSo: 87.1 ± 3.0%, WS: 84.5 ± 2.5%).
The maize dry mass yield was 13.6% higher (p < 0.001) at the WS site (18.4 ± 1.2 t ha-1) compared to the WSo site (16.2 ± 1.4 t ha−1). The starter fertilization did not influence the yield at either site. The MO application enhanced the yield by, on average, 4.2% (p = 0.041) (Figure 1a). The yield effect of the MO application did not significantly vary with the factors of starter fertilization and site, but some trends were observed. While the MO application led to a 6.1% dry mass yield increase at the WSo site, the yield increased only by 2.6% at the WS site. In addition, the MO effect on yield was highest for the treatment without additional starter fertilization at both sites (WSo: 11%, WS: 5.7%).
At sampling dates t2 and t3, the Nmin concentration in the top 30 cm of the soil did not differ between sites (Table 1), while before sowing, it was higher for the WS site, which received an application of biogas slurry. The PDL concentration in the top 30 cm of the soil was higher at the WS site compared to the WSo site at the sampling dates t2 and t3 (p = 0.004) (Figure 1b), while no difference was found before sowing. Between the sampling dates t2 and t3, the concentration of Nmin decreased at both sites (p < 0.001), while the concentration of PDL increased (p < 0.001) (Figure 1b). However, the differences were relatively small, considering the absolute PDL concentrations at both sites. Both Nmin and PDL did not significantly change due to the starter fertilization or the MO application, except for the higher Nmin concentration found at sampling date t2 at the WS site following starter fertilization with DAP (DAP vs. control: p = 0.010; DAP vs. MG: p = 0.003). In summary, the starter fertilization and MO application seemed to have a very limited effect on the concentrations of plant-available nutrients in the soil.

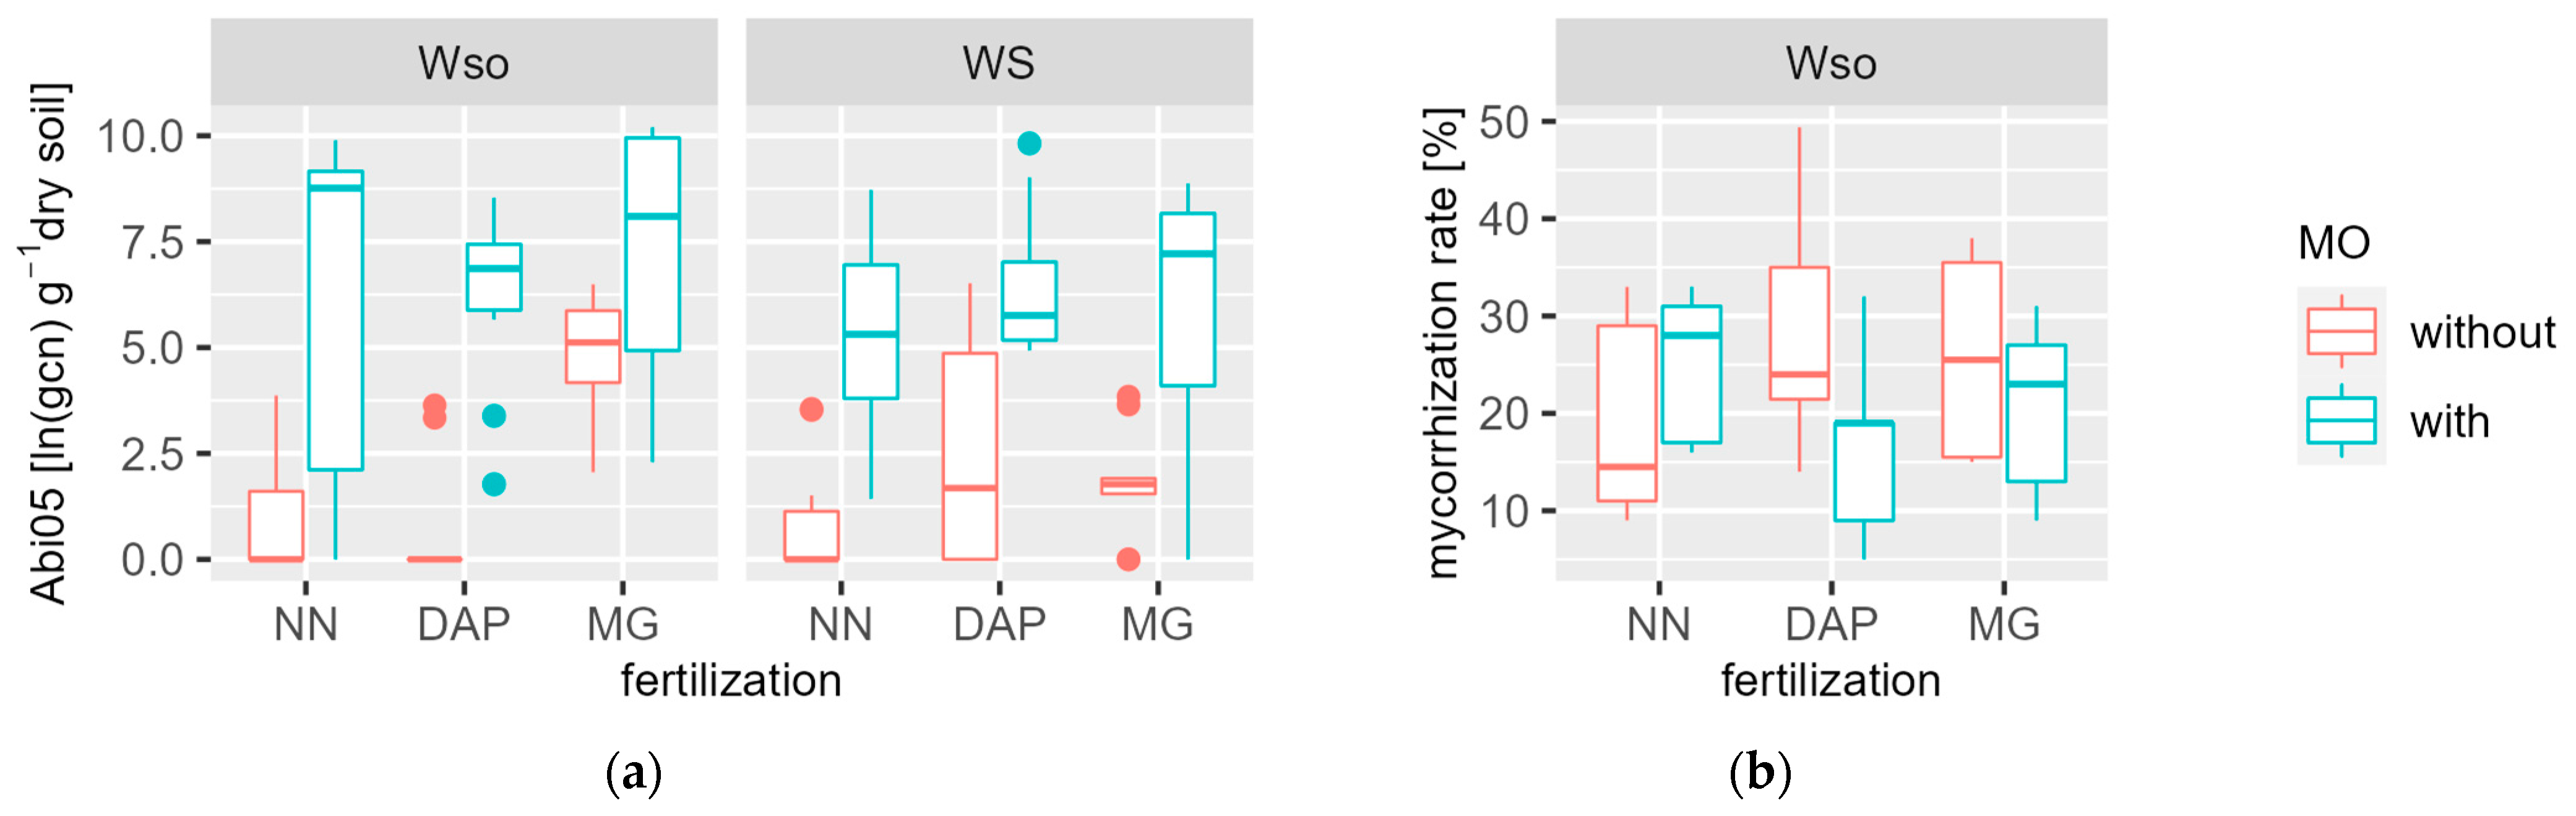
3.2. Root Mycorrhizal Colonisation Rate and Recovery of Inocluated Bacteria

Inside the application area (in the maize rows), the MO application significantly (p < 0.001) increased the genome copy numbers (gcn) of the inoculated bacterial strain B. atrophaeus Abi05 (ABiTEP GmbH, Berlin, Germany). It was 30 times higher in inoculated plots (mean 8116 gcn g−1 dry soil) compared to non-inoculated plots (mean 285 gcn g−1 dry soil). This effect occurred regardless of the site and sampling date. Thus, at sampling date t3, 10 weeks after planting, the bacteria had established themselves, and their number did not significantly change within the next month.
Additionally, at the WSo site, the Abi05 abundance was influenced by the starter fertilizer (p = 0.046). Plots fertilized with MG harbored significantly more Abi05 bacteria than the plots fertilized with DAP (p = 0.004) and without fertilization (p = 0.044). This was observed regardless of inoculation with Abi05, meaning that fertilization with MG increased Abi05 abundance in non-inoculated plots (Figure 2a).
Outside the application area (in the middle between the maize rows), no significant change in Abi05 bacterial gcn was detected after MO application at any sampling date. Thus, the bacterial strain did not spread into the space between the rows (40 cm distance from both rows), and the inoculation effect likely remains spatially restricted to the application area of the bacteria.
The mycorrhizal colonization rate was analyzed solely at the WSo site at sampling date t3. It ranged between about 10 and 40% (Figure 2b) and did not significantly change due to the treatments.

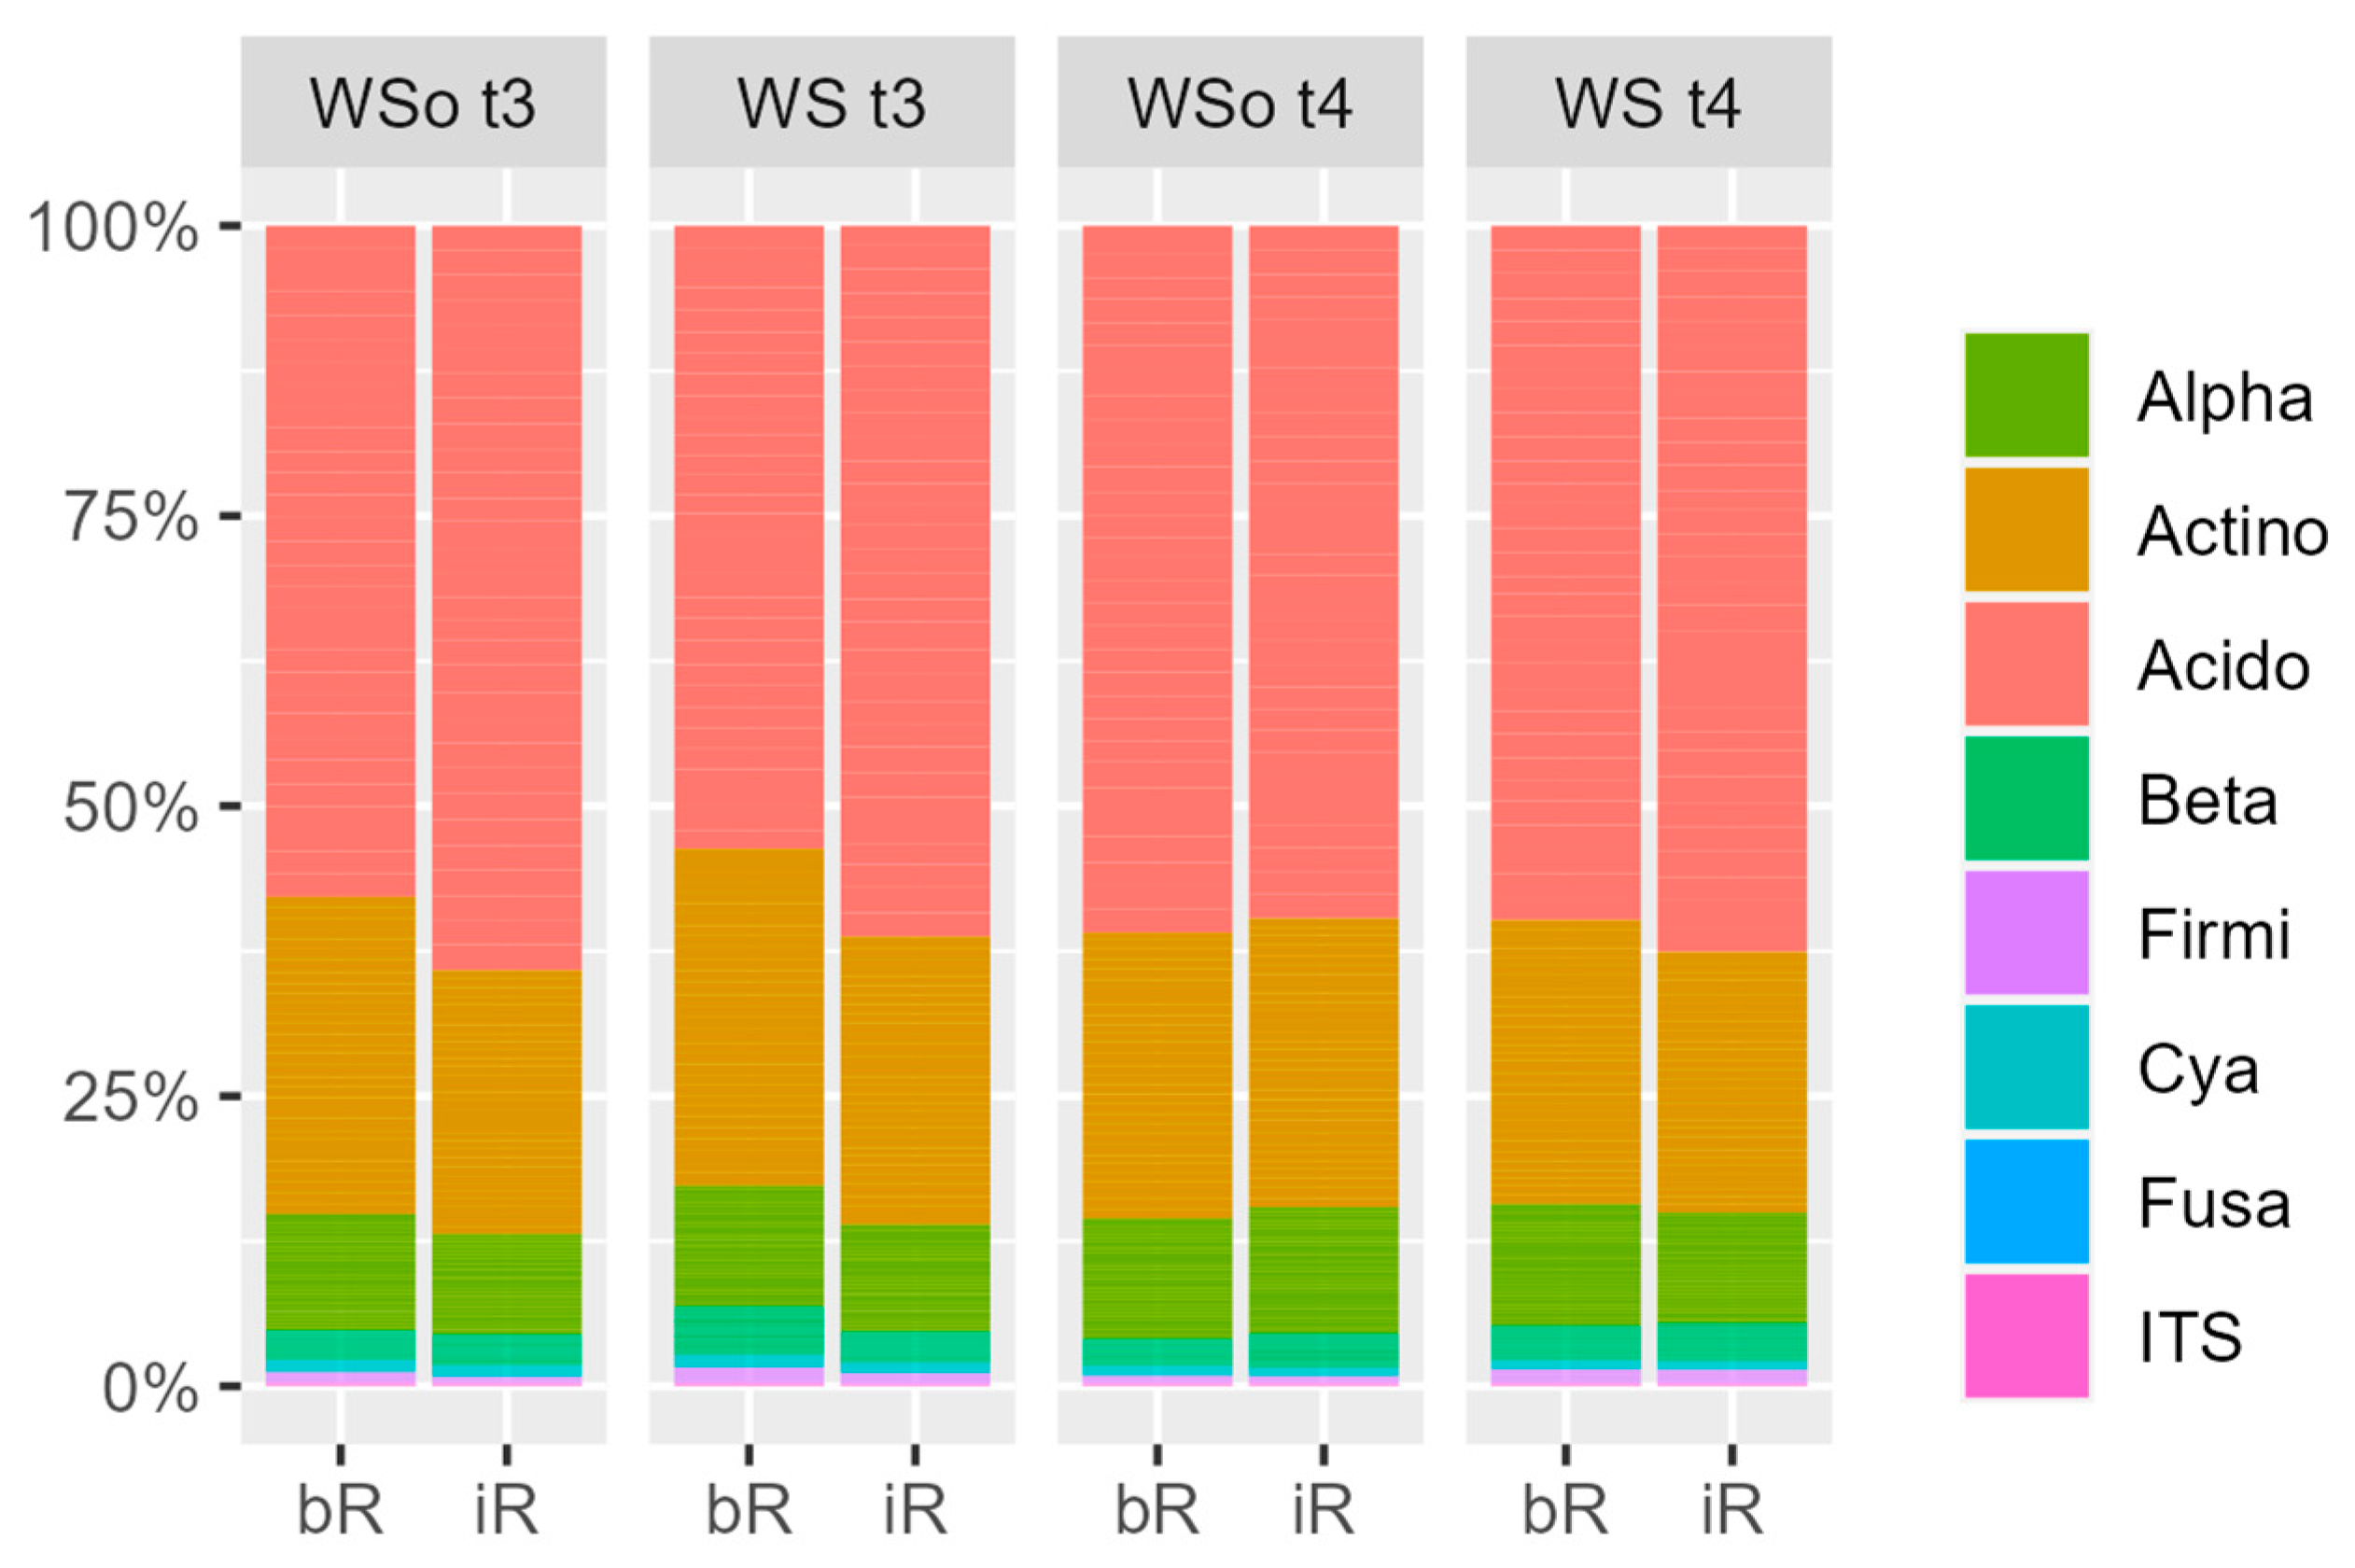
3.3. Treatment Effects on the Soil Microbial Community

Inside the application area, the community size (described by the tot-gcn) was affected by an interaction between the site and the MO application (Table 3). At the WSo site, tot-gcn was increased by about 9.3% following MO application (p = 0.039), regardless of the sampling date (Figure S2). At the WS site, however, this effect was not observed.
According to the multivariate analysis, the community composition inside the application area was not affected by the factors of fertilization and MO application at any site. At the level of the individual microbial groups, significant reactions of Fusaria and Firmicutes were observed (Table 3). The relative abundance of Fusaria was influenced by fertilization, depending on the site. The share of Fusaria in tot-gcn was doubled in WSo plots fertilized with DAP compared to WSo plots fertilized with MG (p = 0.021, perms = 9839). In contrast, for the WS site, the share of Fusaria in plots fertilized with DAP was only half as high as in the plots without fertilization (p = 0.020, perms = 9863). The site effect was also obvious regarding the influence of MO application on the relative abundance of Firmicutes. In the WSo site, the share of Firmicutes was 18% lower in plots with MO application compared to the non-inoculated plots (p = 0.002, perms = 9847) (Figure S2), while no effect was detected for the WS site.
Outside the application area, neither the soil microbial community’s size nor structure was affected by starter fertilization or MO application (Table S1).

3.4. Description of the Soil Microbial Community and Its Spacial and Temporal Differences

3.4.1. Soil Microbial Community Description

Inside the application area (in the maize rows), the microbial community was dominated by Acidobacteria and Actinobacteria. Total fungi comprised 0.2%, while only 0.0002% of tot-gcn were Fusaria. The community composition was relatively stable between the sites and sampling dates (Figure 3).
The absolute abundances of all groups were correlated with the tot-gcn. Using the relative abundances, however, the microbial groups were clearly clustered. While the relative abundance of Acidobacteria was positively correlated with tot-gcn and the gcn of Bacillus atrophaeus Abi05, it was negatively correlated with the shares of all other studied groups (Figure S3).

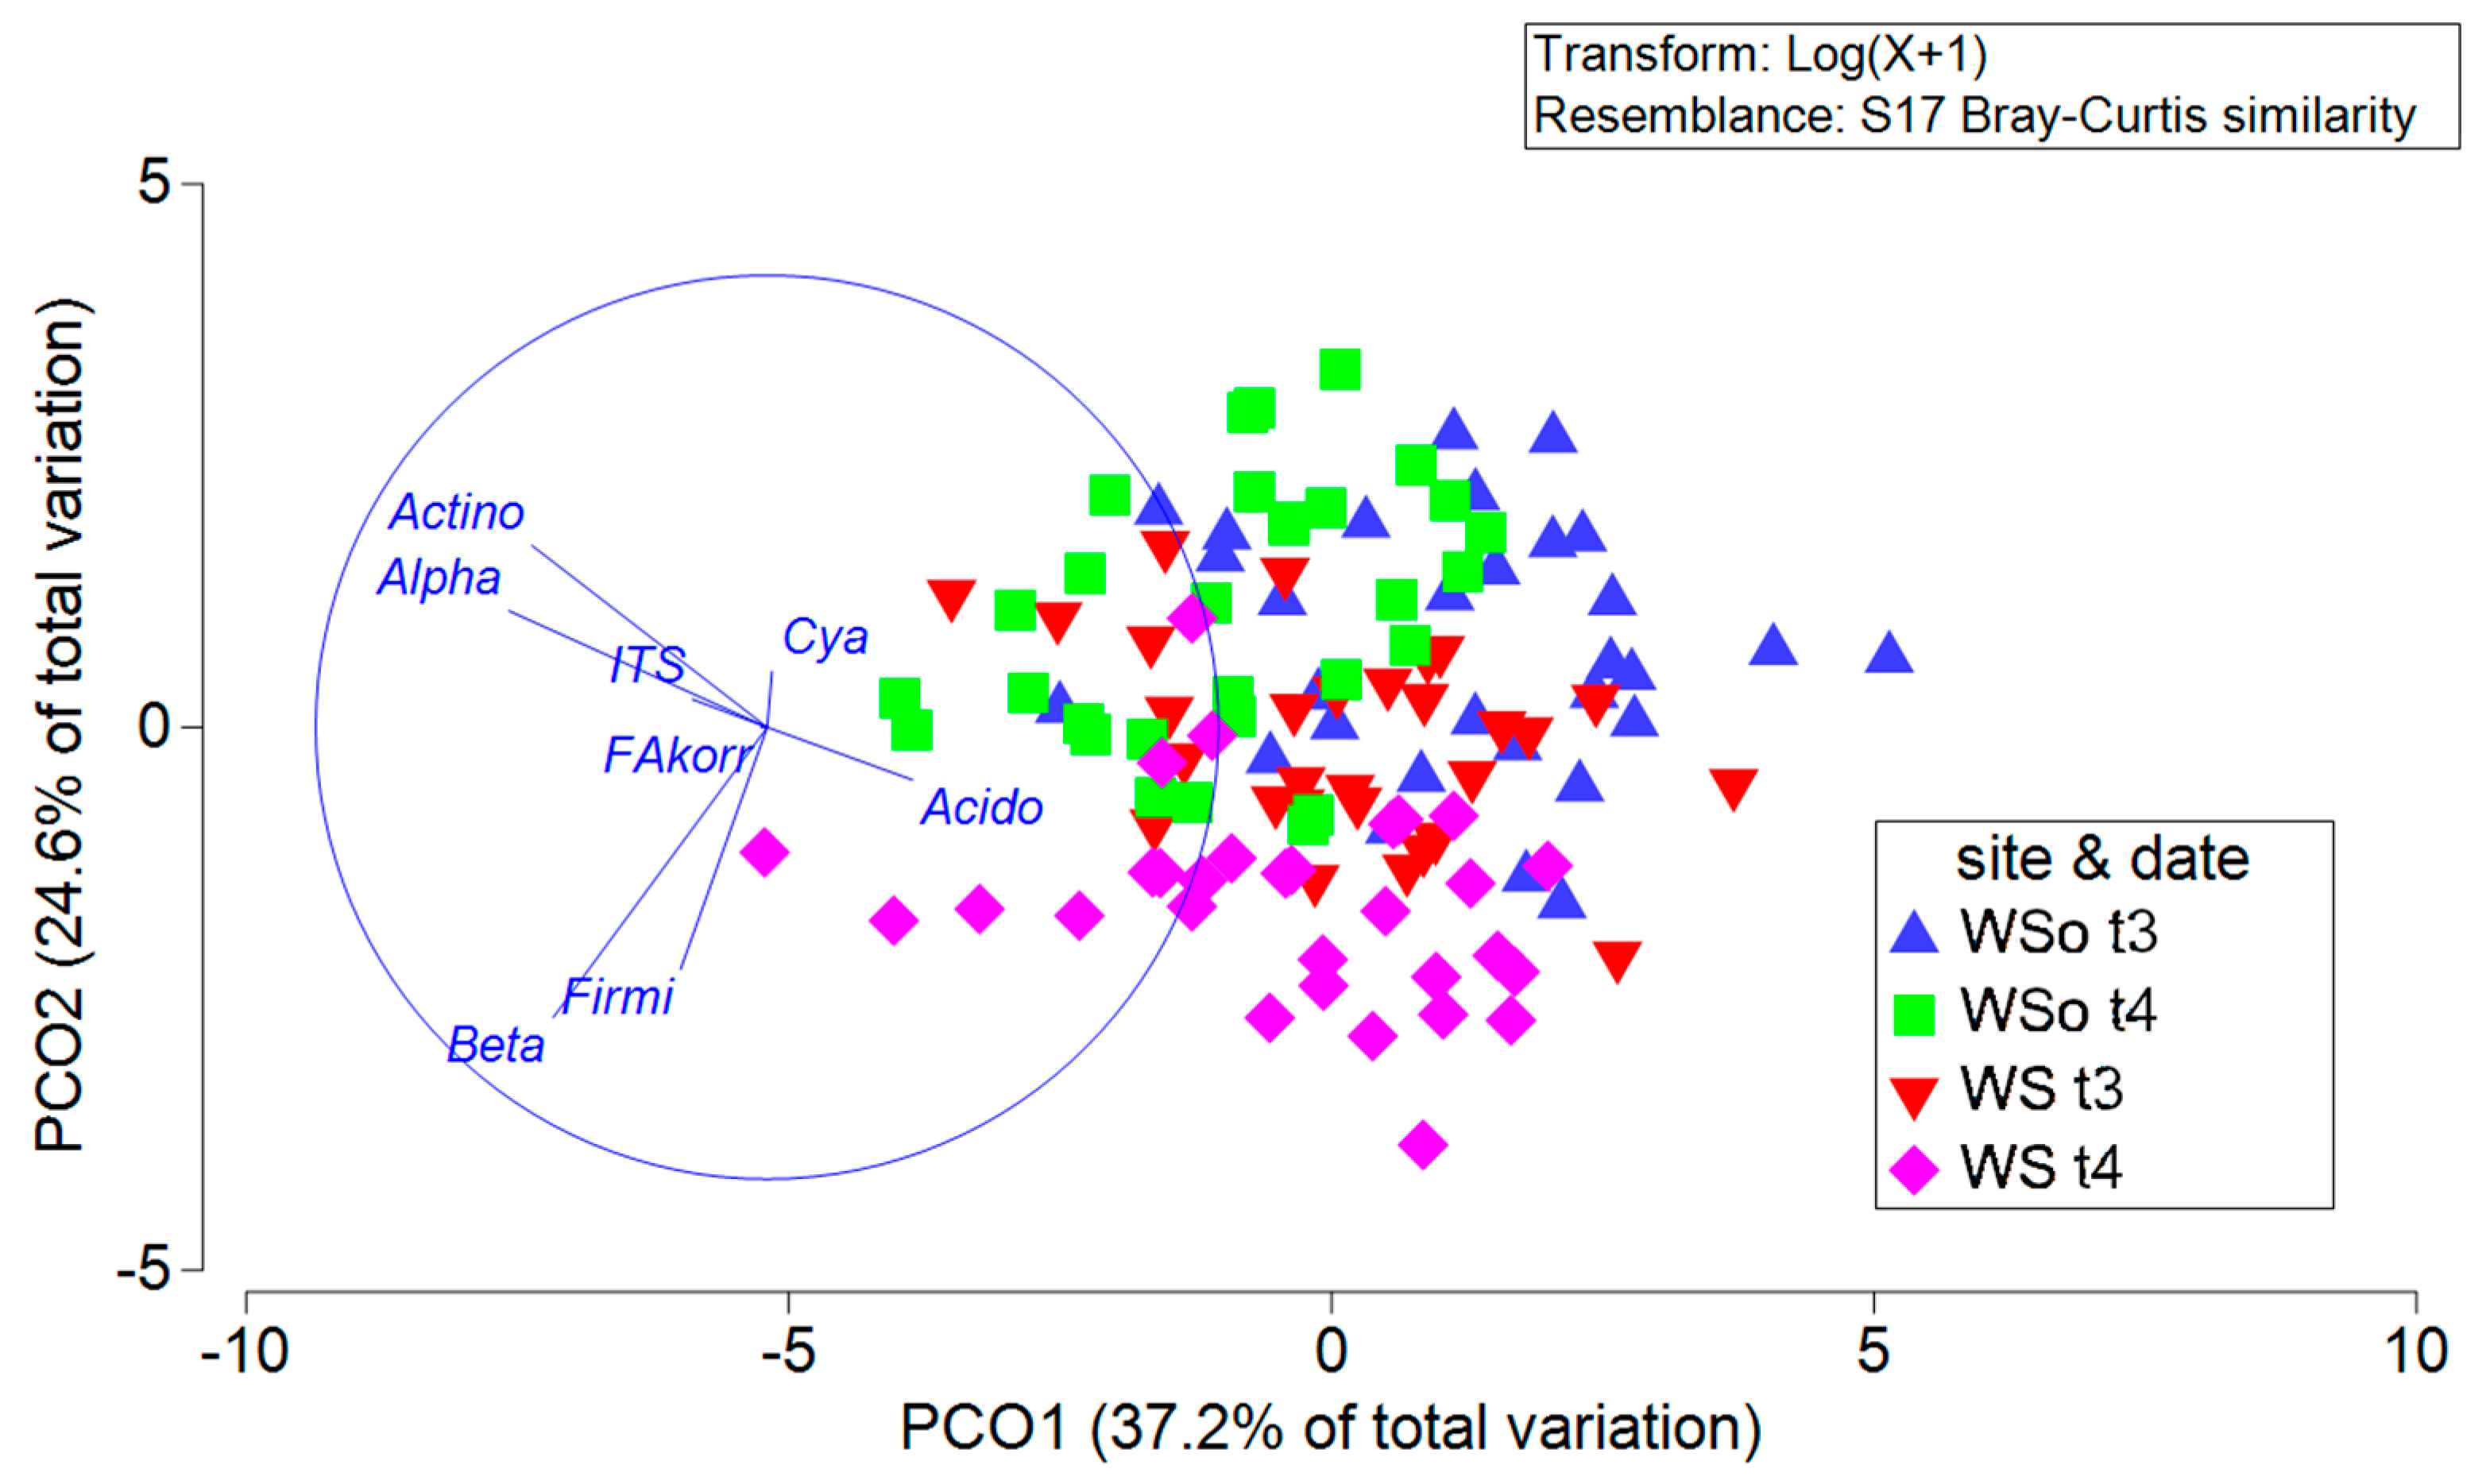
3.4.2. Spatial Distribution of Soil Microbial Communities

Both the size and the structure of the soil microbial community differed between the samples taken outside the application area (between the maize rows) and those taken inside the application area (in the maize rows). At sampling date t3, the community size (tot-gcn) was around 15–40% lower outside the application area compared to inside the application area at both sites. The difference diminished to 0–15% lower tot-gcn outside the application area at sampling date t4 (Figure S4).
The Acidobacteria were enriched inside the application area (in the maize rows) compared to outside the application area (between the maize rows), while all other groups behaved inversely (Figure 3). The differences in community size and structure between the inside and outside of the application area were considerably more pronounced at sampling date t3. A detailed view of the differences in the relative abundance of all studied microbial groups inside and outside of the application area is provided in the Supplemental Material (Figure S4).

3.4.3. Effects of Site and Sampling Date

The effects of site and sampling date on the soil microbial community size and structure were less pronounced than the effect of sample location but still highly significant (Table 3 and Table S1). These effects were investigated in detail solely using the samples taken inside the application area (in the maize rows). The community size—represented by the sum of all analyzed gene copy numbers (tot-gcn)—was generally higher for the WS site (12.2 ± 2.0 gcn g−1 soil) compared to the WSo site (9.6 ± 2.0 gcn g−1 soil). At the WS site, the community size significantly increased from sampling date t3 (July) to t4 (August), while at the WSo site, it did not (Figure S5).
The differences in community structure are visualized using a principal coordinate analysis (PCO) in Figure 4. While the differences between the sites and sampling dates are visible, there is also a considerable overlap between all groups.
The differentiation between the sites mainly occurs along the PCO2 axis. The microbial groups driving the differentiation between the sites were β-Proteobacteria and Firmicutes (Figure 3). The relative abundance of Fusaria and total fungi also significantly differed between the sites (Table 3), which is not shown by the PCO due to their low overall abundance. All studied microbial groups except for Fusaria exhibited a significant influence from the sampling date and/or the interaction between the site and sampling date (Table 3). The differentiation of sampling dates took place along the PCO2 axis at the WS site and along the PCO1 axis at the WSo site. This indicates that, at the WS site, Firmicutes and β-Proteobacteria were important drivers for the differences between the sampling dates, while at the WSo site, Actinobacteria, α-Proteobacteria, and Acidobacteria were more important. A detailed view of the differences in the relative abundance of all studied microbial groups between sites and sampling dates is provided in the Supplemental Material (Figure S5).

3.5. Correlations of the Maize Yield with Soil Nutrient Concentrations, Dry Mass Content, and Microbial Relative Abundances

At the WS site, there was a positive correlation between the PDL concentration at sampling date t2 and the maize yield. At sampling date t3, the correlation was still detectable at a significance level of 10%. Additionally, there was a positive correlation with the share of Firmicutes (t4) (Table 4). This stands in contrast to the finding that, at the WSo site, the share of Firmicutes was diminished by MO application, which, in turn, had a positive effect on the dry mass yield.
At the WSo site, there was a significant positive correlation with the gcn of B. atrophaeus Abi05 at sampling date t4. At sampling date t3, the same correlation was detected at a significance level of 10%. This is in line with the MO application, leading to a higher number of B. atrophaeus Abi05 gcn and a higher dry mass yield. Additionally, there were negative correlations at a significance level of 10% between the soil DM content and the maize yield at sampling dates t2 and t4, showing that water availability influenced the yield at this site.

4. Discussion

4.1. Drivers of Yield and Plant-Available Nutrient Concentrations

The high Nmin and PDL concentrations in the 30–60 cm layer at the “plaggic anthrosol” WSo site can be attributed to centuries of nutrient accumulation by plaggen agriculture leading to a 70 cm deep A/E horizon [58]. The differences in maize yield between the sites were likely due to the lower nutrient and water availability during the growing season at the WSo site compared to the WS site.
Although starter fertilization is common in this area, with relatively high nutrient concentrations in the soil, our results showed that it may be ineffective. The PDL concentrations corresponded to the Lower Saxony soil test classes D (high P availability) and E (very high P availability), depending on the sampling date [59]. The Chamber of Agriculture for Lower Saxony recommends farmers with fields in test class E try to omit the starter fertilization in test patches on the field to check if their specific fields show any yield decreases [60]. The lack of yield reaction to P starter fertilization with DAP and MG in this study supports the notion that starter fertilization should be omitted in high P-testing soils. The fact that starter fertilization did not alter the soil-available P concentrations underlines the low effectiveness of fertilization measures in soils with high nutrient concentrations.
However, the (insignificant) yield difference between the fertilized plots and no-fertilization control at the WSo site in this study is in a range that is relevant for practitioners. Similar patterns have been observed before where no significant effect of starter fertilization was observed, although, on single fields, there was a yield difference that is relevant in practice (up to 11% yield increase) [10]. This discrepancy might impair the acceptance of the results by practitioners. Future studies investigating the effect of P starter fertilization should choose the study design carefully to ensure sufficient statistical power [61]. Also, more attention needs to be paid to factors like soil organic carbon content and pH, which have been identified as important mediators of P fertilization’s effectiveness [12,62].
It is remarkable that despite the high P availability in the studied fields, the in-furrow MO application led to a significant yield increase. This increase is comparable to the yield increase expected for P starter fertilization [11]. Nonetheless, the yield effect of MO application in this study was low compared to the results of meta-analyses on the effects of AMF and PGPR inoculation [17,18]. This could be related to the high availability of nutrients in the soil at the studied sites. Both meta-analyses showed that yield increases following inoculation tended to be lower at high soil-available P levels [17,18]. Furthermore, the soil pH plays an important role in mycorrhiza establishment, which prefers a neutral pH [18,63,64]. The soil pH of our study sites was relatively low, especially at the WSo site (Table 1). The yield effect of the MO application could be due to the applied mycorrhiza, the applied bacterial strain, or an interaction of both. Previous studies have found positive interactions between the simultaneous application of AMF and PGPR [65,66]. The fact that MO application does not increase soil-available nutrient concentrations and that the yield effect of MO application is independent of the applied starter fertilizer indicates that nutrient mobilization might not be the primary mode of action of the applied AMF and bacterial strain. Bacillus atrophaeus is a genus that is native to soils, seas, and even food [67,68]. Many strains have been identified to be plant growth-promoting, to have antimicrobial and antifungal properties, and to be antagonistic to insect pests [69,70,71,72,73]. Further studies should focus on plant nutrient composition, pathogen numbers, and biological microbes in plant messenger molecules to elucidate the pathway of influence. Although the root mycorrhizal colonization rate was not influenced by MO application, the inoculated AMF could have contributed to the observed yield increase. This has been observed previously [74,75] and was attributed to the inoculated mycorrhiza overruling the “legacy effect” of repeated maize cultivation [75].

4.2. Recovery of Inoculated Bacterial Strain and Mycorrhizal Colonisation Rate

The gcn of the inoculated strain could be considered low in relation to the overall community size. It has been stated before that the insufficient establishment of inoculated microbes was a hindrance to the effective application of bioinoculants [22]. The gcn found in this study, however, paired with an increase in dry mass yield, indicates that “low” numbers of inoculated microorganisms can still be effective. The gcn of B. atrophaeus Abi05 was increased in plots fertilized with MG that were not inoculated with the bacterial strain. This might be due to an increase in native bacteria that are similar to the strain used for inoculation. Since many Bacillus atrophaeus strains have been identified as plant-growth- and health-promoting [69,70,71,72,73], this indicates that MG fertilizer could have a plant-beneficial influence on the soil microbial community.
The mycorrhizal colonization rate of the maize roots at sampling date t3 at the WSo site was similar to values that have been found in previous experiments with considerably lower P concentrations in the soil [76,77]. It has been shown that the root mycorrhizal colonization rate negatively depends on P availability [76,78], so the levels found here were surprisingly high.

4.3. Treatment Effects on the Soil Microbial Community

Despite the fertilizer and MO applications, only slight changes in the native soil microbial community occurred. It has been shown that the plant response to PGPR and AMF inoculation does not depend on changes in the native microbial community diversity [40]. Also, most studies investigating the influence of Bacillus inoculation on the native soil microbiome showed only slight changes that were mostly limited to particular families or species [41,79,80], despite positive plant growth responses. A lowered share of Firmicutes following MO application has not been described before, to the best of our knowledge. The applied bacterial strain belongs to the Firmicutes itself, so this reaction could be a sign of competition or even antagonistic interactions between the inoculated bacterial strain B. atrophaeus Abi05 and the native Firmicutes. Fusarium infection has been reported to be promoted by higher fertilization rates [81,82]. This pattern was observed in this study at the WSo site, while at the WS site, the opposite occurred. A Fusarium gene copy level’s reaction to MO application was expected, as both B. atrophaeus and AMF have been reported to hinder Fusarium infection [72,83], but this did not occur. It has previously been observed that while Fusarium gcn in the roots reacted to treatments and was a good indicator for plant infection levels, Fusarium gcn in the soil was not impacted by treatments or related to plant infection levels [84]. No significant change in the relative abundance of Acidobacteria was detected after MO application. However, the relative abundance of Acidobacteria was positively correlated to the B. atrophaeus Abi05 copy number and tot-gcn, which increased at the WSo site after the MO application. An increase in Acidobacteria following inoculation with PGPR, including Bacillus strains, has been previously reported [85,86].

4.4. Soil Microbial Community: Influence of Site, Sampling Date and Sampling Area

Acidobacteria, Proteobacteria, and Actinobacteria make up the largest part of the soil microbial community in both studied fields, which is in line with previous results [34,36,45,48]. The Acidobacteria were the most abundant phylum at both sites. This supports the results of Navarrete et al. [87], who found that the share of Acidobacteria increases with the soil organic matter content and that, in soil with a high organic matter content, Acidobacteria were the largest microbial group. Contrastingly, Acidobacteria have been linked to low C-mineralization rates and low nutrient inputs [42,46,48], which is not supported by our results. There was a higher relative abundance of β-Proteobacteria at the WS site compared to the WSo site. This is in line with previous research, as β-Proteobacteria have been linked to high C-mineralization rates and nutrient inputs [42,46,48], and the WS site exhibits higher total organic carbon contents and nutrient inputs compared to the WSo site.
It has to be noted that the relative abundance of gcn belonging to each microbial group cannot be interpreted as the relative abundance of microbial cells in the sample. First, in this study, the shares were calculated as shares of the sum of all detected microbial groups, not as shares of all bacteria and fungi that were present. Second, there could be considerable errors when microbiome composition is deducted from gene copy composition due to differences in the 16S rRNA and ITS copy numbers in the genome [88,89,90]. For example, Acidobacteria only have a median 16S rRNA copy number of one, compared to a median copy number of three for Actinobacteria and six for Firmicutes, according to the rrnDB database [91]. With the qPCR method employed in this study, there is an inherent “correction” with the 16S rRNA copy numbers of the standard strains. However, these most likely differ from the group-specific average of the 16S rRNA copy numbers present in the soil samples. These average copy numbers can only be determined by sequencing [92] and are thus not available for correction in this study.
The absolute abundances of all microbial groups correlating with the tot-gcn are in line with the results of Philippot et al. [46] and confirm the choice to analyze the relative abundances. When analyzing the relative abundances of the microbial groups, the correlations between the phyla in this study differed from correlations found by Philippot et al. [46], underscoring the multifactorial nature of microbial community composition.
Remarkably, the difference in the soil microbial community between the two sampling dates, which were only four weeks apart, was similar in magnitude to the difference between the two sites, underscoring the importance of the influence of environmental parameters and soil parameters on the soil microbial community. Changes in the rhizosphere microbial community structure over time have been well documented and could be attributed to both changes in the environmental conditions and the influence of the plant development stage [33,34,35,37]. For root-influenced bulk soil, the importance of plant exudates was found to be low compared to changes in soil properties [93]. The change in bulk soil microbial community composition between the sampling dates found in this study is thus likely mainly due to changes in environmental conditions like soil water content and temperature and is less affected by plant development.
The differences between the samples inside and outside the application area might be due to the difference in root influence. An enrichment of Acidobacteria in the root-penetrated bulk soil has been published previously [94], whereas in the rhizosphere, the Acidobacteria were shown to be depleted [36,39,48]. Subsequently, it can be assumed that the Acidobacteria are especially enriched in the bulk soil inside the root-penetrated soil compartment and that they might interact with the plant roots within a short distance. It has been shown that subdivisions of Acidobacteria are “keystone taxa” with important roles in soil organic matter’s decomposition and denitrification [95,96] and that some Acidobacteria have plant growth-promoting properties [97,98]. More research about this phenomenon should thus be conducted. The differentiation of the soil microbiome between inside and between the maize rows was more pronounced in t3 (July) compared to t4 (August). This has been shown before [99] and could be due to the root zone expanding into the space between the rows, thus rendering both soil compartments “root-influenced” bulk soil.

4.5. Correlations of Maize Yield with Soil’s Physical and Microbial Parameters

Surprisingly, while no influence of P starter fertilization on the maize yield was recorded, the maize yield correlated with soil PDL at sampling date t2 at the WS site. This shows that the existing differences in P availability between the plots had a larger impact on plant growth than the additional P availability obtained through starter fertilization. It is also interesting that no such correlation was detected at the WSo site, although it had a similar variation in PDL and lower overall nutrient levels compared to the WS site. Instead, at the WSo site, the dry mass yield correlated with the gcn of the applied bacterial strain B. atrophaeus Abi05 and the soil DM, which was higher than that at the WS site. Thus, at the WSo site, water shortages and MO application effects might have overruled the possible effect of P availability. It was shown before that water availability potentially impacts maize yield more strongly than soil P levels [100] and plays an important role in P fertilization success [8]. The behavior of Firmicutes contrasting between the sites cannot be explained, but it points to a differing role of Firmicutes on the two sites. This is supported by the importace of Firmicutes in separating the two studied sites.

5. Conclusions

Phosphorous starter fertilization application on sites with high soil-available P levels should be avoided as, according to our study results, it has no relevant yield effect and may result in nutrient losses. Instead of P starter fertilization, the application of MO can be suggested for sites with high soil-available P levels, as a higher maize yield was achieved compared to standard starter fertilization.
The mechanisms by which the applied AMF and PGPR influence plant growth should be further investigated by monitoring pathogens and microbe–plant interaction pathways. The Firmicutes species that react to the MO application should also be elucidated, and the underlying mechanisms should be discovered. The enrichment of Acidobacteria in the root-influenced bulk soil and possible interactions with plants should receive more consideration in future studies.
Finally, further field studies with different soil characteristics should be conducted to test the repeatability of our results. Moreover, additional efforts should be made to increase the knowledge of practitioners about scientific findings concerning starter fertilization.

Supplementary Materials

The following supporting information can be downloaded at: https://www.mdpi.com/article/10.3390/agronomy13122900/s1, Figure S1: Rainfall and temperature at the weather station Steinau, Lower Saxony, in 2021; Figure S2: Reactions of total gene copy number (tot-gcn) and relative abundance of Firmicutes to fertilization and MO application; Figure S3: Intercorrelations of the relative abundances of the investigated microbial groups; Figure S4: Soil microbiome differences between inside and outside of the application area of starter fertilizers and plant-beneficial microorganisms; Figure S5: Influence of site and sampling date on the soil microbiome’s size and structure; Table S1: Five-factorial permANOVA analysis of the soil microbial community’s composition outside the application area of starter fertilizers and MO.

Author Contributions

Conceptualization, F.E. and B.E.-L.; methodology, F.E., B.E.-L. and L.G.; formal analysis, L.G.; investigation, R.W., R.T., M.T. and L.G.; resources, F.E., B.E.-L. and M.E.H.M.; data curation, R.T., M.T. and L.G.; writing—original draft preparation, L.G.; writing—review and editing, L.G., R.W., R.T., M.T., B.E.-L. and M.E.H.M.; visualization, L.G.; supervision, F.E., B.E.-L. and M.E.H.M.; project administration, F.E., M.E.H.M. and B.E.-L.; funding acquisition, F.E. and B.E.-L. All authors have read and agreed to the published version of the manuscript.

Funding

This research was funded by the Federal Ministry of Food and Agriculture (BMEL) via the Fachagentur Nachwachsende Rohstoffe e.V. (FNR), Gülzow-Prüzen, Germany (Förderkennzeichen 2220NR059A). Additional funding was provided by Leibniz-Zentrum für Agrarlandschaftsforschung (ZALF) e.V.

Data Availability Statement

The data presented in this study are available on request from the corresponding author.

Acknowledgments

We want to thank Petra Lange for her exceptionally reliable work in the laboratory. We acknowledge the Maschinenring Hadeln (Hadeln, Germany), which provided the necessary machinery, and the farmers who provided the study sites. We also acknowledge ABiTEP GmbH (Berlin, Germany), which contributed the plant-beneficial organism product RhizoVital (C5), and INOQ GmbH (Schnega, Germany), which contributed the mycorrhizal inoculum INOQ Advantage. We want to thank Undine Behrendt for providing well-characterized standard strains kept in a ZALF culture collection. We also want to thank Ulrike Cavael for her contribution to shaping the project’s concept. Special thanks to Peter Lentzsch for his contribution to the methodology of the investigation of the soil microbial community and for his general support in the early days of the project.

Conflicts of Interest

The authors declare no conflict of interest.

Appendix A

Table A1. qPCR conditions for all assays, including assay name, name of Forward primer, name of Reverse primer, reference the assay was taken from (Ref.), amplicon length (AL), target region in the genome, quantity and dilution of used template DNA (DNA), annealing temperature and time (Annealing), cycle number (Cyc), and standard strain.
AssayForward PrimerReverse PrimerRef.AL [bp]Target RegionDNAAnnealingCycStandard Strain
Acidobact.Acido31Eub518[45]50016S-rRNA1 µL, 1:1061 °C, 45 s35Acidobacterium capsulatum
Actinobact.S-P-Acti-1154-a-S-19S-P-Acti-1339-a-A-18[101]16616S-rRNA1 µL, 1:1062 °C, 30 s35Microbacterium foliorum
α-Proteobact.S-C-aProt-0528-a-S-19S-C-aProt-0689-a-A-21[101]14216S-rRNA1 µL, 1:2558 °C, 25 s35Sphingomonas paucimobilis
Β-Proteobact.S-C-bProt-0972-a-S-18S-C-bProt-1221-a-A-17[101]23116S-rRNA1 µL, 1:1057 °C, 45 s35Variovorax paradoxus
FirmicutesS-P-Firm-0525-a-S-181040FirmR[101]50116S-rRNA1 µL, 1:2564 °C, 30 s35Bacillus subtilis
Cyanobact.CYA361fCYA785r[102]44016S-rRNA1 µL, 1:2562.2 °C, 30 s40Chroococcidiopsis cubana
Fungi (ITS)ITS F5,8S-R[45]300ITS11 µL, 1:1059 °C, 30 s35A. tenuissima GH50t
InhibitionT7 FM13 rev[56]210-1 µL, und.58 °C, 30 s30Artificial DNA-Fragment
Forward PrimerReverse PrimerProbe
FusariumFA pl3 forwardFus pl reverseS FUS pl[103] TEF12 µL, und67 °C, 90 s45F. graminearum 486
Each 20 µL qPCR reaction (except Fusarium assay) contained 4 µL of 5× HOT FirePol® EvaGreen® HRM Mix (ROX) (Solis Biodyne, Tartu, Estonia, 2.5 mM MgCl2), 2.5 pmol of each primer (biomers.net, HPCL purification), and 1 µL of (diluted) DNA sample. The PCR protocol consisted of initial denaturation (95 °C for 10 min), followed by a number of cycles of denaturation (95 °C for 15 s), annealing, and elongation (72 °C for 60 s for ITS, Cyanobacteria, and Firmicutes and 30 s for all other assays). For the Fusarium-specific qPCR assay, each 20 µL reaction contained 4 µL of 5× HOT FirePol® Probe GC qPCR Mix (Solis Biodyne, Tartu, Estonia, 3 mM MgCl2), 2.5 pmol of each primer, 6 pmol of hydrolysis probe, 3 µL of 25 mM MgCl2 (Solis Biodyne, Tartu, Estonia), and 2 µL of DNA sample. The PCR protocol consisted of initial denaturation at 95 °C for 10 min, followed by 45 cycles of 95 °C for 15 s and 67 °C for 90 s.

References

  1. Panagos, P.; Köningner, J.; Ballabio, C.; Liakos, L.; Muntwyler, A.; Borrelli, P.; Lugato, E. Improving the phosphorus budget of European agricultural soils. Sci. Total Environ. 2022, 853, 158706. [Google Scholar] [CrossRef]
  2. MacDonald, G.K.; Bennett, E.M.; Potter, P.A.; Ramankutty, N. Agronomic phosphorus imbalances across the world’s croplands. Proc. Natl. Acad. Sci. USA 2011, 108, 3086–3091. [Google Scholar] [CrossRef]
  3. Einarsson, R.; Pitulia, D.; Cederberg, C. Subnational nutrient budgets to monitor environmental risks in EU agriculture: Calculating phosphorus budgets for 243 EU28 regions using public data. Nutr. Cycl. Agroecosystems 2020, 117, 199–213. [Google Scholar] [CrossRef]
  4. Bennett, E.M.; Carpenter, S.R.; Caraco, N.F. Human Impact on Erodable Phosphorus and Eutrophication: A Global Perspective. BioScience 2001, 51, 227. [Google Scholar] [CrossRef]
  5. Cordell, D.; White, S. Life’s Bottleneck: Sustaining the World’s Phosphorus for a Food Secure Future. Annu. Rev. Environ. Resour. 2014, 39, 161–188. [Google Scholar] [CrossRef]
  6. Van Vuuren, D.P.; Bouwman, A.F.; Beusen, A. Phosphorus demand for the 1970–2100 period: A scenario analysis of resource depletion. Glob. Environ. Change 2010, 20, 428–439. [Google Scholar] [CrossRef]
  7. Blandino, M.; Battisti, M.; Vanara, F.; Reyneri, A. The synergistic effect of nitrogen and phosphorus starter fertilization sub-surface banded at sowing on the early vigor, grain yield and quality of maize. Eur. J. Agron. 2022, 137, 126509. [Google Scholar] [CrossRef]
  8. Wortmann, C.S.; Xerinda, S.A.; Mamo, M.; Shapiro, C.A. No-Till Row Crop Response to Starter Fertilizer in Eastern Nebraska: I. Irrigated and Rainfed Corn. Agron. J. 2006, 98, 156–162. [Google Scholar] [CrossRef]
  9. Kaiser, D.E.; Mallarino, A.P.; Bermudez, M. Corn Grain Yield, Early Growth, and Early Nutrient Uptake as Affected by Broadcast and In-Furrow Starter Fertilization. Agron. J. 2005, 97, 620–626. [Google Scholar] [CrossRef]
  10. Roller, S.; Weiß, T.M.; Li, D.; Liu, W.; Schipprack, W.; Melchinger, A.E.; Hahn, V.; Leiser, W.L.; Würschum, T. Can we abandon phosphorus starter fertilizer in maize? Results from a diverse panel of elite and doubled haploid landrace lines of maize (Zea mays L.). Front. Plant Sci. 2022, 13, 1005931. [Google Scholar] [CrossRef]
  11. Quinn, D.J.; Lee, C.D.; Poffenbarger, H.J. Corn yield response to sub-surface banded starter fertilizer in the U.S.: A meta-analysis. Field Crops Res. 2020, 254, 107834. [Google Scholar] [CrossRef]
  12. Buczko, U.; van Laak, M.; Eichler-Löbermann, B.; Gans, W.; Merbach, I.; Panten, K.; Peiter, E.; Reitz, T.; Spiegel, H.; von Tucher, S. Re-evaluation of the yield response to phosphorus fertilization based on meta-analyses of long-term field experiments. Ambio 2018, 47, 50–61. [Google Scholar] [CrossRef] [PubMed]
  13. Balawejder, M.; Szostek, M.; Gorzelany, J.; Antos, P.; Witek, G.; Matłok, N. A Study on the Potential Fertilization Effects of Microgranule Fertilizer Based on the Protein and Calcined Bones in Maize Cultivation. Sustainability 2020, 12, 1343. [Google Scholar] [CrossRef]
  14. Olbrycht, M.; Kołodziej, M.; Bochenek, R.; Przywara, M.; Balawejder, M.; Matłok, N.; Antos, P.; Piątkowski, W.; Antos, D. Mechanism of nutrition activity of a microgranule fertilizer fortified with proteins. BMC Plant Biol. 2020, 20, 126. [Google Scholar] [CrossRef] [PubMed]
  15. Thielicke, M.; Ahlborn, J.; Eichler-Löbermann, B.; Eulenstein, F. On the Negative Impact of Mycorrhiza Application on Maize Plants (Zea mays) Amended with Mineral and Organic Fertilizer. Microorganisms 2023, 11, 1663. [Google Scholar] [CrossRef]
  16. Thielicke, M.; Ahlborn, J.; Životić, L.; Saljnikov, E.; Eulenstein, F. Microgranular fertilizer and biostimulants as alternatives to diammonium phosphate fertilizer in maize production on marshland soils in northwest Germany. Zemljište Biljka 2022, 71, 53–66. [Google Scholar] [CrossRef]
  17. Zhang, S.; Lehmann, A.; Zheng, W.; You, Z.; Rillig, M.C. Arbuscular mycorrhizal fungi increase grain yields: A meta-analysis. New Phytol. 2019, 222, 543–555. [Google Scholar] [CrossRef]
  18. Schütz, L.; Gattinger, A.; Meier, M.; Müller, A.; Boller, T.; Mäder, P.; Mathimaran, N. Improving Crop Yield and Nutrient Use Efficiency via Biofertilization—A Global Meta-analysis. Front. Plant Sci. 2018, 8, 2204. [Google Scholar] [CrossRef]
  19. Berg, G.; Rybakova, D.; Grube, M.; Köberl, M. The plant microbiome explored: Implications for experimental botany. J. Exp. Bot. 2016, 67, 995–1002. [Google Scholar] [CrossRef]
  20. Singh, R.; Goodwin, S.B. Exploring the Corn Microbiome: A Detailed Review on Current Knowledge, Techniques, and Future Directions. PhytoFrontiers™ 2022, 2, 158–175. [Google Scholar] [CrossRef]
  21. Olanrewaju, O.S.; Ayangbenro, A.S.; Glick, B.R.; Babalola, O.O. Plant health: Feedback effect of root exudates-rhizobiome interactions. Appl. Microbiol. Biotechnol. 2019, 103, 1155–1166. [Google Scholar] [CrossRef] [PubMed]
  22. Backer, R.; Rokem, J.S.; Ilangumaran, G.; Lamont, J.; Praslickova, D.; Ricci, E.; Subramanian, S.; Smith, D.L. Plant Growth-Promoting Rhizobacteria: Context, Mechanisms of Action, and Roadmap to Commercialization of Biostimulants for Sustainable Agriculture. Front. Plant Sci. 2018, 9, 1473. [Google Scholar] [CrossRef] [PubMed]
  23. Vacheron, J.; Desbrosses, G.; Bouffaud, M.-L.; Touraine, B.; Moënne-Loccoz, Y.; Muller, D.; Legendre, L.; Wisniewski-Dyé, F.; Prigent-Combaret, C. Plant growth-promoting rhizobacteria and root system functioning. Front. Plant Sci. 2013, 4, 356. [Google Scholar] [CrossRef] [PubMed]
  24. Spaepen, S.; Bossuyt, S.; Engelen, K.; Marchal, K.; Vanderleyden, J. Phenotypical and molecular responses of Arabidopsis thaliana roots as a result of inoculation with the auxin-producing bacterium Azospirillum brasilense. New Phytol. 2014, 201, 850–861. [Google Scholar] [CrossRef] [PubMed]
  25. Chen, L.; Liu, Y.; Wu, G.; Veronican Njeri, K.; Shen, Q.; Zhang, N.; Zhang, R. Induced maize salt tolerance by rhizosphere inoculation of Bacillus amyloliquefaciens SQR9. Physiol. Plant. 2016, 158, 34–44. [Google Scholar] [CrossRef] [PubMed]
  26. Djonovic, S.; Vargas, W.A.; Kolomiets, M.V.; Horndeski, M.; Wiest, A.; Kenerley, C.M. A proteinaceous elicitor Sm1 from the beneficial fungus Trichoderma virens is required for induced systemic resistance in maize. Plant Physiol. 2007, 145, 875–889. [Google Scholar] [CrossRef]
  27. Fierer, N. Embracing the unknown: Disentangling the complexities of the soil microbiome. Nat. Rev. Microbiol. 2017, 15, 579–590. [Google Scholar] [CrossRef]
  28. Lin, Y.; Ye, G.; Kuzyakov, Y.; Liu, D.; Fan, J.; Ding, W. Long-term manure application increases soil organic matter and aggregation, and alters microbial community structure and keystone taxa. Soil Biol. Biochem. 2019, 134, 187–196. [Google Scholar] [CrossRef]
  29. Sapp, M.; Harrison, M.; Hany, U.; Charlton, A.; Thwaites, R. Comparing the effect of digestate and chemical fertiliser on soil bacteria. Appl. Soil Ecol. 2015, 86, 1–9. [Google Scholar] [CrossRef]
  30. Tosi, M.; Deen, W.; Drijber, R.; McPherson, M.; Stengel, A.; Dunfield, K. Long-term N inputs shape microbial communities more strongly than current-year inputs in soils under 10-year continuous corn cropping. Soil Biol. Biochem. 2021, 160, 108361. [Google Scholar] [CrossRef]
  31. Bakker, M.G.; Chaparro, J.M.; Manter, D.K.; Vivanco, J.M. Impacts of bulk soil microbial community structure on rhizosphere microbiomes of Zea mays. Plant Soil 2015, 392, 115–126. [Google Scholar] [CrossRef]
  32. Jiang, Y.; Li, S.; Li, R.; Zhang, J.; Liu, Y.; Lv, L.; Zhu, H.; Wu, W.; Li, W. Plant cultivars imprint the rhizosphere bacterial community composition and association networks. Soil Biol. Biochem. 2017, 109, 145–155. [Google Scholar] [CrossRef]
  33. Baudoin, E.; Benizri, E.; Guckert, A. Impact of growth stage on the bacterial community structure along maize roots, as determined by metabolic and genetic fingerprinting. Appl. Soil Ecol. 2002, 19, 135–145. [Google Scholar] [CrossRef]
  34. Chaparro, J.M.; Badri, D.V.; Vivanco, J.M. Rhizosphere microbiome assemblage is affected by plant development. ISME J. 2014, 8, 790–803. [Google Scholar] [CrossRef] [PubMed]
  35. Pascale, A.; Proietti, S.; Pantelides, I.S.; Stringlis, I.A. Modulation of the Root Microbiome by Plant Molecules: The Basis for Targeted Disease Suppression and Plant Growth Promotion. Front. Plant Sci. 2020, 10, 1741. [Google Scholar] [CrossRef] [PubMed]
  36. Peiffer, J.A.; Spor, A.; Koren, O.; Jin, Z.; Tringe, S.G.; Dangl, J.L.; Buckler, E.S.; Ley, R.E. Diversity and heritability of the maize rhizosphere microbiome under field conditions. Proc. Natl. Acad. Sci. USA 2013, 110, 6548–6553. [Google Scholar] [CrossRef]
  37. Pfeiffer, S.; Mitter, B.; Oswald, A.; Schloter-Hai, B.; Schloter, M.; Declerck, S.; Sessitsch, A. Rhizosphere microbiomes of potato cultivated in the High Andes show stable and dynamic core microbiomes with different responses to plant development. FEMS Microbiol. Ecol. 2017, 93, fiw242. [Google Scholar] [CrossRef]
  38. Frey-Klett, P.; Garbaye, J.; Tarkka, M. The mycorrhiza helper bacteria revisited. New Phytol. 2007, 176, 22–36. [Google Scholar] [CrossRef]
  39. Zhang, L.; Zhou, J.; George, T.S.; Limpens, E.; Feng, G. Arbuscular mycorrhizal fungi conducting the hyphosphere bacterial orchestra. Trends Plant Sci. 2022, 27, 402–411. [Google Scholar] [CrossRef] [PubMed]
  40. Cornell, C.; Kokkoris, V.; Richards, A.; Horst, C.; Rosa, D.; Bennett, J.A.; Hart, M.M. Do Bioinoculants Affect Resident Microbial Communities? A Meta-Analysis. Front. Agron. 2021, 3, 753474. [Google Scholar] [CrossRef]
  41. Vuolo, F.; Novello, G.; Bona, E.; Gorrasi, S.; Gamalero, E. Impact of Plant-Beneficial Bacterial Inocula on the Resident Bacteriome: Current Knowledge and Future Perspectives. Microorganisms 2022, 10, 2462. [Google Scholar] [CrossRef] [PubMed]
  42. Philippot, L.; Andersson, S.G.E.; Battin, T.J.; Prosser, J.I.; Schimel, J.P.; Whitman, W.B.; Hallin, S. The ecological coherence of high bacterial taxonomic ranks. Nat. Rev. Microbiol. 2010, 8, 523–529. [Google Scholar] [CrossRef] [PubMed]
  43. Jangid, K.; Williams, M.A.; Franzluebbers, A.J.; Sanderlin, J.S.; Reeves, J.H.; Jenkins, M.B.; Endale, D.M.; Coleman, D.C.; Whitman, W.B. Relative impacts of land-use, management intensity and fertilization upon soil microbial community structure in agricultural systems. Soil Biol. Biochem. 2008, 40, 2843–2853. [Google Scholar] [CrossRef]
  44. Von Mering, C.; Hugenholtz, P.; Raes, J.; Tringe, S.G.; Doerks, T.; Jensen, L.J.; Ward, N.; Bork, P. Quantitative phylogenetic assessment of microbial communities in diverse environments. Science 2007, 315, 1126–1130. [Google Scholar] [CrossRef] [PubMed]
  45. Fierer, N.; Jackson, J.A.; Vilgalys, R.; Jackson, R.B. Assessment of soil microbial community structure by use of taxon-specific quantitative PCR assays. Appl. Environ. Microbiol. 2005, 71, 4117–4120. [Google Scholar] [CrossRef] [PubMed]
  46. Philippot, L.; Bru, D.; Saby, N.P.A.; Cuhel, J.; Arrouays, D.; Simek, M.; Hallin, S. Spatial patterns of bacterial taxa in nature reflect ecological traits of deep branches of the 16S rRNA bacterial tree. Environ. Microbiol. 2009, 11, 3096–3104. [Google Scholar] [CrossRef]
  47. Lanza, G.; Rebensburg, P.; Kern, J.; Lentzsch, P.; Wirth, S. Impact of chars and readily available carbon on soil microbial respiration and microbial community composition in a dynamic incubation experiment. Soil Tillage Res. 2016, 164, 18–24. [Google Scholar] [CrossRef]
  48. Fierer, N.; Bradford, M.A.; Jackson, R.B. Toward an ecological classification of soil bacteria. Ecology 2007, 88, 1354–1364. [Google Scholar] [CrossRef]
  49. Gan, Y.; Hanson, K.G.; Zentner, R.P.; Selles, F.; McDonald, C.L. Response of lentil to microbial inoculation and low rates of fertilization in the semiarid Canadian prairies. Can. J. Plant Sci. 2005, 85, 847–855. [Google Scholar] [CrossRef]
  50. Chatterjee, A.; Franzen, D.W. Do we need to apply additional phosphorus for corn succeeding sugarbeet? Agron. J. 2020, 112, 4492–4497. [Google Scholar] [CrossRef]
  51. Köppen, W.; Geiger, R. Handbuch der Klimatologie; Gebrüder Borntraeger: Berlin, Germany, 1930. [Google Scholar]
  52. Meier, U. Entwicklungsstadien Mono- und Dikotyler Pflanzen: BBCH Monografie; Julius-Kühn-Institut (JKI): Quedlinburg, Germany, 2018. [Google Scholar]
  53. Vierheilig, H.; Piché, Y. A modified procedure for staining arbuscular mycorrhizal fungi in roots. Z. Pflanzenernaehr. Bodenk. 1998, 161, 601–602. [Google Scholar] [CrossRef]
  54. Giovannetti, M.; Mosse, B. An Evaluation of Techniques for Measuring Vesicular Arbuscular Mycorrhizal Infection in Roots. New Phytol. 1980, 84, 489–500. [Google Scholar] [CrossRef]
  55. O’Kelly, B.C. Oven-Drying Characteristics of Soils of Different Origins. Dry. Technol. 2005, 23, 1141–1149. [Google Scholar] [CrossRef]
  56. Degelmann, D.M.; Borken, W.; Drake, H.L.; Kolb, S. Different Atmospheric Methane-Oxidizing Communities in European Beech and Norway Spruce Soils. Appl. Environ. Microbiol. 2010, 76, 3228–3235. [Google Scholar] [CrossRef] [PubMed]
  57. Kassambara, A. Rstatix: Pipe-Friendly Framework for Basic Statistical Tests, R Package Version 0.7.0; 2021. Available online: https://CRAN.R-project.org/package=rstatix (accessed on 28 September 2023).
  58. Giani, L.; Makowsky, L.; Mueller, K. Plaggic Anthrosol: Soil of the Year 2013 in Germany: An overview on its formation, distribution, classification, soil function and threats. J. Plant Nutr. Soil Sci. 2014, 177, 320–329. [Google Scholar] [CrossRef]
  59. Landwirtschaftskammer Niedersachsen. Empfehlungen zur Grunddüngung. Available online: https://www.lwk-niedersachsen.de/services/download.cfm?file=22858 (accessed on 28 September 2023).
  60. Lanwirtschaftskammer Niedersachsen. Unterfußdüngung zu Mais. Available online: https://www.landwirtschaftskammer.de/landwirtschaft/ackerbau/mais/unterfussduengung-pdf.pdf (accessed on 5 October 2023).
  61. Anderson, S.F.; Kelley, K.; Maxwell, S.E. Sample-Size Planning for More Accurate Statistical Power: A Method Adjusting Sample Effect Sizes for Publication Bias and Uncertainty. Psychol. Sci. 2017, 28, 1547–1562. [Google Scholar] [CrossRef]
  62. Von Tucher, S.; Hörndl, D.; Schmidhalter, U. Interaction of soil pH and phosphorus efficacy: Long-term effects of P fertilizer and lime applications on wheat, barley, and sugar beet. Ambio 2018, 47, 41–49. [Google Scholar] [CrossRef]
  63. Goldmann, K.; Boeddinghaus, R.S.; Klemmer, S.; Regan, K.M.; Heintz-Buschart, A.; Fischer, M.; Prati, D.; Piepho, H.-P.; Berner, D.; Marhan, S.; et al. Unraveling spatiotemporal variability of arbuscular mycorrhizal fungi in a temperate grassland plot. Environ. Microbiol. 2020, 22, 873–888. [Google Scholar] [CrossRef]
  64. Xu, X.; Chen, C.; Zhang, Z.; Sun, Z.; Chen, Y.; Jiang, J.; Shen, Z. The influence of environmental factors on communities of arbuscular mycorrhizal fungi associated with Chenopodium ambrosioides revealed by MiSeq sequencing investigation. Sci. Rep. 2017, 7, 45134. [Google Scholar] [CrossRef]
  65. Ziane, S.O.; Talibi, Z.E.A.; Douira, A.; Amir, S.; Meddich, A.; El Modafar, C. Synergistic effects of arbuscular mycorrhizal fungi associated to plant growth-promoting rhizobacteria in suppression of soil-borne Fusarium wilt of date palm. Biocatal. Agric. Biotechnol. 2023, 51, 102753. [Google Scholar] [CrossRef]
  66. Raklami, A.; Bechtaoui, N.; Tahiri, A.-I.; Anli, M.; Meddich, A.; Oufdou, K. Use of Rhizobacteria and Mycorrhizae Consortium in the Open Field as a Strategy for Improving Crop Nutrition, Productivity and Soil Fertility. Front. Microbiol. 2019, 10, 1106. [Google Scholar] [CrossRef] [PubMed]
  67. Cho, E.K.; Choi, I.S.; Choi, Y.J. Overexpression and characterization of thermostable chitinase from Bacillus atrophaeus SC081 in Escherichia coli. BMB Rep. 2011, 44, 193–198. [Google Scholar] [CrossRef]
  68. Sella, S.R.B.R.; Vandenberghe, L.P.S.; Soccol, C.R. Bacillus atrophaeus: Main characteristics and biotechnological applications—A review. Crit. Rev. Biotechnol. 2015, 35, 533–545. [Google Scholar] [CrossRef]
  69. Guo, Y.; Huang, E.; Yang, X.; Zhang, L.; Yousef, A.E.; Zhong, J. Isolation and characterization of a Bacillus atrophaeus strain and its potential use in food preservation. Food Control 2016, 60, 511–518. [Google Scholar] [CrossRef]
  70. Rajaofera, M.; Jin, P.F.; Fan, Y.M.; Sun, Q.Q.; Huang, W.K.; Wang, W.B.; Shen, H.Y.; Zhang, S.; Lin, C.H.; Liu, W.B.; et al. Antifungal activity of the bioactive substance from Bacillus atrophaeus strain HAB-5 and its toxicity assessment on Danio rerio. Pestic. Biochem. Physiol. 2018, 147, 153–161. [Google Scholar] [CrossRef]
  71. Rodríguez, M.; Marín, A.; Torres, M.; Béjar, V.; Campos, M.; Sampedro, I. Aphicidal Activity of Surfactants Produced by Bacillus atrophaeus L193. Front. Microbiol. 2018, 9, 3114. [Google Scholar] [CrossRef]
  72. Xue, J.; Sun, L.; Xu, H.; Gu, Y.; Lei, P. Bacillus atrophaeus NX-12 Utilizes Exosmotic Glycerol from Fusarium oxysporum f. sp. cucumerinum for Fengycin Production. J. Agric. Food Chem. 2023, 71, 10565–10574. [Google Scholar] [CrossRef] [PubMed]
  73. Zhang, X.; Li, B.; Wang, Y.; Guo, Q.; Lu, X.; Li, S.; Ma, P. Lipopeptides, a novel protein, and volatile compounds contribute to the antifungal activity of the biocontrol agent Bacillus atrophaeus CAB-1. Appl. Microbiol. Biotechnol. 2013, 97, 9525–9534. [Google Scholar] [CrossRef] [PubMed]
  74. Köhl, L.; Lukasiewicz, C.E.; van der Heijden, M.G.A. Establishment and effectiveness of inoculated arbuscular mycorrhizal fungi in agricultural soils. Plant Cell Environ. 2016, 39, 136–146. [Google Scholar] [CrossRef]
  75. Dias, T.; Correia, P.; Carvalho, L.; Melo, J.; de Varennes, A.; Cruz, C. Arbuscular mycorrhizal fungal species differ in their capacity to overrule the soil’s legacy from maize monocropping. Appl. Soil Ecol. 2018, 125, 177–183. [Google Scholar] [CrossRef]
  76. Kaeppler, S.M.; Parke, J.L.; Mueller, S.M.; Senior, L.; Stuber, C.; Tracy, W.F. Variation among Maize Inbred Lines and Detection of Quantitative Trait Loci for Growth at Low Phosphorus and Responsiveness to Arbuscular Mycorrhizal Fungi. Crop Sci. 2000, 40, 358–364. [Google Scholar] [CrossRef]
  77. Raya-Hernández, A.I.; Jaramillo-López, P.F.; López-Carmona, D.A.; Díaz, T.; Carrera-Valtierra, J.A.; Larsen, J. Field evidence for maize-mycorrhiza interactions in agroecosystems with low and high P soils under mineral and organic fertilization. Appl. Soil Ecol. 2020, 149, 103511. [Google Scholar] [CrossRef]
  78. Sylvia, D.M.; Neal, L.H. Nitrogen affects the phosphorus response of VA mycorrhiza. New Phytol. 1990, 115, 303–310. [Google Scholar] [CrossRef] [PubMed]
  79. Chowdhury, S.P.; Dietel, K.; Rändler, M.; Schmid, M.; Junge, H.; Borriss, R.; Hartmann, A.; Grosch, R. Effects of Bacillus amyloliquefaciens FZB42 on lettuce growth and health under pathogen pressure and its impact on the rhizosphere bacterial community. PLoS ONE 2013, 8, e68818. [Google Scholar] [CrossRef]
  80. Kröber, M.; Wibberg, D.; Grosch, R.; Eikmeyer, F.; Verwaaijen, B.; Chowdhury, S.P.; Hartmann, A.; Pühler, A.; Schlüter, A. Effect of the strain Bacillus amyloliquefaciens FZB42 on the microbial community in the rhizosphere of lettuce under field conditions analyzed by whole metagenome sequencing. Front. Microbiol. 2014, 5, 252. [Google Scholar] [CrossRef]
  81. Krnjaja, V.; Nesic, Z.; Stankovic, S.; Radovic, C.; Lukic, M. Nitrogen effects on maize susceptibility to Fusarium ear rot (Fusarium verticillioides). Cereal Res. Commun. 2008, 36, 579–580. [Google Scholar]
  82. Orr, R.; Dennis, P.G.; Wong, Y.; Browne, D.J.; Cooper, M.; Birt, H.W.G.; Lapis-Gaza, H.R.; Pattison, A.B.; Nelson, P.N. Nitrogen fertilizer rate but not form affects the severity of Fusarium wilt in banana. Front. Plant Sci. 2022, 13, 907819. [Google Scholar] [CrossRef] [PubMed]
  83. Xiong, W.; Guo, S.; Jousset, A.; Zhao, Q.; Wu, H.; Li, R.; Kowalchuk, G.A.; Shen, Q. Bio-fertilizer application induces soil suppressiveness against Fusarium wilt disease by reshaping the soil microbiome. Soil Biol. Biochem. 2017, 114, 238–247. [Google Scholar] [CrossRef]
  84. Li, N.; Wang, C.; Li, X.; Liu, M. Effects of earthworms and arbuscular mycorrhizal fungi on preventing Fusarium oxysporum infection in the strawberry plant. Plant Soil 2019, 443, 139–153. [Google Scholar] [CrossRef]
  85. Schmidt, R.; Köberl, M.; Mostafa, A.; Ramadan, E.M.; Monschein, M.; Jensen, K.B.; Bauer, R.; Berg, G. Effects of bacterial inoculants on the indigenous microbiome and secondary metabolites of chamomile plants. Front. Microbiol. 2014, 5, 64. [Google Scholar] [CrossRef]
  86. Kalam, S.; Das, S.N.; Basu, A.; Podile, A.R. Population densities of indigenous Acidobacteria change in the presence of plant growth promoting rhizobacteria (PGPR) in rhizosphere. J. Basic Microbiol. 2017, 57, 376–385. [Google Scholar] [CrossRef]
  87. Navarrete, A.A.; Kuramae, E.E.; de Hollander, M.; Pijl, A.S.; van Veen, J.A.; Tsai, S.M. Acidobacterial community responses to agricultural management of soybean in Amazon forest soils. FEMS Microbiol. Ecol. 2013, 83, 607–621. [Google Scholar] [CrossRef] [PubMed]
  88. Bonk, F.; Popp, D.; Harms, H.; Centler, F. PCR-based quantification of taxa-specific abundances in microbial communities: Quantifying and avoiding common pitfalls. J. Microbiol. Methods 2018, 153, 139–147. [Google Scholar] [CrossRef]
  89. Starke, R.; Pylro, V.S.; Morais, D.K. 16S rRNA Gene Copy Number Normalization Does Not Provide More Reliable Conclusions in Metataxonomic Surveys. Microb. Ecol. 2021, 81, 535–539. [Google Scholar] [CrossRef]
  90. Lofgren, L.A.; Uehling, J.K.; Branco, S.; Bruns, T.D.; Martin, F.; Kennedy, P.G. Genome-based estimates of fungal rDNA copy number variation across phylogenetic scales and ecological lifestyles. Mol. Ecol. 2019, 28, 721–730. [Google Scholar] [CrossRef] [PubMed]
  91. Stoddard, S.F.; Smith, B.J.; Hein, R.; Roller, B.R.K.; Schmidt, T.M. rrnDB: Improved tools for interpreting rRNA gene abundance in bacteria and archaea and a new foundation for future development. Nucleic Acids Res. 2015, 43, D593–D598. [Google Scholar] [CrossRef] [PubMed]
  92. Kembel, S.W.; Wu, M.; Eisen, J.A.; Green, J.L. Incorporating 16S Gene Copy Number Information Improves Estimates of Microbial Diversity and Abundance. PLoS Comput. Biol. 2012, 8, e1002743. [Google Scholar] [CrossRef]
  93. Lopes, L.D.; Schachtman, D.P. Rhizosphere and bulk soil bacterial community succession is influenced more by changes in soil properties than in rhizosphere metabolites across a maize growing season. Appl. Soil Ecol. 2023, 189, 104960. [Google Scholar] [CrossRef]
  94. Lopes, L.D.; Wang, P.; Futrell, S.L.; Schachtman, D.P. Sugars and Jasmonic Acid Concentration in Root Exudates Affect Maize Rhizosphere Bacterial Communities. Appl. Environ. Microbiol. 2022, 88, e0097122. [Google Scholar] [CrossRef]
  95. Banerjee, S.; Schlaeppi, K.; van der Heijden, M.G.A. Keystone taxa as drivers of microbiome structure and functioning. Nat. Rev. Microbiol. 2018, 16, 567–576. [Google Scholar] [CrossRef]
  96. Banerjee, S.; Kirkby, C.A.; Schmutter, D.; Bissett, A.; Kirkegaard, J.A.; Richardson, A.E. Network analysis reveals functional redundancy and keystone taxa amongst bacterial and fungal communities during organic matter decomposition in an arable soil. Soil Biol. Biochem. 2016, 97, 188–198. [Google Scholar] [CrossRef]
  97. Kalam, S.; Basu, A.; Ahmad, I.; Sayyed, R.Z.; El-Enshasy, H.A.; Dailin, D.J.; Suriani, N.L. Recent Understanding of Soil Acidobacteria and Their Ecological Significance: A Critical Review. Front. Microbiol. 2020, 11, 580024. [Google Scholar] [CrossRef]
  98. Kielak, A.M.; Cipriano, M.A.P.; Kuramae, E.E. Acidobacteria strains from subdivision 1 act as plant growth-promoting bacteria. Arch. Microbiol. 2016, 198, 987–993. [Google Scholar] [CrossRef]
  99. Panico, S.C.; Esposito, F.; Memoli, V.; Vitale, L.; Polimeno, F.; Magliulo, V.; Maisto, G.; de Marco, A. Variations of agricultural soil quality during the growth stages of sorghum and sunflower. Appl. Soil Ecol. 2020, 152, 103569. [Google Scholar] [CrossRef]
  100. Nyéki, A.; Kerepesi, C.; Daróczy, B.; Benczúr, A.; Milics, G.; Nagy, J.; Harsányi, E.; Kovács, A.J.; Neményi, M. Application of spatio-temporal data in site-specific maize yield prediction with machine learning methods. Precis. Agric. 2021, 22, 1397–1415. [Google Scholar] [CrossRef]
  101. Pfeiffer, S.; Pastar, M.; Mitter, B.; Lippert, K.; Hackl, E.; Lojan, P.; Oswald, A.; Sessitsch, A. Improved group-specific primers based on the full SILVA 16S rRNA gene reference database. Environ. Microbiol. 2014, 16, 2389–2407. [Google Scholar] [CrossRef]
  102. Mühling, M.; Woolven-Allen, J.; Murrell, J.C.; Joint, I. Improved group-specific PCR primers for denaturing gradient gel electrophoresis analysis of the genetic diversity of complex microbial communities. ISME J. 2008, 2, 379–392. [Google Scholar] [CrossRef]
  103. Müller, T.; Ruppel, S.; Behrendt, U.; Lentzsch, P.; Müller, M.E.H. Antagonistic Potential of Fluorescent Pseudomonads Colonizing Wheat Heads Against Mycotoxin Producing Alternaria and Fusaria. Front. Microbiol. 2018, 9, 2124. [Google Scholar] [CrossRef]
Figure 1. (a) Maize dry mass yield (t ha−1) on the “Wanna Sand without biogas slurry” (WSo) and “Wanna Sand” (WS) sites in 2021. (b) Concentrations of mineral nitrogen (Nmin) and plant-available phosphorous (PDL) in the soil at the sampling dates t2 (June) and t3 (July). MO—application of a combined inoculum containing three species of AMF and B. atrophaeus; NN—no starter fertilizer; DAP—starter fertilization with diammonium phosphate; MG—starter fertilization with organomineral microgranular fertilizer. The values are depicted as the mean and 95% confidence interval.
Agronomy 13 02900 g001
Figure 2. (a) Abundance of the inoculated strain B. atrophaeus Abi05 found inside the application area on the “Wanna Sand without biogas slurry” (WSo) and “Wanna Sand” (WS) sites at the sampling dates t3 (July) and t4 (August) (natural logarithm of genome copy numbers). (b) Root mycorrhizal colonization rate at sampling date t3 (July) at the WSo site. NN—no starter fertilizer; DAP—starter fertilization with diammonium phosphate; MG—starter fertilization with organomineral microgranular fertilizer; MO—application of combined inoculum containing AMF and B. atrophaeus.
Agronomy 13 02900 g002
Figure 3. Soil microbial community composition in the “Wanna Sand without biogas slurry” (WSo) and “Wanna Sand” (WS) sites at the sampling dates t3 (July) and t4 (August), bR—between the maize rows (outside the application area of starter fertilizers and MO), iR—in the rows (inside the application area of starter fertilizers and MO); the quantified groups were: Acido—Acidobacteria, Actino—Actinobacteria, Alpha—α-Proteobacteria, Beta—β-Proteobacteria, Cya—Cyanobacteria, Fusa—Fusaria, Firmi—Firmicutes, ITS—total fungi.
Agronomy 13 02900 g003
Figure 4. Principal coordinate analysis of microbial community composition between the “Wanna Sand without biogas slurry” (WSo) and “Wanna Sand” (WS) sites at the sampling dates t3 (July) and t4 (August). For each investigated microbial group, the lines and group names inside the blue circle indicate the associated direction in the ordination (Acido—Acidobacteria, Actino—Actinobacteria, Alpha—α-Proteobacteria, Beta—β-Proteobacteria, Cya—Cyanobacteria, FAkorr—Fusaria, Firmi—Firmicutes, ITS—total fungi). The length of the line indicates the strength of this association.
Agronomy 13 02900 g004
Table 1. Soil parameters of the “Wanna Sand without biogas slurry” (WSo) and “Wanna Sand” (WS) sites before the experimental setup (after biogas digestate application to the WS site) (17 April 2021).
SiteWSWSo
Depth [cm]0–3030–6060–900–3030–6060–90
TOC [%]3.16 ± 0.302.19 ± 1.040.83 ± 0.492.57 ± 0.291.21 ± 0.120.44 ± 0.14
Ntot [%]0.21 ± 0.020.12 ± 0.070.06 ± 0.010.23 ± 0.040.12 ± 0.030.06 ± 0.02
Nmin [kg ha−1]102.3 ± 17.132.0 ± 9.312.7 ± 2.157.4 ± 29.947.7 ± 19.72.2 ± 0.84
PDL [mg 100 g−1 soil]19.1 ± 1.110.4 ± 4.84.7 ± 6.620.1 ± 1.920.0 ± 3.213.3 ± 4.2
KDL [mg 100 g−1 soil]22.8 ± 2.114.4 ± 3.58.9 ± 3.57.5 ± 2.55.0 ± 1.73.2 ± 0.6
MgDL [mg 100 g−1 soil]9.4 ± 1.35.6 ± 0.63.5 ± 1.66.4 ± 2.05.0 ± 2.04.5 ± 2.1
pH5.16 ± 0.085.37 ± 0.085.47 ± 0.084.61 ± 0.094.56 ± 0.154.66 ± 0.08
TOC—total organic carbon; Ntot—total nitrogen; Nmin—mineral nitrogen; PDL—plant-available phosphorous; KDL—plant-available potassium; MgDL—plant-available magnesium.
Table 2. Rates of fertilizer and inoculum application and the resulting nutrient inputs.
TreatmentFertilizer/InoculumApplication RateN Input
[kg ha−1]
P Input
[kg ha−1]
K Input
[kg ha−1]
DAPDAP100 kg ha−118.020.1-
MGMG25 kg ha−11.92.40.8
MOMO inoculum in bentonite25 kg ha−1---
MG + MOMO inoculum in MG25 kg ha−11.92.40.8
DAP + MODAP
MO inoculum in bentonite
100 kg ha−1
25 kg ha−1
18.0
-
20.1
-
-
-
MO—application of a combined inoculum containing three species of AMF and B. atrophaeus; DAP—starter fertilization with diammonium phosphate; MG—starter fertilization with organomineral microgranular fertilizer.
Table 3. Five-factorial permANOVA analysis of the soil microbial community composition inside the application area of starter fertilizers and MO. The analyzed parameters were total gene copy number (tot-gcn, the sum of the gene copy numbers of all investigated microbial groups), multivariate community composition (Bray–Curtis dissimilarity), and the relative abundance of the investigated microbial groups.
Source of Variationtot-gcnMultivariateAcidoActinoFirmiAlphaBetaCyaITSFusa
site<0.001<0.0010.9150.632<0.0010.1950.0470.1230.0040.003
time0.005<0.0010.0300.686<0.001<0.0010.002<0.001<0.0010.095
fert0.3940.6190.7570.8950.5140.5160.6720.5650.7180.167
MO0.1300.3150.3920.5180.0220.3040.4110.1470.8600.434
site:time<0.001<0.001<0.001<0.001<0.001<0.0010.3000.1780.1730.451
site:fert0.9960.8990.5100.3870.4300.6710.7090.7810.7250.003
site:MO0.0270.0850.1070.2990.0270.2940.0560.4040.4260.823
time:fert0.9650.5690.7780.7360.9630.6630.4720.2640.9720.156
time:MO0.5680.8240.4520.3440.8310.4950.7510.9820.1840.491
fert:MO0.4660.7120.4710.6210.6440.1350.5830.7820.3730.255
site:time:fert0.8830.9840.3330.3090.7930.9600.8820.9820.6460.831
site:time:MO0.9520.1510.4650.5090.4500.0840.0700.3350.7770.588
site:fert:MO0.6420.2450.1090.1200.6030.4050.6930.6920.0650.232
time:fert:MO0.5250.2740.0440.1080.5670.2070.2610.3160.4030.278
plot(site:fert:MO)0.0130.0250.0030.0050.1110.0270.6990.9140.1200.839
site:time:fert:MO0.4690.7290.6150.4550.6890.4110.3510.1100.9060.777
Factors: site, time, starter fertilization (fert), plant-beneficial microbe inoculation (MO), plot (nested in site, fert, and MO), and their interactions. Microbial groups: Acido—Acidobacteria, Actino—Actinobacteria, Alpha—α-Proteobacteria, Beta—β-Proteobacteria, Cya—Cyanobacteria, Fusa—Fusaria, Firmi—Firmicutes, ITS—total fungi. The permANOVAs of single parameters were calculated with Euclidean distance. The values are p-values.
Table 4. Correlation coefficients (Kendall–Tau) of the maize dry mass yield at the “Wanna Sand without biohas slurry” (WSo) and “Wanna Sand” (WS) sites with soil-available phosphorous (PDL) and mineral nitrogen (Nmin) concentrations, the soil dry mass content (soil DM), the total gene copy number (tot-gcn, sum of the gcn of all investigated microbial groups), and the relative abundances of the investigated microbial groups at sampling dates t2 (June), t3 (July), and t4 (August). The R2 and significance level of the correlations are displayed in brackets (** p < 0.01, * p < 0.05, and . p < 0.1). Only correlations with p-values ≤ 10% are displayed.
Maize Dry Mass Yield Correlated with:
TimeWSoWS
t2Soil DM (−0.27, .)PDL (0.43, **)
t3B. atrophaeus Abi05 (0.25, .)PDL (0.27, .)
α-Proteobacteria (0.23, .)
t4B. atrophaeus Abi05 (0.30, *)
tot-gcn (0.25, .)
soil DM (−0.25, .)
Firmicutes (0.26, *)
Disclaimer/Publisher’s Note: The statements, opinions and data contained in all publications are solely those of the individual author(s) and contributor(s) and not of MDPI and/or the editor(s). MDPI and/or the editor(s) disclaim responsibility for any injury to people or property resulting from any ideas, methods, instructions or products referred to in the content.

