Article

Comparative Assessment of Nutritional Metabolites in Yellow Soybeans at Different Growth Years and Their Antioxidant and α-Glucosidase Inhibition Properties

1
Department of Green Bio Science and Agri-Food Bio Convergence Institute, Gyeongsang National University, Jinju 52725, Republic of Korea
2
Department of Life Resource Industry, Dong-A University, 37, Nakdong-daero 550 beon-gil, Saha-gu, Busan 49315, Republic of Korea
*
Author to whom correspondence should be addressed.
Agronomy 2023, 13(12), 2914; https://doi.org/10.3390/agronomy13122914
Submission received: 28 October 2023 / Revised: 21 November 2023 / Accepted: 25 November 2023 / Published: 27 November 2023

Abstract

:
With regard to obtaining valuable information on the development of new breeding lines and functional agents, the present study was the first to demonstrate variations in nutritional metabolites and biological properties in yellow soybeans at three growth years. Three metabolites (fatty acid, amino acid, isoflavone) exhibited significant differences between cultivars and growth years; specifically, linoleic acid, glutamic acid, and malonylgenistin displayed the highest average contents at 38.7 mg/g, 59.9 mg/100 g, and 992.6 μg/g, exhibiting predominant changes in the range of 21.6–61.2 mg/g, 34.3–113.3 mg/100 g, and 455.8–1778.9 μg/g, respectively. Moreover, the biofunctional effects differed remarkably in the order ABTS > α-glucosidase > DPPH at 500 μg/mL (50% methanol extracts). The TPC, TFC, DNA protection, and FRAP ratios also showed remarkable changes in cultivars across growth times. Interestingly, the Daepung cultivar may be considered an alternative source for the development of new soybeans and nutraceutical foods due to its high metabolites (average contents, fatty acid: 80.8 mg/g; amino acid: 353.8 mg/100 g; isoflavone: 4048.2 μg/g) and excellent beneficial activities (75.1% ABTS, 52.5% DPPH, 100% DNA protection, 73.1% α-glucosidase, 1.54 OD593 nm FRAP at 500 μg/mL). Our observations may contribute to providing valuable information on the relationship between metabolites and the biological properties of yellow soybeans.

1. Introduction

Soybean is an important leguminous crop, which contains abundant bioactive constituents [1,2,3,4,5,6,7], and this crop has been used for human consumption, animal feed, and biodiesel production [1,8,9]. At present, this species and its products have been widely consumed as food and used in commercial applications because of their nutritive and dietary properties in humans, such as anticancer [6], antioxidant [2,5], anti-obesity [10,11], antiatherosclerotic [12], and anti-inflammatory [6] abilities. Several researchers have demonstrated that the multiple beneficial functions of soybeans and their foods are associated with their phytochemical profiles and contents, including secondary metabolites of isoflavone (antioxidant, digestive enzyme inhibition) [2,5], saponin (BMP-2-induced bone formation, anticancer, anti-inflammatory) [1,6], phenolic acid (antidiabetes, antihypertension, antioxidant) [10,11], anthocyanin (antioxidant, anti-aging) [5], and pterocarpan (anti-atherosclerotic) [12], as well as primary metabolites of fatty acid, amino acid, and protein [2,5,13]. Among diverse metabolites, isoflavones are rich in biologically active phytoestrogens and divided into four chemical categories (malonyl glucoside, acetyl glucoside, glucoside, and aglycone), including β-glucoside-conjugated forms of three types (genistein, daidzein, and glycitein) [1,2,5,13]. These phytochemicals are related to the potential human-health-enhancing capacities, namely lowering osteoporosis [6], preventing cancer [6], antioxidant [2], inhibiting digestive enzyme [2] and menopause symptoms, anti-inflammation [14], and preventing cardiovascular diseases [6]. Soybean amino acids and fatty acids also play major roles in combating cardiovascular diseases [15]. The essential ingredient in oil, fatty acid, has health activities in regulating glucose and lipids [16], and has been broadly applied in biofuel production and dietary use [17]. Moreover, the main ingredient of protein, amino acid, is renowned as a valuable pharmacological antimutagenicity, antioxidant, and antiobesity agent to reduce blood cholesterol level and inhibit the incidence of coronary heart diseases [18,19]. In general, many studies have noted that the metabolite profile and accumulation in foods, crops, and natural plants were closely related to the environmental condition, genotypic diversity, growth stage, physiological state, and interactions with other factors [2,5,6,11,13]. Particularly, commercial soybeans have various seed coat colors (yellow, brown, green, black, and mottle) in accordance with their chemical compositions and contents [20,21]. Among them, yellow coated soybeans have been utilized as a good source of traditionally fermented foods, including soybean sauce (Kanjang), soybean pasta (Doenjang), soybean cake (Meju), and soybean cook (Cheonggukjang), compared to other seed-coated soybeans in Korea [2,13,22]. However, few comprehensive investigations have reported the metabolite contents and bioactive characteristics of yellow soybeans. Furthermore, studies on understanding variations of the functions of this source grown under field conditions across different growth years are limited. At present, crop breeding researchers have focused on comparing the nutritional constituents and biological values of various soybean cultivars. In addition, this crop has received considerable interest from the food and pharmaceutical industries because of the increasing patterns in nutritional values under different processing techniques. Therefore, improving the useful information on nutritional metabolites and biological properties in yellow soybeans at different growth years may aid in their further application in the food industry from functional and nutraceutical sources, as well as soybean breeding aspects.
The present research aimed to demonstrate that excellent cultivars have not only high metabolite contents but also strong bioactive functions in yellow soybeans across different growth years and can be used to obtain new functional soy-based substrates. Herein, we investigated the metabolite profiles, such as fatty acids, amino acids, and isoflavones, in five yellow soybean lines over three years. Additionally, this work demonstrated for the first time the difference among antioxidant (DPPH radical, ABTS radical, and FRAP), DNA protection, and α-glucosidase inhibition capacities. We also accessed the antioxidant ratios in accordance with the changes in total phenolic content (TPC) and total flavonoid content (TFC) between cultivars and growth years.

2. Materials and Methods

2.1. Crop Materials and Chemicals

Many Korean yellow soybeans were used in the preliminary experiments, and five cultivars were selected for their metabolite and biological aspects. Five yellow soybean cultivars (cv. Saedanbaek, Daewon, Daepung, Neulchan, and Taekwang) were developed by the National Institute of Crop Science of the Rural Development Administration. All cultivars were grown in 2019, 2020, and 2021 in the experimental field of the same institution. The harvested soybean seeds were air-dried for 7 days at 25 °C to remove the dust residue and moisture under natural light and then stored at −40 °C. HPLC solvents (methanol and water) were obtained from J.J Baker (Phillipsburg, NJ, USA). Standard isoflavone aglycone and glucoside derivatives were isolated from soybean cultivar (cv. Daepung) by previously described methods [5,13] with slight modifications, and acetyl and malonyl isoflavones were purchased from Sigma-Aldrich (St. Louis, MO, USA). Fatty acid and amino acid standards were also acquired from Sigma-Aldrich Chemical. A Folin–Ciocalteu phenol reagent, gallic acid, diethylene glycol, rutin, butylated hydroxytoluene (BHT), 2,2′-azino-bis(3-ethylbenzthiazoline-6-sulphonic acid) (ABTS), α-glucosidase (EC 3.2.1.20), 2,4,6-tripyridyl-s-triazine (TPTZ), 2,2-diphenyl-1-pycrylhydrazyl (DPPH), 6-hydroxy-2,5,7,8-tetramethylchroman-2-carboxylic acid (Trolox), dithiothreitol (DTT), FeCl3, N-succinyl-Ala-Ala-Ala-p-nitroanilide (SANA), p-nitrophenol, p-nitrophenyl-β-D-glucopyranoside (p-NPG), p-nitrophenyl-α-D-glucopyranoside (PNP-G), p-nitrophenyl-butyrate (NPB), butylated hydroxytoluene (BHT), acarbose, and ascorbic acid were also supplied from Sigma-Aldrich Chemical. The super-coiled plasmid DNA pUC18 was provided by Thermo Fisher Scientific (Waltham, MA, USA). Other chemicals and reagents were provided by Sigma-Aldrich and were of analytical grade.

2.2. Equipment

The antioxidant and α-glucosidase inhibitory effects as well as TPC and TFC were investigated by UV–Vis spectra using Agilent BioTek spectrophotometry (EPOCH 2, Winooski, VT, USA). The DNA protection rates were measured by the Gel Doc XR+ system (Bio-Rad, Hercules, CA, USA). Fatty acid contents were measured by gas chromatography (GC) (Agilent Technologies 7980 system, Wilmington, DE, USA) coupled to a flame ion detector with an SP-2560 capillary column (100 m × 0.25 mm i.d., 0.25 μm film thickness, St. Louis, MO, USA). The amino acid compositions were assessed using an amino acid analyzer (L-8900 automatic, Hitachi High-Technologies, Tokyo, Japan). Quantitative analyses of isoflavones were achieved using an Agilent HPLC 1200 system (Boeblingen, Germany) equipped with quaternary pump and autosampler coupled with a diode array detector on a Lichro CART 125-4 C18 column (125 m × 4 mm i.d., 5 μm, Merck, Darmstadt, Germany). The isolated isoflavones were elucidated using a Bruker AM 500 spectrometer (1H and 13C NMR data, Karlsruhe, Germany) in DMSO-d6 with tetramethyl silane.

2.3. Evaluation of TPC and TFC

TPC and TFC analyses were documented as the reported methods in previous work [13]. In measuring TPC, the stock solution (1.0 mg/mL) of sample was made with 50% methanol, and then the appropriately diluted sources were added to 1 N Folin–Ciocalteu agent (0.5 mL). After standing for 3 min, the sodium carbonate solution (20% Na2CO3, 1.5 mL) was added to the sample Folin–Ciocalteu mixture and incubated for 30 min at 25 °C. The absorbance value was examined at 750 nm and compared to a calibration curve of gallic acid (standard material, 0.01–1.0 mg/mL). All values were presented in gallic acid equivalents (GAE) per milligram of dried sample. TFC was performed with a colorimetric assay by a spectrophotometer. The diluted 50% methanol extract of sample (1 mL) was added to 50% methanol (7 mL), followed by 90% diethylene glycol (2 mL) and 4 M sodium hydroxide (0.1 mL). The reaction mixture was incubated at 35 °C for 30 min. The absorbance of crude solution was measured immediately at 420 nm and compared using a calibration curve (rutin, positive control, 0.01–1.0 mg/mL). The results were obtained with milligram equivalents of rutin per 1 g of dried soybean (RE mg/g).

2.4. Evaluation of Fatty Acid Contents

The fatty acid compositions (5 saturated and 7 unsaturated fatty acids) were measured using the boron-trifluoride-catalyzed methylation method [5,23]. In short, the soybean extract (50% methanol, 2 mL) was added to 0.5 N NaOH in methanol (3 mL), and then heated in a water bath (100 °C) for 10 min. After cooling the above-mentioned mixture to room temperature, the crude solution was added to 14% boron trifluoride (2 mL) in methanol. The mixture solution was maintained at 100 °C for 30 min for fatty acid methylation, and then saturated with 6 mL of NaCl (28%) and 2 mL of isooctane. After vortexing, the supernatant was collected and measured by GC, and its contents were evaluated in mg/g. Fatty acid separation was achieved by an SP-2560 capillary column (0.25 mm × 100 m, 0.20 μm) and flame ion detector under a flow rate of 1.0 mL/min (nitrogen gas). The column oven temperature was maintained at 200 °C for 30 min, and the final temperature was increased to 230 °C at 2.5 °C/min. In addition, the inlet and detector temperatures were programmed at 250 °C. These conditions were achieved by previously reported methods with a slight modification [5,23].

2.5. Evaluation of Amino Acid Contents

A total of 17 amino acid components, including 9 non-essential and 8 essential derivatives, were determined using the method proposed by Hwang et al. [2]. The pulverized sample (1 g) was added to 4 mL of distilled water and was boiled for 1 h at 60 °C. After being cooled to room temperature, the mixture solution was hydrolyzed with 10% sulfosalicylic acid (5 mL) for 2 h at 60 °C. Next, the crude mixture was centrifuged at 3000× g for 3 min, and the supernatants were collected and filtered using a 0.45 μm syringe filter. The amount of this constituent content was determined in mg/100 g by an amino acid analyzer.

2.6. Establishment of Calibration Curves and HPLC Conditions for Isoflavone Quantification

The 12 isoflavone standards were elucidated using their retention times in HPLC analysis, and the quantification values were determined by comparing the peak areas of samples at 254 nm. The standard stock solutions of 1000 μg/mL were composed of DMSO, and their calibration curves consisted of seven concentrations (0.5, 1, 5, 10, 50, 100, and 200 μg/mL). The correlation coefficient (r2) of an individual curve was higher than 0.998. All samples were based on dry weight and pulverized for 5 min by an HR 2860 coffee grinder (Koninklijke Philips NV, NV, USA) to measure the isoflavone contents. Each sample (1.0 g) was extracted using 50% methanol (20 mL) at 25 °C for 24 h in a shaking incubator. The supernatant was centrifuged at 3000× g for 5 min, and then filtered through a syringe filter (0.45 μm, Whatman, Maidstone, UK). The crude solution (20 μL) was injected onto an analytical C18 column (125 m × 4 mm, 5 μm, Lichrophore 100 RP-18e, Merck, Darmstadt, Germany), and the column temperature was 25 °C. In addition, the isoflavone peaks were observed by monitoring the elution at 254 nm at a flow rate of 1.0 mL/min. The mobile phase was composed of 0.1% TFA in water (elution A) and 0.1% TFA in acetonitrile (elution B). The elution gradient program was as follows: 0–10 min, 15% B; 10–20 min, 25% B; 20–30 min, 40% B; 30–45 min, 55% B; and then retained in 100% B for 3 min before returning to the initial state. The above-mentioned separation conditions were obtained using the method described by Lee et al. [5] with a slight modification.

2.7. Antioxidant Properties Based on Radical and FRAP Assays

The radical scavenging and FRAP methods were selected for antioxidant capacities. The DPPH radical scavenging rates were measured in accordance with the method proposed by Hwang et al. [2]. A 1 mM DPPH containing 50% methanol solution was prepared, and then various concentrations (5–1000 μg/mL) of sample or BHT (positive control) were obtained. Sample or BHT (1 mL) was mixed with 1 mM DPPH solution (0.39 mL) and 50% methanol extract (0.49 mL). The above-mentioned solution was shaken well and incubated in darkness at 25 °C for 30 min, and then the reaction solution was determined at 517 nm using a spectrophotometer. This ability was carried out as a percentage according to the following Equation (1):
Scavenging capacity (%) = (1 − absorbance of sample/absorbance of the control) × 100
The ABTS radical scavenging effect was also measured using the method explained by Hwang et al. [2]. For the ABTS method, the reaction solution was composed of 7 mM ABTS (dissolved in ethanol) and 2.45 mM potassium persulfate. The above mixture was incubated at 25 °C in the dark for 14 h, and then diluted with ethanol to a 0.70 value at 734 nm. The soybean extract (0.1 mL) or positive control (Trolox, 0.1 mL) with diverse concentrations was reacted with ABTS solution (0.9 mL) for 5 min in darkness at 25 °C to evaluate the ABTS radical scavenging ability. The absorbance values were measured at 734 nm using a spectrophotometer, and their activities were calculated as the percentage rate by the Equation (1).
The FRAP assay was conducted as previously reported [24]. The FRAP solution was prepared by mixing acetate buffer (300 mM, pH 3.6), TPTZ (10 mM, in 40 mM HCl), and F2Cl3 (20 mM) with a 10:1:1 ratio, and it was then maintained for 15 min at 25 °C. The appropriate dilution of sample extract (0.05 mL) was added to FRAP solution (0.95 mL), and the mixture solution was incubated for 15 min at 37 °C. Thereafter, the absorbance value was read at 593 nm and compared with that of positive control (ascorbic acid).

2.8. Determination of α-Glucosidase Inhibitory Activities

The inhibition capacity against α-glucosidase enzyme was determined by the spectrophotometric method mentioned by Hwang et al. [2] with slight modifications. The 20 μL of 50% methanol extracts of sample or positive control (acarbose) at eight different concentrations (10, 20, 50, 100, 200, 400, 500, and 1000 μg/mL in with 1% DMSO solution) and α-glucosidase solution (2 units/mL, 30 μL, with 0.1 M phosphate buffer pH 7.0) were mixed with 0.1 M potassium phosphate buffer (pH 7.0, 800 μL). After incubating at 37 °C for 10 min in a water bath, p-nitrophenylglucopyranoside (PNP-G, 150 mL, 10 mM) was added to the above mixture. The reaction solution was incubated at 37 °C for 20 min and stopped with 1 M sodium carbonate (650 μL). The combined source was evaluated by monitoring the released product (p-nitrophenol) at 405 nm. The inhibitory ability was expressed as a percentage using the following Equation (2):
α-Glucosidase inhibition (%) = (1 − absorbance of sample/absorbance of the control) × 100

2.9. DNA Damage Protection Rate

To measure the DNA protection capacity in 50% methanol extract of soybeans, the present research was conducted using the method of Lee et al. [5] through metal-catalyzed oxidation DNA cleavage protection. The sample extracts of eight different concentrations (10, 20, 100, 200, 500, 1000, 1500, and 2000 μg/mL) were added to 3.3 mM dithiothreitol (5 μL) and 15.4 μM FeCl3 (5 μL), and then incubated for 2 h at 37 °C. The pUC18 super-coiled plasmid DNA was added to the above reaction solution and kept for 2 h at 37 °C. The sample mixture solution (5 μL) was added to DNA loading buffer (1 μL), and then loaded onto a 0.8% agarose gel of TAE buffer, including 40 mM Tris-acetate and 1 mM EDAT. After electrophoresis (30 min at 85 V), the DNA gel was visualized and photographed under a UV transilluminator by the Gel Doc XR system (Bio-Rad, Hercules, CA, USA). The DNA band imaging and intensity were screened using Image Lab, and the DNA damage inhibition rate was expressed using the following Equation (3):
DNA protection (%) = (SF DNA band intensity/pUC18 plasmid DNA band intensity) × 100

2.10. Statistical Analysis

The isoflavone contents were measured as the mean ± SD of triple measurements. The antioxidant and enzyme inhibition capacities were also measured as the mean ± SD values of three replicates. The results were expressed using statistical analysis software (SAS) 9.2 PC package (SAS Institute Inc. Cary, NC, USA), and the Duncan’s multiple range tests were based on the 0.05 probability level.

3. Results and Discussion

3.1. Comparisons between TPC and TFC in Yellow Soybeans across Three Different Growth Years

The functional value of human-health-promoting agents has been primarily associated with the TPC and TFC rates in foods, crops, and natural plants [24,25,26]. These two characteristics have received considerable interest from the food and pharmaceutical industries because of their beneficial properties [13,24,26]. In the preliminary tests, the 50% methanol extracts of soybeans showed high isoflavone contents and strong antioxidant effects in comparison with other solvent systems (EtOAc, EtOH, CH3CN, MeOH, and MeOH-water mixtures: 10%, 30%, 70%, and 90%). Based on the above considerations, the current work was designed to compare isoflavone contents and bioactive functions in 50% methanol extracts of various soybeans. As presented in Figure 1, the TPC and TFC ratios varied between cultivars and growth years. In TPC analysis, the Daepung cultivar exhibited the highest average value, with 7.20 GAE mg/g over three growth years, and the rank order of the remaining cultivars was as follows: Neulchan (5.46 GAE mg/g) > Daewon (5.37 GAE mg/g) > Taekwang (5.00 GAE mg/g) > Saedanbaek (4.98 GAE mg/g). The TPC in the five cultivars over three years was recorded in the following order: Daepung (2019; 7.31 → 2020; 6.78 → 2021; 7.52 GAE mg/g) > Neulchan (5.66 → 5.56 → 5.15 GAE mg/g) > Daewon (5.20 → 5.76 → 5.16 GAE mg/g) > Taekwang (5.25 → 4.96 → 4.78 GAE mg/g) > Saedanbaek (4.87 → 5.34 → 4.73 GAE mg/g) (Figure 1A). Although the average contents showed slight differences in cultivars other than Daepung, the individual content considerably differed between cultivars and growth years (Figure 1A). Generally, phenolic compounds are recognized as important minor components of various edible plants [10,11,26,27]. It is also well known that the phenolic metabolites in soybeans were found to be functional substances like isoflavones and phenolics [2,20,22]. Therefore, the above observations may be primarily correlated with isoflavone and other phenolic contents in yellow soybeans across growth times. In other words, their values may be positively dependent on environmental parameters, including growth states and genetics, as compared with earlier data of other natural sources [11,27,28]. Our results are similar to those of the previously reported data [6,20,22].
We examined TFC values in the 50% methanol extracts to investigate the effect of other phenolic contents on the functional characteristics of soybeans (Figure 1B). Daepung had the highest average TFC value (0.55 RE mg/g) over three years, whereas Saedanbaek exhibited the lowest ratio with 0.31 RE mg/g. These results are consistent with those of TPC. Other soybeans showed slight differences in each cultivar, including Daewon (0.38 RE mg/g) > Neulchan (0.36 RE mg/g) > Taekwang (0.35 RE mg/g). Most of the remaining cultivars except for Daepung exhibited mild average contents in the range of 0.31–0.38 RE mg/g, and the individual cultivar showed no significant differences in growth years (2019 → 2021): Saedanbaek; 0.30 → 0.34 → 0.28 RE mg/g, Daewon; 0.36 → 0.42 → 0.37 RE mg/g, Daepung; 0.57 → 0.49 → 0.58 RE mg/g, Neulchan; 0.39 → 0.36 → 0.34 RE mg/g, Taekwang; 0.37 → 0.35 → 0.32 RE mg/g. Although the phenolic contents of edible beans, barley cultivars, and palm trees have shown remarkable differences according to the environmental conditions of growth states [11,27,28], the yellow soybeans across growth times displayed slight variations in TFC factor. Our results indicate that the flavonoid contents in soybeans may not be positively connected with cultivars through growth years. Considering the TPC and TFC patterns, we confirmed that the Daepung cultivar may be of value in developing of new cultivars and nutraceutical sources when compared with other cultivars.

3.2. Comparison of Fatty Acid Contents in Yellow Soybeans across Three Different Growth Years

Soybean fatty acid has been recognized as an excellent nutritional constituent owing to its human dietary and industrial properties [5,8,28,29]. Nevertheless, only a few reports are available on the comparison and evaluation of fatty acid profiles and contents in various soybeans across growth years. Therefore, in developing good soybean cultivars for beneficial dietary supplements, we evaluated fatty acid contents, including five saturated and eight unsaturated components, in five cultivars across three years. The fatty acid compositions and their contents are shown in Table 1. Among them, palmitic acid (C16:0) in saturated fatty acids as well as linoleic acid (C18:2n6c) and oleic acid (C18:1n9c) in unsaturated fatty acids showed high average contents, accounting for 8.7, 38.7, and 16.6 mg/g, respectively. In particular, the highest average content was observed for linoleic acid, with 38.7 mg/g, and other fatty acids showed considerable differences in the following increasing order: oleic acid (16.6 mg/g) > palmitic acid (8.7 mg/g) > α-linolenic acid (5.9 mg/g) > stearic acid (2.7 mg/g) (Table 1). Their ratios were approximately 52.5, 22.5, 11.8, 8.0, and 3.7% of the total average content (73.7 mg/g). For the remaining derivatives, low contents were detected within a range of 0.1–0.2 mg/g. In summary, the average saturated fatty acids (26.3%) showed remarkably lower contents, compared to those of unsaturated compositions (83.7%). The individual and total fatty acids for the 2019 crop year displayed higher contents than those of the harvested soybeans from the 2020 and 2021 growth years, and their relative ratios decreased significantly with growth years: 83.1–110.5 mg/g (2019) > 46.5–83.8 mg/g (2020) > 49.7–57.1 mg/g (2021). In particular, linoleic acid, which is the most abundant component, consistently decreased in all cultivars over three years: 42.7 → 30.1 → 24.9 mg/g (Saedanbaek), 54.6 → 45.0 → 25.1 mg/g (Daewon), 101.5 → 83.8 → 57.1 mg/g (Daepung), 110.5 → 78.6 → 54.2 mg/g (Neulchan), and 96.9 → 46.5 → 53.5 mg/g (Taekwang) (Table 1). Moreover, the total fatty acid contents in each cultivar showed a decreasing pattern with the progression of growth years (2019 → 2021): Saedanbaek (83.1 → 55.4 → 49.7 mg/g), Daewon (96.8 → 78.2 → 54.5 mg/g), Daepung (101.5 → 83.8 → 57.1 mg/g), Neulchan (110.5 → 78.6 → 54.2 mg/g), and Taekwang (96.9 → 46.5 → 53.5 mg/g) (Figure S1 in supplementary data). This phenomenon suggests that the main component (linoleic acid) in soybean fatty acids may be positively influenced by climatic (temperature, light, and rainfall) and genetic differences, as has been suggested in previous research data on harvest times, ecoregions, and cultivars of soybeans [5,30]. Furthermore, this constituent may be correlated with oil ratios through oxidation and lipolysis with regard to the cell membranes of the soybean plant during growth [29,31]. The present results were consistent with those of previous research reporting on the distribution of fatty acids in fermented and stored soybeans [13]. Overall, the fatty acid compositions exhibited considerable differences across growth years when comparing soybean cultivars, and their contents showed similar patterns in all cultivars. These findings indicate that the accumulation of fatty acids in soybeans may be primarily influenced by environmental parameters of growth conditions rather than genetics [13,20]. The linoleic acid content of fatty acids can be an important factor in evaluating soybean quality, and the Daepung cultivar may be considered an excellent source for soy-based food products because of its high fatty acid content.

3.3. Comparison of Amino Acid Contents in Yellow Soybeans across Three Different Growth Years

Amino acids are considered as important food ingredients due to their human health benefits and are related to environmental conditions [2,15,17,18,19]. Although earlier studies exhibited variations of metabolite contents in soybeans, little data have been evaluated on the quantification and comparison of amino acid concentrations across growth years. Thus, we investigated amino acid contents, including nine non-essential and eight essential compositions, in five soybeans across three years. As illustrated in Table 2, non-essential amino acids exhibited higher average contents (196.1 mg/100 g) than essential amino acids (124.9 mg/100 g). Among the diverse components, glutamic acid had the most abundant average amount with 59.9 mg/100 g, followed by aspartic acid (36.4 mg/100 g) > leucine (26.6 mg/100 g) > arginine (25.3 mg/100 g) > lysine (20.2 mg/100 g) (Table 2). In other words, the glutamic acid and aspartic acid showed high amounts (Glu: 18.7% and Asp: 11.4%), representing approximately 30% of the total average content (321.0 mg/100 g). The remaining compositions were found to exhibit a low average content in the range of 3.8–17.8 mg/100 g compared with those of the above-mentioned two components. Our results were similar to previous data showing that the individual and total amino acid contents in soybeans differed considerably across diverse food processing techniques [2,18,19]. In each growth year, individual and total amino acids exhibited considerable changes; specifically, the glutamic acid composition (2021 growth year) showed the highest contents of 90.0, 81.8, 113.3, 85.4, and 87.8 mg/100 g in comparison with other components (Table 2). Moreover, all soybeans in the 2021 growth year displayed approximately two-fold higher amino acids than the results reported for the 2019 and 2020 growth years (Figure S2 in supplementary data). In particular, six amino acids showed high variation ratios in the following order: Glu > Asp > Leu > Arg > Lys > Ser. These observations may be positively related to the conversion and biosynthesis of metabolites through environmental characteristics of the soybean plant that vary across growth times [3,18,19]. As for soybean cultivars and growth years, the distributions of amino acids exhibited similar content degrees: Saedanbaek (269.8–469.4 mg/100 g), Daewon (228.2–428.0 mg/100 g), Daepung (239.2–581.0 mg/100 g), Neulchan (227.9–443.0 mg/100 g), and Taekwang (195.3–451.5 mg/100 g) (Table 2). Furthermore, the Daepung cultivar had the highest average amino acid (353.8 mg/100 g) when harvested over three years (2019, 241.3; 2020, 239.2; and 2021, 581.0 mg/100 g), and other cultivars occurred in the following order: Saedanbaek (348.4 mg/100 g) > Neulchan (308.8 mg/100 g) > Daewon (303.1 mg/100 g) > Taekwang (290.9 mg/100 g) (Table 2). Our findings showed similar patterns as the earlier data, indicating that the amino acid content of edible bean, meat, soybean, and palm tree exhibited high changes under different environmental parameters [11,15,19,28]. Based on the above results, the Daepung source may be recommended as an excellent material in developing new cultivars and nutraceutical foods because of its high amino acid content.

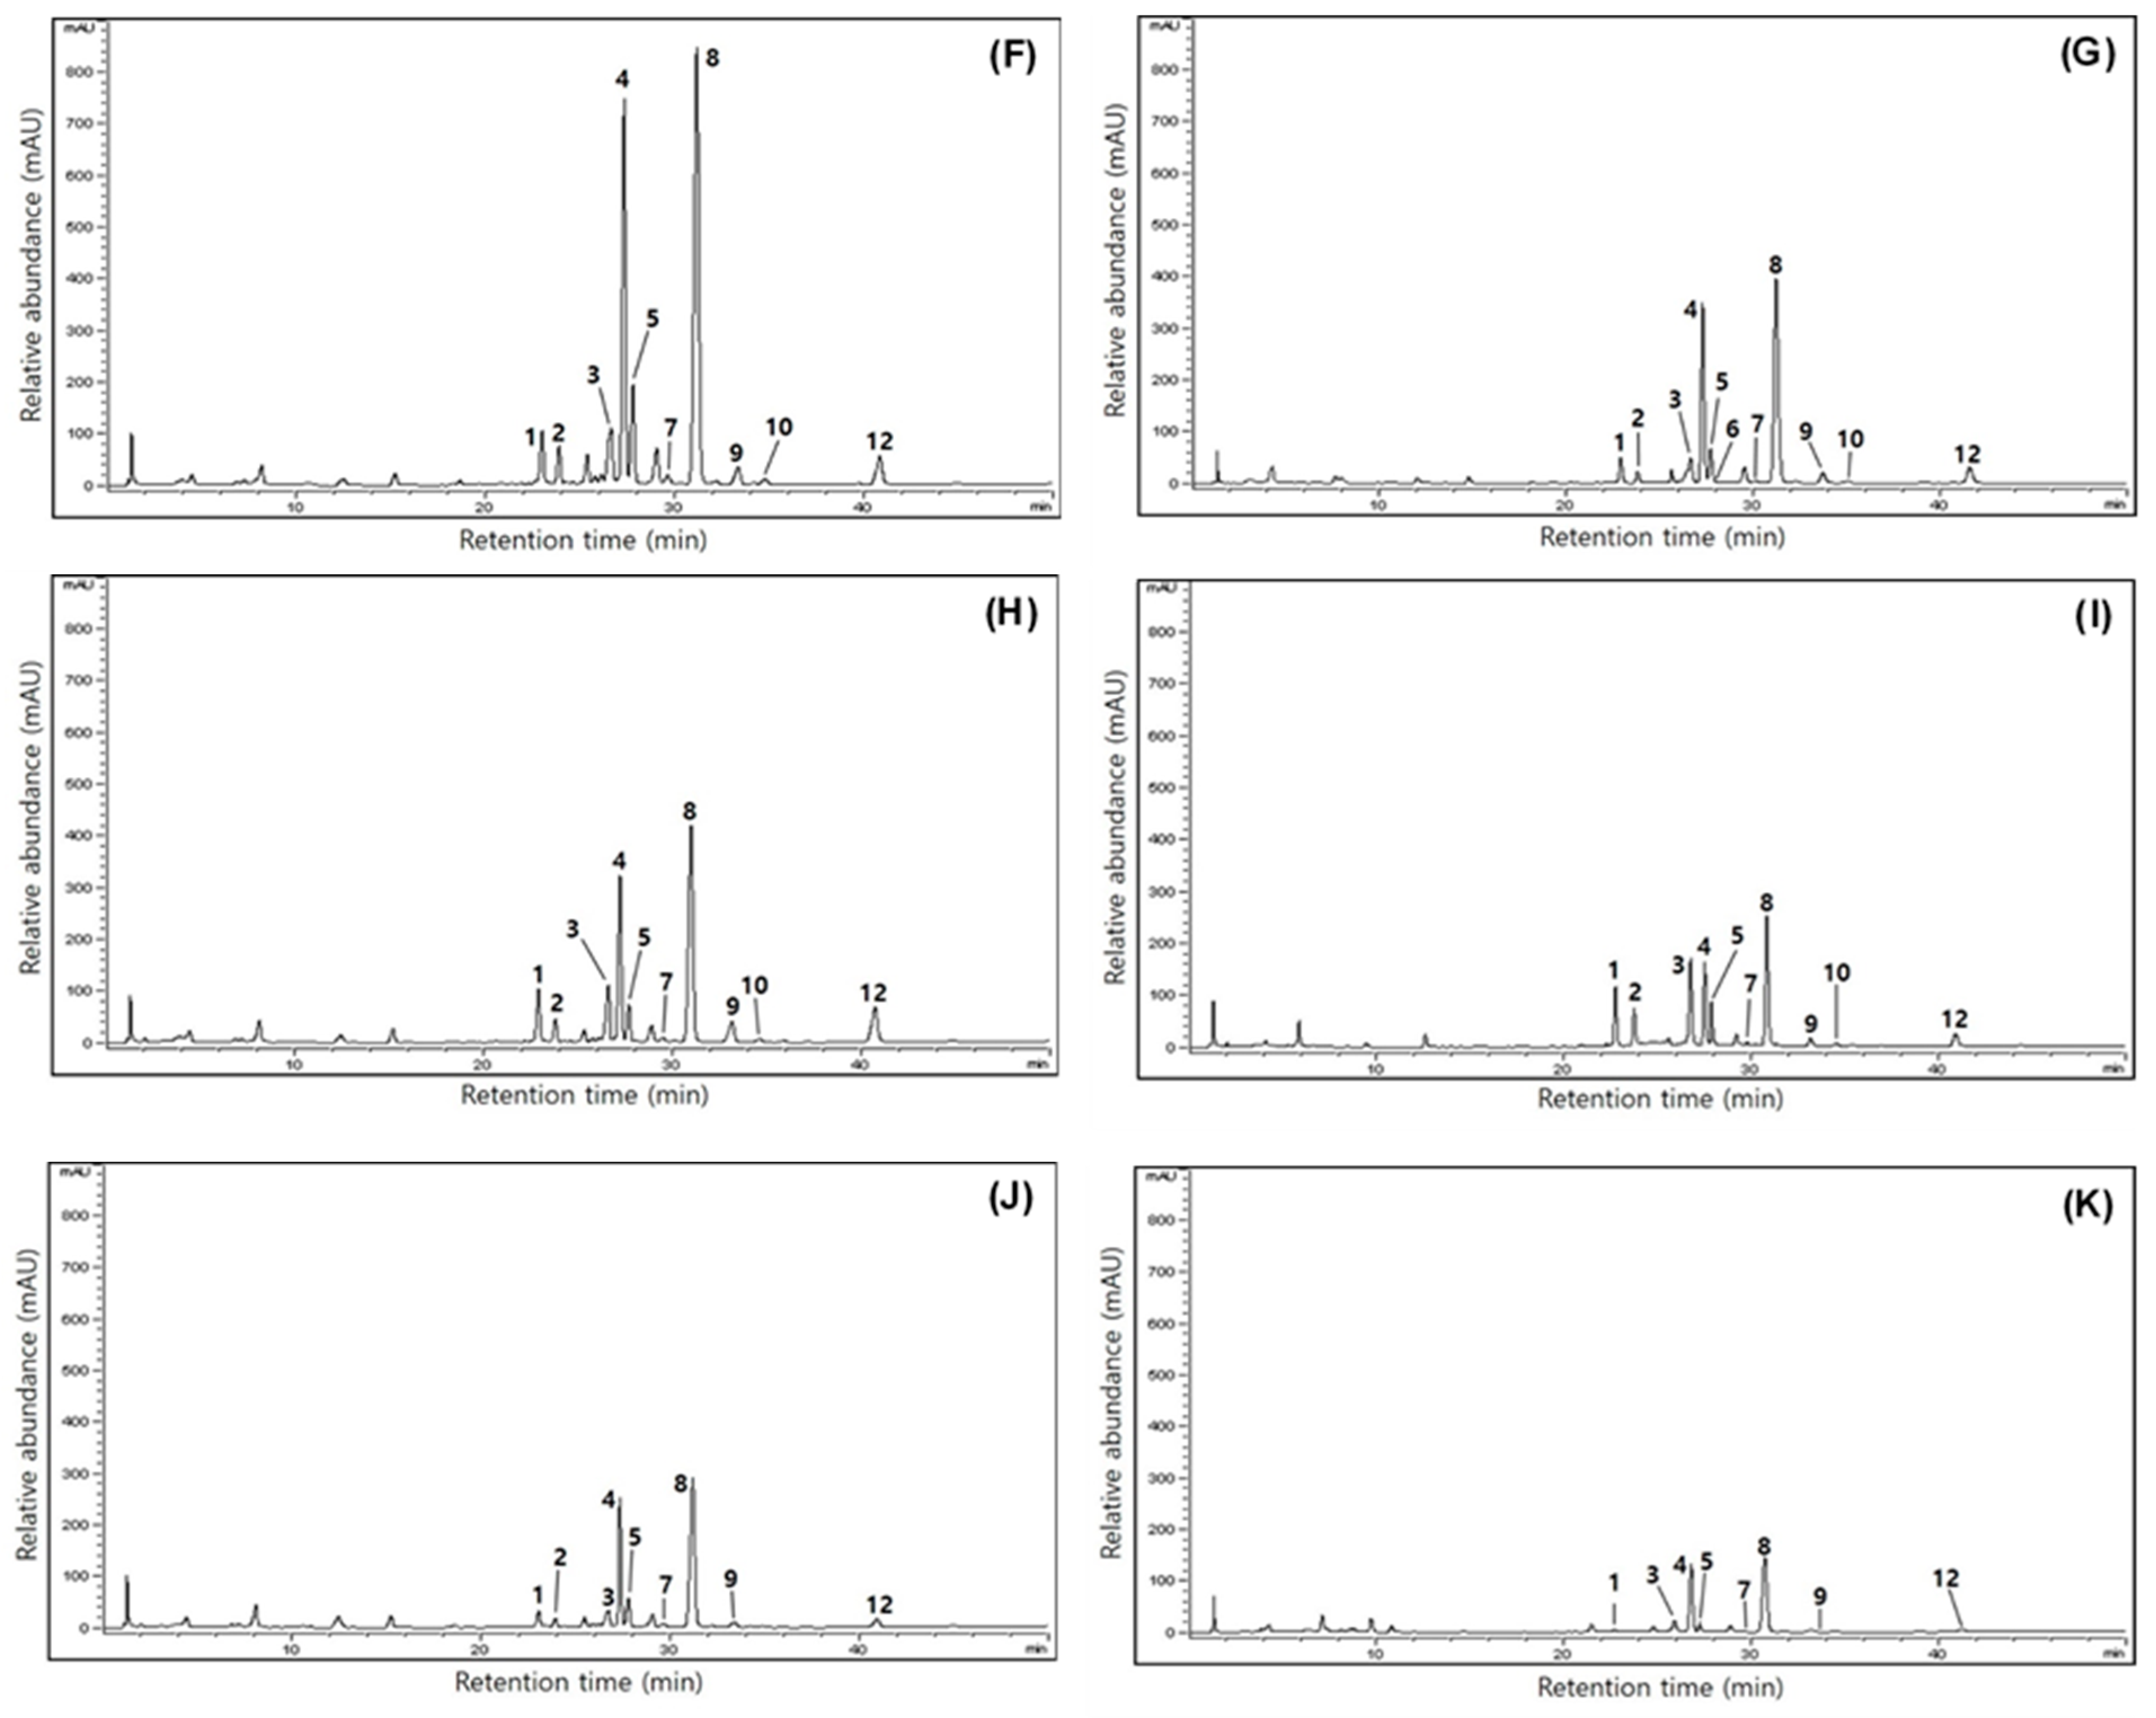
3.4. Comparison of Isoflavone Contents in Yellow Soybeans across Three Different Growth Years

Although soybeans have various secondary metabolites, we measured the isoflavone content in the current research because of its important contribution to human health and the development of new cultivars [2,14,32,33]. As indicated in Figure 2, the representative HPLC chromatogram of isoflavone derivatives was produced within 42 min at 254 nm with a slight modification of previously published data [5,13], and their contents were evaluated from each peak area by HPLC analysis. The retention times of 12 isoflavones were in the following order: peak 1 (23.1 min, daidzin), peak 2 (23.9 min, glycitin), peak 3 (26.6 min, genistin), peak 4 (27.7 min, malonyldaidzin), peak 5 (27.9 min, malonylglycitin), peak 6 (28.1 min, acetyldaidzin), peak 7 (29.5 min, acetylglycitin), peak 8 (31.4 min, malonylgenistin), peak 9 (33.7 min, daidzein), peak 10 (34.8 min, glycitein), peak 11 (37.7 min, acetylgenistin), and peak 12 (40.8 min, genistein) (Figure 2A). The isoflavone patterns and contents in the 50% methanol extract of five soybean cultivars over three years are presented in Table 3. The average isoflavone contents showed significant differences across cultivars and growth years.
The highest average content (4048.2 μg/g) was observed in Daepung, whereas the lowest isoflavone (1549.4 μg/g) was detected in the Saedanbaek cultivar. Other cultivars exhibited the following order: Neulchan (2838.3 μg/g) > Daewon (2458.8 μg/g) > Taekwang (1563.8 μg/g). In addition, individual and total isoflavones differed considerably across cultivars and growth years. The most abundant average isoflavone was malonylgenistin, followed by malonyldaidzin, glycitin, malonylglycitin, daidzin, and genistin, accounting for 992.6, 712.4, 194. 5, 179.5, 170.7, and 154.4 μg/g, respectively. Other isoflavones accounted for approximately ˂50 μg/g. In the four isoflavone groups (Figure 2A), the malonylglucoside form was the predominant type (1884.4 μg/g), representing about 76% of the total average isoflavones (2495.9 μg/g), followed by glucoside (519.5 μg/g; 20.8%) > aglycone (87.2 μg/g; 3.5%) > acetylglucoside (4.8 μg/g; 0.2%) (Table 3). Commonly, the distribution of soybean isoflavone groups showed the most abundant ratio in malonylglucosides, with approximately 70–80%, followed by glucosides at 25%, acetylglucosides at 5%, and aglycones at 2%, and the main components were daidzin, malonyldaidzin, genistin, and malonylgenistin [13,34]. According to the present data and earlier results, soybean isoflavone profiles and concentrations differ considerably between each other. These measures may be affected by genetic diversity and variation of the phenylpropanoid pathway through environmental factors (soil, climate, cultivation skill, region, temperature, light, moisture, etc.) during growth periods [1,5,11,30,34]. Furthermore, we hypothesize that isoflavone accumulation is correlated with the rate of chalcone and isoflavone synthase in the phenylpropanoid pathway as well as cellular division and biosynthesis during the growth of soybean plant [11,35]. Over three years, the total isoflavone contents were measured in the wide ranges of 1342.6–4181.0 μg/g (2019), 1440.2–3515.5 μg/g (2020), and 1128.9–4448.0 μg/g (2021), and the five cultivars showed significant differences in individual and total isoflavone contents (Table 3). Specifically, the highest and lowest isoflavones are presented in Figure 2, and their concentrations were as follows: Saedanbaek: 1972.8 μg/g in 2020 (Figure 2B), 1332.9 μg/g in 2021 (Figure 2C); Daewon: 3077.8 μg/g in 2020 (Figure 2D), 1969.8 μg/g in 2019 (Figure 2E); Daepung: 4448.0 μg/g in 2021 (Figure 2F), 3515.5 μg/g in 2020 (Figure 2G); Neulchan: 3269.8 μg/g in 2019 (Figure 2H), 2513.2 μg/g in 2021 (Figure 2I); Taekwang: 2122.2 μg/g in 2019 (Figure 2J), 1128.9 μg/g in 2021 (Figure 2K).
In the 2019 growth year, the highest isoflavone content was detected in Daepung (4181.0 μg/g), and the Neuchan cultivar showed the second highest content (3269.8 μg/g). The remaining sources were found to have low isoflavone contents of ˂2200 μg/g: Taekwang (2122.2 μg/g) > Daewon (1969.8 μg/g) > Saedanbaek (1342.6 μg/g). Malonylgenistin was the predominant component, with a range of 455.8–1408.9 μg/g (Figure S3 in supplementary data), and other compositions were as follows: genistin (78.8–500.1 μg/g) > glycitin (88.7–449.7 μg/g) > daidzin (73.6–470.0 μg/g) > malonylglycitin (105.0–272.6 μg/g), and acetylgenistin had the lowest content (nd: not detected). Based on the observation results for 2019, five cultivars in the 2020 and 2021 years also showed remarkable differences in individual and total isoflavone contents. The Daepung cultivar showed abundant isoflavones accounting for 3515.5 (2020) and 4448.0 μg/g (2021), and the malonylgenistin content exhibited the highest ratios with ranges of 632.1–1572.69 (2020) and 619.5–1778.9 μg/g (2021) (Figure 2F,G). In addition, the Taekwang cultivar showed the lowest isoflavone contents of 1440.2 and 1128.9 μg/g in the 2020 and 2021 growth years, and other soybeans showed considerable differences when compared with those of 2019. Therefore, individual and total isoflavones in soybeans exhibited remarkable differences based on the cultivars and growth years. These distribution patterns may be influenced by the genetics and environmental states during the growth of soybeans, as reported in earlier studies [5,11,25,27,30]. Although many studies have examined soybean isoflavones, the present study compared and quantified for the first time the individual and total isoflavone contents in yellow soybeans across different growth years. As evidenced by the above exploration, we can confirm that Daepung may be an excellent source to develop better soybeans and functional foods because of its high isoflavone ratios. Moreover, the isoflavone profile and content may be an important and valuable factor in evaluating soybean quality. Our findings may contribute to the enhancement of information regarding the breeding and human-health-related benefits of soybeans.

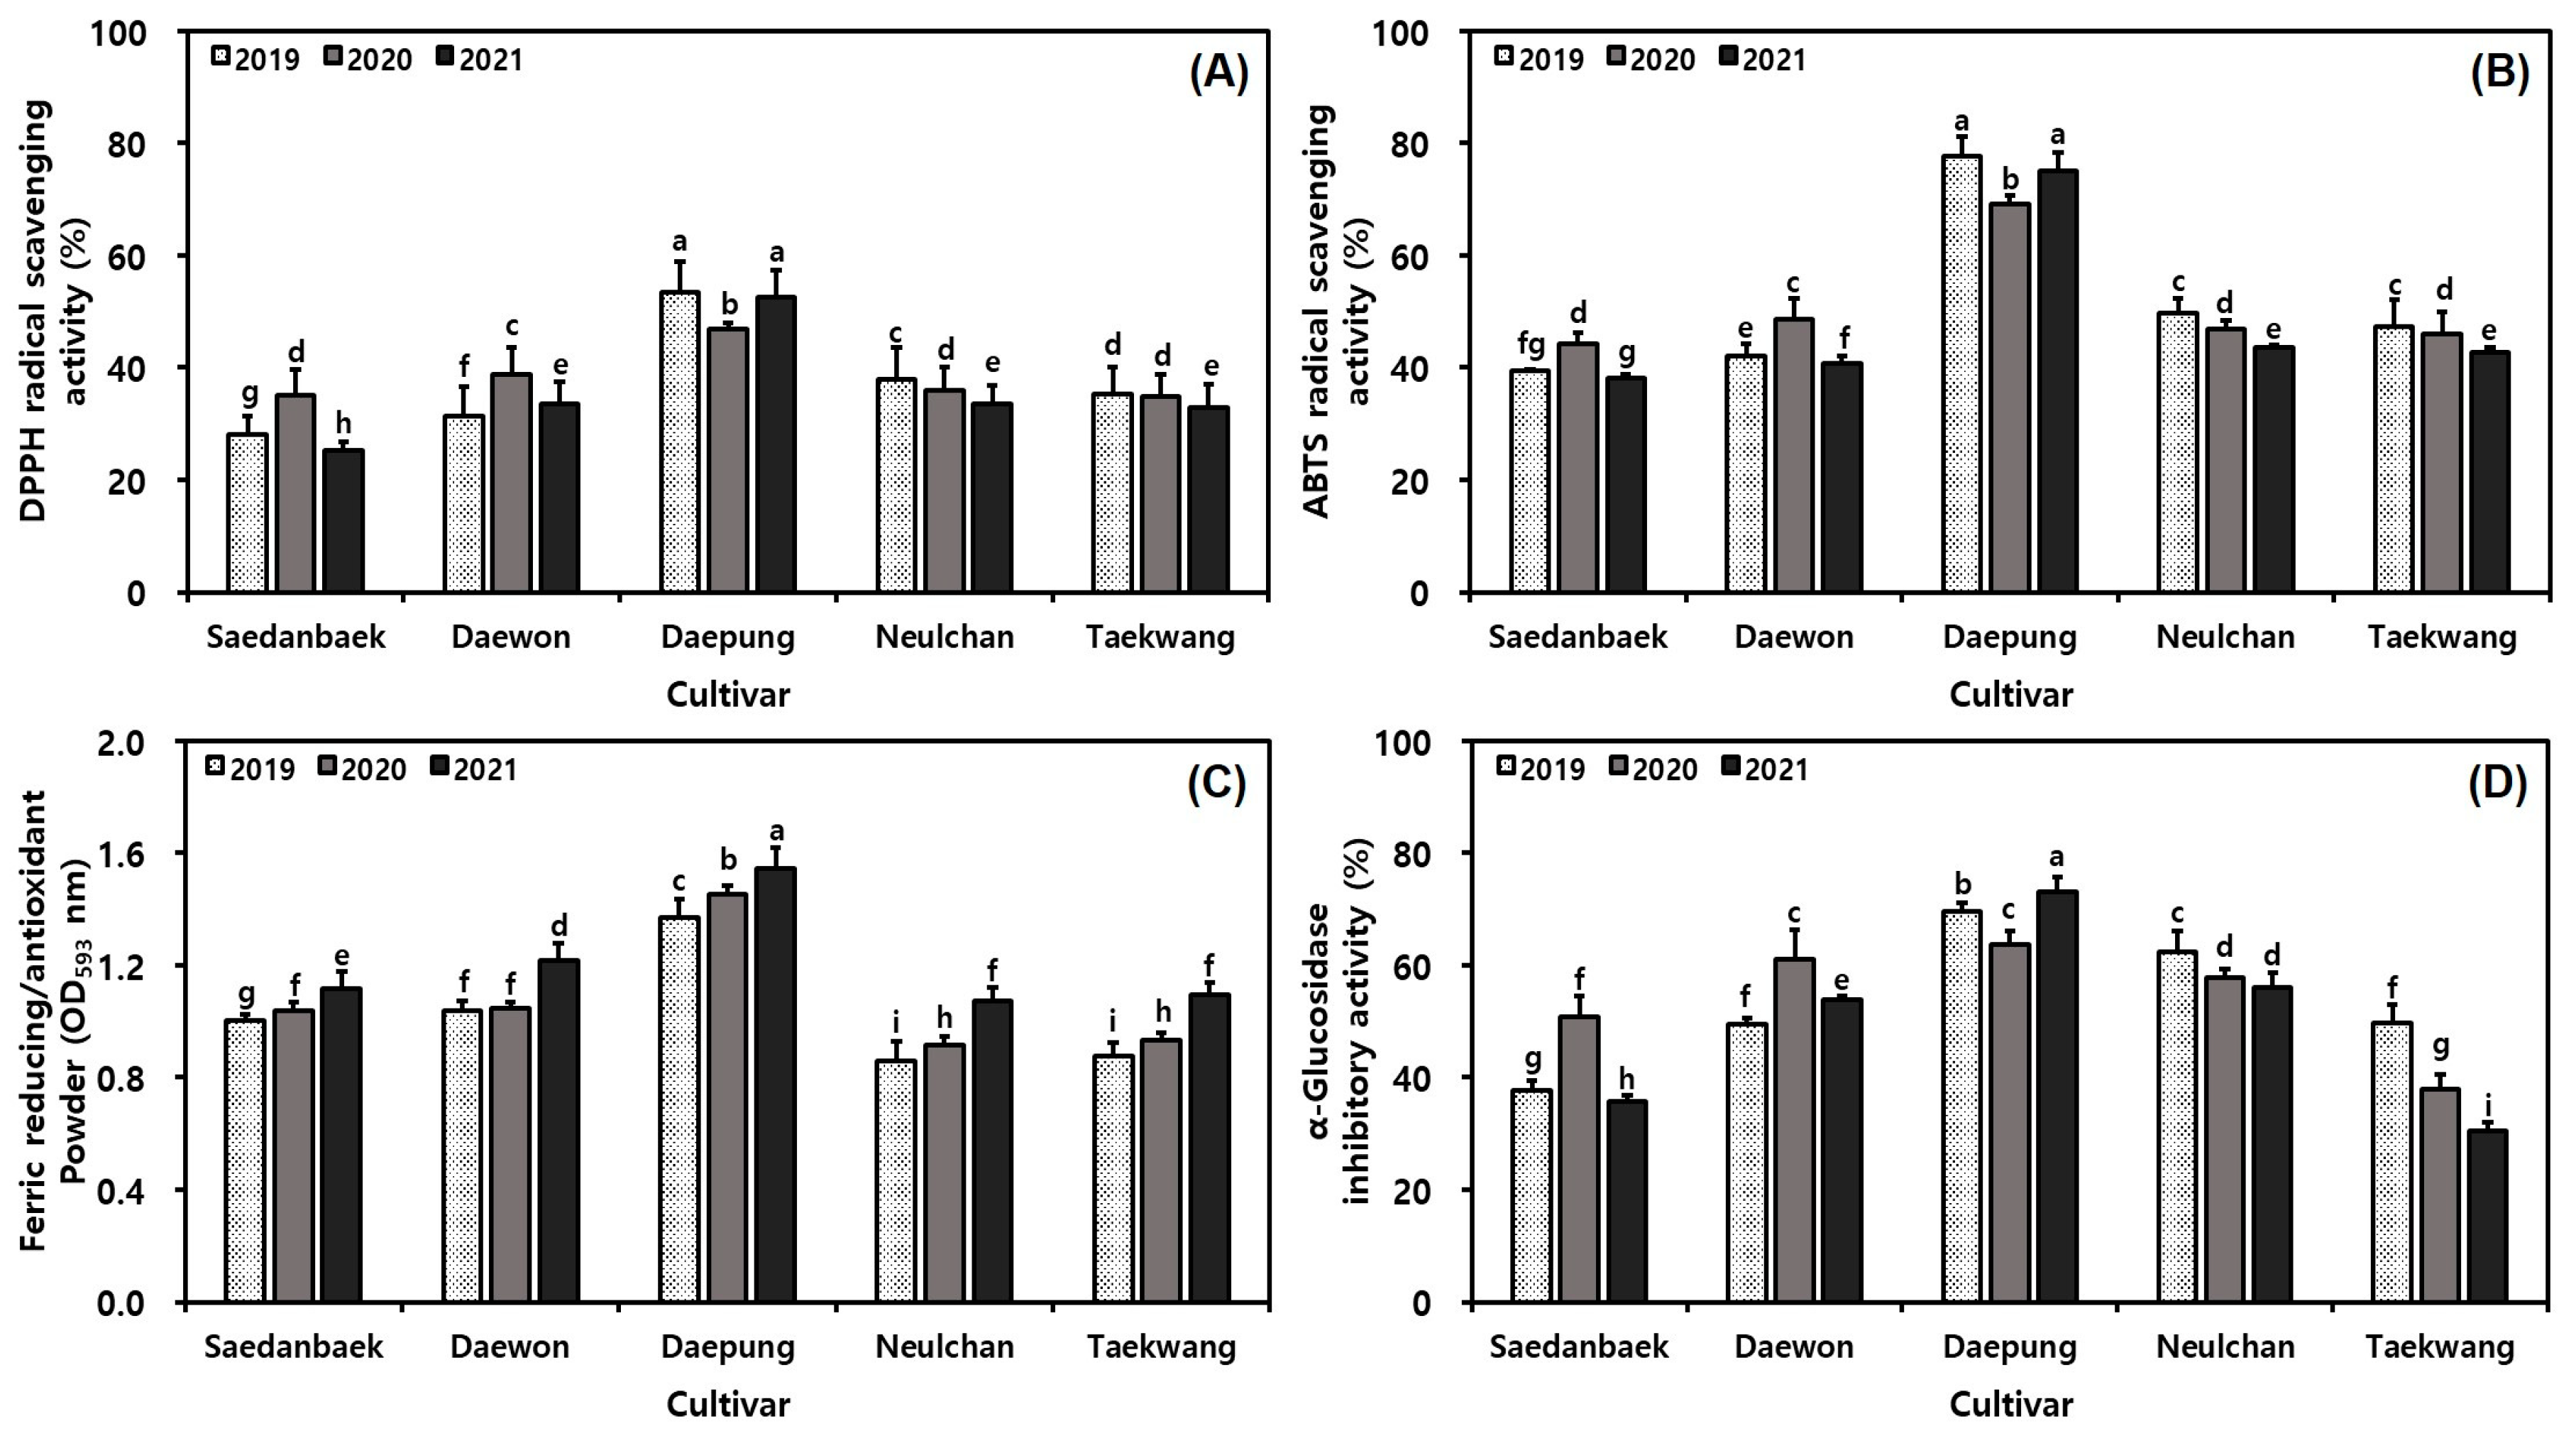
3.5. Variation of Antioxidant Capacities in Yellow Soybeans over Three Different Growth Years

Several studies have examined the biofunction of soybeans based on the human health effects using various techniques [2,6,10,14]. Many researchers have also widely used in vitro skills such as radical scavenging and FRAP for screening antioxidants in edible plants and foods because of their simple quality control and reproducibility using spectrophotometry [2,5,11,22,32]. However, to the best of our knowledge, little is known about the comparison of antioxidant ratios with useful information on breeding and food industry aspects in soybeans over different growth years. Therefore, we investigated the fluctuations of antioxidant properties using the FRAP technique and scavenging activities against DPPH and ABTS radicals from five yellow soybean cultivars at three years. First, the radical scavenging abilities were measured by the percentage ratios through the inhibition of radical formation from soybean extract (50% methanol) and positive control. Based on the preceding experiments (cv. Daepung, 2019 year), their scavenging effects increase with the increase of concentrations (100, 200, 500, 1000, and 2000 μg/mL). Although the soybean extracts of 1000 and 2000 μg/mL showed 100% radical scavenging ratios, this research was carried out at 500 μg/mL due to dose-dependent variations related to scavenging effects. As shown in Figure 3A, the scavenging abilities against DPPH radical varied considerably in the ranges of 28.2–35.0% (Saedanbaek), 31.4–38.7% (Daewon), 46.9–53.5% (Daepung), 33.7–38.0% (Neulchan), and 32.9–35.2% (Taekwang) over three years. In particular, the highest average scavenging effect against this radical accounted for 51.0% in Daepung (500 μg/mL extracts over three years), while Saedanbaek exhibited the lowest activity (29.5%). The remaining cultivars displayed slight differences in average inhibitions: Neulchan (35.9%) > Daewon (34.6%) > Taekwang (34.3%) (Figure 3A). In other words, the DPPH radical scavenging abilities did not show significant differences except for Daepung. These phenomena may be explained by various secondary metabolite portions, including phenolic and isoflavone contents in soybeans [6,11,27,34]. The above results may be positively attributed to the TPC and TFC degrees in the 50% methanol extracts of soybeans, as previously described [21,22,26]. Even though all soybean extracts exhibited low DPPH radical scavenging capacities by comparing the positive control (BHT, 76% at 500 μg/mL), the present data may provide important information on the potential application of soybeans for the development of nutraceutical agents. In the ABTS radical assay, all extracts had higher scavenging inhibitions than those of the DPPH radical (Figure 3B). Other cultivars exhibited mild differences across growth years (2019 → 2021) in the following order:
In other words, the average ABTS radical scavenging ability in yellow soybeans over three years were ranked as follows: Daepung (74.0%) > Neulchan (46.7%) > Taekwang (45.3%) > Daewon (43.8%) > Saedanbaek (40.6%). The Trolox ability (89.5% at 500 μg/mL) of the positive control also exhibited a higher scavenging capacity than all soybean extracts [13]. Moreover, our data reveal that all soybean cultivars over three years exhibited approximately 10–20% higher average ABTS radical scavenging effects by comparing the percentage inhibitions on DPPH. From the above results, the ABTS scavenging activities may be correlated with the hydrogen donating and chain breaking properties of various metabolites in soybean extracts, based on comparison of the hydrogen donating ratios of the DPPH radical, as indicated in earlier research [20,36]. Furthermore, our data indicate that the metabolite profiles and accumulations (phenolics, isoflavones, pterocarpan, etc.) in soybean extracts may be responsible for the main portion of the radical scavenging capacities such as DPPH and ABTS [6,32,34,37]. To obtain more antioxidant information on soybeans, we investigated the FRAP values to reduce Fe+3 to Fe+2 [38]. The FRAP values displayed similar patterns to those of the radical scavenging capacities and exhibited diverse changes between cultivars and growth years within the ranges of 1.00–1.12 (Saedanbaek), 1.04–1.22 (Daewon), 1.37–1.54 (Daepung), 0.86–1.08 (Neulchan), and 0.88–1.10 OD593 nm (Taekwang) (Figure 3C). The average FRAP abilities showed the highest values in Daepung with 1.45 OD593 nm, and other cultivars exhibited similar tendencies in decreasing order: Daewon (1.10 OD593 nm) > Saedanbaek (1.05 OD593 nm) > Taekwang (0.97 OD593 nm) > Neulchan (0.95 OD593 nm) (Figure 3C). These data indicated mildly increased rates in accordance with the growth years, but significant differences were not observed in each cultivar (Figure 3C). Although the FRAP results did not detect remarkable differences in cultivars and growth years, their properties may be correlated with the secondary metabolites (isoflavone, phenolic, and other phytochemical derivatives) in soybeans and various environmental parameters (soil, climate, agricultural practice, etc.) during growth [5,11,25,34]. As mentioned above, the Daepung cultivar may be a potential source to develop better soybean cultivars and functional food agents because of its strong antioxidant properties.

3.6. Variation of α-Glucosidase Inhibitory Abilities in Yellow Soybeans over Three Different Growth Years

Although recent studies have documented that soybean extracts play an excellent role in α-glucosidase inhibition [2,10,13,39], no reports on the variations of inhibitory capacities against this enzyme in various yellow soybeans have been found. The potential application of α-glucosidase inhibition functions for the development of new excellent soybean cultivars and human health food sources has also not been extensively investigated. In these respects, we examined the α-glucosidase inhibitory effects in diverse soybeans over three years and measured these effects by comparing the percentage inhibition with the positive control (acarbose). On the basis of the preliminary experiments and antioxidant results, we evaluated the α-glucosidase inhibition in the 50% methanol extracts of soybeans at a concentration of 500 μg/mL. As shown in Figure 3D, the inhibition ratio of this enzyme exhibited considerable differences in cultivars of different growth years. The highest average inhibitory capacity was detected in Daepung, with 68.8%, and other cultivars showed results in the following order: Neulchan (58.7%) > Daewon (54.9%) > Saedanbaek (41.4%) > Taekwang (39.4%) (Figure 3D). In particular, the absolutely dominant α-glucosidase inhibitory activities in Daepung cultivar ranged from 69.5% to 73.1% (2019, 69.5%; 2020, 63.8%; and 2021, 73.1%). Other soybeans exhibited significant differences over three years (2019 → 2021): Neulchan (62.4 → 57.7 → 56.1%) > Daewon (49.6 → 61.7 → 53.9%) > Saedanbaek (37.6 → 50.9 → 35.8%) > Taekwang (49.7 → 38.0 → 30.4%) (Figure 3D). These findings may be remarkably influenced by the isoflavone contents, as observed in previous studies [2,32,39]. The minor phenolic phytochemicals (phenolic acid, flavonoid, and pterocarpan) in soybean extracts may also be associated with the main portion of the α-glucosidase inhibition [10,40]. In particular, these investigations are similar to reported results on antioxidant, TPC, and TFC patterns. Therefore, we believe that the inhibitory activities against α-glucosidase may be positively related to the phenolic profile and accumulation in soybeans [2,10,40]. Although the 50% methanol extracts of soybeans exhibited lower inhibitory abilities than the positive control (78.6% at 500 μg/mL), the Daepung cultivar and its soy product may be considered as alternative natural supplements due to their nutraceutical and functional uses compared with those of other soybeans. Our present data confirmed that the Daepung source may be utilized for the development of new materials in regard to breeding aspects because of its high isoflavone contents as well as predominant α-glucosidase inhibitory and antioxidant capacities.

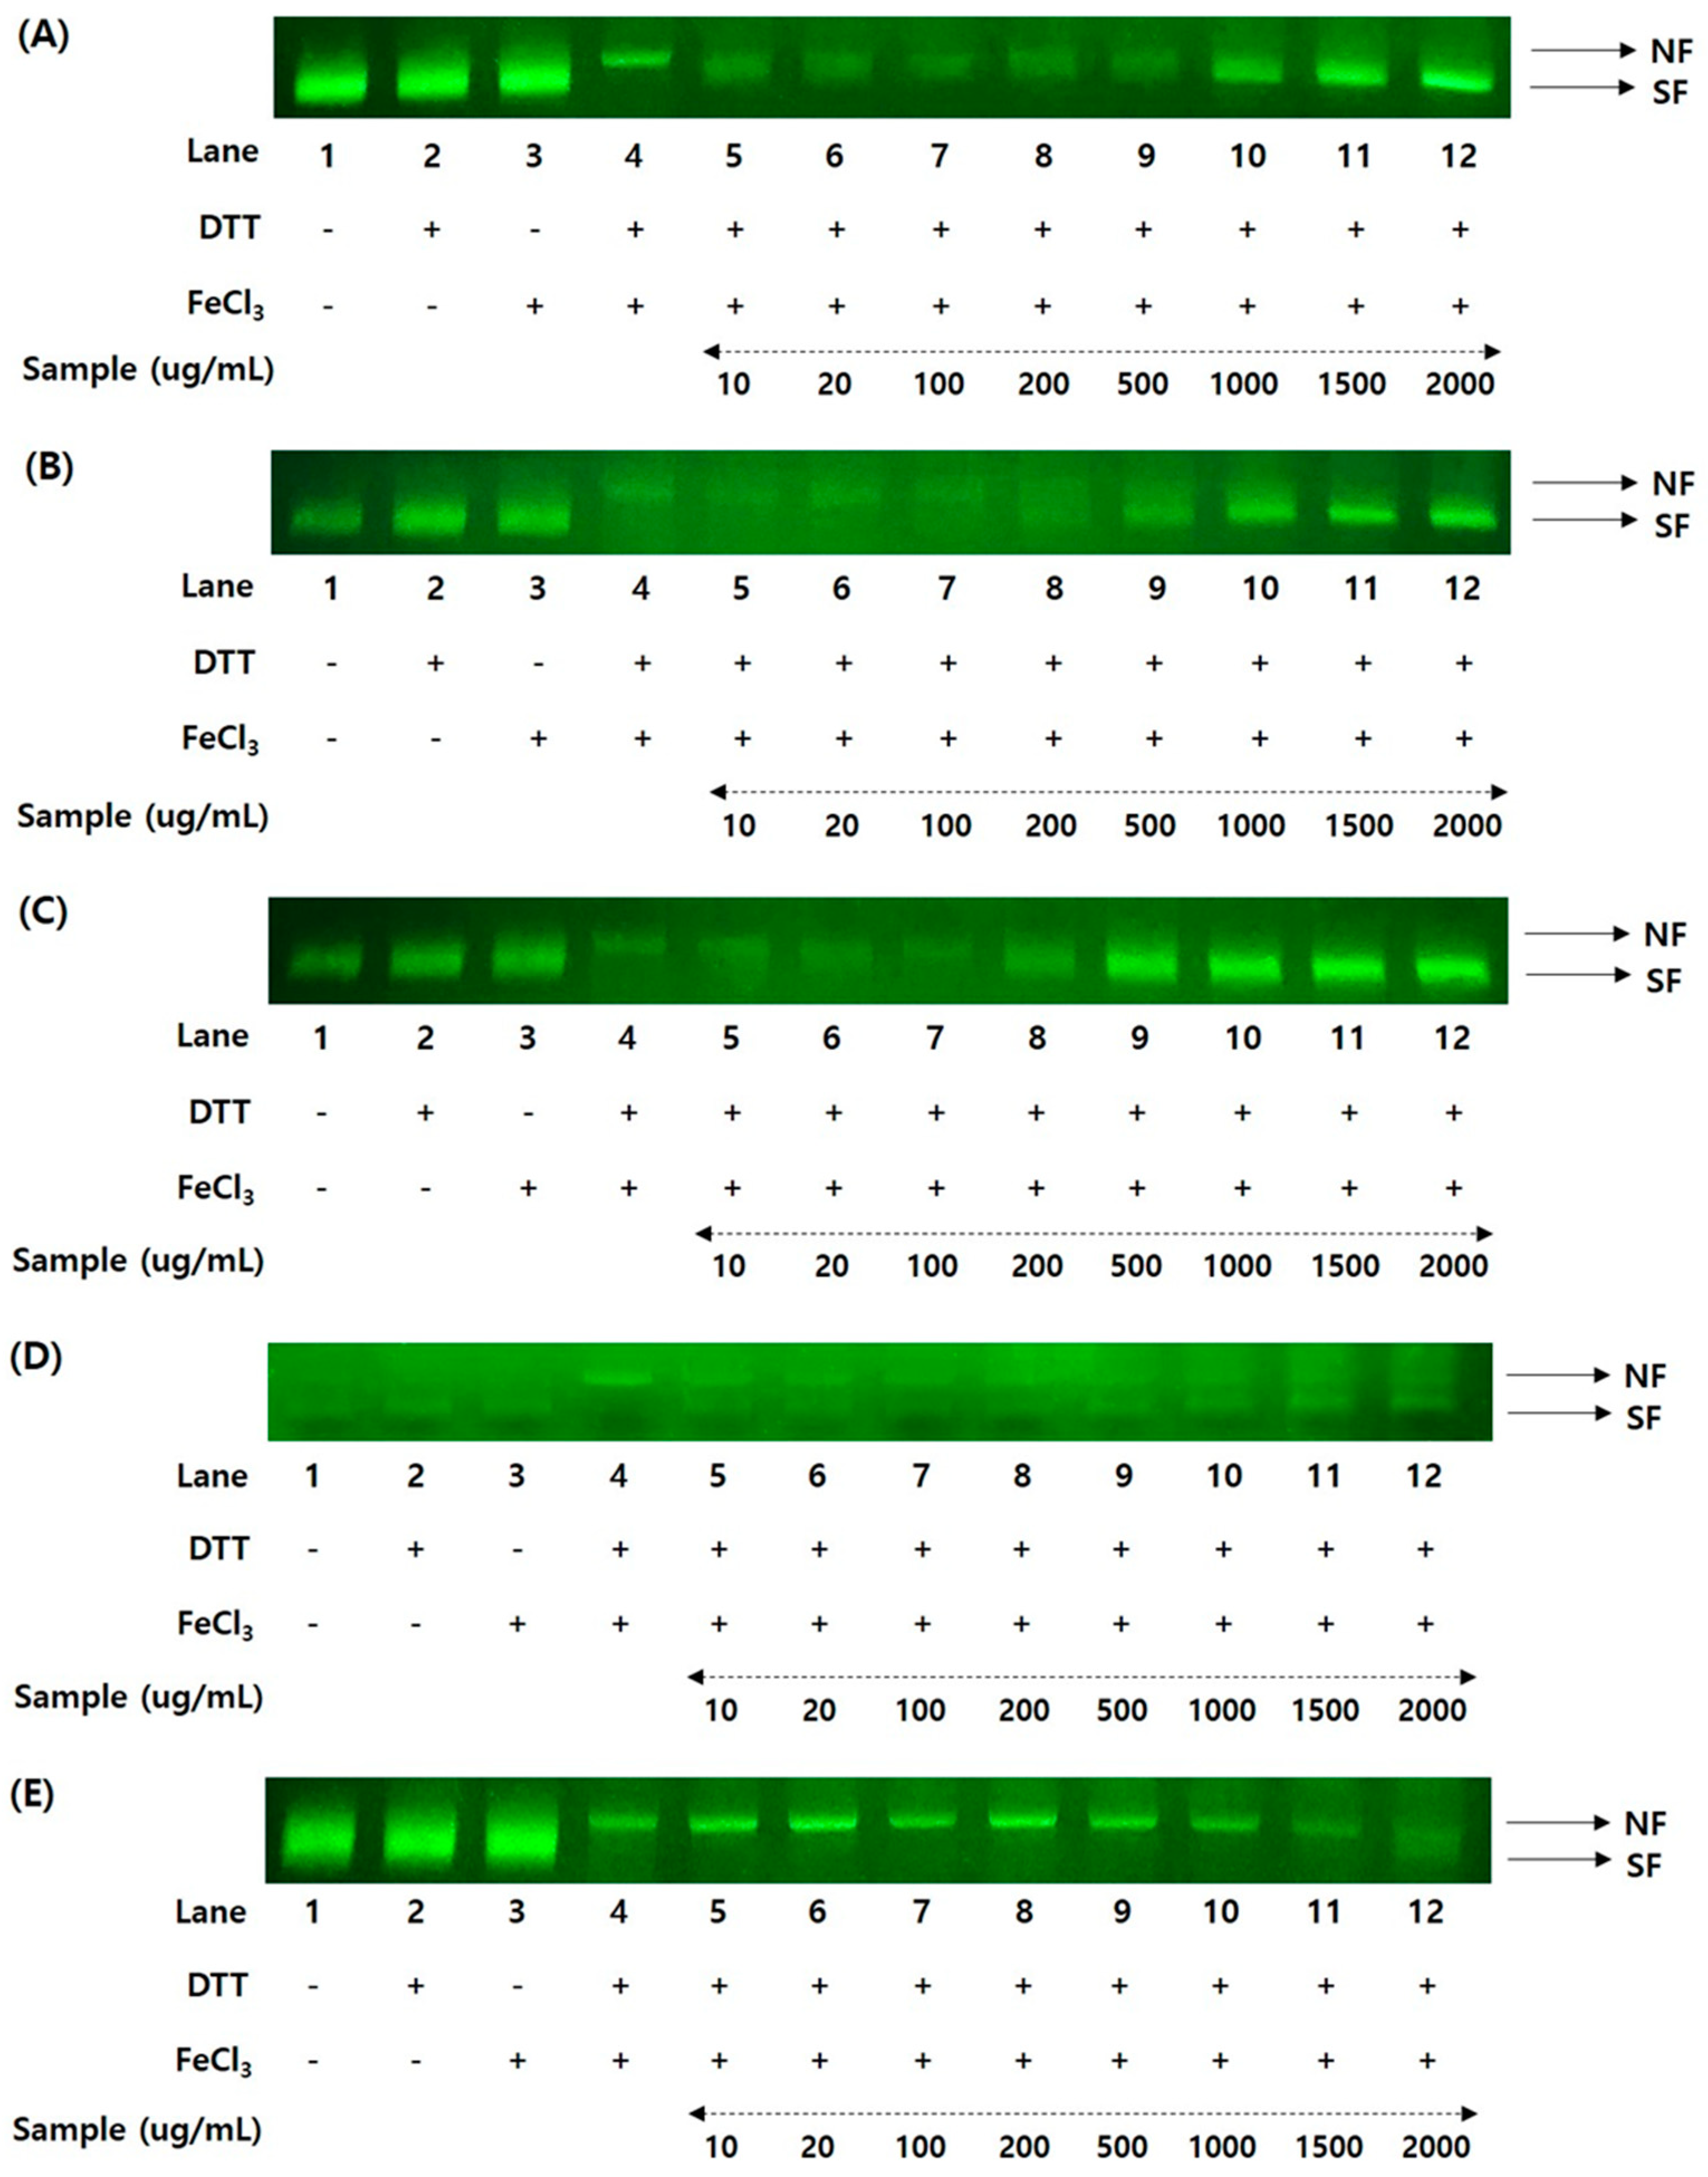
3.7. Variation of DNA Protection Rates in Yellow Soybeans during Three Different Growth Years

Oxidative stress can lead to DNA damage, which is positively associated with various chronic diseases [5,41]. The phenolic profiles and their contents are also known as DNA damage protection agents [5,27,42]. Many recent studies have shown that natural plants, including crops, foods, and vegetables, had excellent functional values in regard to the DNA damage protective effects related to antioxidant properties [5,43]. We investigated the super-coiled DNA damage protection capacities of recombinant soybean extracts to obtain more data on the antioxidant properties of Korean yellow soybean cultivars. A nicked DNA skill (plasmid DNA pUC18) was measured in an MCO system, and the DNA protection rates were expressed as percentage values in accordance with the different concentrations of soybean extracts (50% methanol) (Figure 4). Their concentrations have been confirmed by comparing the antioxidant experiments and preliminary tests of DNA damage protection capacities at 2000, 1500, 1000, 500, 200, 100, 20, and 10 μg/mL. As illustrated in Figure 4, all soybean extracts were measured for DNA damage protection effects against hydroxyl radicals produced with the nicked DNA pUC18 based on agarose gel electrophoresis. In this regard, we evaluated the variations and comparisons of DNA protection in five soybeans (Saedanbaek 2020; Daewon 2020; Daepung 2021; Neulchan 2019; Taekwang 2019) of the most abundant TPC in each cultivar over three years (Figure 4). The DNA damage protective effects showed significant differences in each extract at the eight concentrations. To summarize, the defense patterns against DNA damage were observed considering differences in a concentration-dependent manner with regard to the 50% methanol extracts. Their protection patterns are consistent with the TPC ratios in the following order: Daepung (2021) > Daewon (2020) > Neulchan (2019) > Saedanbaek (2020) > Taekwang (2019), accounting for 7.52, 5.76, 5.66, 5.34, and 5.25 GAE mg/g, respectively. Although the order of the total isoflavone contents showed considerable differences when compared with the DNA protection activities, the Daepung cultivar exhibited the highest protection rates in diverse concentrations (Figure 4C). The differences in DNA protection patterns of the remaining soybeans may also be positively related to various phenolic metabolites and their contents, as reported in previous data [5,41,42]. In the present investigation, the band patterns of the most predominant DNA protection ratios under Daepung (2021) were observed with 52.4 and 100% at 200 and 500 μg/mL, compared with those of the DNA marker (1 kb; control; pUC18 only) (Figure 4C). Three extracts in the range of 1000–2000 μg/mL also exhibited 100% DNA protective effects, and soybean extracts between 10 and 100 μg/mL exhibited no protection capacities. Therefore, a nicked DNA evaluation under an MCO system demonstrated that the 50% methanol extract of Daepung displayed potent preventive activities against DNA damage by hydroxyl radicals and may be an excellent natural antioxidant source for the development of human health foods and new cultivars because of the DNA damage protection against ROS, which is supported by published results [5,27,43]. The Daewon (2020) and Neulchan (2019) cultivars, for the second and third DNA protection activities (Figure 4B,D), showed similar patterns when compared to those of Daepung (2021). In particular, the rank order of DNA protective effects was consistent with that of TPC (Daepung 2021, 7.52 GAE mg/g > Daewon 2020, 5.76 GAE mg/g > Neulchan 2019, 5.66 GAE mg/g). Although the Daepung (2021) and Daewon (2020) cultivars were not protected at 10, 20, and 100 μg/mL (Figure 4B,C), the DNA protection ratios of Neulchan (2019) were 12.7, 17.5, and 21.2%, respectively. These results may be influenced by other metabolites and their chemical properties, except for phenolics in soybean extracts (50% methanol) [41]. The DNA protection ratios in the remaining concentrations of Daewon (2020) and Neulchan (2019) were increased, with marked variations in accordance with the increase patterns of 500 → 2000 μg/mL: Daewon (2020), 48.8 → 74.4 → 87.9 → 96.5 → 100%; and Neulchan (2019), 21.9 → 38.3 → 42.7 → 51.9 → 58.2% (Figure 4B,D). The protective effects of Saedanbaek (2020) were slightly increased with the increase of concentration from 200 to 2000 μg/mL in accordance with the following order: 18.5 → 20.4 → 44.3 → 51.4 → 57.7% (Figure 4A). On the contrary, the Taekwang cultivar (2019) with the lowest capacities did not protect the mobilities of DNA fragments across the seven different concentrations ranging from 10 to 1500 μg/mL (Figure 4E). We have confidence that the degree of DNA damage protection showed considerable differences across soybeans owing to various metabolites, including isoflavones, phenolics, and other nutritional components [5,27,42]. In addition, our data can provide useful information regarding the antioxidant properties of nutraceutical contributors to prevent chronic diseases. Therefore, the Daepung cultivar may be recommended as a potential candidate for increasing soybean value in the development of new breeding systems and human-health-promoting agents.

4. Conclusions

The current research was the first to demonstrate useful information based on the fluctuations of nutritional metabolites and functional properties in yellow soybeans at different growth years for the development of new beneficial food materials and cultivars. The fatty acid, amino acid, and isoflavone contents exhibited significant differences, with wide ranges of 46.5–110.5 mg/g, 195.3–581.0 mg/100 g, and 1192.5–4448.0 μg/g, respectively. Specifically, linoleic acid, glutamic acid, and malonylgenistin were considered as the predominant components, with average contents of 38.7 mg/g, 59.9 mg/100 g, and 992.6 μg/g, respectively. Moreover, the 50% methanol extracts of soybeans exhibited important properties for antioxidant and DNA damage protection as well as α-glucosidase inhibition, and their effects showed remarkable differences. Their extracts displayed potential abilities in the following order: ABTS > α-glucosidase inhibition > DPPH. The Daepung cultivar was observed to have the most abundant average metabolites of 80.8 mg/g (fatty acid), 353.8 mg/100 g (amino acid), and 4048.17 μg/g (isoflavone), as well as the highest beneficial abilities of 75.1% (ABTS), 52.5% (DPPH), 1.54 OD593 nm (FRAP), 100% (DNA protection), and 73.1% (α-glucosidase inhibition) at 500 μg/mL. We believe that the Daepung source can be an alternative parameter for the development of new soybean cultivars and functional agents. Our observations will increase the potential application of soybeans to human nutraceutical foods, providing excellent information on selecting cultivars through growth years.

Supplementary Materials

The following supporting information can be downloaded at: https://www.mdpi.com/article/10.3390/agronomy13122914/s1; Figure S1: Changes in linoleic acid contents yellow soybean cultivars at three growth years. Figure S2: Changes in glutamic acid contents yellow soybean cultivars at three growth years. Figure S3: Changes in malonylgenistin contents yellow soybean cultivars at three growth years.

Author Contributions

Conceptualization, J.H.L.; methodology, K.M.C. and J.H.L.; validation, K.M.C. and H.Y.L.; formal analysis, J.H.L.; investigation, K.M.C. and Y.M.L.; data curation, K.M.C., Y.M.L., H.Y.L. and J.H.L.; writing—original draft preparation, K.M.C. and J.H.L.; writing—review and editing, J.H.L.; project administration, J.H.L.; funding acquisition, J.H.L. All authors have read and agreed to the published version of the manuscript.

Funding

This work was supported by the Dong-A University research fund.

Data Availability Statement

This study did not report any data.

Conflicts of Interest

The authors declare no conflict of interest.

References

  1. Lee, K.S.; Woo, S.Y.; Lee, M.J.; Kim, H.Y.; Ham, H.; Lee, D.J.; Choi, S.W.; Seo, W.D. Isoflavones and soyasaponins in the germ of Korean soybean [Glycine max (L.) Merr.] cultivars and their compound-enhanced BMP-2-induced bone formation. Appl. Biol. Chem. 2020, 63, 26. [Google Scholar] [CrossRef]
  2. Hwang, C.E.; Kim, S.C.; Kim, D.H.; Lee, H.Y.; Suh, H.K.; Cho, K.M.; Lee, J.H. Enhancement of isoflavone aglycone, amino acid, and CLA contents in fermented soybean yogurts using different strains: Screening of antioxidant and digestive enzyme inhibition properties. Food Chem. 2021, 340, 128199. [Google Scholar] [CrossRef] [PubMed]
  3. Shi, D.; Hang, J.; Neufeld, J.; Zhao, S.; House, J.D. Estimation of crude protein and amino acid contents in whole, ground and defatted ground soybeans by different types of near-infrared (NIR) reflectance spectroscopy. J. Food Compost. Anal. 2022, 111, 104601. [Google Scholar] [CrossRef]
  4. Ito, C.; Oki, T.; Yoshida, T.; Nanba, F.; Yamada, K.; Toda, T. Characterisation of proanthocyanidins from black soybeans: Isolation and characterisastion of proanthocyanidin oligomers from black soybean seed coats. Food Chem. 2013, 141, 2507–2512. [Google Scholar] [CrossRef] [PubMed]
  5. Lee, J.H.; Seo, E.Y.; Lee, Y.M. Comparative investigation on variations of nutritional components in whole seeds and seed coats of Korean black soybeans for different crop years and screening of their antioxidant and anti-aging properties. Food Chem. X 2023, 17, 100572. [Google Scholar] [CrossRef] [PubMed]
  6. Widowati, W.; Prahasturis, S.; Hidayat, M.; Hasianna, S.T.; Wahyudianingsih, R.; Eltania, T.F.; Azizah, A.M.; Aviani, J.K.; Subangkit, M.; Handayani, R.A.S.; et al. Detam 1 black soybean against cisptatin-induced acute ren failure on rat model via antioxidant, anti-inflammatory and antiapoptosis potential. J. Tradit. Complement. Med. 2022, 12, 426–435. [Google Scholar] [CrossRef] [PubMed]
  7. Paucar-Menacho, L.; Amaya-Farfan, J.; Berhow, M.A.; Mandarino, J.M.G.; de Mejia, E.G.; Chang, Y.K. A high-protein soybean cultivar contains lower isoflavones and saponins but higher minerals and bioactive peptides than a low-protein cultivar. Food Chem. 2010, 120, 15–21. [Google Scholar] [CrossRef]
  8. Woyann, G.; Meira, D.; Zdziarski, A.D.; Matei, G.; Milioli, S.; Rosa, A.C.; Madella, L.A.; Benin, G. Multiple-trait selection of soybean for biodiesel production in Brazil. Ind. Crop Prod. 2019, 140, 111721. [Google Scholar] [CrossRef]
  9. Benavides, P.T.; Cai, H.; Wang, M.; Bajjalieh, N. Life-cycle analysis of soybean meal, distiller-dried grains with solubles, and synthetic amino acid-based animal feeds for swine and poultry production. Anim. Feed Sci. Technol. 2020, 268, 114607. [Google Scholar] [CrossRef]
  10. Ademiluyi, A.O.; Oboh, G. Soybean phenolic-rich extracts inhibit key-enzymes linked to type 2 diabetes (α-amylase and α-glucosidase) and hypertension (angiotensin I converting enzyme) in vitro. Exp. Toxicol. Pathol. 2013, 65, 305–309. [Google Scholar] [CrossRef]
  11. Bai, Y.; Xu, Y.; Wang, B.; Li, S.; Guo, F.; Hua, H.; Zhao, Y.; Yu, Z. Comparison of phenolic compounds, antioxidant and antidiabetic activities between selected edible beans and their different growth periods leaves. J. Funct. Food. 2017, 35, 694–702. [Google Scholar] [CrossRef]
  12. Nagarajan, S. Mechanisms of anti-atherosclerotic functions of soy-based diets. J. Nutr. Biochem. 2010, 21, 255–260. [Google Scholar] [CrossRef] [PubMed]
  13. Lee, J.H.; Kim, B.; Hwang, C.E.; Haque, M.A.; Kim, S.C.; Lee, C.S.; Kang, S.S.; Cho, K.M.; Lee, D.H. Changes in conjugated linoleic acid and isoflavone contents from fermented soymilks using Lactobacillus plantarum P1201 and screening for their digestive enzyme inhibition and antioxidant properties. J. Funct. Food. 2018, 43, 17–28. [Google Scholar] [CrossRef]
  14. Antony, M.S.; Clarkson, T.B.; Hughes, C.L.; Morgan, T.M.; Burke, G.L. Soybean isoflavones improve cardiovascular risk factors without affecting the reproductive system of peripubertal rhesus monkeys. J. Nutr. 1996, 126, 43–50. [Google Scholar] [CrossRef] [PubMed]
  15. Waheed, S.; Hasmain, A.; Ahmad, A.; Tarar, O.M.; Yaqeen, Z.; Ali, T.M. Effect of botanical extracts on amino acid and fatty acid profile of meat. Braz. J. Poult. Sci. 2018, 20, 507–516. [Google Scholar] [CrossRef]
  16. Lu, Y.; Wu, Y.; Chen, X.; Yang, X.; Xiao, H. Water extract of shepherd’s purse prevents high-fructose induced-liver injury by regulating glucolipid metabolism and gut microbiota. Food Chem. 2021, 342, 128536. [Google Scholar] [CrossRef] [PubMed]
  17. Modgil, R.; Tanwar, B.; Goyal, A.; Kumar, V. Soybean (Glycine max). In Oilseeds: Health Attributes and Food Applications; Tanwar, B., Goyal, A., Eds.; Springer: Singapore, 2021. [Google Scholar]
  18. Hwang, H.S.; Winkler-Moser, J.K. Antioxidant activity of amino acids in soybean oil at frying temperature: Structural effects and synergism with tocopherols. Food Chem. 2017, 221, 1168–1177. [Google Scholar] [CrossRef]
  19. Dajanta, K.; Apichartsrangkoon, A.; Chukeatirote, E.; Frazier, R.A. Free-amino acid profiles of thua nao a Thai fermented soybean. Food Chem. 2011, 125, 342–347. [Google Scholar] [CrossRef]
  20. Desta, K.T.; Hur, O.S.; Lee, S.; Yoon, H.; Shin, M.J.; Yi, J.; Lee, Y.; Ro, N.Y.; Wang, X.; Choi, Y.M. Origin and seed color differently affect the concentrations of metabolites and antioxidant activities in soybean (Glycine max (L.) Merill) seeds. Food Chem. 2020, 381, 132249. [Google Scholar] [CrossRef]
  21. Kumar, V.; Rani, A.; Dixit, A.K.; Pratap, D.; Bhatnagar, D. A comparative assessment of total phenolic content, ferric reducing-anti-oxidative power, free radical-scavenging activity, vitamin C and isoflavones content in soybean with varying seed coat colour. Food Res. Int. 2010, 43, 323–328. [Google Scholar] [CrossRef]
  22. Yu, X.; Meenu, M.; Xu, B.; Yu, H. Impact of processing technologies on isoflavones, phenolic acids, and antioxidant-capacities of soymilk prepared from 15 varieties. Food Chem. 2021, 345, 128612. [Google Scholar] [CrossRef] [PubMed]
  23. Kim, H.; Jo, H.; Lee, J.D. Combining a Mutant Allele of FAD2-1A with HD improves the ω-6/ω-3 ratio in soybeans. Agronomy 2023, 13, 913. [Google Scholar] [CrossRef]
  24. Rakotonirina, F.M.; Donno, D.; Razafindrakoto, Z.R.; Tombozara, N.; Rafanomezantsoa, R.M.; Andrianjara, C.; Ramanitrahasimbola, D.; Beccaro, G.L. Quali-quantitative fingerprinting of the fruit extract of Uapaca bojeri Bail. (Euphorbiaceae) and its antioxidant, analgesic, anti-inflammatory, and antihyperglycemic effects: An example of biodiversity conservation and sustainable use of natural resources in Madagascar. Plants 2023, 12, 475. [Google Scholar] [PubMed]
  25. Song, S.; Kim, D.Y.; Oh, S.M.; Woo, S.Y.; Kim, I.; Kim, M.O.; Park, J.Y.; Kim, N.; Kim, H.Y.; Lee, J.; et al. Assessment of iridoid profles in the growth period of aerial parts of Pseudolysimachion rotundum var. subintegrum and their antioxidant and MUC5AC inhibitory potential. Appl. Biol. Chem. 2023, 66, 43. [Google Scholar] [CrossRef]
  26. Ng, Z.X.; Koick, Y.T.T.; Yong, P.H. Comparative analyses on radical scavenging and cytotoxic activity of phenolic and flavonoid content from selected medicinal plants. Nat. Prod. Res. 2021, 35, 5271–5276. [Google Scholar] [CrossRef]
  27. Salar, R.K.; Durewal, S.S.; Sandhu, K.S. Relationships between DNA damage protection activity, total phenolic content, condensed tannin content and antioxidant potential among Indian barley cultivars. Biocatal. Agric. Biotechnol. 2017, 11, 201–206. [Google Scholar] [CrossRef]
  28. Rodrigues, C.E.; Schäfer, L.; Gregolon, J.G.N.; de Oliveira, J.F.; Baez, O.P.; Deolindo, C.T.P.; de Melo, A.P.Z.; Singer, R.B.; Ledurkist, T.B.; Hoff, R. Determination of amino acid content, fatty acid profiles, and phenolic compounds in non-conventional edible fruits of seven species of palm trees (Arecaceae) native to the southern half of South America. Food Res. Int. 2022, 162, 111995. [Google Scholar] [CrossRef]
  29. Silva, L.R.; Pereira, M.J.; Azevedo, J.; Mulas, R.; Velazquez, E.; González-Andrés, F.; Valentão, P.; Andrade, P.B. Inoculation with Bradyrhizobium japonicum enhances the organic acid fatty acids content of soybean (Glycine max (L.) Merrill) seeds. Food Chem. 2013, 141, 3636–3648. [Google Scholar] [CrossRef]
  30. Abdelghany, A.M.; Zhang, S.; Azam, M.; Shaibu, A.S.; Feng, Y.; Li, Y.; Tian, Y.; Hong, H.; Li, B.; Sun, J. Profiling of seed fatty acid composition in 1025 Chinese soybean accessions from diverse ecoregions. Crop J. 2020, 8, 635–644. [Google Scholar] [CrossRef]
  31. Brechenmacher, L.; Kim, M.; Benitez, M.; Li, M.; Joshi, T.; Calla, B.; Lee, M.P.; Libault, M.; Vodkin, L.O.; Xu, D.; et al. Transcription profiling of soybean nodulation by Bradyrhizobium japonicum. Mol. Plant Microbe Interact. 2008, 21, 631–645. [Google Scholar] [CrossRef]
  32. Wu, S.Q.; Wang, Y.X.; Beta, T.; Wang, S.Y.; Mendez-Zamora, G.; Laborda, P.; Herrera-Balandrano, D.D. Effect of exogenous melatonin on the isoflavone content and antioxidant properties of soybean sprout. LWT-Food Sci. Technol. 2023, 175, 114498. [Google Scholar] [CrossRef]
  33. Kim, M.J.; Kwak, H.S.; Kim, S.S. Effects of salinity on bacterial communities, Maillard reactions, isoflavone composition, antioxidation and antiproliferation in Korean fermented soybean paste (doenjang). Food Chem. 2018, 245, 402–409. [Google Scholar] [CrossRef] [PubMed]
  34. Zhang, R.F.; Zhang, F.X.; Zhang, M.W.; Wei, Z.C.; Yang, C.Y.; Zhang, Y.; Tang, X.J.; Deng, Y.Y.; Chi, J.W. Phenolic composition and antioxidant activity in seed coats of 60 Chinese black soybean (Glycine Max L. Merr.) varieties. J. Agric. Food Chem. 2011, 59, 5935–5944. [Google Scholar] [CrossRef] [PubMed]
  35. Dixon, R.A.; Pacia, N.L. Stress-induced phenylpropanoid metabolism. Plant Cell 1995, 7, 1085–1097. [Google Scholar] [CrossRef] [PubMed]
  36. Floegel, A.; Kim, D.O.; Chung, S.J.; Koo, S.I.; Chun, O.K. Comparison of ABTS/DPPH assays to measure antioxidant capacity in popular antioxidant-rich US foods. J. Food Compos. Anal. 2011, 24, 1043–1048. [Google Scholar] [CrossRef]
  37. Liu, W.T.; Huang, C.L.; Liu, R.; Yang, T.C.; Lee, C.L.; Tsao, R.; Yang, W.J. Changes in isoflavone profile, antioxidant activity, and phenolic contents in Taiwanese and Canadian soybeans during tempeh processing. LWT—Food Sci. Technol. 2023, 186, 115207. [Google Scholar] [CrossRef]
  38. Dravie, E.E.; Kortei, N.K.; Essuman, E.K.; Tettey, C.O.; Boakye, A.A.; Hunkpe, G. Antioxidant phytochemical and physicochemical properties of sesame seed (Sesamum indicum L). Sci. Afr. 2020, 8, e00349. [Google Scholar] [CrossRef]
  39. Farias, T.C.; Abreu, J.P.; Oliveira, J.P.S.; Macedo, A.F.; Rodríguez-Vega, A.; Tonin, A.P.; Cardoso, F.S.N.; Meurer, E.C.; Koblitz, M.G.B. Bioactive properties of peptide fractions from Brazilian soy protein hydrolysates: In silico evaluation and experimental evidence. Food Hydrocoll. Health 2023, 3, 100112. [Google Scholar] [CrossRef]
  40. Chen, O.; Wang, X.; Yuan, X.; Shi, J.; Zhang, C.; Yan, N.; Jing, C. Comparison of phenolic and flavonoid compound profiles and antioxidant and α-glucosidase inhibition properties of cultivated soybean (Glycine max) and wild soybean (Glycine soja). Plants 2021, 10, 813. [Google Scholar] [CrossRef]
  41. Sunagar, R.R.; Sreerama, Y.N. Implication of solvent polarities on browntop millet (Urochloa ramose) phenolic antioxidants and their ability to protect oxidative DNA damage and inhibit α-amylase and α-glucosidase enzymes. Food Chem. 2023, 411, 135474. [Google Scholar] [CrossRef]
  42. Sevgi, K.; Tepe, B.; Sarikurkcu, C. Antioxidant and DNA damage protection potentials of selected phenolic acids. Food Chem. Toxicol. 2015, 77, 12–21. [Google Scholar] [CrossRef] [PubMed]
  43. Fiorda, F.A.; de Melo Pereira, G.V.; Thomaz-Soccol, V.; Medeiros, A.P.; Rakshit, S.K.; Soccol, C.R.; Medeiros, A.P.; Rakshit, S.K.; Ricardo, C. Development of kefir-based probiotic beverages with DNA protection and antioxidant activities using soybean hydrolyzed extract, colostrum and honey. LWT—Food Sci. Technol. 2016, 68, 690–697. [Google Scholar] [CrossRef]
Figure 1. Comparisons of TPC and TFC in the 50% methanol extracts of yellow soybean cultivars at three different growth years: (A) TPC; (B) TFC. The values represent mean ± SD. Means with different letters indicate statistically significant difference (p < 0.05).
Agronomy 13 02914 g001
Figure 2. Comparisons of representative HPLC chromatograms regarding the highest and the lowest isoflavone contents in each soybean cultivar over three growth years: (A) isoflavone chemical structures in soybean; (B) Saedanbaek (2020); (C) Saedanbaek (2021); (D) Daewon (2020); (E) Daewon (2019); (F) Daepung (2021); (G) Daepung (2020); (H) Neulchan (2019); (I) Neulchan (2021); (J) Taekwang (2019); (K) Taekwang (2021), Isoflavone through each peak: 1. daidzin, 2. glycitin, 3. genistin, 4. malonyldaidzin, 5. malonylglycitin, 6. acetyldaidzin, 7. acetylglycitin, 8. malonylgenistin, 9. daidzein, 10. glycitein, 11. acetylgenistin, 12. genistein.
Agronomy 13 02914 g002aAgronomy 13 02914 g002b
Figure 3. Comparisons of antioxidant and α-glucosidase inhibitory properties in the 50% methanol extracts of yellow soybean cultivars at three growth years: (A) DPPH radical scavenging activities; (B) ABTS radical scavenging activities; (C) FRAP values; (D) α-glucosidase inhibitory activities. The values represent mean ± SD. Means with different letters indicate statistically significant difference (p < 0.05).
Agronomy 13 02914 g003
Figure 4. Comparisons of DNA protectant properties of the highest total phenolic contents in each cultivar during three growth years: lane 1, pUC18 only; lane 2, pUC18 with DDT only; lane 3, pUC18 with FeCl3 only; lane 4, pUC18 with MCO system; lanes 5–12, pUC18 with combinant extracts in the MCO system (lane 5: 10 μg/mL, lane 6: 20 μg/mL, lane 7: 100 μg/mL, lane 8: 200 μg/mL, lane 9: 500 μg/mL, lane 10: 1000 μg/mL, lane 11: 1500 μg/mL, and lane 12: 2000 μg/mL): (A) DNA protectant effects of the 50% methanol extracts in Saedanbaek (2020 growth year), (B) DNA protectant effects of the 50% methanol extracts in Daewon (2020 growth year), (C) DNA protectant effects of the 50% methanol extracts in Daepung (2021 growth year), (D) DNA protectant effects of the 50% methanol extracts in Neulchan (2019 growth year), (E) DNA protectant effects of the 50% methanol extracts in Taekwang (2019 growth year). Nicked form (NF) and super-coiled form (SF) of the plasmid DNA are indicated by arrows.
Agronomy 13 02914 g004
Table 1. Comparison of fatty acid compositions in the 50% methanol extracts of diverse yellow soybean cultivars across three different growth years.
CultivarsGrowth
Years
Fatty Acid Contents (mg/g) 1
Saturated Fatty Acids 2Unsaturated Fatty AcidsTotal
C14:0C16:0C18:0C20:0C22:0TotalC16:1C18:1n9cC18:2n6cC18:3n3C20:1C20:2C24:1Total
Saedanbaek20190.1 ± 0.0 a9.6 ± 0.2 d2.7 ± 0.1 d0.3 ± 0.0 a0.5 ± 0.0 a13.20.1 ± 0.0 a19.2 ± 0.4 d42.7 ± 0.9 e7.5 ± 0.2 b0.3 ± 0.0 b0.1 ± 0.0 atr69.983.1
20200.1 ± 0.0 a6.7 ± 0.1 h2.1 ± 0.0 eftr 30.3 ± 0.0 c9.2tr10.1 ± 0.2 h30.1 ± 0.6 f5.9 ± 0.1 f0.1 ± 0.0 ctrtr46.255.4
20210.1 ± 0.0 a7.9 ± 0.2 g2.1 ± 0.0 ef0.2 ± 0.0 btr10.3tr10.3 ± 0.2 h24.9 ± 0.5 h4.2 ± 0.1 htrtrtr39.449.7
Daewon20190.1 ± 0.0 a10.1 ± 0.2 c3.1 ± 0.1 c0.3 ± 0.0 a0.4 ± 0.0 b14.00.1 ± 0.0 a20.4 ± 0.4 c54.6 ± 1.1 b7.4 ± 0.1 c0.3 ± 0.0 btrtr82.896.8
20200.1 ± 0.0 a8.5 ± 0.2 ef2.7 ± 0.1 dtr0.1 ± 0.0 d11.40.1 ± 0.0 a14.2 ± 0.3 f45.0 ± 0.9 d7.3 ± 0.1 c0.1 ± 0.0 c0.1 ± 0.0 atr66.878.2
20210.1 ± 0.0 a8.3 ± 0.2 f2.2 ± 0.0 e0.2 ± 0.0 btr10.80.1 ± 0.0 a14.3 ± 0.3 f25.1 ± 0.5 gh4.2 ± 0.1 htrtrtr43.754.5
Daepung20190.1 ± 0.0 a10.7 ± 0.2 b3.6 ± 0.1 b0.3 ± 0.0 a0.3 ± 0.0 c15.00.1 ± 0.0 a16.6 ± 0.3 e61.2 ± 1.2 a8.2 ± 0.2 a0.3 ± 0.0 b0.1 ± 0.0 atr86.5101.5
20200.1 ± 0.0 a9.5 ± 0.2 d3.5 ± 0.1 b0.2 ± 0.0 b0.1 ± 0.0 d13.40.1 ± 0.0 a14.2 ± 0.349.0 ± 1.0 c6.9 ± 0.1 d0.1 ± 0.0 ctr0.1 ± 0.0 a70.483.8
20210.1 ± 0.0 a9.0 ± 0.2 e2.2 ± 0.0 e0.2 ± 0.0 btr11.5tr17.2 ± 0.3 e23.4 ± 0.5 i5.0 ± 0.1 gtrtrtr45.657.1
Neulchan20190.1 ± 0.0 a11.2 ± 0.2 a3.9 ± 0.1 a0.3 ± 0.0 a0.4 ± 0.0 b15.90.1 ± 0.0 a24.9 ± 0.5 b61.9 ± 1.2 a7.3 ± 0.1 c0.3 ± 0.0 b0.1 ± 0.0 atr94.6110.5
20200.1 ± 0.0 a8.9 ± 0.2 e3.0 ± 0.1 ctr0.4 ± 0.0 b12.40.1 ± 0.0 a14.4 ± 0.5 f44.7 ± 0.9 de6.7 ± 0.1 d0.1 ± 0.0 c0.1 ± 0.0 a0.1 ± 0.0 a66.278.6
20210.1 ± 0.0 a8.1 ± 0.2 f2.3 ± 0.0 e0.2 ± 0.0 btr10.70.1 ± 0.0 a12.6 ± 0.3 g26.9 ± 0.5 g3.9 ± 0.1 itrtrtr43.554.2
Taekwang20190.1 ± 0.0 a9.7 ± 0.2 cd3.5 ± 0.1 b0.3 ± 0.0 a0.4 ± 0.0 b14.00.1 ± 0.0 a32.7 ± 0.7 a43.3 ± 0.9 e6.4 ± 0.1 e0.4 ± 0.0 atrtr82.996.9
2020tr4.7 ± 0.1 i2.0 ± 0.0 ftr0.1 ± 0.0 d6.8tr8.8 ± 0.2 i26.8 ± 0.5 g3.9 ± 0.1 i0.1 ± 0.0 ctr0.1 ± 0.0 a39.746.5
20210.1 ± 0.0 a7.6 ± 0.2 g2.1 ± 0.0 ef0.2 ± 0.0 btr10.00.1 ± 0.0 a18.4 ± 0.4 d21.6 ± 0.4 j3.4 ± 0.1 jtrtrtr43.553.5
Average0.18.72.70.20.211.90.116.638.75.90.10.00.061.473.3
1 The values represent mean ± SD. Means with different letters within a column for each sample indicate statistically significant difference (p < 0.05). Content expressed in mg of each component equivalents per g of dried weight. 2 C14:0, myristic acid; C16:0, palmitic acid; C18:0, stearic acid; C20:0, arachidic acid; C22:0, docosanic acid; C16:1, palmitoleic acid; C18:1n9c, oleic acid; C18:2n6c, linoleic acid; C18:3n3, α-linolenic acid; C20:1, gadoleic acid; C20:2, eicosadienoic acid; C24:1, nervonic acid. 3 tr: trac.
Table 2. Comparison of amino acid contents in the 50% methanol extracts of diverse Korean soybean cultivars across three different growth years.
CultivarsGrowth
Years
Amino Acid Contents (mg/100 g) 1
Non-Essential Amino AcidsEssential Amino AcidsTotal
AspSerGluGlyAlaCysTyrArgProTotalThrValMetIsoLeuPheLysHisTotal
Saedanbaek201935.3 ± 0.7 d14.4 ± 0.3 e60.1 ± 1.2 e13.1 ± 0.3 d13.3 e ± 0.34.2 ± 0.1 d11.0 ± 0.2 e25.3 ± 0.5 d15.6 ± 0.3 d192.311.7 ± 0.2 e14.1 ± 0.3 d4.2 ± 0.1 c14.5 ± 0.3 e24.9 ± 0.5 e16.7 ± 0.3 d18.9 ± 0.4 e8.6 ± 0.2 f113.6305.9
202031.0 ± 0.6 e11.4 ± 0.2 g51.2 ± 1.0 f11.7 ± 0.2 f12.4 ± 0.2 f3.3 ± 0.1 f8.1 ± 0.2 h23.9 ± 0.5 e14.3 ± 0.3 e167.310.2 ± 0.2 f14.2 ± 0.3 d3.4 ± 0.1 f14.0 ± 0.3 e22.5 ± 0.5 f15.3 ± 0.3 e15.3 ± 0.3 f7.6 ± 0.2 g102.5269.8
202154.1 ± 1.1 b24.7 ± 0.5 b90.0 ± 1.8 b21.0 ± 0.4 b22.0 ± 0.4 b6.6 ± 0.1 b15.9 ± 0.3 b34.9 ± 0.7 b20.6 ± 0.4 b289.819.3 ± 0.4 h22.0 ± 0.4 b4.3 ± 0.1 c22.8 ± 0.5 d39.7 ± 0.8 b26.0 ± 0.5 b32.0 ± 0.6 b13.5 ± 0.3 c179.6469.4
Daewon201926.0 ± 0.5 g11.1 ± 0.2 g42.8 ± 0.9 i10.1 ± 0.2 g10.7 ± 0.2 i3.5 ± 0.1 ef8.1 ± 0.2 h17.5 ± 0.4 h12.0 ± 0.2 g141.89.4 ± 0.2 g10.4 ± 0.2 g2.8 ± 0.1 h10.9 ± 0.2 i18.9 ± 0.4 h12.7 ± 0.3 h15.0 ± 0.3 f6.3 ± 0.1 j86.4228.2
202029.2 ± 0.6 e11.9 ± 0.2 f49.2 ± 1.0 g11.3 ± 0.2 e11.5 ± 0.2 g3.6 ± 0.1 e7.3 ± 0.1 i19.9 ± 0.4 f12.9 ± 0.3 f156.810.1 ± 0.2 f12.8 ± 0.2 e3.7 ± 0.1 e12.8 ± 0.3 f21.0 ± 0.4 g14.2 ± 0.3 f14.6 ± 0.3 g7.2 ± 0.1 h96.4253.2
202150.0 ± 1.0 c22.5 ± 0.5 d81.8 ± 1.6 d19.1 ± 0.4 c19.9 ± 0.4 d6.5 ± 0.1 b c13.6 ± 0.3 d32.6 ± 0.7 c19.3 ± 0.4 c265.317.7 ± 0.2 d20.2 ± 0.4 c4.2 ± 0.1 c20.7 ± 0.4 d35.4 ± 0.7 d23.8 ± 0.3 c28.5 ± 0.6 d12.2 ± 0.2 e162.7428.0
Daepung201927.0 ± 0.5 f11.0 ± 0.2 g44.1 ± 0.9 h10.7 ± 0.2 f11.2 ± 0.2 h3.7 ± 0.1 e9.5 ± 0.2 f17.7 ± 0.4 h12.6 ± 0.3 fg147.59.7 ± 0.4 g11.6 ± 0.2 f3.9 ± 0.1 d12.1 ± 0.2 g20.6 ± 0.4 gh13.4 ± 0.5 g15.4 ± 0.3 f7.1 ± 0.1 h93.8241.3
202027.2 ± 0.5 f10.6 ± 0.2 h45.1 ± 0.9 h10.6 ± 0.2 f11.0 ± 0.2 h3.0 ± 0.1 g7.4 ± 0.1 i18.9 ± 0.4 g12.5 ± 0.3 fg146.39.4 ± 0.2 g12.5 ± 0.2 e3.4 ± 0.1 f12.6 ± 0.3 f20.5 ± 0.4 gh13.5 ± 0.3 g14.0 ± 0.3 g7.0 ± 0.1 h92.9239.2
202170.1 ± 1.4 a29.7 ± 0.6 a113.3 ± 2.3 a24.9 ± 0.5 a25.4 ± 0.4 a7.5 ± 0.2 a18.6 ± 0.4 a54.9 ± 1.1 a25.3 ± 0.5 a369.722.3 ± 0.2 a25.9 ± 0.4 a5.5 ± 0.1 a26.7 ± 0.5 a46.1 ± 0.9 a31.4 ± 0.6 a36.7 ± 0.7 a16.7 ± 0.3 b211.3581.0
Neulchan201922.0 ± 0.4 h8.6 ± 0.2 k35.5 ± 0.7 jk8.6 ± 0.2 h9.7 ± 0.2 j3.0 ± 0.1 g8.5 ± 0.2 g14.8 ± 0.3 i10.9 ± 0.2 h121.68.0 ± 0.4 i10.0 ± 0.2 h3.1 ± 0.1 g10.4 ± 0.2 j17.6 ± 0.4 i11.6 ± 0.2 i13.1 ± 0.3 h6.0 ± 1.2 a79.8201.4
202025.4 ± 0.5 g9.8 ± 0.2 i41.5 ± 0.810.0 ± 0.2 g11.1 ± 0.2 h2.6 ± 0.1 h7.1 ± 0.1 j18.3 ± 0.4 g12.3 ± 0.2 g138.18.9 ± 0.2 h12.2 ± 0.2 f3.4 ± 0.1 f12.2 ± 0.2 g19.8 ± 0.4 h13.2 ± 0.3 g13.5 ± 0.3 h6.6 ± 0.1 i89.8227.9
202151.5 ± 1.0 c23.5 ± 0.5 c85.4 ± 1.7 c19.5 ± 0.4 c20.2 ± 0.4 cd6.6 ± 0.1 b14.3 ± 0.3 c33.4 ± 0.7 bc19.8 ± 0.4 bc274.217.9 ± 0.4 d20.8 ± 0.4 c4.3 ± 0.1 c21.7 ± 0.4 c37.5 ± 0.8 c24.6 ± 0.5 c29.3 ± 0.6 d12.7 ± 0.3 d168.8443.0
Taekwang201923.8 ± 0.5 g9.1 ± 0.2 j37.0 ± 0.7 j9.9 ± 0.2 g11.7 ± 0.2 g3.5 ± 0.1 ef9.4 ± 0.2 f17.8 ± 0.4 h12.5 ± 0.3 fg134.79.0 ± 0.2 h11.7 ± 0.2 f4.0 ± 0.1 d11.9 ± 0.2 h19.6 ± 0.4 h13.3 ± 0.3 g15.0 ± 0.3 fg6.8 ± 0.191.3226.0
202021.4 ± 0.4 i8.5 ± 0.2 k34.3 ± 0.7 k8.9 ± 0.2 h9.7 ± 0.2 j2.3 ± 0.1 i5.7 ± 0.1 k15.3 ± 0.3 i10.7 ± 0.2 h116.87.8 ± 0.1 i10.8 ± 0.2 g2.8 ± 0.1 h10.7 ± 0.2 i16.9 ± 0.3 i11.6 ± 0.2 i12.0 ± 0.2 i5.9 ± 0.1 k78.5195.3
202151.3 ± 1.0 c23.7 ± 0.5 c87.8 ± 1.8 bc20.2 ± 0.4 b21.0 ± 0.4 c6.3 ± 0.1 c14.5 ± 0.3 c34.2 ± 0.7 b20.1 ± 0.4 b279.118.4 ± 0.2 c21.4 ± 0.4 b4.7 ± 0.1 b22.0 ± 0.4 b37.5 ± 0.8 c25.2 ± 0.5 b30.3 ± 0.6 b12.9 ± 0.3 d172.4451.5
Average36.415.459.914.014.74.410.625.315.4196.112.715.43.815.726.617.820.212.7124.9321.0
1 The values represent mean ± SD. Means with different letters within a column for each sample indicate statistically significant difference (p < 0.05). Content expressed in mg of each component equivalents per g of dried weight.
Table 3. Comparison of isoflavone contents in the 50% methanol extracts of diverse Korean soybean cultivars over three different growth years.
CultivarsGrowth
Years
Isoflavone Contents (μg/g) 1
GlucosideMalonylglucosideAcetylglucosideAglyconeTotal
Din (1)Gly (2)Gin (3)MDin (4)MGly (5)MGin (8)AcDin (6)AcGly (7)AcGin (11)Dein (9)Glein (10)Gein (12)
Saedanbaek2019145.6 ± 2.9 f136.6 ± 2.7 f119.1 ± 2.3 f332.0 ± 6.6 m105.0 ± 2.1 j455.8 ± 9.1 l9.6 ± 0.1 a2.2 ±0.0 knd 215.1 ± 0.3 j2.9 ± 0.1 h18.7 ± 0.3 i1342.6
202070.4 ± 1.4 l87.5 ± 1.7 i22.6 ± 0.45 n703.1 ± 14.0 g112.8 ± 2.2 i930.2 ± 20.6 h1.9 ± 0.0 b3.2 ± 0.1 fnd20.2 ± 0.3 hnd20.9 ± 0.4 h1972.8
202189.6 ± 1.7 i89.9 ± 1.8 i43.7 ± 0.8 m431.5 ± 8.6 k89.5 ± 1.7 e554.1± 11.0 ktr 3ndnd14.1 ± 0.2 k5.0 ± 0.1 g15.5 ± 0.3 j1332.9
Daewon2019117.4 ± 2.3 h297.2 ± 5.9 d227.8 ± 4.5 d379.9 ± 7.6 l166.1 ± 3.3 g724.0 ± 14.4 ind3.2 ± 0.1 fnd16.9 ± 0.3 i1.6 ± 0.0 i35.6 ± 0.7 f1969.8
2020208.6 ± 4.1 d109.6 ± 2.1 g75.3± 1.51 i953.2 ± 19.0 c246.6 ± 4.9 c1366.2± 27.3 dnd3.5 ± 0.1 end31.9 ± 0.6 g17.8 ± 0.4 d65.1 ± 1.3 d3077.8
202182.9 ± 1.6 j112.2 ± 2.2 g44.6 ± 0.8 k736.9 ± 14.7 f150.0 ± 3.0 h1142.9 ± 22.8 ftr3.7 ± 0.1 bnd19.4 ± 0.3 h9.7 ± 0.2 f26.6 ± 1.1 g2328.9
Daepung2019470.0 ± 9.4 a449.7 ± 8.9 b500.1 ± 10.0 a892.1 ± 17.8 d272.6 ± 5.4 b1408.9 ± 28.1 ctr8.0 ± 0.2 dnd55.5 ± 1.1 c25.0 ± 0.5 b99.3 ± 1.9 b4181.2
2020172.1 ± 3.4 e181.6 ± 3.6 e123.3± 2.47 f1115.8 ± 22.3 b204.9 ± 4.1 e1572.7 ± 31.4 btr4.7 ± 0.1 and42.5 ± 0.8 d19.9± 0.4 c78.1 ± 1.5 c3515.6
2021285.0 ± 5.7 c319.3 ± 6.3 c214.1± 4.2 e1303.3 ± 26.0 a349.1 ± 6.9 a1778.9 ± 35.5 and11.4 ± 0.2 and62.2 ± 1.2 b30.6 ± 0.6 a94.1 ± 2.8 b4448.0
Neulchan2019317.2± 6.3 b310.9 ± 6.2 c299.4 ± 5.9 c848.7 ± 16.9 e264.6 ± 5.2 b1022.8 ± 20.4 gnd5.7 ± 0.1 cnd68.5 ± 1.3 a20.5 ± 0.4 c111.5 ± 2.2 a3269.8
2020133.0 ± 2.6 g97.7 ± 1.9 h89.3 ± 1.7 g965.9 ± 19.3 c141.4 ± 4.8 h1233.3 ± 24.6 end2.6 ± 0.1 ind34.7 ± 0.6 fnd34.0 ± 0.7 f2731.9
2021285.4 ± 5.7 c492.1 ± 9.8 a374.4 ± 7.4 b550.9 ± 11.0 i231.7 ± 4.6 d461.3 ± 9.2 lnd2.7 ± 0.1 ind37.4 ± 0.7 e15.6 ± 0.3 e61.7 ± 1.2 e2513.2
Taekwang201973.6 ± 1.4 k88.7 ± 1.7 i78.8 ± 1.5 h676.3± 13.5 h177.9 ± 3.5 f985.8 ± 25.7 hnd4.3 ± 0.1 dnd12.7 ± 0.2 lnd24.2 ± 0.9 g2122.3
202090.0 ± 1.8 i80.5± 1.6 j66.9± 1.3 j462.3 ± 9.2 j80.9 ± 1.6 m632.1 ± 12.6 jtr2.3 ± 0.1 jnd12.4 ± 0.2 lnd12.9 ± 0.2 k1440.3
202119.4 ± 0.3 m63.5 ± 1.2 k35.9 ± 0.7 l334.0 ± 6.6 m99.2 ± 1.9 k619.5 ± 12.3 jnd2.9 ± 0.1hnd7.8 ± 0.2 mnd10.2 ± 0.2 l1192.4
Average170.7194.5154.4712.4179.5992.60.84.0nd30.19.947.22496.0
1 The values represent mean ± SD. Means with different letters within a column for each sample indicate statistically significant difference (p < 0.05). Content expressed as mg of each component equivalents per g of dried weight. 2 ND, not detected. 3 tr, trace. Din, daidzin; Gly, glycitin; Gin, genistin; MDin, malonyldaidzin; MGly, malonylglycitin; MGin, malonylgenitin; AcDin, acetyldaidzin; AcGly, acetylglycitin; AcGin, acetylgenistin; Dein, dadzein; Glein, glycitein; Gein, genistein.
Disclaimer/Publisher’s Note: The statements, opinions and data contained in all publications are solely those of the individual author(s) and contributor(s) and not of MDPI and/or the editor(s). MDPI and/or the editor(s) disclaim responsibility for any injury to people or property resulting from any ideas, methods, instructions or products referred to in the content.

