Article

Evaluation of Water Balance and Water Use Efficiency with the Development of Water-Saving Irrigation in the Yanqi Basin Irrigation District of China

1
State Key Laboratory of Eco-Hydraulics in Northwest Arid Region of China, School of Water Resources and Hydropower, Xi’an University of Technology, Xi’an 710048, China
2
Key Laboratory of Water Management and Water Security for Yellow River Basin, Ministry of Water Resources, Yellow River Engineering Consulting Co., Ltd., Zhengzhou 450003, China
3
Department of Land and Water Conservation Engineering, Faculty of Agricultural Engineering and Technology, PMAS-Arid Agriculture University Rawalpindi, Rawalpindi 46300, Pakistan
4
School of Environmental Studies, China University of Geosciences, Wuhan 430074, China
*
Authors to whom correspondence should be addressed.
Agronomy 2023, 13(12), 2990; https://doi.org/10.3390/agronomy13122990
Submission received: 9 November 2023 / Revised: 24 November 2023 / Accepted: 28 November 2023 / Published: 5 December 2023

Abstract

:
Irrigation water is the main type of water consumption in the Yanqi Basin irrigation district of Xinjiang, which is an oasis-type irrigation district in the arid region of Northwest China. With the continuous expansion of cultivated areas, there is an increasing demand for irrigation water, resulting in an irrigation efficiency paradox and the phenomenon of “the more water-saving, the more water-scarce”. In this study, the water balance method and the improved IWMI (International Water Management Institute) water balance method were used with remote sensing and statistical data from 1980 to 2020 to analyze the changes in the irrigation water supply, consumption, and loss for improvement in irrigation water use efficiency (IWUE) in the Yanqi Basin. The results showed that there was an upward trend in the cultivated land area in the irrigation district of Yanqi Basin, as monitored with remote sensing from 1980 to 2020, and the values from the remote sensing data were higher than those from the yearbooks. According to the remote sensing data, the arable land area in the irrigation district increased from 1672 km2 in 1980 to 2494 km2 in 2020, thus showing a trend of expansion. The traditional water use efficiency in the irrigation district showed an increasing trend. The lowest value for the field water-use coefficient was 0.70 in 1998, and it exceeded to 0.81 from 2009 to 2020. The canal water-use coefficient was as low as 0.50 in 1998 and increased from 0.54 in 2009 to 0.82 in 2020. The irrigation water-use coefficient increased from 0.35 in 1998 to 0.68 in 2020, with a general upward trend. In this study, the water consumption ratio indicator DFg (depleted fraction), determined using the improved water balance method, increased from 0.8390 in 1980 to 0.8562 in 2020, although it showed an overall decreasing trend, and the average was 0.8436. Cultivated land’s actual irrigation water consumption per unit area reached the highest value of 8.41 × 10⁶ m3/hm2/a in 2011 and the minimum value of 4.01 × 10⁶ m3/hm2/a in 2020, and from 1980 to 2020 it showed a decreasing trend, while the total water diversion showed an increasing trend due to the continuous expansion of arable land. From 1980 to 2020, water diversion into the irrigation district changed from 1.214 km3 to 1.000 km3, and it reached a maximum of 1.593 km3 in 2000; water diversion into the irrigation district showed an overall upward trend. The positive impact of the post-2000 water conservation phase with the adaptation of water-saving irrigation technology was clear, as the findings showed an increase in IWUE in the Yanqi Basin irrigation district. These results provide a theoretical basis for breaking the paradox of irrigation efficiency, which can be used in the water resource management of irrigation districts.

1. Introduction

Agricultural development is a cornerstone of economic growth and social stability, having played a crucial role in China’s economic transformation [1]. The prudent and sustainable use of water resources plays a vital role in supporting such development. Agricultural water is the main consumer (60%) of water resources, and improving sustainable agricultural water management is a key nationwide water challenge that can be addressed via changes in irrigation water use efficiency [2]. Water is indeed a crucial element in food production and human life [3,4], and there is a need to produce more grain for the increasing population; however, in China, the proportion of agricultural water use is decreasing due to inter-sector competition for water [2]. Sustainable water management in agricultural development is a key water challenge, and water conservation adaptation measures such as water-saving infrastructures, technologies, and agronomic practices, have contributed to easing the pressure of current agricultural water demand [5].
Using the water balance approach, it is possible to calculate each of the water balance items. Long Aihua, Deng Mingjiang, et al. investigated the water balance in Lake Balkhash and discussed the impacts of water inflow from the Ili Delta, human activities, and climate change on the water balance of Lake Balkhash through the change in water volume, so as to provide a reference basis for decision-making regarding ecological protection [6]. Ecological water demand calculations are also possible using the water balance approach [7], and it has been argued that, only by identifying hydrological and ecological interactions on the basis of the hydrological cycle and water balance can we reasonably estimate ecological water demand [8] and provide a more effective scientific basis. A study of simulated projected crop water demand under different scenarios was conducted for the counties and cities contained in the Yanqi Basin [9], in which the impact of global warming on crop water demand in the Yanqi Basin region was analyzed and predicted. In Northwest China, where there is a lack of monitoring information, it is difficult to evaluate the consumption of water resources, and the application of remote sensing [10] and modeling [11] is more economical, applicable, and efficient. Quantitative assessment of the soil–atmosphere transformation processes using remotely sensed data provides a better understanding of the relationship between crop growth and water resource management [12]. The effectiveness of spatiotemporal engineering of land surface evapotranspiration and irrigation water consumption in the Yanqi Basin at the farmland scale was evaluated using MODIS remote sensing data and HTEM (hybrid dual-source scheme and trapezoid framework-based evapotranspiration model) [13] modeling of this region [14]. In that study, remote sensing was used to identify the area of arable land [15], compensating for the limitations of statistical data that can only be counted at the county and city levels, as well as the problem of data accuracy, making the results more rapid and accurate.
According to the findings of Kang et al. [16], irrigation water use accounts for more than 90% of agricultural water use. Therefore, it is necessary to improve irrigation water use efficiency (IWUE) via irrigation water-saving technologies on a priority basis. The IWUE is about 0.5 in China, while it exceeds 0.7 in other parts of the developed world [2,17]. The improvement in irrigation water use efficiency (IWUE) is the main driving factor of sustainable social and economic development [18], and many countries (including China) consider it to be a core issue. Researchers and scientists around the world have conducted various studies on the issue of water use efficiency; to name a few, a global-scale analysis was performed by Wallace [19] on how to increase agricultural water use efficiency to meet future food production demands, Wang et al. [20] examined the water use efficiency of irrigated crops in North China, Lilienfeld, and Asmild [21] determined the impacts of irrigation systems on irrigation water use efficiency in the western United States. Similarly, irrigation water use efficiency was evaluated by Andre et al. [22] in Spain, Varghese et al. [23] in India, and Drew and Crase [24] highlighted the importance of more crop per drop and water use efficiency in the National Water Policy of Pakistan. Based upon the literature concerning water use efficiency in China and elsewhere, this study has been performed in the Yanqi basin, an oasis-type irrigated area, located in Xinjiang, China. Irrigation water utilization efficiency indicators [25] comprehensively reflect the condition of irrigation projects, the level of water use management and the level of irrigation technology at different scales, etc., and are important indicators for the evaluation of the efficiency of water-saving irrigation projects. Irrigation water use efficiency (IWUE) indicators refer to all indicators related to the efficiency and effectiveness of irrigation water use, including irrigation efficiency, water productivity, water consumption ratio, and the proportion of beneficial water consumption [26]. Conventional irrigation efficiency metrics lead to differences at the field scale versus the irrigation system scale [27], and it is clear from field efficiency analyses in the Nile Basin in Egypt that there is little to be gained from improving field irrigation efficiency to achieve increased efficiency in system-wide water savings. To overcome the shortcomings of traditional irrigation efficiency indicators, some scholars [28] have proposed the use of “proportionality” as an alternative to field irrigation efficiency indicators, as well as the use of effective efficiency [29] to differentiate between the concepts of water use efficiency at any scale. The International Water Management Institute (IWMI) [30] proposes a complete water balance calculation framework, related terminology, and evaluation indexes using the concept of water balance [31,32]. Traditional water use efficiency evaluation at the irrigation district scale involves mainly application of the canal water use coefficient, field water use coefficient, and irrigation water use coefficient, with an emphasis on the effects of regression water reuse and changes in the cropping structure on the amount of water consumed [33]. The efficiency indicators proposed by the improved IWMI take into account the effects of regression water reuse, but the scale effects of water quality are not considered in this framework, and data acquisition is more difficult. In this study, the water consumption proportion indicator (depleted fraction) of the improved IWMI water balance method was used for water use efficiency evaluation. The depleted fraction is the ratio of water consumption to gross inflow, also known as the water depletion coefficient, which interconnects the water balance parameters of an irrigation district and facilitates managers to obtain the relevant rate of change in water storage; a water depletion fraction index scale value of greater than 0.6 indicates that the area has less water storage [34,35] and consumes more water. From the data for the Yanqi Basin irrigation districts, it is easier to obtain the sum of actual water consumption, irrigation diversion, and effective precipitation, and in the in the process of water balance analysis, the water consumption ratio index is easier to calculate than the water beneficial consumption index and water productivity.
Xinjiang is an important economic crop production region under arid and semi-arid climate located in the northwest of China, contributing about 17% of total country area and 42% of desert area of China [36], and this irrigation district is the main area for agricultural development with cotton and grain production in the arid zone being a central pillar in national food security [37]. More than 80% of the total water here is used for irrigation, typically known as “desert oasis, irrigation agriculture”. With the increase in socio-economic water demand, the problem of water shortages in the northwest arid zone of China is becoming acute, which is the main restriction in the agricultural development in these irrigated areas. Abundant land resources with water resource shortages have led scientists toward the imperative development of water-saving irrigation in the Xinjiang region [38]. High-efficiency water-saving irrigation technology has paved the way to ease the agricultural water demand in Xinjiang to a certain extent, but the dual role of safeguarding food security and providing economic benefits of farmers has created the continuous expansion of irrigated areas in the region [39,40]. This difficult situation has led to to the phenomena of more water-saving, more water scarcity, and more water shortages, which is termed here as the irrigation efficiency paradox [41,42].
With the objective of breaking the paradox of irrigation efficiency, the Yanqi Basin irrigation district of Xinjiang was selected to analyze the water balance and water use efficiency before and after different water-saving irrigation stages. The water balance and improved IWMI water balance methods were used with the help of statistical and remote sensing data analysis to study the changes in the cultivated area and the water balance items such as the trends in irrigation water consumption, and to identify the influencing factors of these changes in the irrigation area. Traditional water use efficiency and water consumption ratio indicators are selected for trend analysis to analyze the changes in water use efficiency.
Irrigation districts are the basic units of irrigated agriculture, and this study focuses on the evaluation of water balance and irrigation water efficiency at the irrigation district scale and explores the impact of the development of water-saving technologies on water balance and water use efficiency. This is achieved through monitoring the area of cultivated land in irrigation districts through remote sensing, collecting statistical data on each water balance item in irrigation districts by using statistical annual reports, yearbooks and literature, and studying changes in the area of cultivated land and each water balance item in irrigation districts. The income and expenditure related to the water balance items were obtained to calculate the water consumption of the irrigation district using the water balance method for the irrigation district and to analyze the trends in the changes in each item and study the factors influencing the changes in water consumption in the irrigation district. Traditional water use efficiency and water consumption ratio indicators were selected for trend analysis, and the change in water use efficiency in irrigation districts was analyzed. Evaluating the development trend of water use efficiency in the irrigation districts along with water-saving technologies provides a reliable basis for the use of water resources in irrigation districts in arid and semi-arid regions and the implementation of high-efficiency water-saving irrigation projects, which can fully reflect the strategic importance of “hiding grain in the ground and grain in technology” [43].

2. Materials and Methods

2.1. Study Area

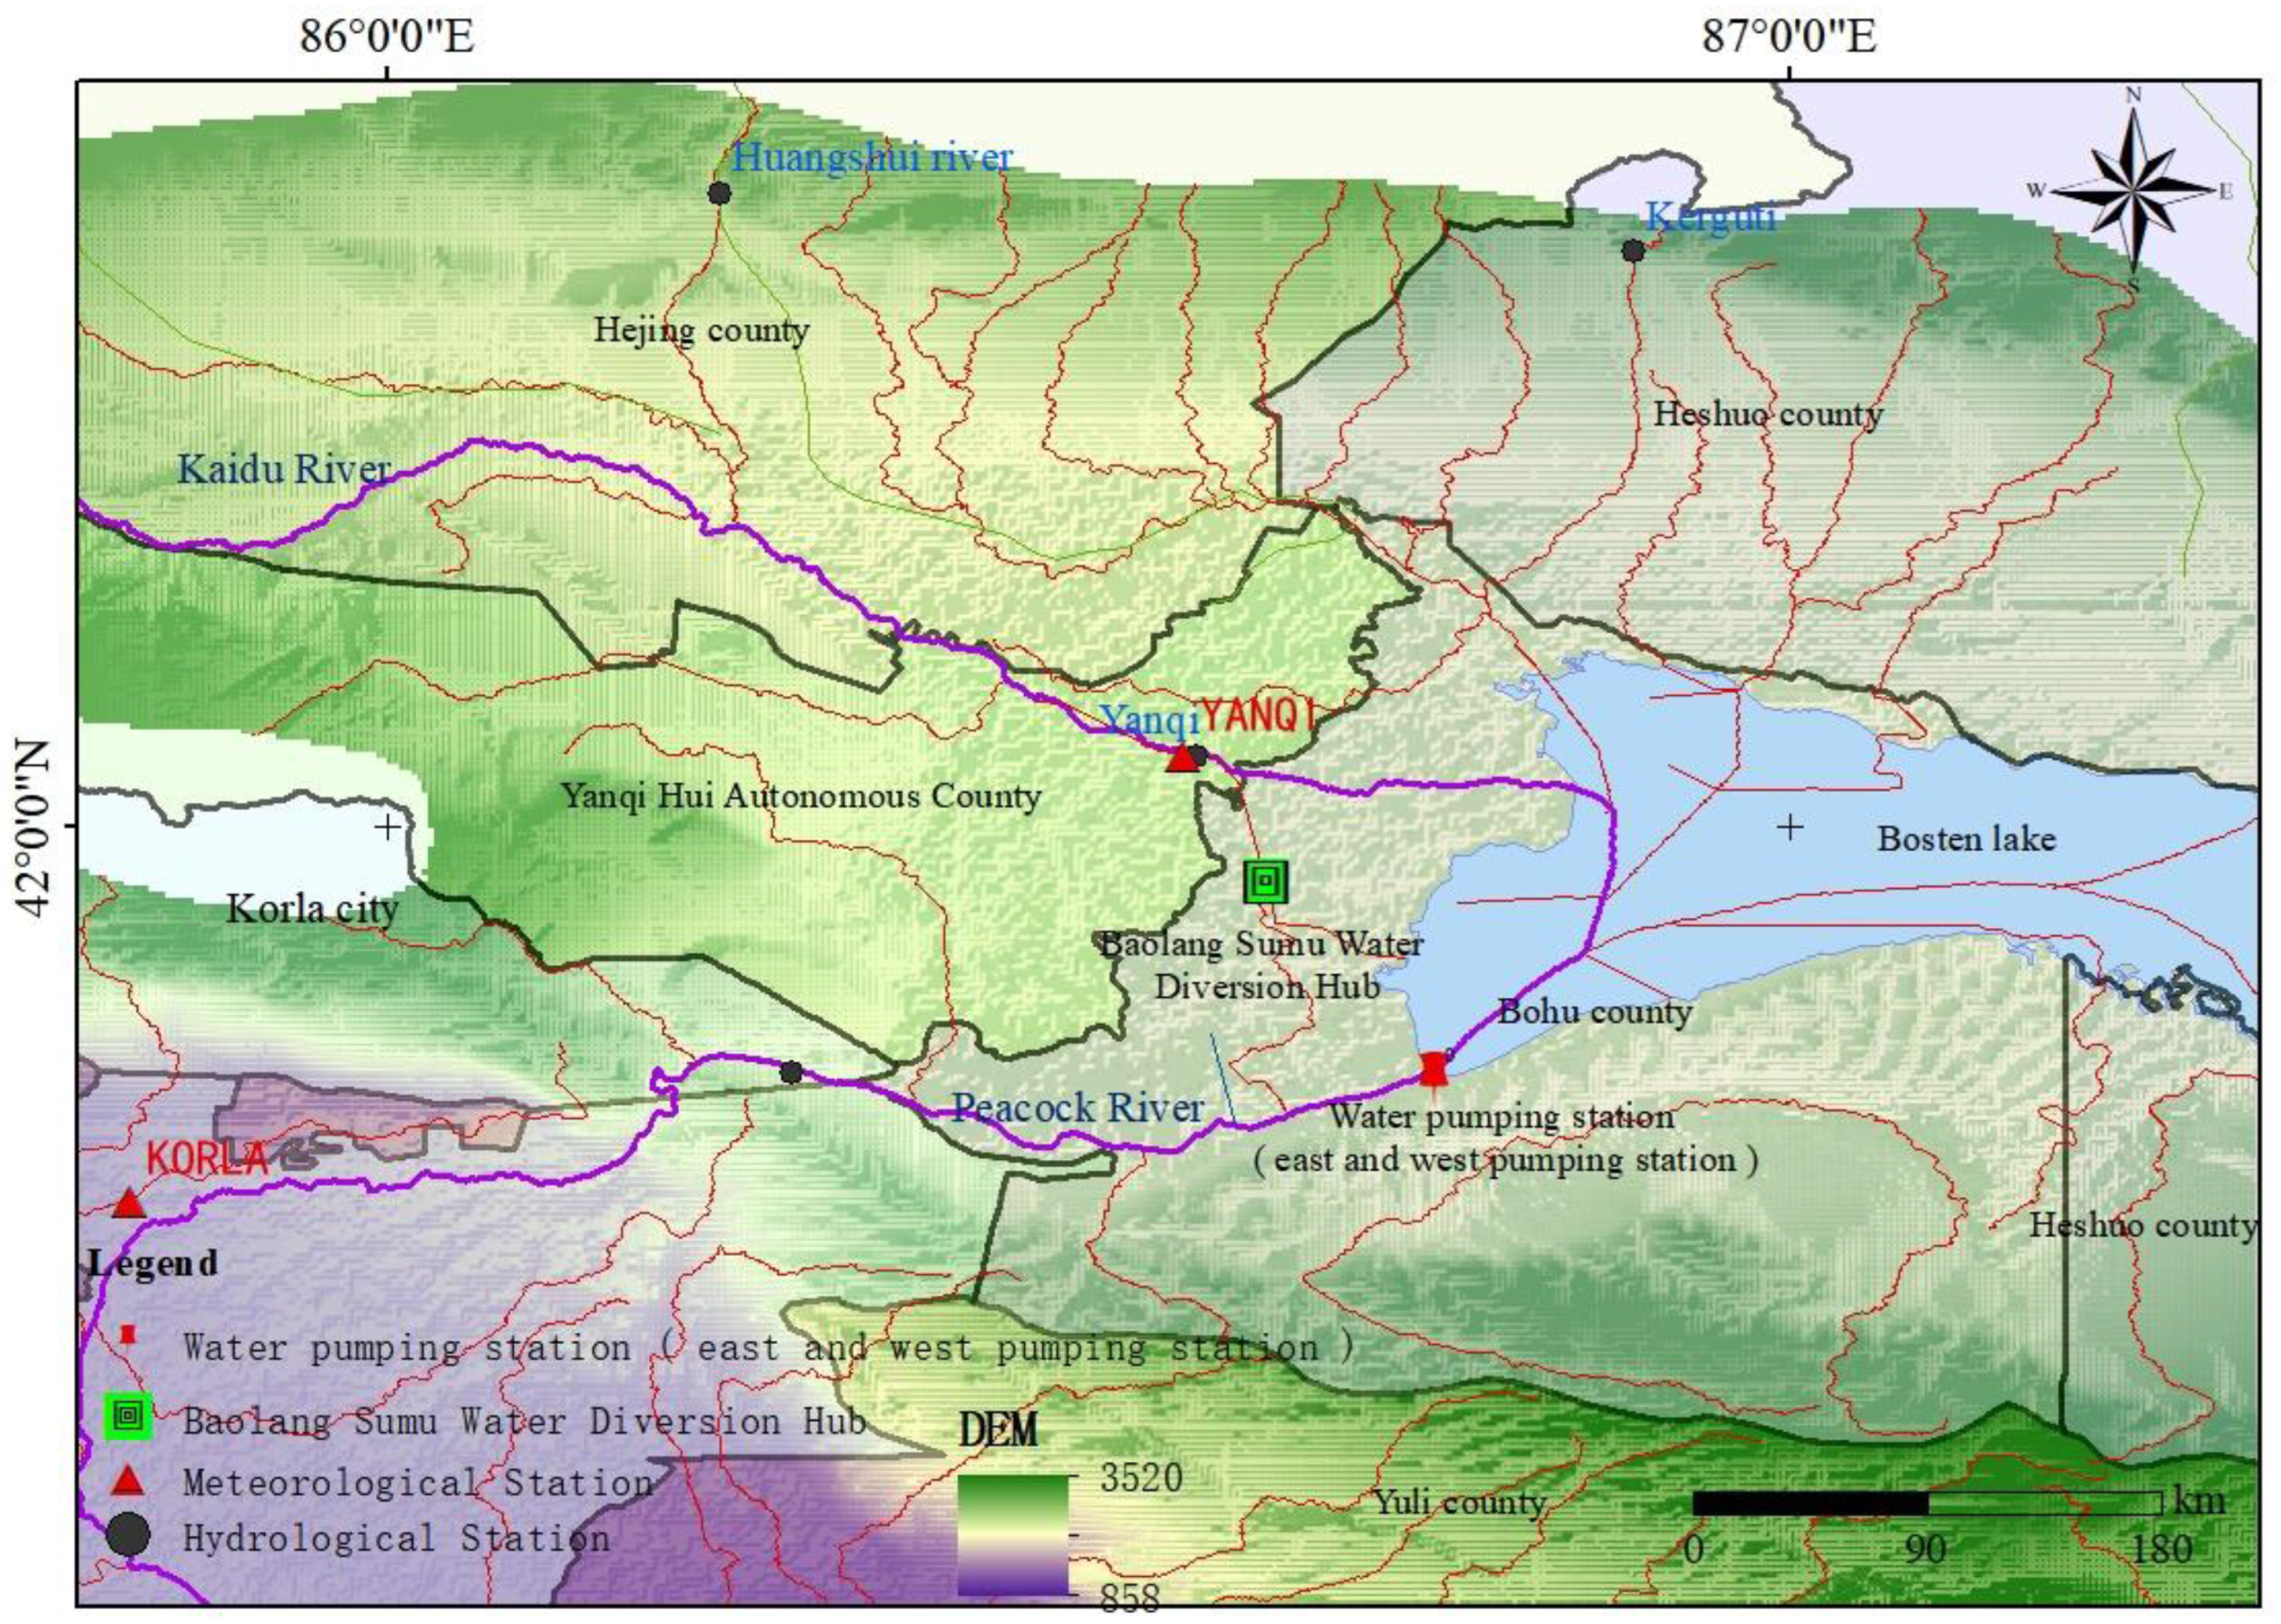
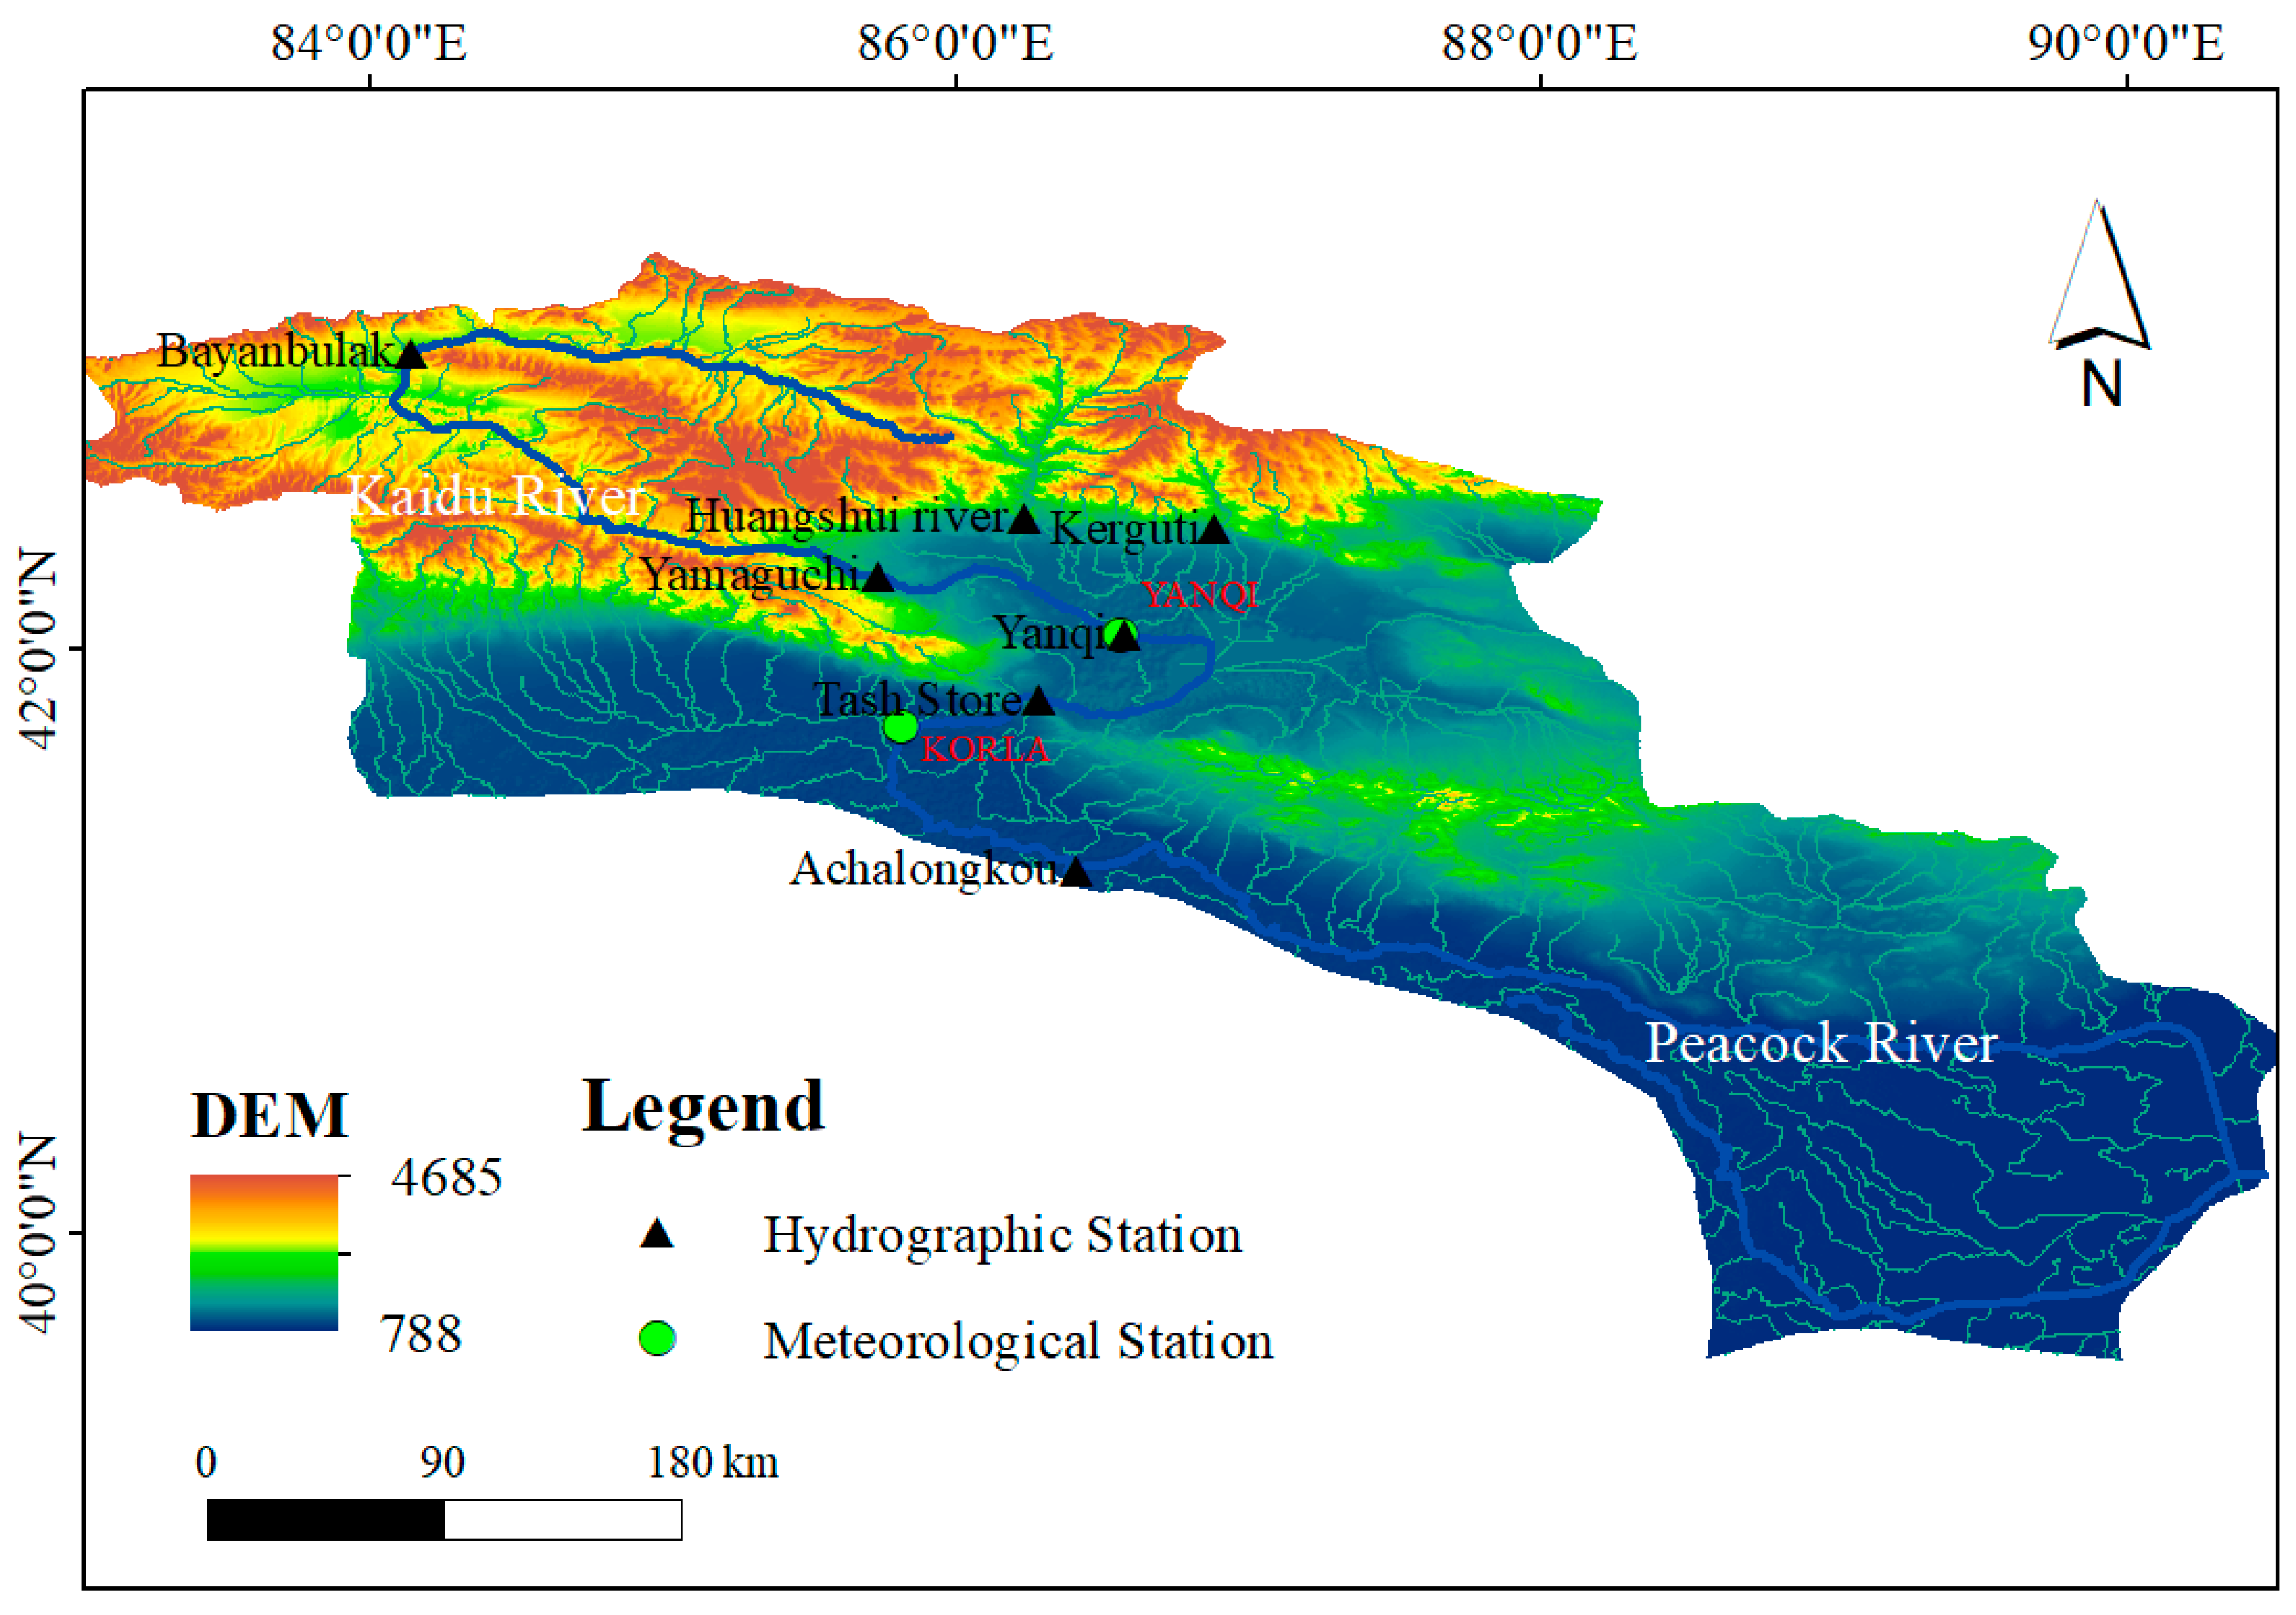
Yanqi Basin irrigation district (Kaidu River irrigation district) is located in the Bayingol Mongolian Autonomous Prefecture in the southern part of the Xinjiang Uygur Autonomous Region, in the plains of the Kaidu River Basin; the irrigation district is located in the Yanqi Basin, and the specific geographic location is shown in Figure 1. It includes Hejing County, Yanqi County, Bohu County, and part of Heshuo County in Bayingolin, Bayingolin Zhiulastai Farm and Qingshuihe Farm, as well as the 6 regiments of the Second Agricultural Division, as shown in Figure 2.
The Yanqi Basin is a semi-enclosed basin terrain that is high in the north and low in the south in addition to being tilted from the northwest to southeast, with the lowest point being Bosten Lake [44], the lake surface elevation of which is about 1045 m. The main types of landforms in the basin are: dorsal sloping hills, thin soil layer floodplain alluvial plains, Kaidu River delta plains, and Bosten Lake wetlands.
The plain area of Yanqi Basin, where the irrigation district is located, has flat ground and good vegetation, and is a densely populated agricultural and pastoral area. Yanqi Basin irrigation district is the main grain, cotton, oil, melon, and aquatic base in Xinjiang. The irrigated area of Yanqi Basin irrigation district is about 183 hm2 as of 2020. The main cash crops planted in the area are wheat, maize, cotton, industrial chili, and industrial tomatoes. The GDP of the Basin will reach CNY 22,300 million by 2020, and the total sown area of the grain crops will be 37.613 hm2.The vegetation is mainly composed of reeds, hyacinth, etc.
Yanqi Basin irrigation district is located in the middle of the Eurasian continent where the ocean climate influence is very weak, and it is arid, has less rain and strong evaporation, and is characterized by a warm temperate continental desert climate; it is hot in summer, cold and with less snow in winter, has sunny days all year round, large amounts of sunshine and solar radiation energy, and a large difference between day and night temperatures [45]. The gales in the area are mostly concentrated in late spring and early summer, and there are 3~4 d of dry and hot winds every year. High winds and sand, floating dust, and dry and hot winds in spring and summer are very harmful to agricultural production and the people.
The Yanqi Basin is also known as the “Bosten Lake depression” [46], and during development, it inherited its position in the South Tianmen oblique fold belt in the late Hercynian depression; due to the alpine movement, and regarding the formation of a stepped depression basement, the depression basement is mainly of a Late Palaeozoic stratigraphy, especially regarding the existence and distribution of the mountain front belt and the depression inside the deep and large fracture, which controls and influences the evolution of the basin.
Inside the basin, the Quaternary alluvial, swamp, and lake deposits are widely distributed, and the lithological structure of the strata gradually becomes finer from the north-west to the south-east, mainly dominated by sand and gravel, medium-coarse sand, medium-fine sand, sandy loam, and sub-clay.
The main confluent tributaries of the Kaidu River irrigation district [47] are the Huangshuigou and Wulastai Rivers, which belong to the Kaidu River system, and the DEM map of the Kaidu–Kongqi River basin is shown in Figure 3. The runoff of the Kaidu River during the abundant water period from April to September accounts for 73.8% of the annual runoff, and the runoff during the dry water period from October to March accounts for 26.2% of the annual runoff. The upper reaches of the river are well vegetated, with little pollution, low sand content, and good water quality; a multi-stage gradient power station is planned for the middle reaches of the river. The downstream is mainly an area of human activities, with high water consumption [47,48]. The topography of the Kaidu River system shows a fan-shaped distribution from the north-west to the southeast, and the plane form of the main stream is mainly subject to the constraints of the mountainous terrain conditions, from the source of the river to the small Yuledus Valley river from east to west to Bayinbruk, from which the south folds all the way to the east through more than thirty tributaries into the large Yuledus Valley below, where thirty gorges converge into the Kaidu River.
The water system of Yanqi Basin mainly originates in the west and north, and the main rivers are the Kaidu River and Huangshuigou, of which the Kaidu River is the largest river in the basin; the Qingshui River, Wulastai River and Huangshuigou can flow into Bosten Lake only in the flooding period, and the Peacock River is the only river outflow of Bosten Lake. The main source of water diversion in Yanqi Basin irrigation district is the Kaidu River, and in the water supply system of the Kaidu River irrigation district, there are three important diversion hubs, namely, the first diversion hub of the Kaidu River (Dashankou–first diversion hub: 46 km), the second diversion hub of the Kaidu River (the first diversion hub–second diversion hub: 10 km), and the third diversion hub of the Kaidu River (i.e., Baolangsumu Diversion Gate, the second diversion hub–third diversion hub: 9.61 km).
Before 1980, the Yanqi Basin underwent a process of great exploitation of its soil and water resources, with large amounts of surface water being introduced for agricultural irrigation, and the main method of irrigation in agriculture being flood irrigation, which had a great impact on agriculture and the ecological environment. By 2000, this pattern developed into the stage of conventional water-saving irrigation technology, which utilizes a combination of wells and canals for saving irrigation water and reducing losses of water in the field and in the canal delivery process. In the present phase, the scale of water-saving irrigation in the basin is expanding, and the proportion of well irrigation in irrigation technology is increasing, the area of arable land under surface water diffuse irrigation is decreasing, and efficient water-saving irrigation technology is developing rapidly.

2.2. Data

The spatiotemporal data were collected from different sources, as given in Table 1. The data include remote sensing data, observed station data, and irrigation area statistics. Remote sensing monitoring data of China’s 1 km land use status were downloaded from China Science Resource and Environment Science Data Centre (CSRESDC) to extract the change in cultivated land area of the irrigation district. There is one meteorological station located at Yanqi and climatological data (average temperature, maximum temperature, minimum temperature, relative humidity, average wind speed, wind direction, precipitation, evaporation, atmospheric pressure) were downloaded from the National Meteorological Center (NMC). The consumption of water resources data by various sector in the study region were collected from Bayingolin Statistical Yearbook and Bayingolin Water Resources Bulletin. Data from the literature were used to obtain the field water utilization coefficients, canal water utilization coefficients, and irrigation water utilization coefficients for the irrigation area.

2.3. Water Balance Analysis

The water balance method [48] is the water cycle balance of inputs and outputs [49], here used to analyze the inflows, transformation, and consumption at different scales to break the paradox of irrigation efficiency [50]. The irrigation district scale mainly considers the processes of water supply, consumption, and drainage, such as canal transmission, field irrigation, and farmland drainage, and combines the farmland scale model and the basin hydrological model are combined to study the elements of water balance [51].
To study the water balance parameters (canal transmission, field irrigation, and farmland drainage) at the irrigation district scale, a basin-scale farmland hydrological coupled model was developed according to Equation (1) [52].
Q G = Q O U + ( E t r + E q ) × S + Q G G Q Δ
where: QG is the total water used in the irrigation district, QOU is the drainage of farmland, Etr and Eq are the crop transpiration and evaporation, QGG is the groundwater exchange, and QΔ is the algebraic sum of other water entering and flowing into the irrigation district, S is the cultivated land area in irrigation areas. The water consumption within irrigation areas was calculated on yearly basis, with the objective to understand the impact of conventional water-saving irrigation technology in 1980–2000, and high-efficiency water-saving irrigation technology in 2001–2020, on the water consumption within irrigation areas. The water balance equations for the irrigation districts in the Yanqi Basin are as follows.
I W + P W = E W + O + Δ S
where, IW is the amount of water diverted from the Kaidu River to the irrigation district. PW is the amount of precipitation in the irrigation district, and EW is the water consumption, O is the discharge, and ΔS is the change in water storage, which for inter-annual variation can be considered as ΔS ≈ 0; all values were used in 106 m3.

2.4. Irrigation Water Used Efficiency Analysis

2.4.1. Traditional Water Use Efficiency Indicators

The farm scale is generally expressed in terms of the field water use coefficient (FWUC) [53] calculated using Equation (4), and crop water productivity (CWP) [54] was calculated using Equation (3).
W U E = 0.1 Y / E T
where, WUE refers to crop water use efficiency (kg/m3); Y is the crop yield (kg/hm2); ET refers to evapotranspiration from farmland in mm.
During the process of water conveyance from source to field for use in plant growth, there is a need to assess the corresponding water use efficiencies such as the canal water utilization coefficient (conveyance efficiency), field water utilization coefficient (field water use efficiency), and crop water utilization efficiency (crop water use efficiency) [55], respectively. These coefficients [56] are mainly analyzed at the irrigation scale, focusing on the reuse of return water and the impact of changes in crop cropping structure on water consumption, and these efficiencies are some of the most commonly used indicators in the agricultural water use efficiency metrics [26,57]. The main analyses at the irrigation district scale include the canal water use coefficient, the field water use coefficient, and the irrigation water use coefficient, focusing on the reuse of return water and the impact of changes in crop cropping structure on water consumption. Irrigation water use efficiency is defined as follows [58]:
E c = W f / W d , E f = W r / W f , E i = E c * E f = W r / W d
where, Ec is the canal water utilization coefficient, Ef is the field water utilization coefficient, and Ei is the irrigation water utilization coefficient; Wd refers to the total amount of water diverted from the head of the canal, Wf is the amount of irrigation water that enters the field, and Wr refers to the amount of water that is irrigated into the rhizosphere of the crop.

2.4.2. Improved IWMI Water Balance Method

Irrigation water use efficiency evaluation may lead to uncertainties due to its assessment at different scales [28,59], such as farm level, districts level, and basin level. The evaluation methodology should be adapted according to scale as is explained by the improved IWMI method of water balance shown in Figure 4.
It has been argued that the classical concept of “efficiency” may not be appropriate for water management and planning at the basin level, and does not take into account the potential reuse of water in larger hydrological systems. In later developments, many scholars have proposed that agricultural water productivity should be used to achieve real water savings, and that water productivity indicators should be used to harmonise water use efficiency [60,61] at different scales. Therefore the water balance method proposed by IWMI [62] is commonly used, which solves the problem of inconsistent water use efficiency at different spatial scales [32,63,64]. However, this approach lacks validation regarding its applicability in the Northwest Arid Zone along with research on improvement strategies that take into account the characteristics of water consumption in oases and salinization problems.
Water use efficiency at the farmland, irrigation district, and watershed scales can be expressed with three indicators, namely, depleted fraction, beneficial utilization, and productivity of water, based on different scales of water balance.
The depleted fraction [32] is
D F g = D / G
where DFg refers to the water consumption factor; D is the water consumption in mm; G is the gross inflow in mm and can also be expressed in terms of net inflow and available water.
The beneficial utilization is
B U a = B D / A
where BUa refers to the beneficial water use coefficient, BD is the beneficial water consumption in mm, and A is the available water in mm, and it can also be expressed in terms of gross inflow, net inflow, and consumption. To determine BUa, it is necessary to determine which part of the consumed water is beneficial and which part is non-beneficial. Salinization is an important problem in oases in arid zones that threatens crop yields; therefore, the amount of saline leaching water is considered as the effective consumptive water.
The productivity of water [65] is
P W a = Y / A
where PWa refers to the output efficiency of available water, Y is the amount of output, which can be expressed in terms of crop yield (kg) or crop revenue (CNY), and A is the amount of available water in mm, which can also be expressed in terms of gross inflow, net inflow, and consumptive use. The concept of PWa in agriculture is close to that of crop water use efficiency.

3. Results

3.1. Irrigation District Development in the Kaidu River Irrigation District

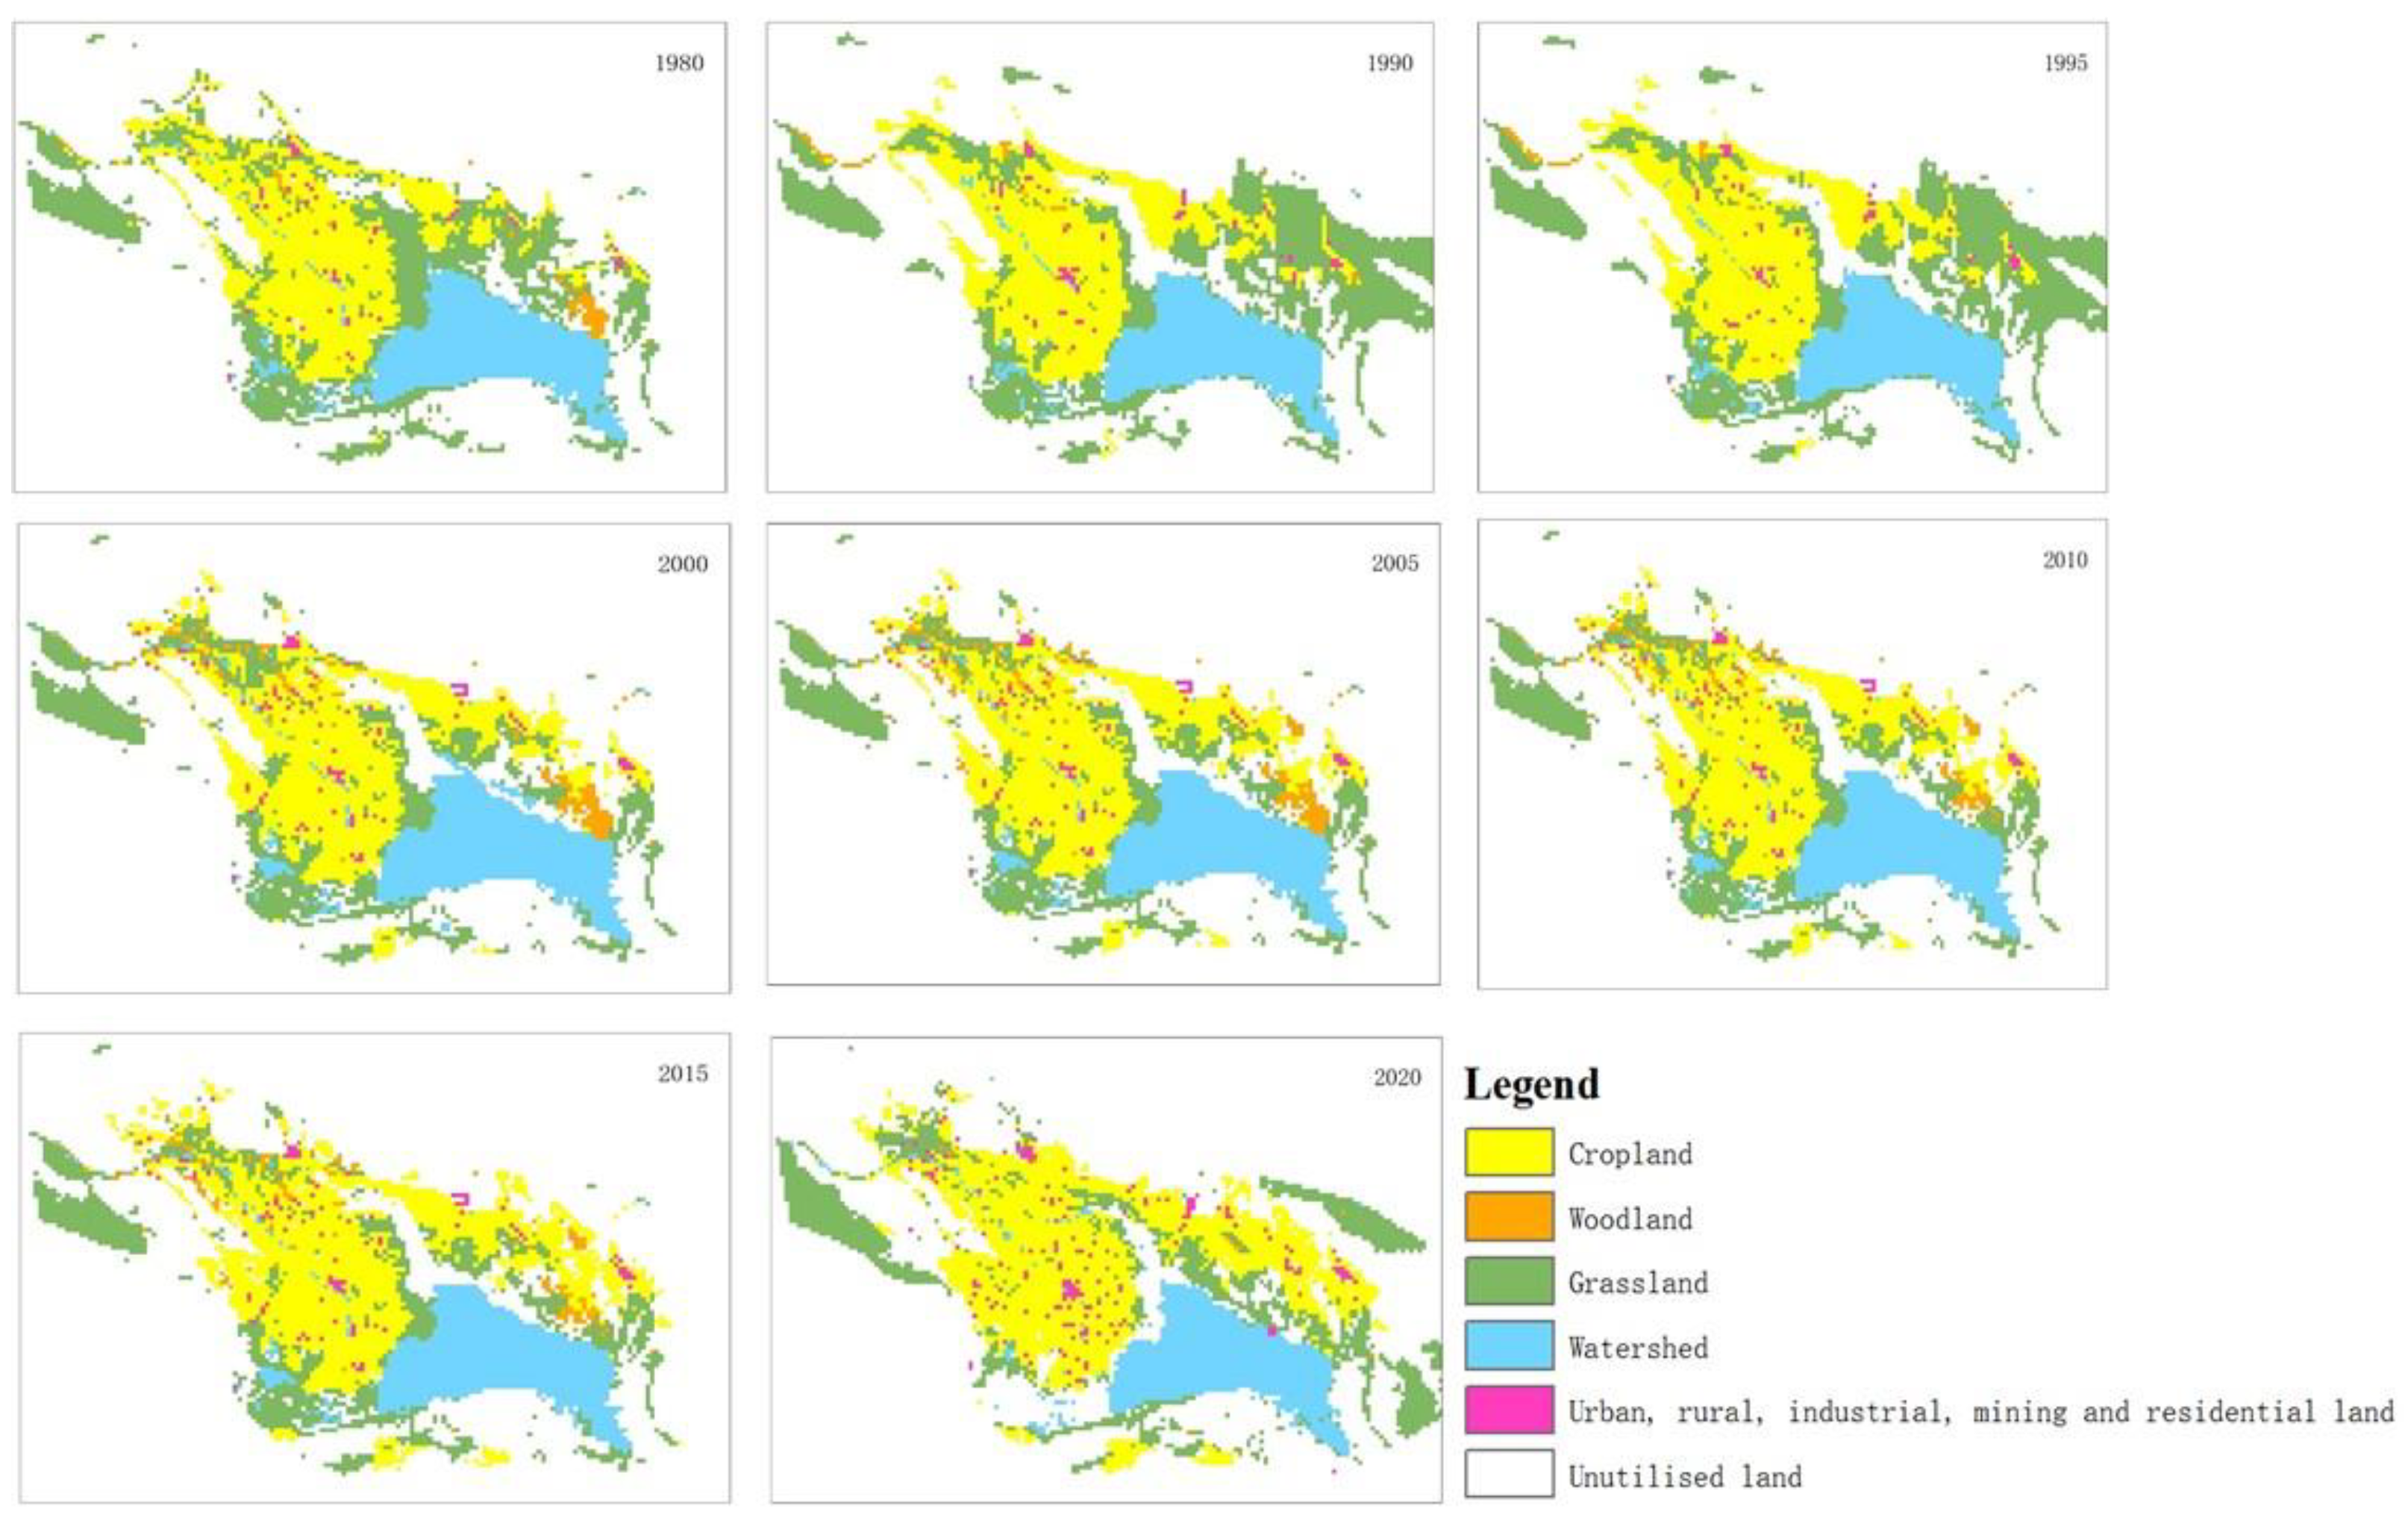
Trend analysis for the changes in the area of arable land was carried out using remote sensing monitoring data on the current 1 km land use status in China from 1980 to 2020, and the distribution of arable land is shown in Figure 5. Cultivated land area and residential construction land in the irrigation district show an increasing trend, and in the east, the size of the cultivated land area increases significantly. The trend in forest and grassland converted to cultivated land is clear. Agglomeration of residential urban and rural land is more dispersed. And the cultivated area of the irrigation district is mainly centered on Bosten Lake and spreads out in all directions.
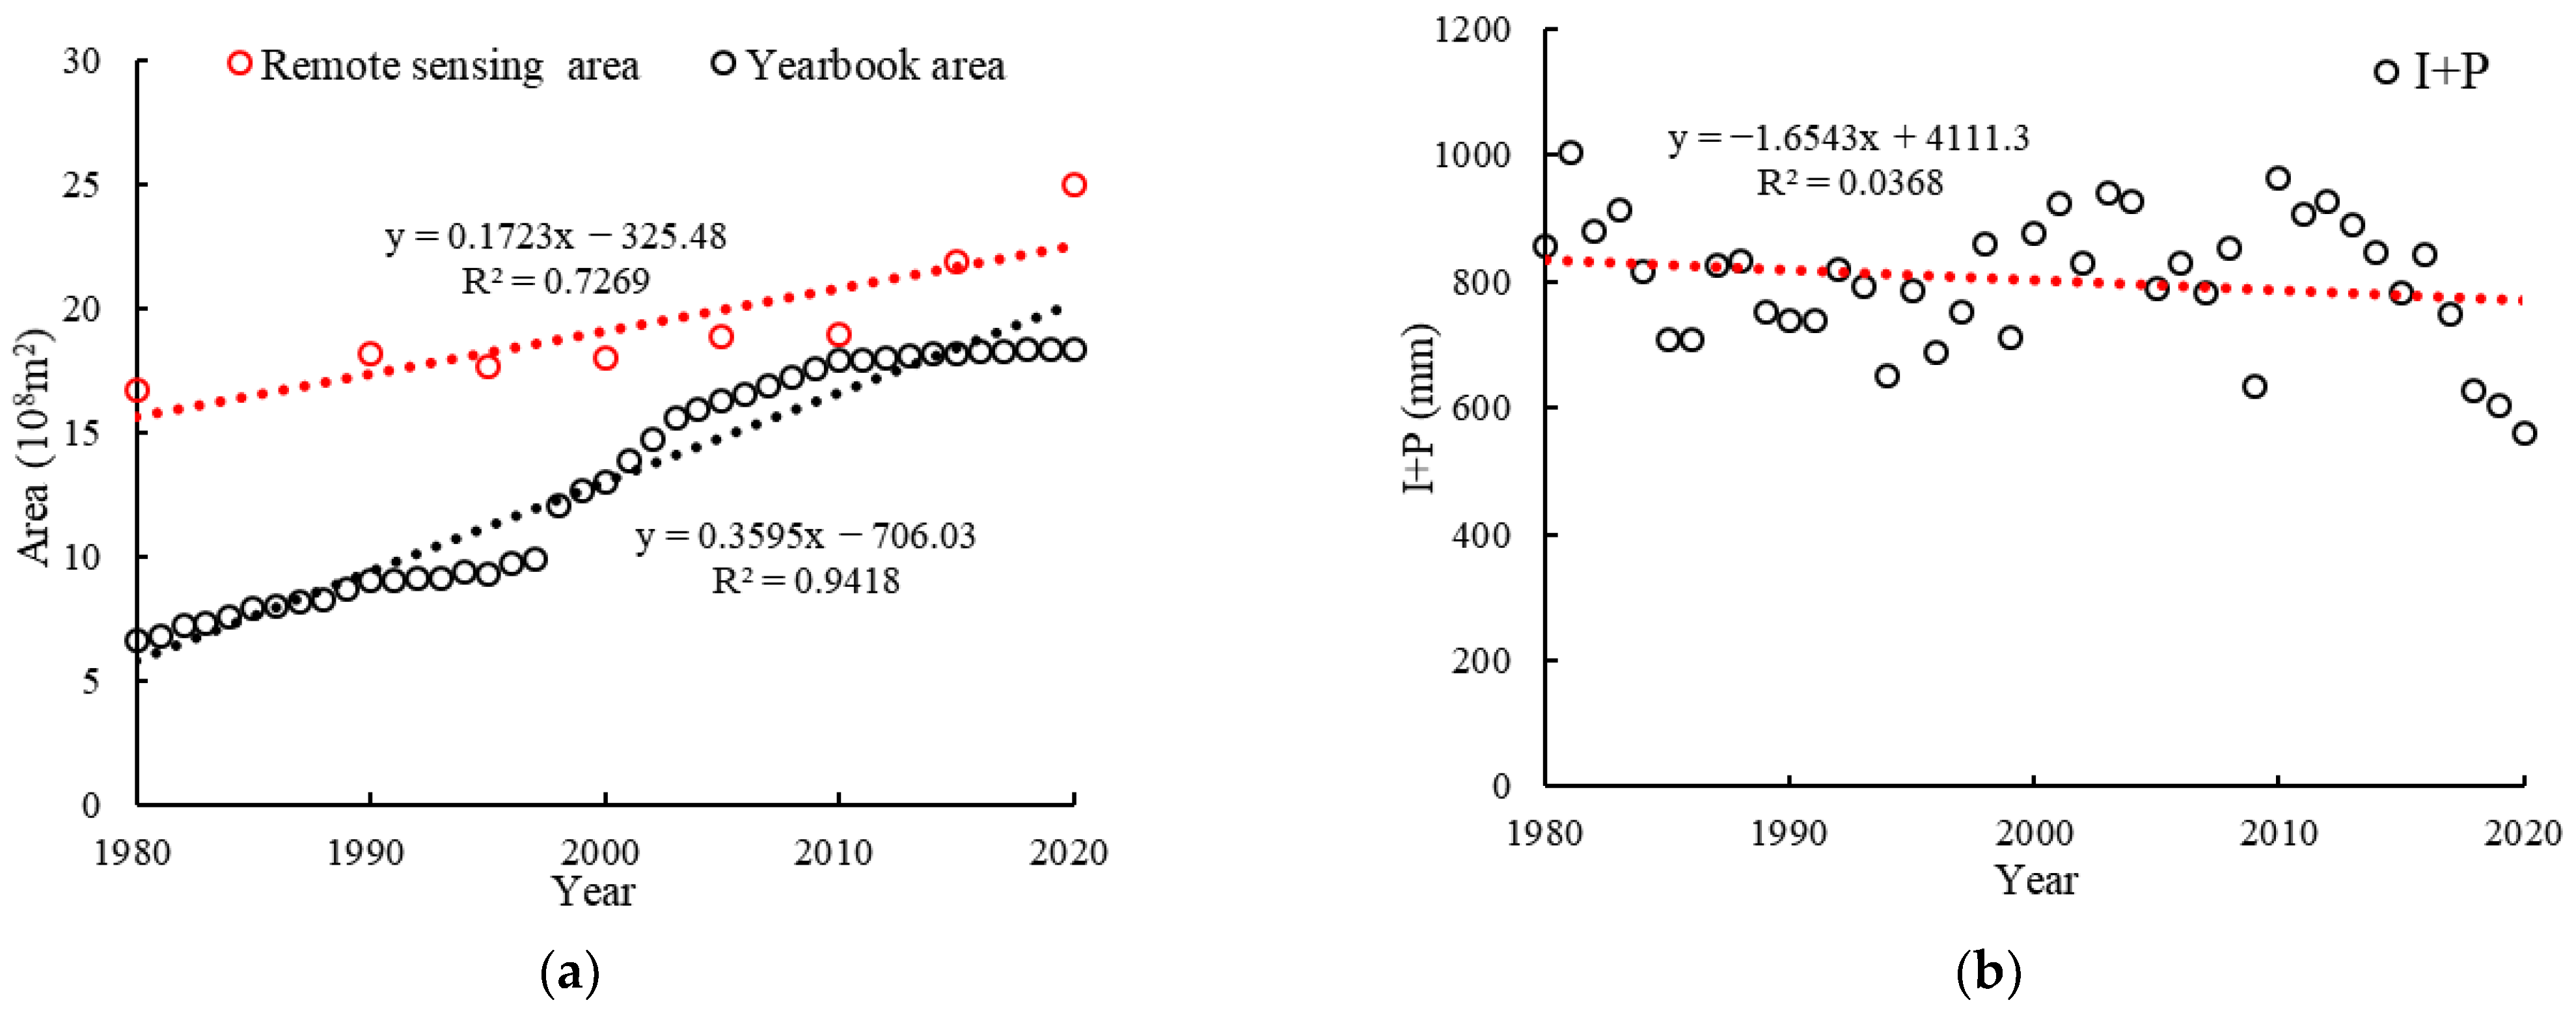
Based on the statistical data for the irrigated area in the irrigation district and the remote sensing data for the current 1 km land use status in China from 1980 to 2020, the actual irrigation water consumption per unit of cultivated land area reached the highest value of 8.41 × 10⁶ m3/hm2/a in 2011 and the minimum value of 4.01 × 10⁶ m3/hm2/a in 2020 from 1980 to 2020. The irrigated area of arable land [66] in the irrigation district of the Yanqi Basin shows an increasing trend from 1980 to 2020, and the remotely sensed area is larger than indicated in the statistical data.

3.2. Analysis of Water Supply and Demand in Irrigation Districts

The water consumption of different sectors in Yanqi Basin irrigation district from 2009 to 2020 is shown in Table 2, with the average share of agricultural water consumption reaching 92.8%, of which the average share of groundwater consumption by industry reaches 37.7%. The analysis reveals that the ecological and environmental water replenishment of the irrigation district shows a trend of rising year by year after 2015, and the main share of water use in the irrigation district is agricultural water use (Table 3), followed by ecological and environmental water replenishment, and the amount of industrial water use exceeds the water used for residential life.
From the Bayingol Statistical Yearbook and the Water Resources Bulletin, we were able to obtain statistics for water supply and water consumption (Table 4) and irrigated area (Table 5) in the irrigation districts and the crops in Hejing County, Yanqi County, Bohu County, and Heshuo County, as well as those in the Second Agricultural Division. The data for the amount of water supplied from the surface water, the amount of water supplied from the ground water, and the amount of water consumption are shown in Table 4.
An analysis of Table 2 and Table 4 shows that the agricultural irrigation water is mainly from surface water, with an average value of 1.012 km3 in 1998 and 2009–2020, the water drainage volume of farmland is low, and the main share of water resources consumption in the irrigation district is agricultural irrigation.
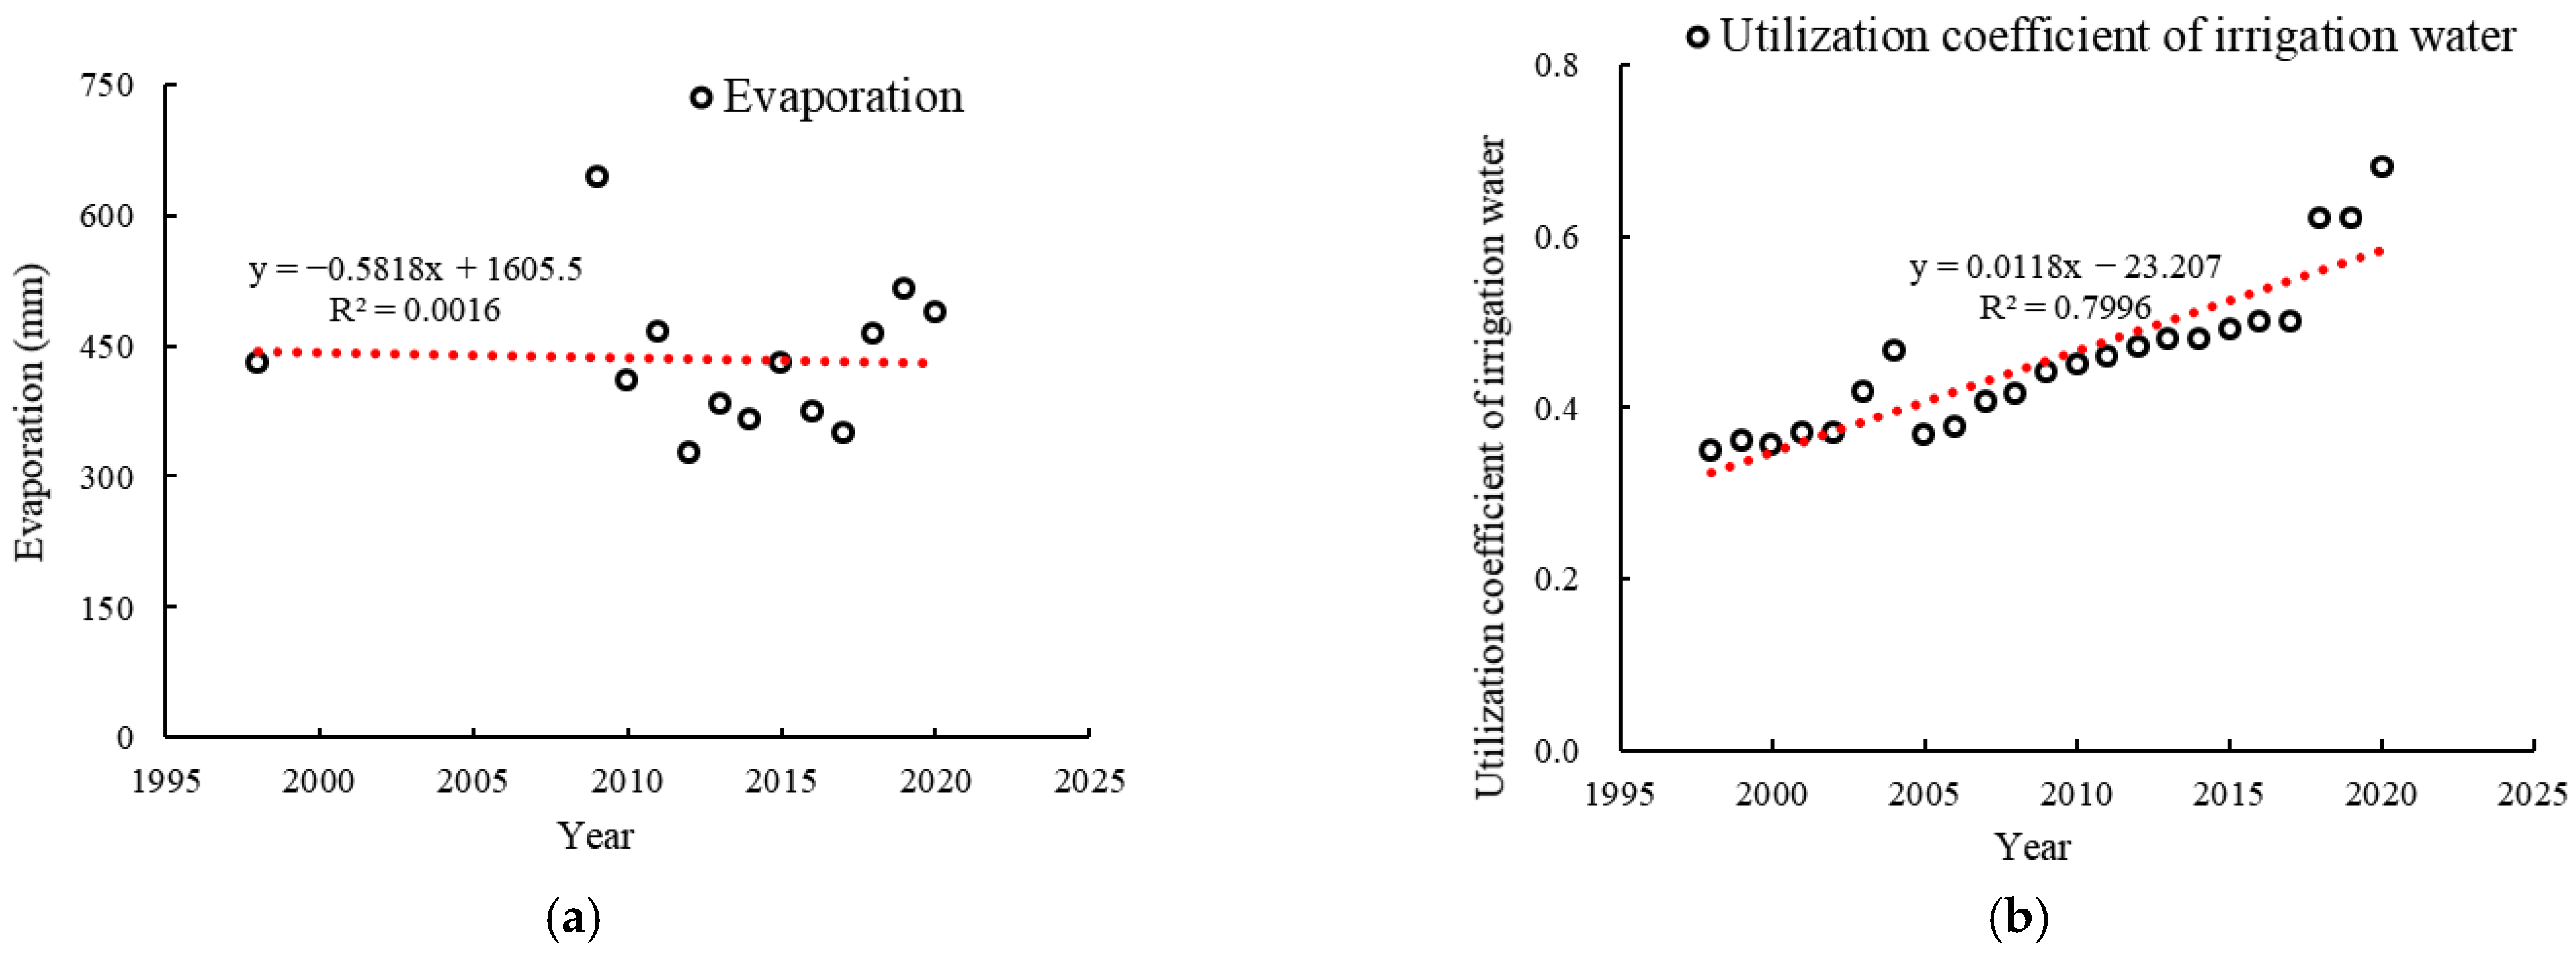
The relationship between water supply and water use in the irrigation district, shown in Figure 6, showed that water supply is higher than water use in the irrigation district, indicating that the water demand for the agricultural economy of the area is met. In 2009, water supply and water consumption in the irrigation district were the highest, and after 2010, the water supply in the irrigation district was at a stable level, as shown in Figure 6, where the trend of water consumption in the irrigation district is consistent with the trend of water supply in the irrigation district, and as shown in Figure 7a, where the water consumption per unit area of the irrigation district exhibits a downward trend.
Analyzing Table 3 and Figure 7a shows that, from 1998 to 2020, the average value of evapotranspiration in the irrigation district is 434.1 mm, with an overall trend of slowly decreasing. As shown in Figure 7b, the irrigation coefficient of the irrigation district has been improved, which indicates that the promotion of water-saving irrigation technology can cause reduced evapotranspiration in the irrigation district and improve the water use efficiency.
The analysis in Figure 8 shows that the total amount of water used, the total amount of water consumed, and the irrigated area of the irrigation district are all increasing, and the evapotranspiration per unit area of the irrigation district is decreasing, i.e., the amount of water consumed per unit area is decreasing, which is in line with the concept of water-saving irrigation. Total water consumption increases and water consumption decreases, with analysis indicating the following possible scenarios: the total area of cultivated land in the irrigation district does not change much, and an increase in the total amount of water consumed in the irrigation district is clear; the total amount of water consumed in the irrigation district does not change significantly, and an increase in the area of cultivated land in the irrigation district is clear; or the total amount of water consumed in the irrigation district is consistent with the trend of the area of the irrigation district and there is a trend of greater changes in the area of cultivated land in the irrigation district.
In order to explain the reasons for the decline in water consumption of the irrigation district, data for 1980–2020 were acquired, including data for the income and expenditure of the irrigation district on water for the calculation of water balance, and for the calculation of water consumption in the irrigation district to explore the changes in the variables involved in water balance and analyze the reasons for these changes.

3.3. Characteristics of Water Supply, Drainage and Consumption in the District

In the period from 1950 to 1980, China’s Xinjiang agricultural irrigation mode was mainly large water-diffuse irrigation, and from 1980 to 2000, China vigorously developed water conservation technology, moving into a conventional water conservation stage, mainly through canal lining and field engineering. After 2000, China entered the stage of promoting efficient water conservation technology. The spray drip irrigation system caused the irrigation district to have an increase in crop transpiration, surface runoff reduction groundwater recharge reduction, and ineffective loss reduction, and it increased effective consumption and the field water use coefficient. Later, efficient water-saving technologies such as sub-film drip irrigation reduced inter-tree evaporation and groundwater recharge, increased crop transpiration, and allowed production to increase.
The amount of water diversion, effective rainfall, and farmland drainage in the irrigation district during the period 1980–2020 is shown in Table 6, and the water consumption in the irrigation district was calculated using the water balance Equation (2).
In the water balance analysis for the irrigation district in Yanqi Basin for the period 1980–2020, the water consumption of the irrigation district, which includes losses in the irrigation canal system and losses in the field, should be less than the calculated water consumption of the irrigation district. The irrigation district developed from the stage of conventional water conservation before 2000 to the stage of efficient water conservation irrigation technology promotion after 2000, its irrigation water consumption E shows a decreasing trend, as shown in Figure 9b, the total amount of water consumption and the total amount of water used both have increasing trends, and from the results for analysis of the influencing factors, the continuous expansion of the cultivated area in the irrigation district was the main reason for the increase in the total amount of water used.
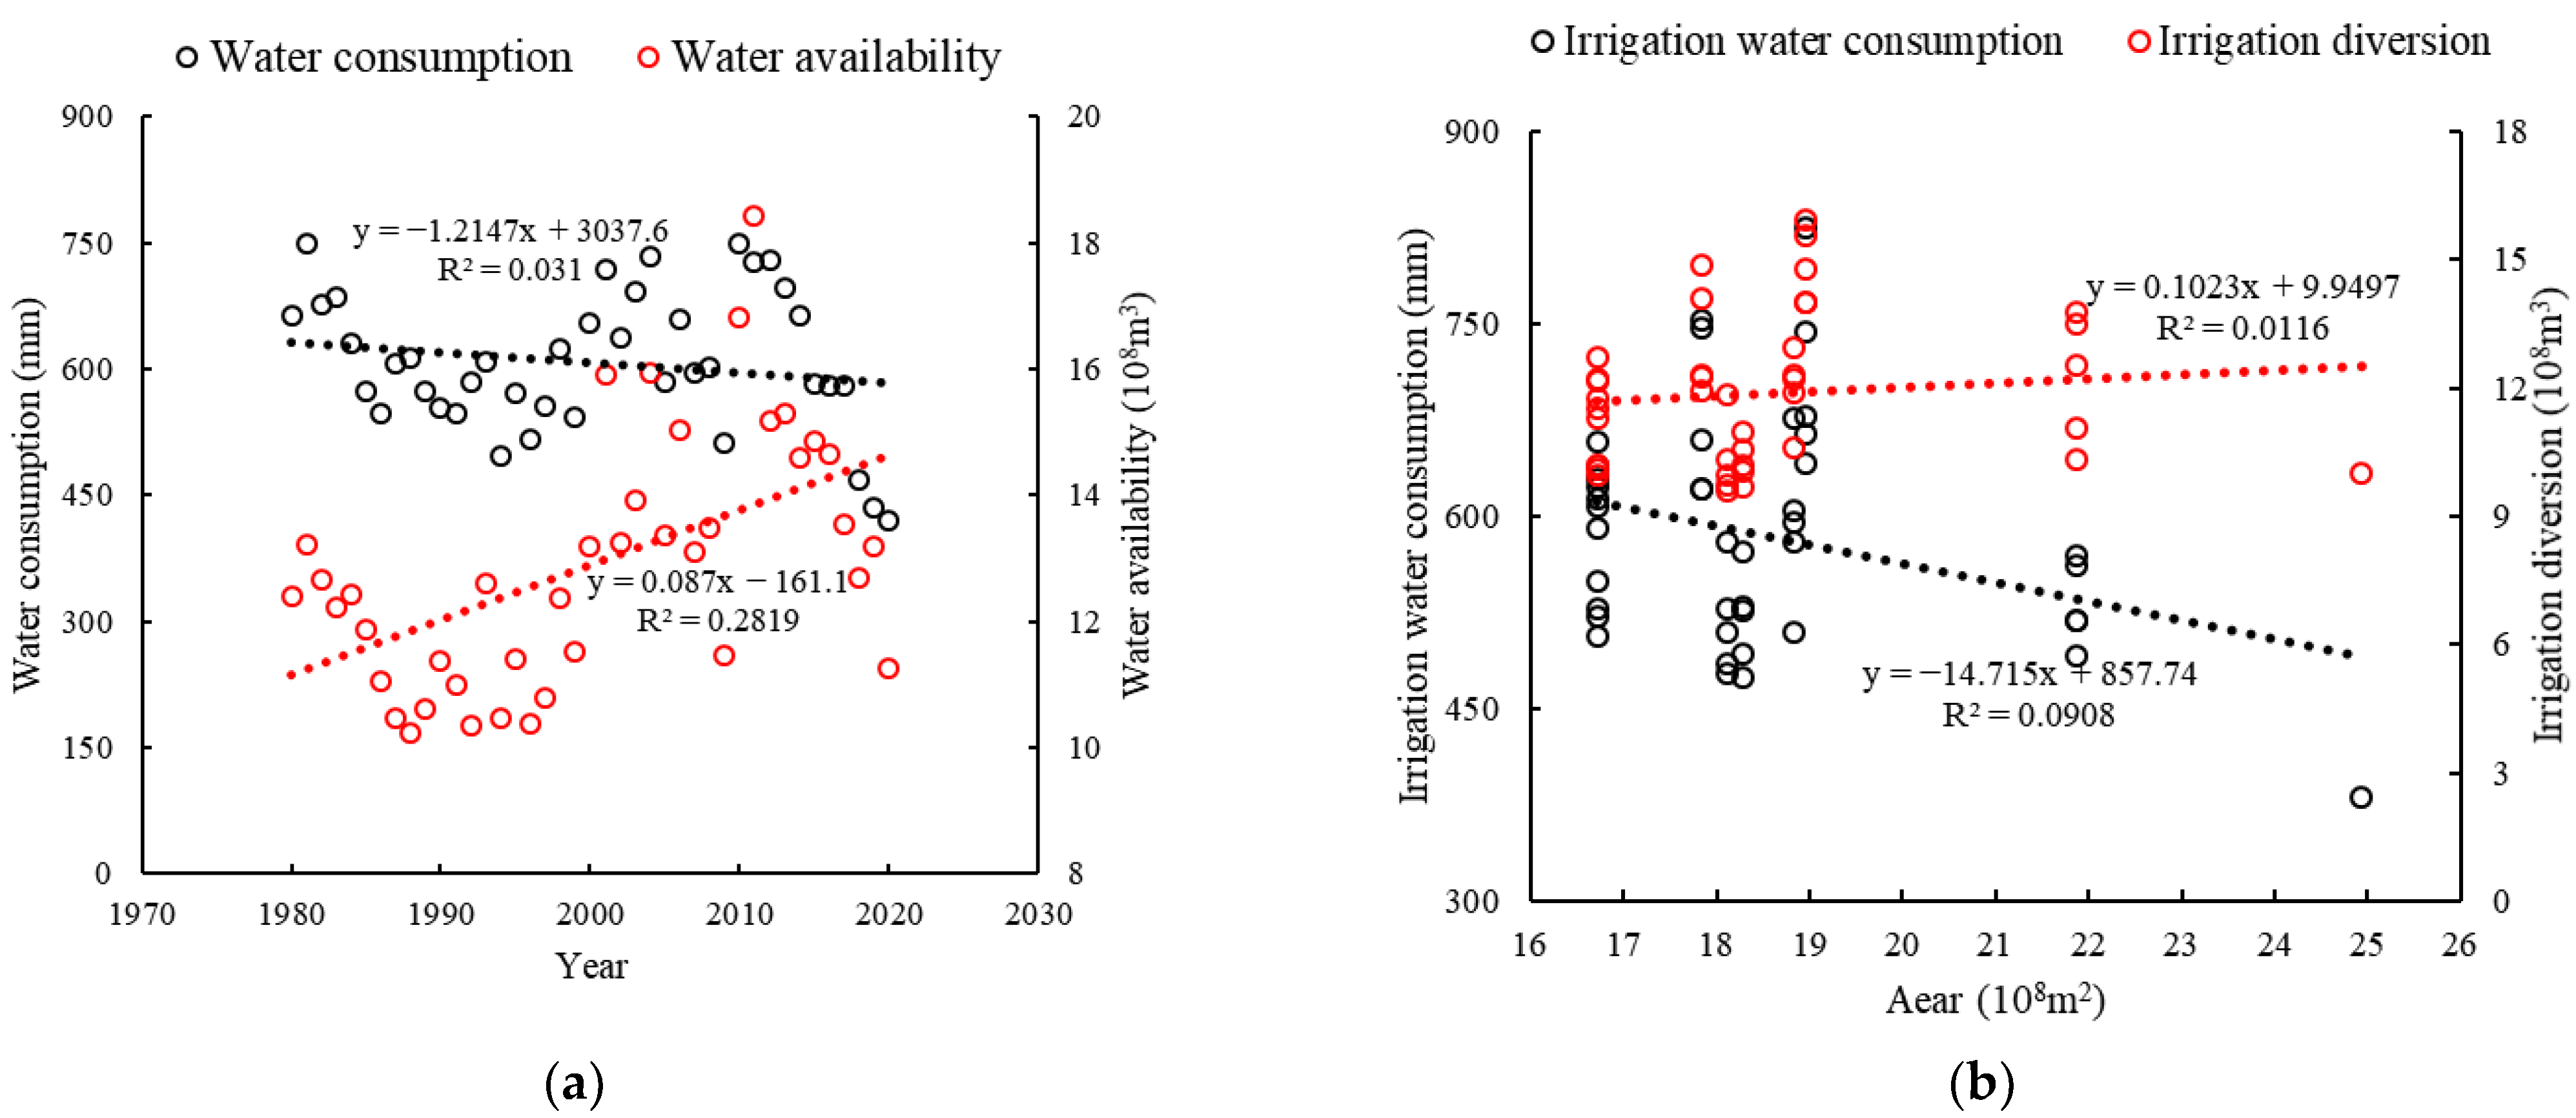
The analysis of changes in water consumption and water consumption per unit area in the irrigation area on an annual scale shows that there is an increasing trend for the total amount of water consumption in the irrigation area from 1980 to 2020 and a decreasing trend for the water consumption per unit area, and these trends are shown in Figure 10a. The total amount of water diversion into the irrigation district increases with the increase in area, and the relationships with this change are shown in Figure 10b, and for the Yanqi Basin irrigation district, the water consumption per unit area of the irrigation district shows a decreasing trend with the increase in the irrigation district area. In addition, from 1980 to 2020, the water diversion into the irrigation district changed from 1.214 km3 to 1.000 km3 and reached a maximum of 1.593 km3 in 2000, thus the water diversion into the irrigation district showed an overall upward trend.
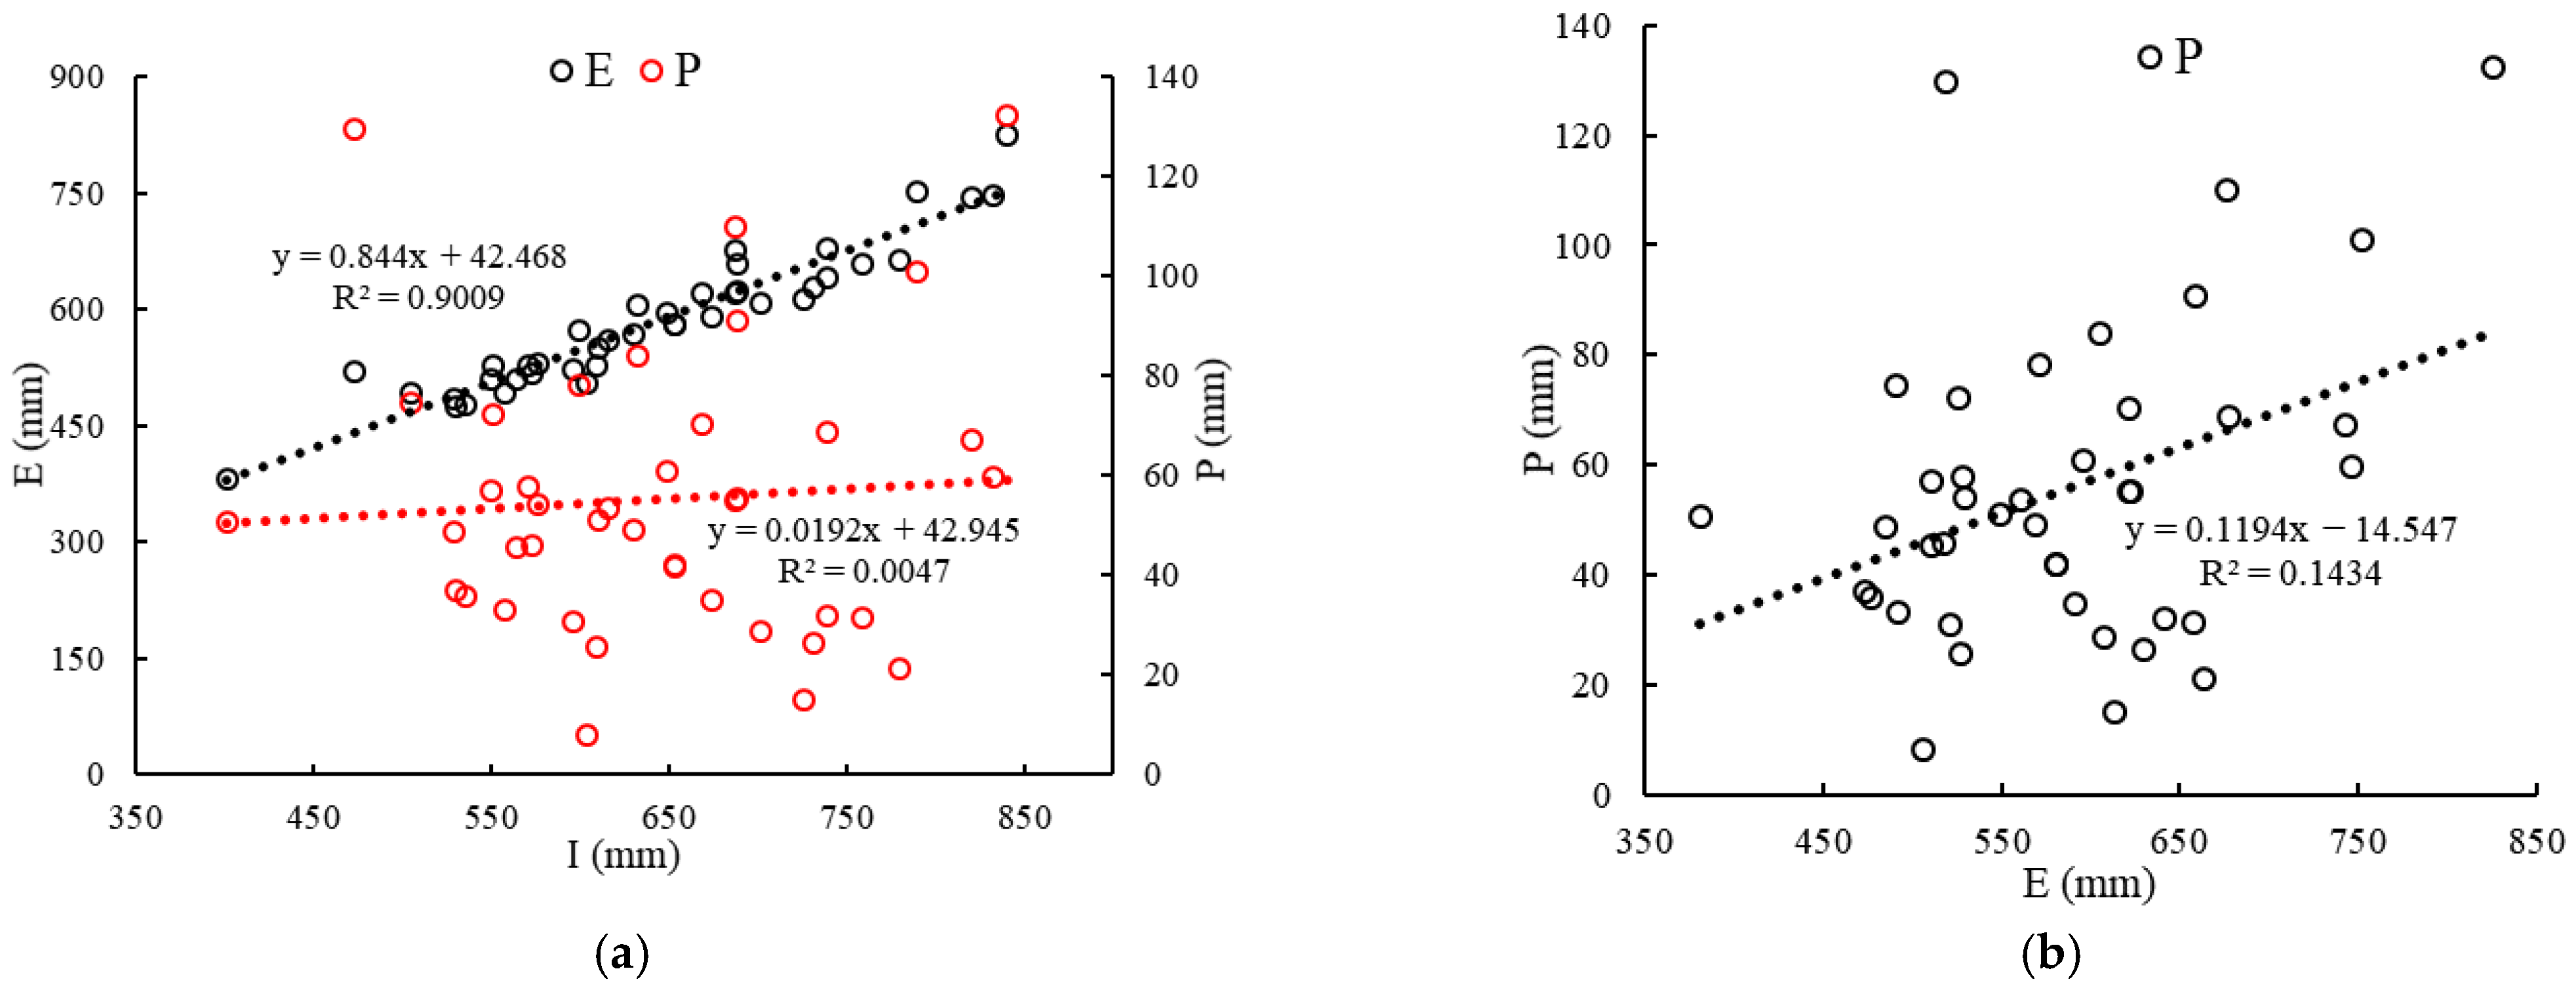
In analyzing the relationship between precipitation, water diversion, and water consumption in the irrigation district, as shown in Figure 11a, the trend of an increase in water diversion and precipitation on the irrigation district is not obvious, whereas the trend of an increase in water consumption on the irrigation district is more obvious, and the increases in water diversion cause water consumption to increase. The analysis in Figure 11b shows that the increase in water consumption requires increased precipitation.

3.4. Variation in Irrigation Water Use Efficiency in the District

3.4.1. Traditional Water Use Efficiency Indicators

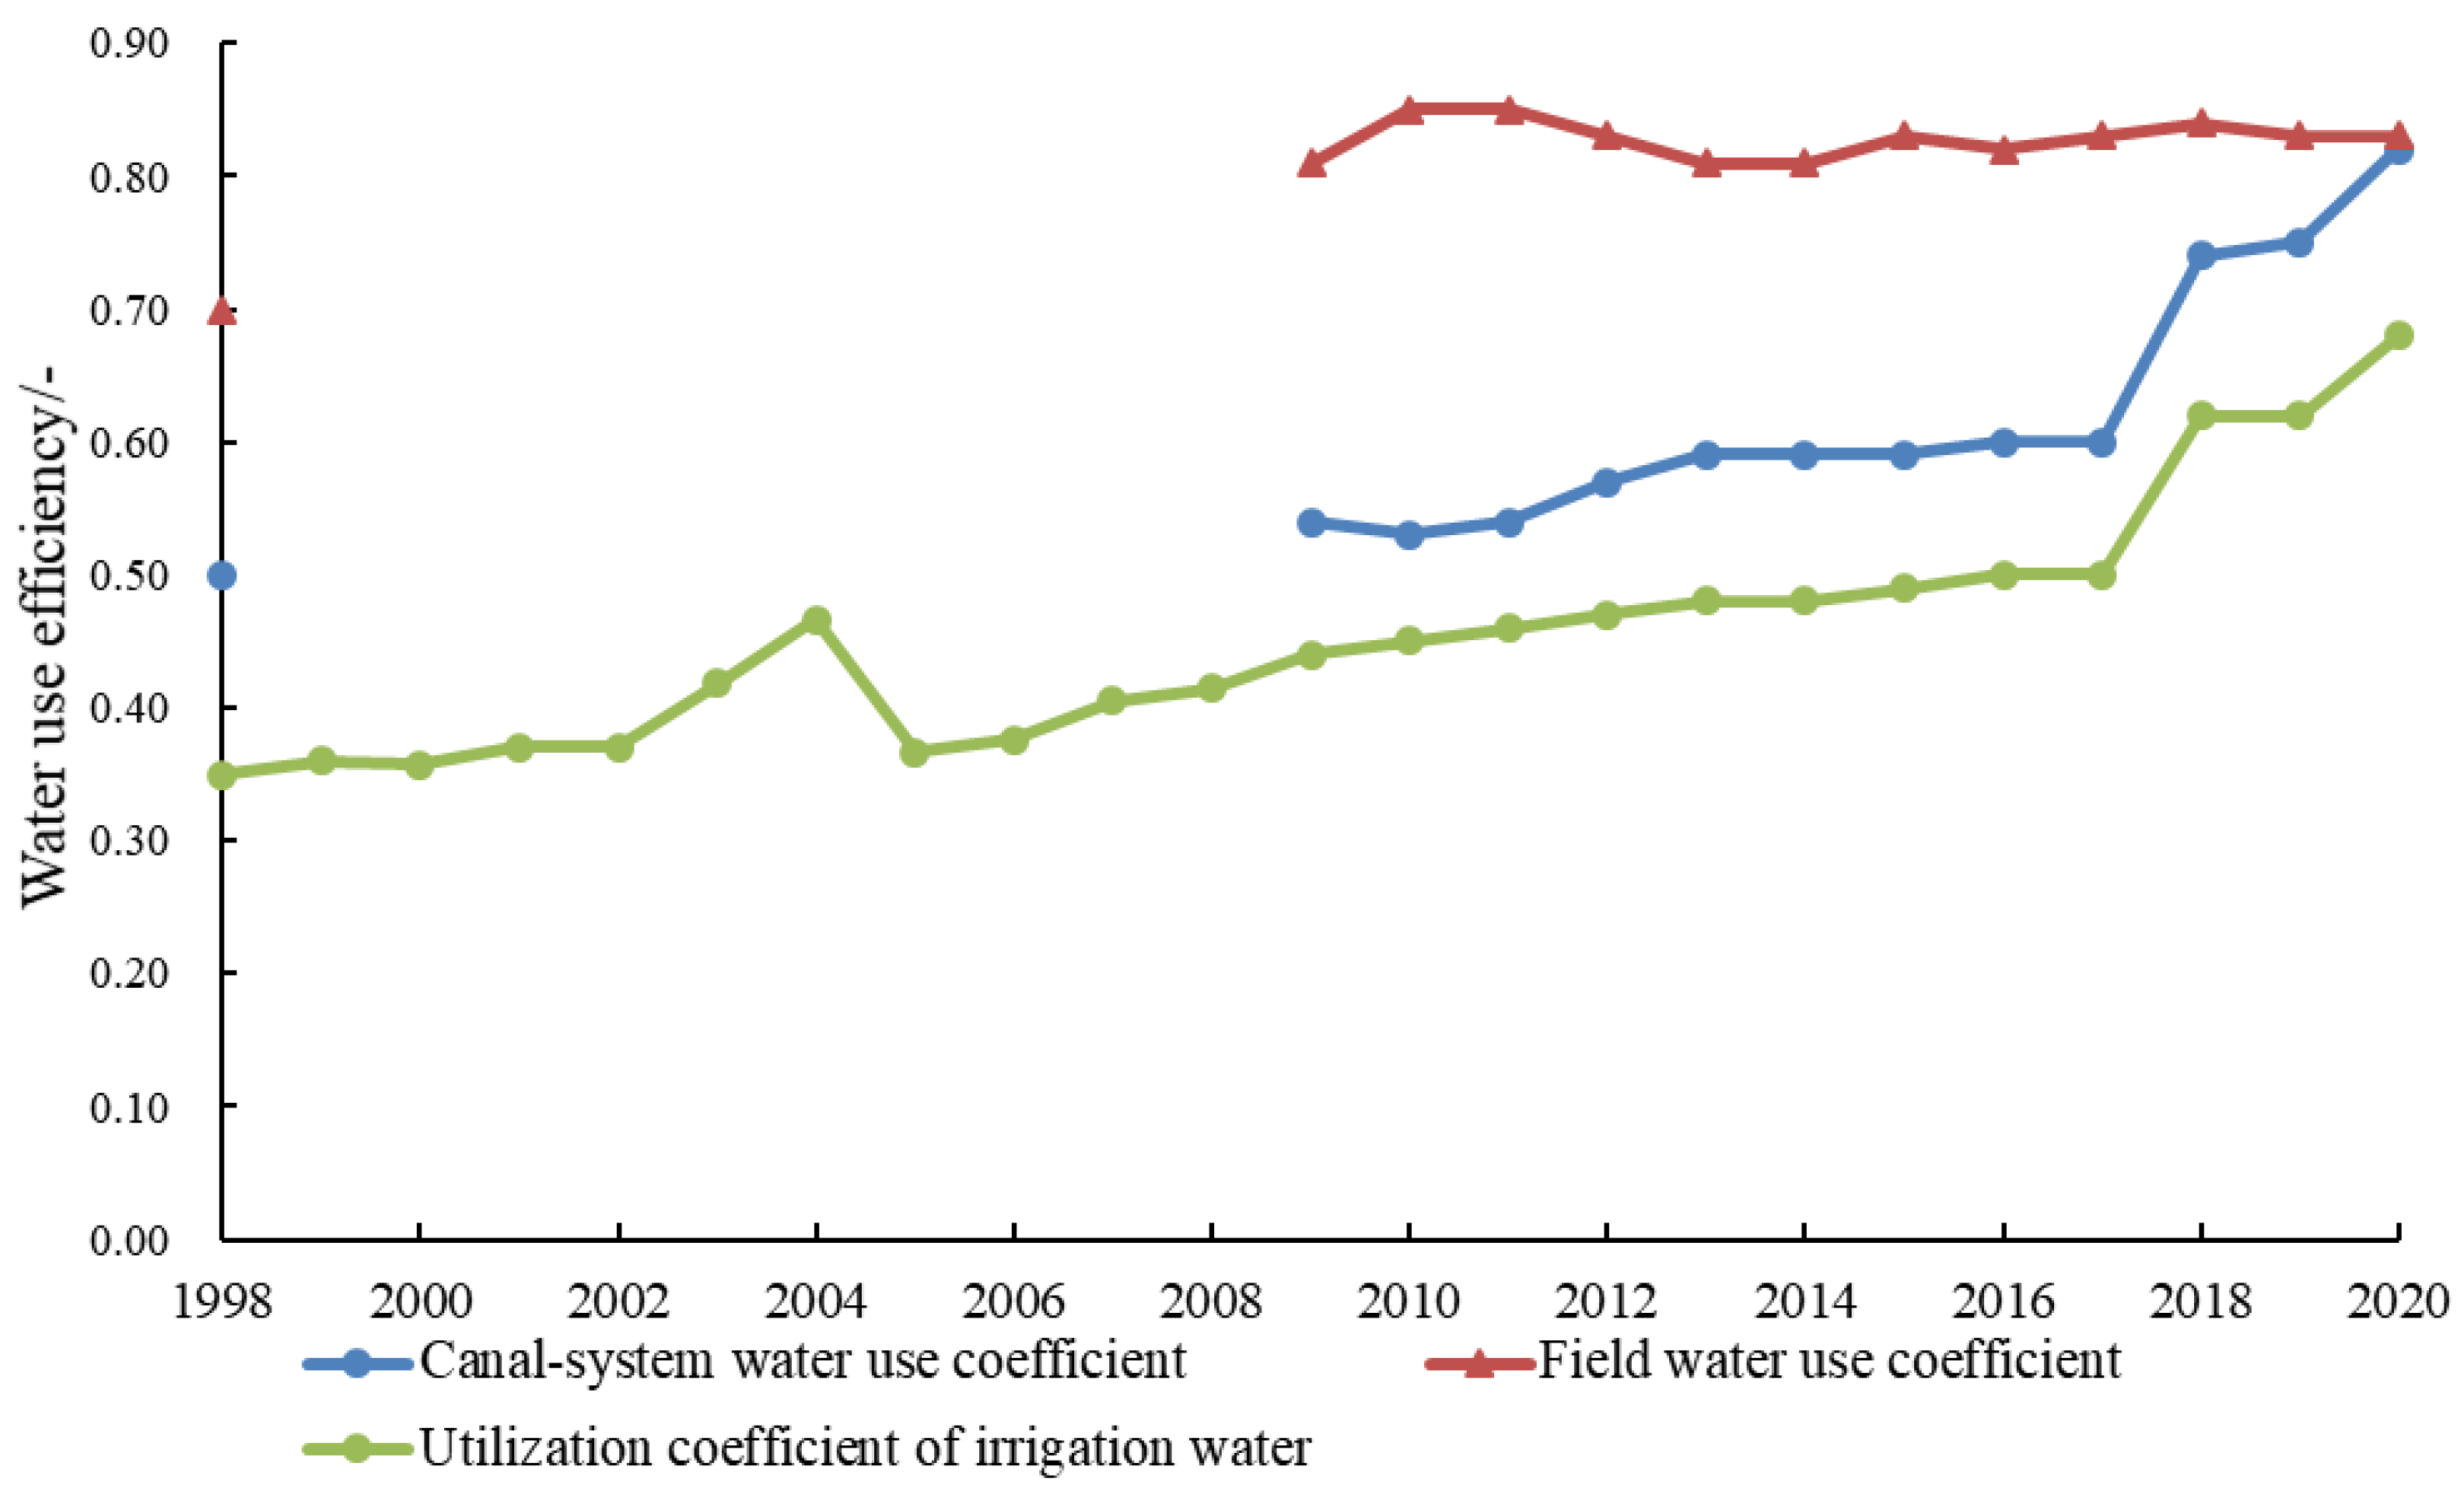
Based on the literature and the Bayingol Statistical Yearbook, it is possible to obtain the field water use coefficient, canal water use coefficient, and irrigation water use coefficient for the Yanqi Basin irrigation district from 1998 to 2020, as shown in Figure 12. The upper canal water use coefficient of the irrigation district shows a trend of slow increase, from 0.50 in 1998 to 0.82 in 2020, after the implementation of canal measures. The field water use coefficient displays a significant increase until 2011, and then it shows a decreasing trend, reaching a minimum of 0.83 in 2013, but it remains above 0.83 after 2014. The irrigation water utilization factor has been on an upward trend, with the most significant changes particularly after 2017.

3.4.2. Improved IWMI Water Balance Method

According to the data acquisition of the irrigation district, the water consumption ratio indicator (depleted fraction) DFg and the actual average irrigation water volume per hectare of arable land were selected for the assessment of water use efficiency; the water consumption ratio indicator is the ratio of water consumption per unit area to the income item. From 1980 to 2020, the water consumption ratio index and the actual irrigated acreage water consumption of arable land in the irrigation districts in Yanqi Basin both showed a decreasing trend, and the water consumption E in the irrigation districts also decreased along with the decrease in the water consumption ratio index; the trend of the change is basically the same, and the changes are shown in Figure 13. However, the water consumption ratio indicator DFg (depleted fraction), determined using the improved water balance method increased from 0.8390 in 1980 to 0.8562, showed an overall decreasing trend, and the average was 0.8436.
Analysis of the relationship between the water consumption ratio coefficient and the change in gross water supply and water consumption in the irrigation district per unit area from 1980 to 2020 shows that, when there is an increase in the water consumption ratio index, the gross water supply and water consumption have a decreasing trend, and the water consumption ratio coefficient decreases when the irrigation water use coefficient has an increasing trend. When the irrigated area increases, the water consumption ratio coefficient is positively proportional.
In the evaluation of traditional water use efficiency, the three water use efficiency coefficients, namely the irrigation water use coefficient, the field water use coefficient, and the canal water use coefficient, are all smaller than the water use efficiency coefficients in the stage of promoting high-efficiency water-saving irrigation. During 1998–2010, the irrigation water utilization coefficient increased from 0.35 to 0.45, and during 2011–2020, the irrigation water utilization coefficient increased continuously from 0.46 to 0.68, indicating that there is an improved water efficiency from water-saving irrigation technology use in the Yanqi Basin irrigation district. The implementation of water-saving irrigation technology in the irrigation districts in the northwest of China has led to the effective use of water resources and alleviated the water resource deficiencies preventing agricultural development in the northwest of China.
The water consumption index and the actual irrigated water of arable land used in the water balance method proposed by the improved IWMI were selected for analysis, and both show a decreasing trend. Combined with the irrigation district water balance to obtain the process of water consumption, the total amount of water consumption in cultivated land area within the irrigation district, i.e., the expansion of cultivated land area, has a significant impact on the total amount of water diversion and water consumption in the irrigation district.
From 1980 to 2020, when the value for the water consumption ratio indicator decreases, the water consumption per unit area and the actual irrigated acreage water consumption in the irrigation district both have a decreasing trend, as shown in Figure 14. The development of water-saving irrigation technology in the region has brought about the effective use of water resources, and the amount of water saved has promoted the reclamation of farmland, brought momentum to development and technical support to local agriculture, and can better promote the development of the local economy.

4. Discussion

Data collected from the Bayingolin Water Resources Bulletin and the Bayingolin Statistical Yearbook show that the irrigation district passes through cities and counties in terms of water supply, water use, and traditional water use efficiency indicators of irrigation water use efficiency, canal water use efficiency and field water use efficiency. The improvement in water use efficiency indicates that the development of water-saving irrigation technology in the irrigation district results in some improvements to the agricultural water use efficiency in this district. Statistics for the irrigation district were obtained in combination with data from the literature, and through the supply and use of water consumption and drainage balance, we calculated irrigation water consumption, which shows a downward trend, indicating that irrigation water-saving irrigation technology has a certain water-saving effect.

4.1. Effect of Water-Saving Irrigation on Water Balance in the District

The Bayingol Statistical Yearbook and Water Resources Bulletin indicate that the supply of water exceeds consumption in the Yanqi Basin irrigation district; thus, the demand for local water resources is met, and the gap between the total water supply and water consumption is gradually narrowing. The irrigation districts in the Yanqi Basin are predominantly agricultural, with roughly 90% of their total surface and groundwater being used for agricultural irrigation, and water consumption per unit area of the irrigation districts shows a slowly declining trend. Both the statistical area and remotely sensed area of arable land in the irrigation district show a significant increase, indicating that the arable land in the irrigation district of Yanqi Basin expanded during the period of 1980–2020, resulting in an urgent demand for total water resources even under the conditions of the continuous development of water-saving irrigation technology.
In this paper, remote sensing monitoring was used in the Yanqi Basin irrigation district in Xinjiang to obtain the change in cultivated area of the irrigation district and collect the irrigation diversion data and drainage data. Analysis using the water balance method to calculate the irrigation water consumption for the period of 1980–2020 shows that, with the development of water-saving irrigation technology, the efficiency of agricultural water resources is improving, Yanqi Basin irrigation water diversion is still in the state of increasing, which is apparent, and the development of water-saving technology does not seem to bring about an increase in the amount of water savings, but the irrigation district per unit of water consumption shows a downward trend, indicating that the increase in its area greatly affects the total amount of water needed in the irrigation district.
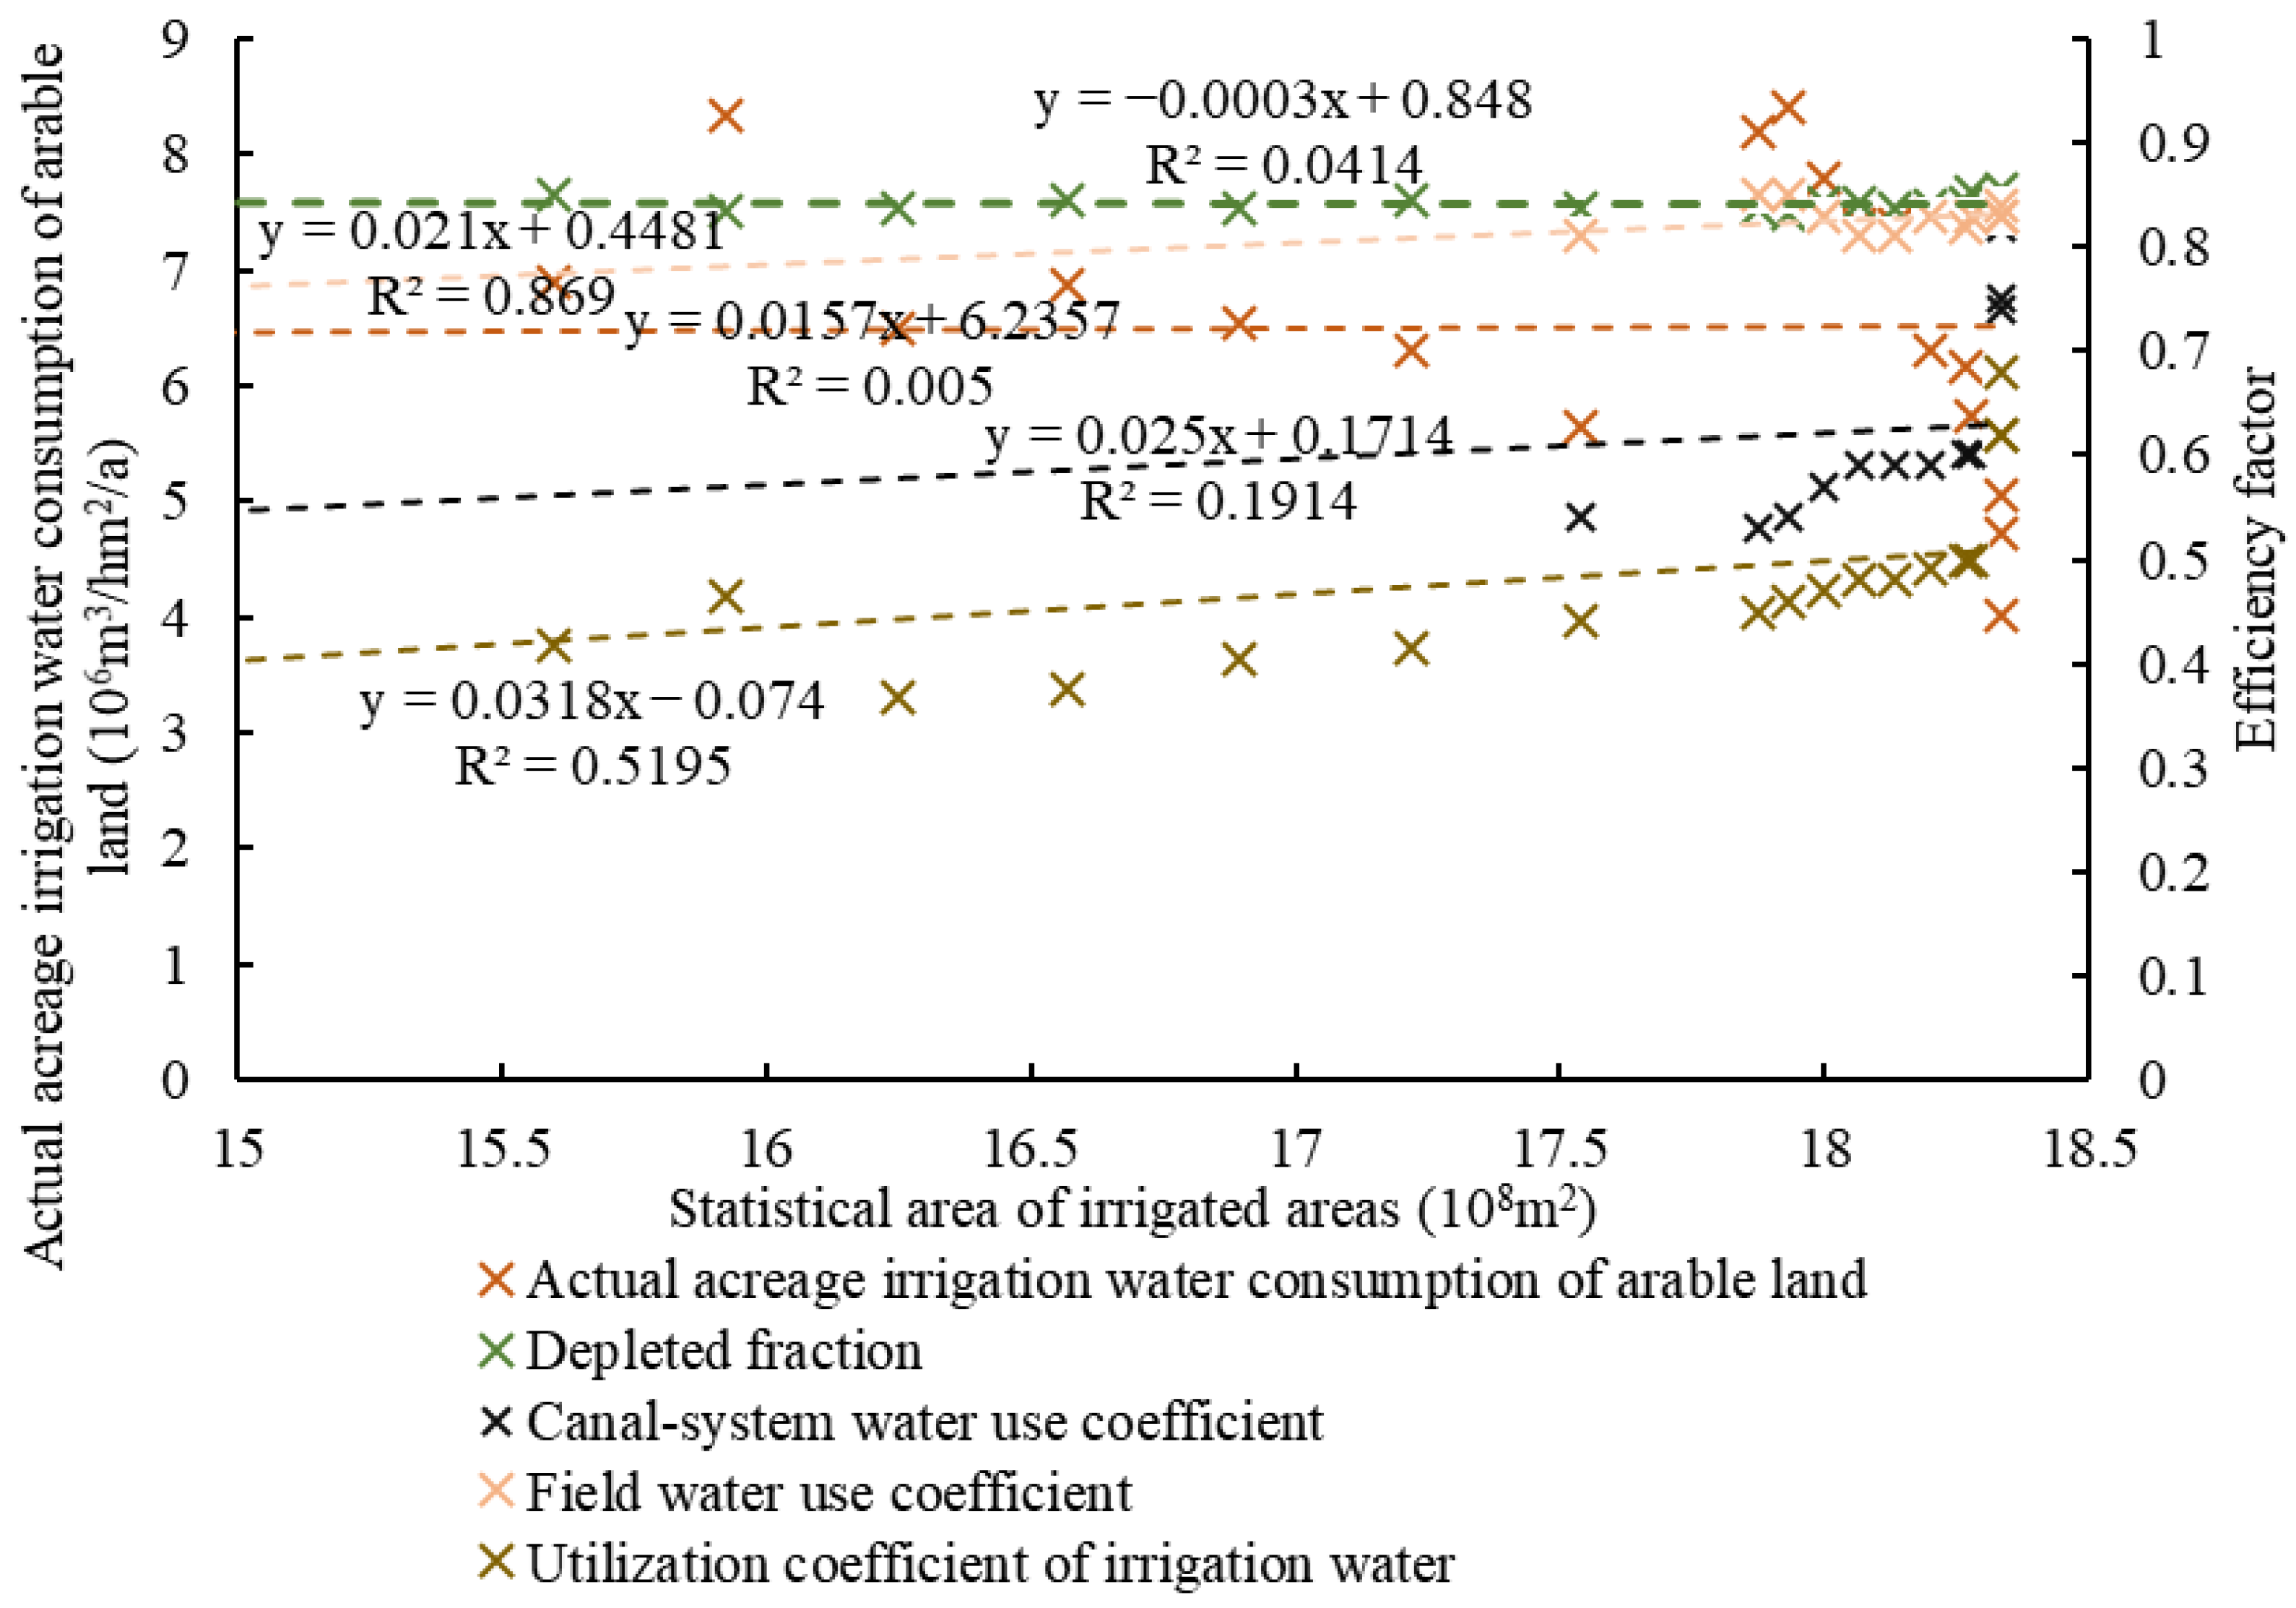
In 1980–2020, the cultivated area of the irrigation district showed an increasing trend. Analyzing the relationship between area and the water use efficiency coefficients can be seen as shown in Figure 15. When the cultivated area increases, the depleted fraction shows a decreasing trend, and in 2020, the statistics of the cultivated area of the irrigation district reached 18.333 × 10⁸ m3, and the water consumption coefficient reached the minimum value of 0.829 in 1985. Its canal water utilization coefficient, field water utilization coefficient, and irrigation water utilization coefficient show an increasing trend, among which the change in the irrigation water utilization coefficient is the most obvious, and it reaches the maximum value of 0.829 in 2020. The actual irrigation water use per mu increased slightly with the increase in irrigation area, and reached a minimum of 4.010 × 10⁶ m3/hm2/a in 2020, indicating that the change of cultivated land area has obvious influence. The selected water use efficiency coefficients all showed water saving effects on the irrigation district, i.e., the water saving irrigation technology promoted the beneficial improvement of water use efficiency.
Water-saving irrigation technology plays an important role in the western water-scarce areas, and the development of efficient irrigation water-saving technology has brought great benefits to agriculture in the arid regions of Northwest China. From the water balance analysis for the Xinjiang Yanqi Basin irrigation district, we can conclude that water-saving irrigation technology in the Xinjiang Yanqi Basin irrigation district has facilitated better results, water use efficiency has been greatly improved, in order to ensure that the normal growth and development of crops, and, at the same time, reducing the crop water consumption per unit area, to achieve “less water, more production”, to a certain extent, thereby ensuring the effective use of water resources. However, in order to achieve crop production efficiency, the uncontrolled expansion of arable land in the irrigation district means that the amount of water is still in short supply, and the rate of arable land expansion in the irrigation district of agricultural water consumption is far greater than the amount of water saved by water-saving irrigation technology, resulting in the implementation of water-saving irrigation technology, and the phenomenon of “the more you save water, the more you use water”, i.e., “the paradox of irrigation efficiency”.

4.2. Suggestions for Avoiding the Paradox of Irrigation Efficiency

In order to break this paradox, we should improve the water conservation policy mechanism, optimize water conservation planning, raise people’s awareness of water resources use, and realize the selection of water-saving irrigation technology according to local conditions, and develop and improve the water-saving informatization system in irrigation districts [67]. Adopting rational water–soil–food resource management measures, planning the area of arable land and agricultural water resources, and making more effective use of water resources can ensure that the economic and ecological benefits are maximized.
To achieve total water use and water efficiency control, firstly, we should improve farmers’ knowledge and use of water-saving irrigation technology [68], encourage farmers to adopt efficient water-saving irrigation technologies, and at the same time, implement good policies [69,70] so that water-saving technologies have wider coverage. Secondly, there is still much room for development when it comes to water-saving irrigation technology, and we should increase the awards for water-saving technological breakthroughs to encourage innovation from technical personnel on the basis of increasing water saving. At the same time, we cannot blindly use water-saving irrigation technology, which should be adapted to local conditions in finding scientifically sound and appropriate water-saving irrigation technology. Finally, we need a breakthrough not only in technology but also in the relationship between land and water resources to find a balance and breakthrough point, in addition to conducting planned expansion of arable land areas to prevent the scenario of “the more water-saving, the more water shortages” from becoming more serious.

5. Conclusions

In this study, the changes in water consumption and water use efficiency within the irrigation district in Yanqi Basin were analyzed using the total volume changes in water supply, water use, water drainage, and water consumption through the concept of water balance. Remote sensing data for arable land from 1980 to 2020, the Bayingol Statistical Yearbook, and the Water Resources Bulletin were used to obtain the statistical data for water supply and water consumption in the irrigation district, and the literature was used to obtain data on basic information of the irrigation district, such as the irrigation water use efficiency, the field water use coefficient, and the canal water use coefficient. The main conclusions are detailed in the following.
The irrigation efficiency coefficient within the irrigation district improved to different extents during 1998–2020, and irrigation water saving technology was well promoted and brought about a water saving effect within the irrigation district of Yanqi Basin. The water consumption E within the irrigation district shows a trend of decreasing from 1980 to 2020, and the water-saving irrigation technology in the irrigation district brought about a beneficial change in water consumption and improved the efficiency of water resources such that water resources in the irrigation district of Yanqi Basin were fully utilized. The cultivated land area in the irrigation district shows a trend of increasing from 1980 to 2020, indicating that the continuous expansion of cultivated land in the irrigation district may lead to an increase in the total amount of water used in agriculture. The total water consumption in the irrigation district shows an upward trend from 1980 to 2020, which supports the notion that the expansion of cultivated area in the irrigation district is the main reason for the increase in total water consumption in the irrigation district. This results in the “irrigation efficiency paradox” of “the more saving, the more consuming” on the surface water.
Water-saving irrigation technology has been effectively promoted in the Yanqi Basin irrigation district, but the expansion of arable land has not been well planned, resulting in the total water use in the irrigation district not being effectively controlled such that water–soil resources did not reach an optimal balance. In future studies, the relationships among water volume in irrigation districts, land area, and crop yield can be analyzed in light of the changes in crop area and crop yield, so as to carry out planning and management of water–soil–food resources, and at the same time, to develop more efficient water-saving irrigation techniques and cultivate “high-yield, low-water-consumption” crop seeds. Against the background of limited total water resources and growing water demand, only by observing the “three red lines” of Chinese water resources management rule and implementing the most stringent water resources management system can the existing water resources load be compressed and limited, and only then can the local economy be developed in a sustainable manner to achieve the sustainable development goals.

Author Contributions

D.L. was responsible for writing and editing, guiding the research and providing funding; G.M. was responsible for editing, providing some of the data and funding for the project; H.C. came up with the idea, organized and analyzed the data, and completed the manuscript; F.H., L.M., Q.H. and X.M. contributed to editing. All authors have read and agreed to the published version of the manuscript.

Funding

This research was supported by the National Natural Science Foundation of China (NSFC) (Grant Nos. 52109031, 52279025, and 42071335), and the National Key Research and Development Program of China (2022YFF1302200).

Data Availability Statement

The DEM data were obtained from Geospatial Data Cloud (https://www.gscloud.cn, accessed on 24 October 2023), the meteorological data from 1980 to 2020 were collected from the National Climatic Centre of China (http://data.cma.cn, accessed on 24 October 2023), and statistics data from the Bayingol Mongol Autonomous Prefecture Statistical Yearbook and the Bayingol Mongol Autonomous Prefecture Water Resources Bulletin.

Acknowledgments

We thank the anonymous reviewers and the editor for their constructive comments.

Conflicts of Interest

Author Guanghui Ming was employed by the company Yellow River Engineering Consulting Co., Ltd. The remaining authors declare that the research was conducted in the absence of any commercial or financial relationships that could be construed as a potential conflict of interest.

References

  1. Zhang, K.; Yu, F. Research on green agricultural development under the dual-carbon goal: Review and perspectives. Chin. J. Eco-Agric. 2022, 31, 214–225. [Google Scholar] [CrossRef]
  2. Fang, S.; Jia, R.; Tu, W.; Sun, Z. Assessing Factors Driving the Change of Irrigation Water-Use Efficiency in China Based on Geographical Features. Water 2017, 9, 759. [Google Scholar] [CrossRef]
  3. Forslund, A.; Renoefaelt, B.M.; Barchiesi, S.; Smith, D.M. Securing Water for Ecosystems and Human Well-Being: The Importance of Environmental Flows; Swedish International Water Institute: Stockholm, Sweden, 2022. [Google Scholar]
  4. Luo, C.; Feng, L.; Chai, Z.; Zhang, W.; Wang, Z. Study on Sustainable Utilization of agricultural water resources in Xinjiang. 2022, 10, pp. 560–569. Available online: https://kns.cnki.net/kcms2/article/abstract?v=AnuRcxOpZiE7xHqDZrn47NVLaklKqIdG-PinP3ReZMZIBPV3Gp__KlffzWrqxIpsgcJCW09B9wEMwriLGWj0JxeQ8j_mHApSdo96-kaMZkoBPRi8Zd6yrrHqOhepShFIaez2oUxlpeZKHz5iKInRiA==&uniplatform=NZKPT&language=CHS (accessed on 4 December 2023).
  5. Li, X. China—Water Conservation Project II: P114138—Implementation Status Results Report: Sequence 04 (English). Available online: http://www-wds.worldbank.org/external/default/main?pagePK=64193027&piPK=64187937&theSitePK=523679&menuPK=64187510&searchMenuPK=64187511&entityID=090224b0823cd337_1_0&cid=3001_39 (accessed on 4 December 2023).
  6. Long, A.; Deng, M. A Study of the Water Balance of Lake Balkhash. J. Glaciol. Geocryol. 2011, 33, 1341–1352. [Google Scholar] [CrossRef]
  7. Jiang, D. A Review on the Classification and Calculating Methods of Ecological and Environmental Water Requirements. Prog. Geogr. 2003, 22, 369–378. [Google Scholar]
  8. Feng, H.; Zheng, H.; Cao, Y. On Theories and Methodologies of Ecological Water Demand Estimation. J. Nanjing Xiaozhuang Coll. 2005, 21, 50–55. [Google Scholar]
  9. Hong, F.; Ning, C.; Hong, L. Impact of Global Warming on Water Requirement of Main Crops in Oasis Irrigated Area in Yanqi Basin. Adv. Mater. Res. 2014, 955, 3079–3087. [Google Scholar]
  10. Wang, W.; Zhao, Q.; Du, J. Advances in the Study of Evapotranspiration of Regional Land Surface Based on Remote Sensing Technology. Remote Sens. Land Resour. 2012, 24, 1–7. [Google Scholar]
  11. Gao, D. Progress in Models for Evapotranspiration Estimation Using Remotely Sensed Data. J. Remote Sens. 2008, 12, 515–528. [Google Scholar]
  12. Bastiaanssen, W.G.M.; Molden, D.J.; Makin, I.W. Remote sensing for irrigated agriculture: Examples from research and possible applications. Agric. Water Manag. 2000, 46, 137–155. [Google Scholar] [CrossRef]
  13. Yang, Y.; Shang, S. A hybrid dual-source scheme and trapezoid framework–based evapotranspiration model (HTEM) using satellite images: Algorithm and model test. J. Geophys. Res. Atmos. 2013, 118, 2284–2300. [Google Scholar] [CrossRef]
  14. Yang, Y.; Yang, P.; Wang, C.; Kou, X.; Tan, F.; Xu, J.; Wang, C. Effectiveness evaluation of water consumption in agricultural land of Yanqi Basin, Xinjiang. Arid Land Geogr. 2023, 46, 730–741. [Google Scholar]
  15. Tang, H. Progress and Prospect of Agricultural Remote Sensing Research. J. Agric. 2018, 8, 175. [Google Scholar]
  16. Kang, S.; Hao, X.; Du, T.; Tong, L.; Su, X.; Lu, H.; Li, X.; Huo, Z.; Li, S.; Ding, R. Improving agricultural water productivity to ensure food security in China under changing environment: From research to practice. Agric. Water Manag. 2017, 179, 5–17. [Google Scholar] [CrossRef]
  17. Wu, P.; Feng, H.; Niu, W.; Gao, J.e.; Jiang, D.; Wang, Y.; Fan, X.; Qi, P. Analysis of developmental tendency of water distribution and water-saving strategies. Trans. Chin. Soc. Agric. Eng. Trans. CSAE 2003, 19, 1–6. [Google Scholar]
  18. Zhang, W.; Du, X.; Huang, A.; Yin, H. Analysis and Comprehensive Evaluation of Water Use Efficiency in China. Water 2019, 11, 2620. [Google Scholar] [CrossRef]
  19. Wallace, J.S. Increasing agricultural water use efficiency to meet future food production. Agric. Ecosyst. Environ. 2000, 82, 105–119. [Google Scholar] [CrossRef]
  20. Wang, H.; Zhang, L.; Dawes, W.R.; Liu, C. Improving water use efficiency of irrigated crops in the North China Plain—Measurements and modelling. Agric. Water Manag. 2001, 48, 151–167. [Google Scholar] [CrossRef]
  21. Lilienfeld, A.; Asmild, M. Estimation of excess water use in irrigated agriculture: A Data Envelopment Analysis approach. Agric. Water Manag. 2007, 94, 73–82. [Google Scholar] [CrossRef]
  22. André, F.J.; Herrero, I.; Riesgo, L. A modified DEA model to estimate the importance of objectives with an application to agricultural economics. Omega 2010, 38, 371–382. [Google Scholar] [CrossRef]
  23. Varghese, S.K.; Veettil, P.C.; Speelman, S.; Buysse, J.; Van Huylenbroeck, G. Estimating the causal effect of water scarcity on the groundwater use efficiency of rice farming in South India. Ecol. Econ. 2013, 86, 55–64. [Google Scholar] [CrossRef]
  24. Drew, M.; Crase, L. ‘More Crop per Drop’ and water use efficiency in the National Water Policy of Pakistan. Agric. Water Manag. 2023, 288, 108491. [Google Scholar] [CrossRef]
  25. Li, Y.; Fan, L.; Wang, J.; Luo, W. An Analysis of the Irrigation Water Use Efficiency Indicators in Changjiang River Basin. China Rural Water Hydropower 2017, 12, 1–6+12. [Google Scholar] [CrossRef]
  26. Cui, Y.; Xiong, J. Advances in assessment indicators of irrigation water use efficiency. Adv. Water Sci. 2009, 20, 590–598. [Google Scholar]
  27. Seckler, D.; Amarasinghe, U.A.; Molden, D.J.; De Silva, R.; Barker, R. World water demand and supply, 1990 to 2025: Scenarios and issues. IWMI Res. Rep. 1998, 19, 6–49. [Google Scholar] [CrossRef]
  28. Willardson, L.S.; Allen, R.G.; Frederiksen, H.D. Elimination of Irrigation Efficiencies. 1994. Available online: https://www.researchgate.net/publication/253580547_Eliminating_Irrigation_Efficiencies (accessed on 4 December 2023).
  29. International Water Management Institute. Integrated Water Resource Systems: Theory and Policy Implications (Keller/Keller/David Seckler/IIMI); International Water Management Institute: Colombo, Sri Lanka, 1999. [Google Scholar]
  30. International Water Management Institute. International Water Management Institute (IWMI). International Water Management Institute: Colombo, Sri Lanka, 2015. [Google Scholar]
  31. Bin, D. An Introduction of the Framework for Water Accounting and Performance Indicators Developed by IWMI. China Rural Water Hydropower 2003, 1, 5–8. [Google Scholar] [CrossRef]
  32. Molden, D. Accounting for Water Use and Productivity; Iwmi: Colombo, Sri Lanka, 1997. [Google Scholar] [CrossRef]
  33. Cui, Y.; Dong, B.; Li, Y.; Cai, X. Assessment indicators and scales of water saving in agricultural irrigation. Trans. Chin. Soc. Agric. Eng. 2007, 23, 1–7. [Google Scholar]
  34. Bastiaanssen, W.G.M.; Brito, R.A.L.; Bos, M.G.; Souza, R.A.; Cavalcanti, E.B.; Bakker, M.M. Low Cost Satellite Data for Monthly Irrigation Performance Monitoring: Benchmarks from Nilo Coelho, Brazil. Irrig. Drain. Syst. 2001, 15, 53–79. [Google Scholar] [CrossRef]
  35. Bos, M.G. Using the depleted fraction to manage the groundwater table in irrigated areas. Irrig. Drain. Syst. 2004, 18, 201–209. [Google Scholar] [CrossRef]
  36. Zhou, X. Sustainability assessment and improvement strategies research for typical arid and resource-developing regions. PLoS ONE 2021, 16, e0251088. [Google Scholar] [CrossRef]
  37. Cui, Y. The Research on Agricultural Eco-Efficiency in Xinjiang. Ph.D. Thesis, Shihezi University, Xinjiang, China, 2022. [Google Scholar] [CrossRef]
  38. Peng, H. Analysis on the status of water-saving irrigation techniques and its development trends in China. Soil Fertil. Sci. China 2006, 5, 1–6. [Google Scholar]
  39. Li, Y. An Economic Analysis of Sustainable Utilization of Water Resources in Agricultural Production. Ph.D. Thesis, Nanjing Agricultural University, Nanjing, China, 2004. [Google Scholar]
  40. Wang, J.; Wu, J.; Qi, X.; Yang, B.; Zhao, H.; Fan, X. Advances in water saving irrigation evaluation. Adv. Water Sci. 2002. [Google Scholar] [CrossRef]
  41. Xiong, R.; Zheng, Y.; Han, F.; Tian, Y. Improving the Scientific Understanding of the Paradox of Irrigation Efficiency: An Integrated Modeling Approach to Assessing Basin-Scale Irrigation Efficiency. Water Resour. Res. 2021, 57, e2020WR029397. [Google Scholar] [CrossRef]
  42. Contor, B.A.; Taylor, R.G. Why improving irrigation efficiency increases total volume of consumptive use. Irrig. Drain. 2013, 62, 273–280. [Google Scholar] [CrossRef]
  43. Zhong, Y.; Gan, L. Study on the Path of Ensuring Grain Security in Northwest Arid Area Under the Constraint of esources. Acad. J. Zhongzhou 2022. [Google Scholar]
  44. Wang, Y.; Li, Y.; Wang, Y.; Tan, Y. Study on the Change of Inflow and Salt Content of the Bosten Lake, Xinjiang since the 1950s. Arid Zone Res. 2005, 22, 355–360. [Google Scholar]
  45. Hu, S.; Guo, J.; Cheng, B.; Wang, F.; Tian, C.; Pan, Y. Analysis on the Feasibility of Reusing the Drained Water from the Farmlands in the Shajingzi Irrigated Area, Xinjiang. Arid Zone Res. 2004, 12, 343–349. [Google Scholar]
  46. Liu, H.; Song, J. Discussion on Protection of Bositeng Lake Water Area and Wetland. Res. Soil Water Conserv. 2004, 11, 150–151. [Google Scholar]
  47. Tian, F. Characterizing Spatiotemporal Patterns of Snowfall in the Kaidu River Basin from 2000–2020 Using MODIS Observations. Remote Sens. 2022, 14, 5885. [Google Scholar]
  48. Zhang, Y.; Li, B.; Bao, A.; Zhou, C.; Xi, A.C. Study on snowmelt runoff simulation in the Kaidu River basin. Sci. China Ser. D 2007, 50, 26–35. [Google Scholar] [CrossRef]
  49. Liu, C.; Wang, H. An analysis of relationship between water resources and population-aconomy-society-environmet. J. Nat. Resour. 2003, 5, 635–644. [Google Scholar] [CrossRef]
  50. Grafton, R.Q.; Williams, J.; Perry, C.J.; Molle, F.; Ringler, C.; Steduto, P.; Udall, B.; Wheeler, S.A.; Wang, Y.; Garrick, D.; et al. The paradox of irrigation efficiency. Science 2018, 361, 748–750. [Google Scholar] [CrossRef] [PubMed]
  51. Zhang, C.; Fang, J.; Feng, L. Review of Eco-Hydrology in Arid and Semi- Arid Regions. Hunan Agric. Sci. 2014, 17, 35–37+41. [Google Scholar] [CrossRef]
  52. Han, S.; Hu, H.; Yang, D.; Liu, Q. Irrigation impact on annual water balance of the oases in Tarim Basin, Northwest China. Hydrol. Process. 2011, 25, 167–174. [Google Scholar] [CrossRef]
  53. Mei, X.; Kang, S.; Yu, Q.; Huang, Y.; Zhong, X.; Gong, D.; Huo, Z.; Liu, E. Pathways to Synchronously Improving Crop Productivity and Field Water Use Efficiency in the North China Plain. Sci. Agric. Sin. 2013, 46, 1149–1157. [Google Scholar]
  54. Li, H.; Liu, H.; Gong, X.; Li, S.; Pang, J.; Chen, Z.; Sun, J. Optimizing irrigation and nitrogen management strategy to trade off yield, crop water productivity, nitrogen use efficiency and fruit quality of greenhouse grown tomato. Agric. Water Manag. 2021, 245, 106570. [Google Scholar] [CrossRef]
  55. Shang, S.; Jiang, L.; Yang, Y. Review of Remote Sensing-based Assessment Method for Irrigation and Crop Water Use Efficiency. Trans. Chin. Soc. Agric. Mach. 2015, 46, 81–92. [Google Scholar] [CrossRef]
  56. Li, R.; Liu, X. Advance of Research on Utilization Coefficient of Irrigation water. Water Sav. Irrig. 2011, 11, 56–58. [Google Scholar]
  57. Perry, C. Reply: Efficient irrigation; inefficient communication; flawed recommendations: Response to comment. Irrig. Drain. 2008, 57, 249–252. [Google Scholar] [CrossRef]
  58. Waller, P.; Yitayew, M. Irrigation and Drainage Engineering; Springer: Berlin/Heidelberg, Germany, 2016. [Google Scholar] [CrossRef]
  59. Keller, A.; Keller, J.; Seckler, D. Integrated water resource systems: Theory and policy implications. Iwmi Books Rep. 1996, 3, 6–22. [Google Scholar] [CrossRef]
  60. Burt, C.M.; Clemmens, A.J.; Strelkoff, T.S.; Solomon, K.H.; Eisenhauer, D.E. Irrigation Performance Measures: Efficiency and Uniformity. J. Irrig. Drain. Eng. 1999, 125, 97–99. [Google Scholar] [CrossRef]
  61. Kooij, S.V.D. Fieldwork plan 2012. Beyond irrigation efficiency. J. Oral Maxillofac. Surg. Off. J. Am. Assoc. Oral Maxillofac. Surg. 1987, 45, 779–784. [Google Scholar]
  62. Perry, C.J. The IWMI water resources paradigm—Definitions and implications. Agric. Water Manag. 1999, 40, 45–50. [Google Scholar] [CrossRef]
  63. Karimi, P.; Bastiaanssen, W.G.M.; Molden, D. Water Accounting Plus (WA+)—A water accounting procedure for complex river basins based on satellite measurements. Hydrol. Earth Syst. Sci. 2013, 17, 2459–2472. [Google Scholar] [CrossRef]
  64. Molden, D.J.; Sakthivadivel, R. Water Accounting to Assess Use and Productivity of Water. Int. J. Water Resour. Dev. 1999, 15, 55–71. [Google Scholar] [CrossRef]
  65. Yan, N.; Wu, B. Integrated spatial–temporal analysis of crop water productivity of winter wheat in Hai Basin. Agric. Water Manag. 2014, 133, 24–33. [Google Scholar] [CrossRef]
  66. Zhang, J.; Zhou, H.; CAS. Land Use and Land Cover Change of Yanqi Basin, Xinjiang in the Resent 40 Years. Resour. Sci. 2004, 26, 30–37. [Google Scholar]
  67. Jiao, Z. Application of High Efficiency Water-saving Irrigation Technology in Farmland Water Conservancy Project. Mod. Agric. Res. 2019, 2, 100–102. [Google Scholar] [CrossRef]
  68. Liao, Y.; Dong, Y.; Chen, X.; Liang, Y.; Wang, S.; Zhang, W. Water-Saving Technology in Irrigation. Appl. Mech. Mater. 2012, 178–181, 847–850. [Google Scholar] [CrossRef]
  69. Bazza, M. Policies for water management and food security under water-scarcity conditions: The case of GCC countries. In Proceedings of the 7th Gulf Water Conference, Kuwait, Kuwait, 19–23 November 2005; pp. 19–23. [Google Scholar]
  70. Varela-Ortega, C. Water pricing policies, public decision making and farmers’ response: Implications for water policy. Agric. Econ. 1998, 19, 193–202. [Google Scholar] [CrossRef]
Figure 1. Location map of the irrigation district in Yanqi Basin.
Agronomy 13 02990 g001
Figure 2. Location of the counties and water systems through which the Yanqi Basin irrigation district operates.
Agronomy 13 02990 g002
Figure 3. Map of the Kaidu–Kongqi River Basin.
Agronomy 13 02990 g003
Figure 4. IWMI water budget methodology for supply and consumption discharges.
Agronomy 13 02990 g004
Figure 5. Distribution of arable land area in the irrigation district of the Yanqi Basin.
Agronomy 13 02990 g005
Figure 6. Irrigation water supply, water use, water discharge, and water consumption.
Agronomy 13 02990 g006
Figure 7. Actual water consumption in irrigation districts (a) and irrigation water utilization coefficient (b).
Agronomy 13 02990 g007
Figure 8. Trends in statistical data on water use, water discharge, and water consumption in irrigation districts.
Agronomy 13 02990 g008
Figure 9. Area of irrigation district and changes in (a) irrigation district; (b) precipitation and irrigation in irrigation districts.
Agronomy 13 02990 g009
Figure 10. Change in (a) water availability and water consumption.; (b) irrigation diversion and water consumption.
Agronomy 13 02990 g010
Figure 11. (a) Water diversion and precipitation; water diversion and water consumption; (b) water consumption and precipitation.
Agronomy 13 02990 g011
Figure 12. Traditional water use efficiency indicators for irrigation districts.
Agronomy 13 02990 g012
Figure 13. Water consumption ratio index compared with (a) actual irrigation water consumption per hectare of farmland and (b) water consumption.
Agronomy 13 02990 g013
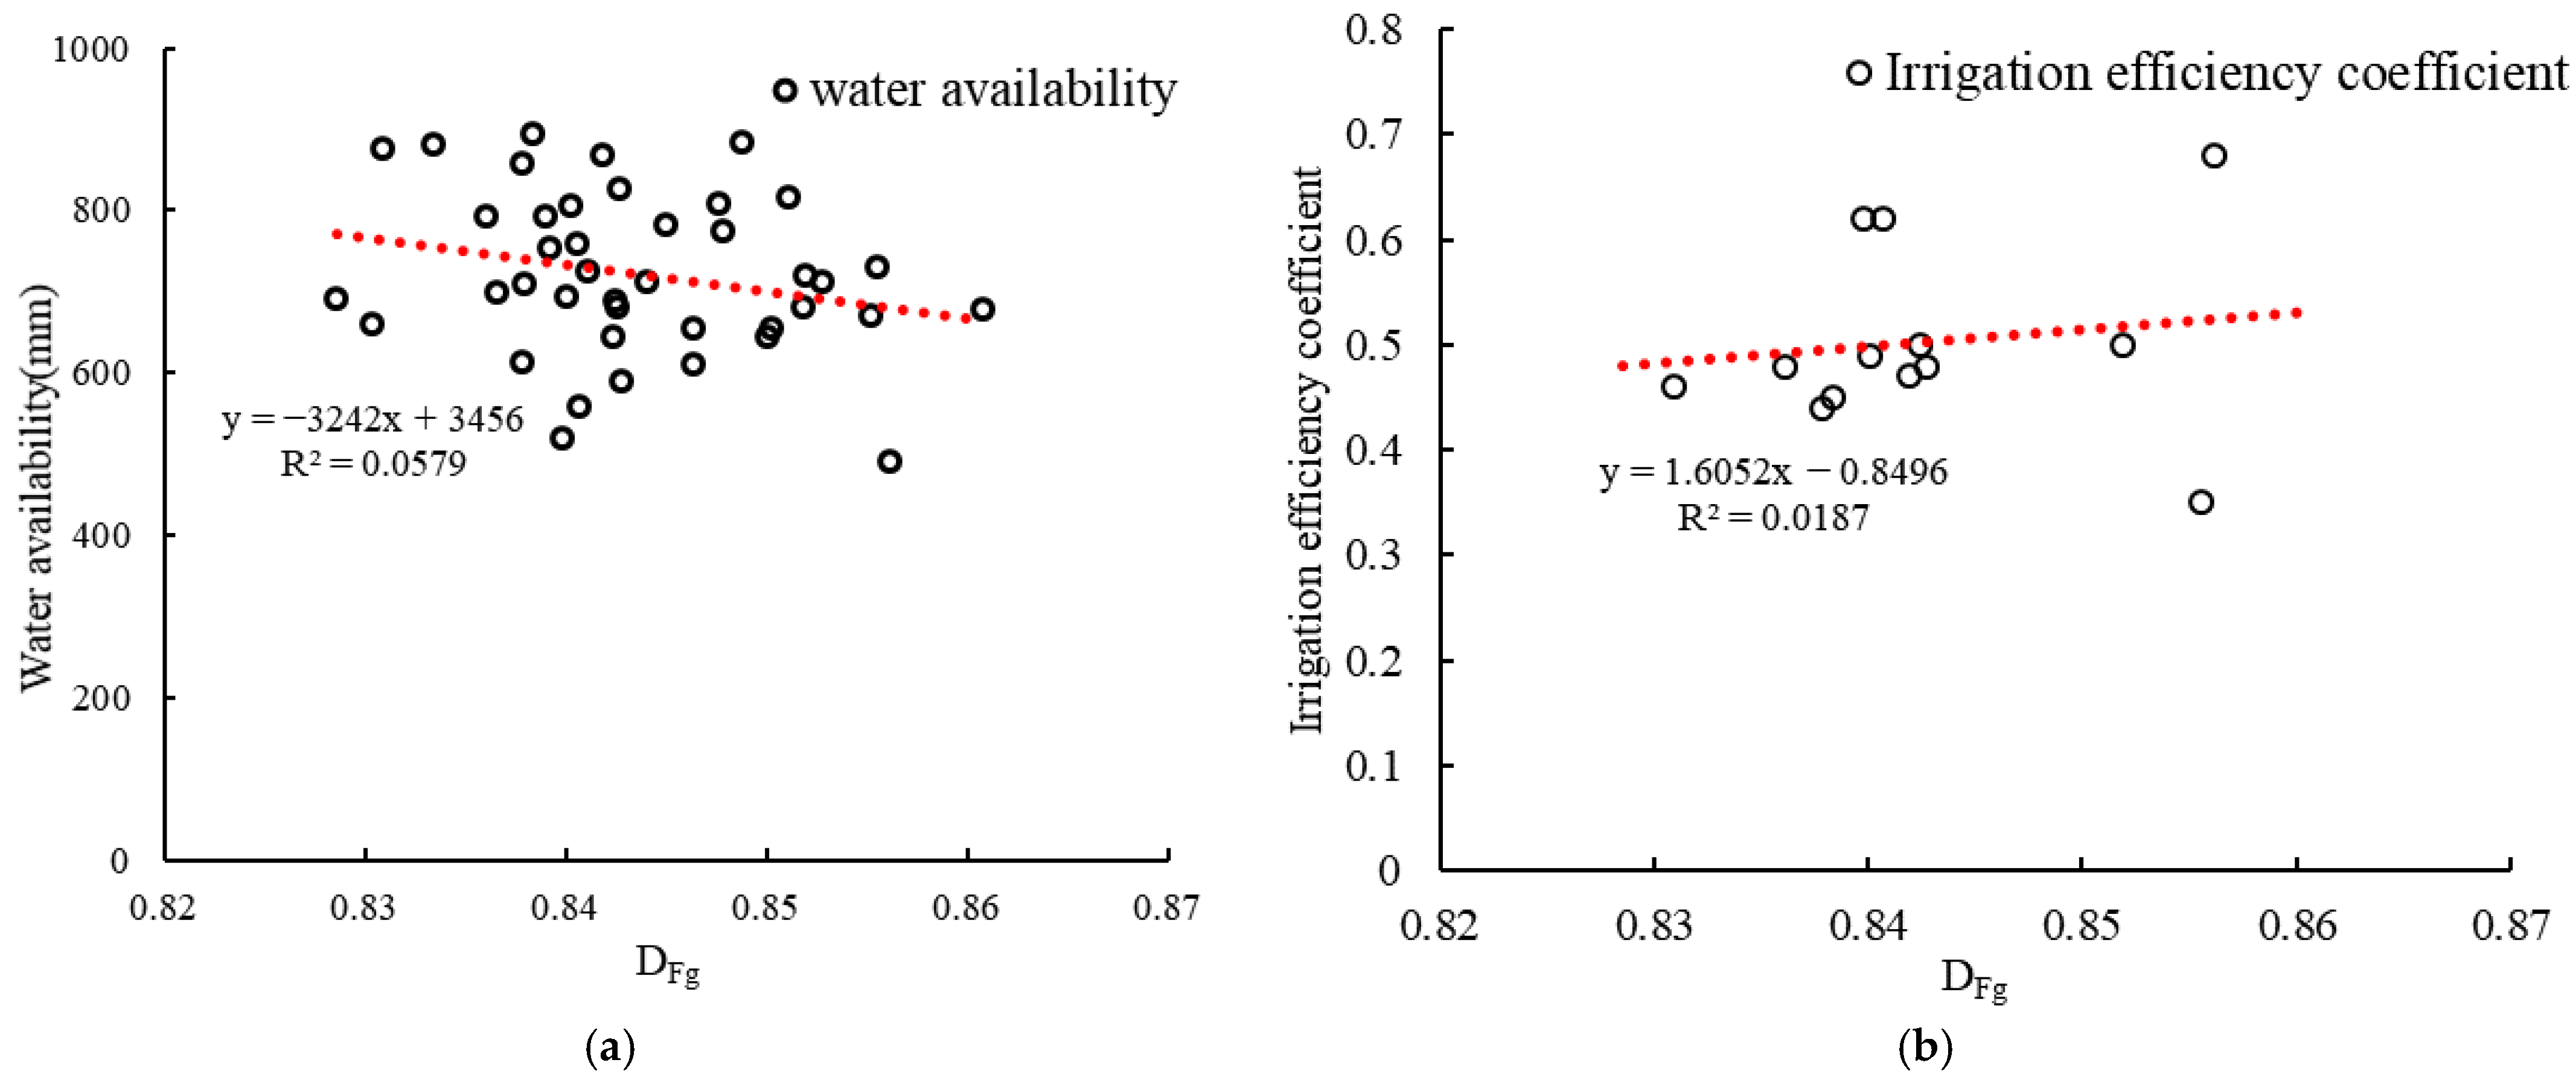
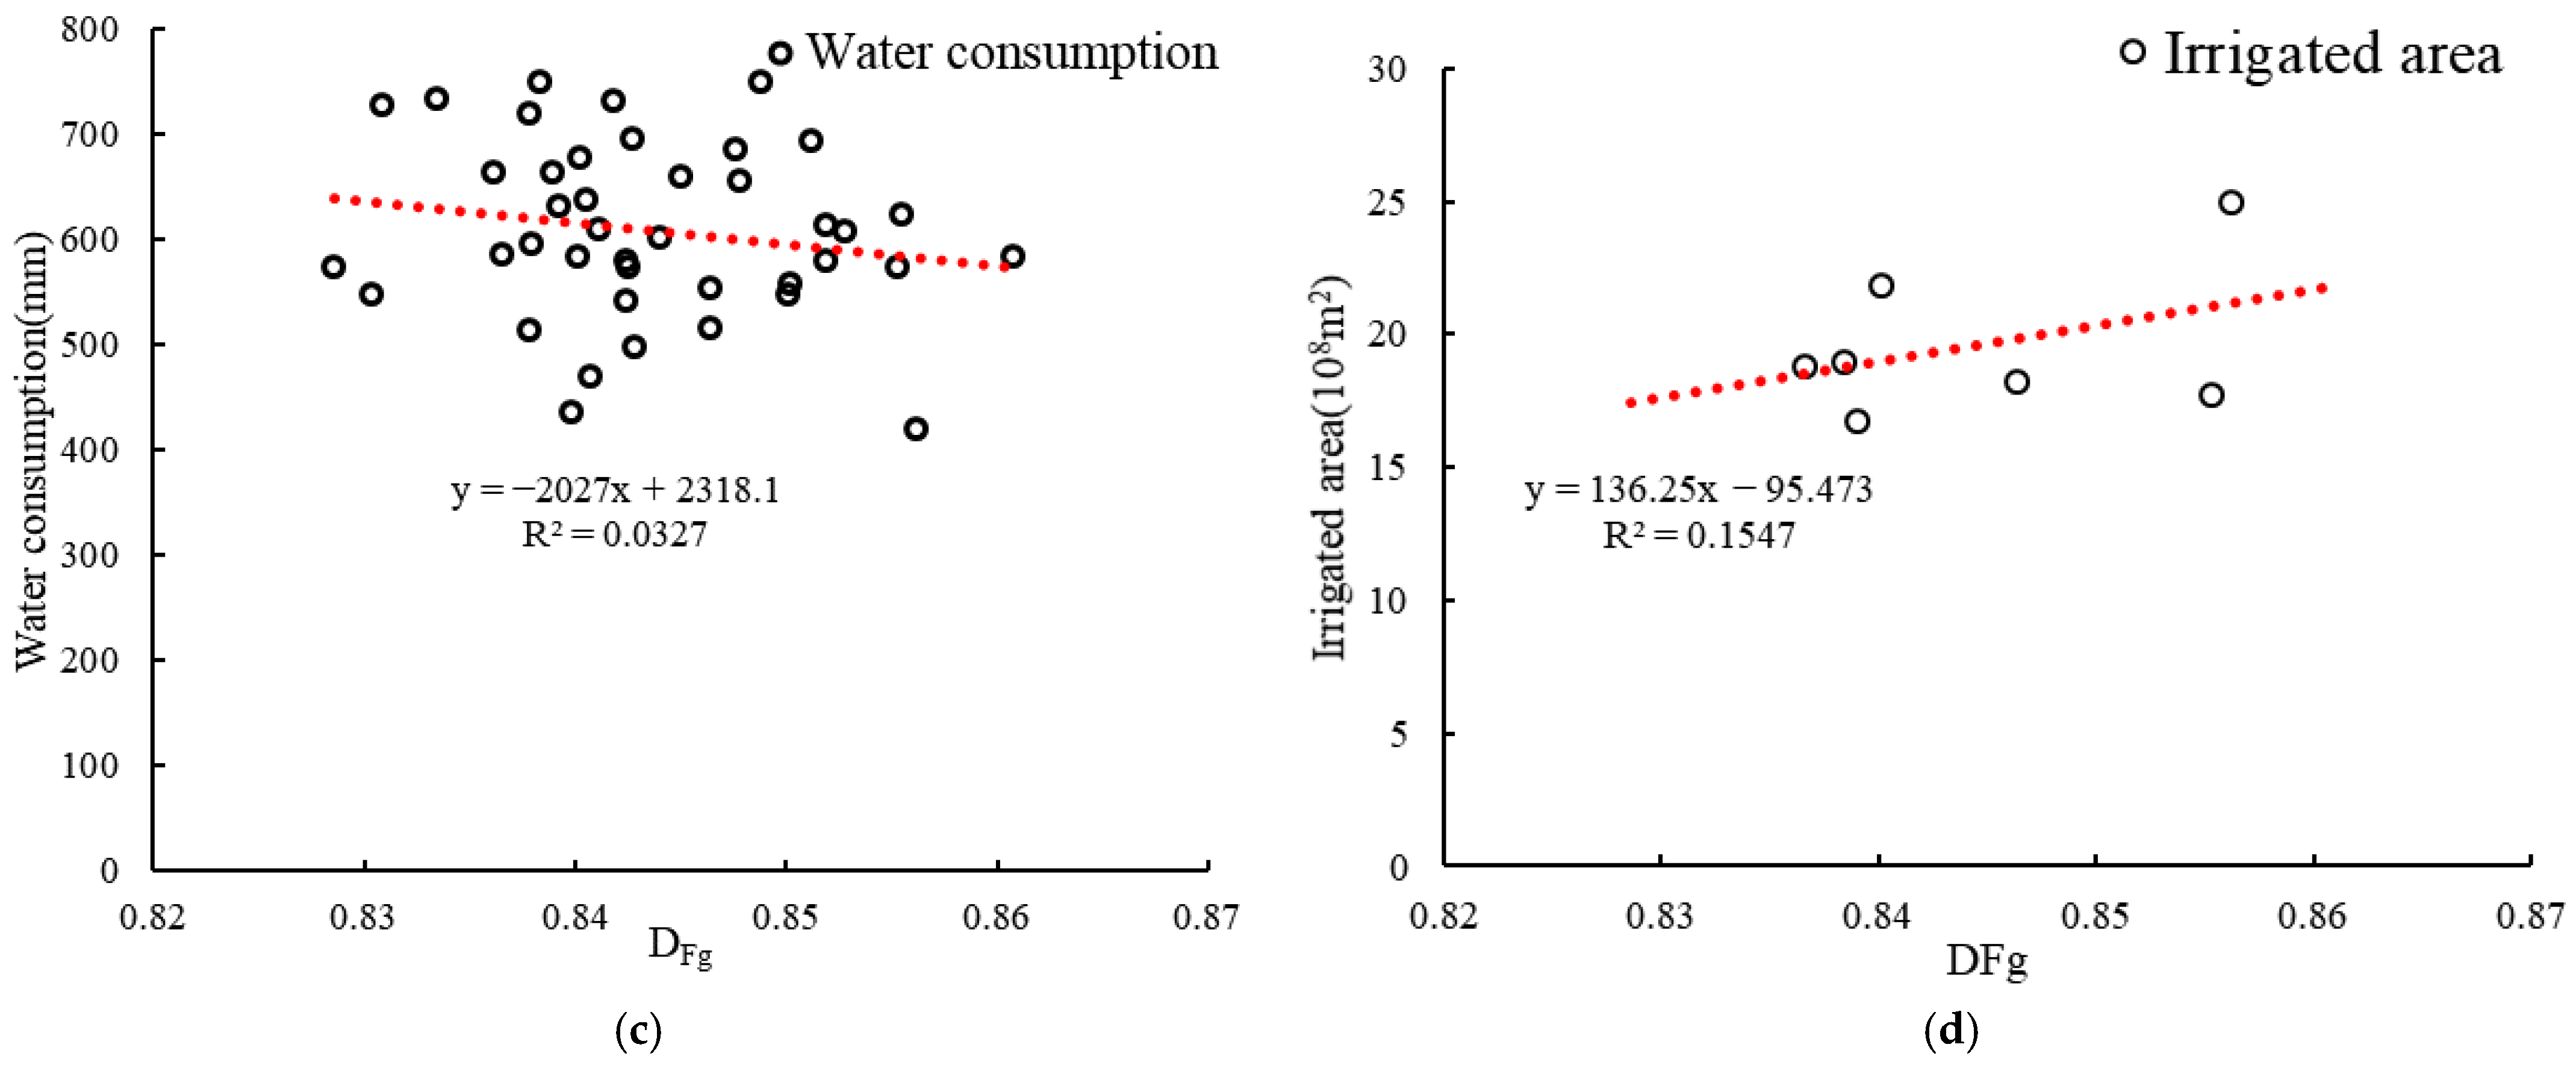
Figure 14. Changes in water consumption ratio indicators with (a) the water availability, and (b) irrigation efficiency coefficient, (c) water consumption, and (d) irrigated area.
Agronomy 13 02990 g014aAgronomy 13 02990 g014b
Figure 15. Relationship between the area of cultivated land and water use efficiency coefficients in irrigation.
Agronomy 13 02990 g015
Table 1. Data used in the study.
Data TypeData Sources
Remote sensing dataRemote sensing monitoring data on the current status of 1 km land use in China (1990–2020)Data Centre for Resource and Environmental Sciences, Chinese Academy of Sciences (https://www.resdc.cn (accessed on 17 March 2023))
Station dataYanqi meteorological station (1951–2021)National Meteorological Center (NMC) (https://data.cma.cn (accessed on 28 June 2023))
Statistical dataIrrigation diversion, irrigated area, water use efficiency coefficients, surface water supply, groundwater supply, water consumption by industry, etc.Bayingolin Statistical Yearbook, Bayingolin Water Resources Bulletin, documentation, etc.
Table 2. Water consumption in different sectors in the irrigation districts (unit: 108 m3).
YearWater Use in AgricultureIndustrial Water ConsumptionDomestic Water ConsumptionEcological and Environmental RechargeTotal Water Consumption
200912.5970.1200.1220.42013.259
201015.9550.1990.2220.25816.634
201118.9410.4160.1830.38219.923
201217.0930.5830.2910.44318.411
201316.8290.4990.2990.13717.764
201410.2070.5170.3550.12611.205
201515.9760.4600.2990.13916.875
201615.4510.3950.3140.27416.434
201714.5680.4020.2200.43415.624
201812.9110.2450.1900.59513.941
201911.5800.2020.1880.83912.808
20209.9840.1960.1601.50611.845
Mean14.3410.3530.2370.46315.394
Table 3. Percentage of water use in agriculture, and percentage of groundwater and surface water out of total water consumption in irrigation districts.
YearPercentage of Water Used in Agriculture in Total Water ConsumptionPercentage of Surface Water in Total Water ConsumptionPercentage of Groundwater in Total Water Consumption
20090.9500.7680.232
20100.9590.6720.328
20110.9510.6990.301
20120.9280.6540.346
20130.9470.6370.363
20140.9110.8140.186
20150.9470.5680.432
20160.9400.5710.429
20170.9320.5750.425
20180.9260.5880.412
20190.9040.5720.428
20200.8430.6470.353
Mean0.9280.7680.232
Table 4. Water supply and consumption in irrigation districts (unit: 108 m3).
YearWater SupplyWater Consumption
Irrigation WaterIrrigation Water from GroundwaterIrrigation Water from Surface WaterNet Irrigation Water
199810.613.007.615.68
200924.772.5122.2612.31
201015.653.2112.458.78
201113.414.648.778.65
201211.904.657.258.07
201313.153.519.658.09
201413.503.819.708.47
201514.374.2310.149.16
201612.453.698.778.03
201711.923.228.707.59
201812.263.298.978.83
201911.593.208.398.43
202012.293.428.889.45
Mean13.683.5710.128.58
Table 5. Drainage, water consumption, and irrigated area in irrigation districts.
YearFarmland Drainage
/(108 m3)
Water Consumption
/(108 m3)
Irrigated Area
/(108 m2)
Actual Evaporation
/(mm)
19981.935.1812.07429.12
20091.8711.2917.54643.93
20102.737.3217.87409.65
20112.808.3617.93466.10
20122.605.8718.00325.99
20132.466.9318.07383.60
20142.466.6218.13364.89
20152.427.8118.20429.09
20162.376.8318.27373.71
20172.206.3918.28349.45
20181.948.5218.33464.53
20191.829.4418.33515.06
20201.768.9518.33488.22
Mean2.267.6517.64434.10
Table 6. Water balance terms for each water saving irrigation stage in the Yanqi Basin irrigation district, 1980–2020. (unit: mm).
YearDiversion Volume
I
Effective Rainfall
P
Farmland Drainage
O
water Consumption
E
1980726.0865.10127.39663.78
1981759.57122.60133.37748.80
1982731.4673.70128.59676.57
1983702.15106.40123.21685.35
1984688.4063.10120.81630.68
1985674.6416.20118.42572.42
1986610.6548.80111.84547.60
1987595.69115.60104.67606.63
1988604.07115.00106.46612.61
1989608.8571.20107.06572.99
1990570.6483.20100.44553.40
1991549.6794.6096.58547.69
1992535.87142.1094.37583.60
1993653.4269.50114.87608.05
1994528.7061.1092.72497.08
1995550.88118.1096.83572.15
1996530.6378.3093.54515.39
1997557.4496.5097.92556.02
1998599.02129.80105.31623.51
1999576.5966.60101.36541.82
2000668.91104.00117.59655.31
2001790.4866.70138.97718.21
2002687.3970.60120.84637.15
2003689.08124.90121.14692.84
2004833.0546.50146.45733.10
2005648.9649.15114.09584.03
2006687.7392.56120.90659.39
2007653.7455.64114.93594.46
2008631.9780.33111.10601.20
2009563.8947.6499.13512.40
2010820.4272.10144.23748.29
2011840.7433.40147.80726.34
2012779.8987.28137.11730.07
2013738.7986.83129.88695.73
2014738.7953.76129.88662.66
2015630.5462.82110.85582.51
2016615.9171.42108.28579.06
2017573.25107.29100.78579.76
2018505.2652.4788.82468.91
2019473.0646.1383.16436.03
2020400.9689.1770.49419.64
Disclaimer/Publisher’s Note: The statements, opinions and data contained in all publications are solely those of the individual author(s) and contributor(s) and not of MDPI and/or the editor(s). MDPI and/or the editor(s) disclaim responsibility for any injury to people or property resulting from any ideas, methods, instructions or products referred to in the content.