Article

Effects of the Combined Application of Nitrogen and Selenium on Tea Quality and the Expression of Genes Involved in Nitrogen Uptake and Utilization in Tea Cultivar ‘Chuancha No.2’

1
College of Horticulture, Sichuan Agricultural University, Chengdu 611130, China
2
Tea Refining and Innovation Key Laboratory of Sichuan Province, Sichuan Agricultural University, Chengdu 611130, China
3
College of Horticulture and Landscape Architecture, Southwest University, Chongqing 400715, China
*
Author to whom correspondence should be addressed.
These authors contributed equally to this work.
Agronomy 2023, 13(12), 2997; https://doi.org/10.3390/agronomy13122997 (registering DOI)
Submission received: 31 October 2023 / Revised: 20 November 2023 / Accepted: 25 November 2023 / Published: 6 December 2023

Abstract

:
Nitrogen (N) and selenium (Se) are beneficial for tea growth and tea quality; however, it is unknown how the combined application of N and Se affects tea quality and N uptake and utilization in tea plants. In the present study, a hydroponic experiment with three N levels (0, 2 and 4.5 mmol/L) and three Se levels (0, 0.3 and 3 mg/L) was carried out with ‘Chuancha No.2’ as the material, and the contents of tea polyphenols, amino acids and caffeine as well as the expression levels of genes related to N uptake and utilization in tea plants were tracked. The findings reveal that the contents of tea polyphenols, AAs and caffeine in new shoots were the highest when supplied with 0.3 mg/L Se and 4.5 mmol/L N, while the contents of total N, AAs and tea polyphenols in mature leaves were the highest at the concentrations of 3 mg/L Se and 2 mmol/L N. Se supply (0.3 and 3 mg/L) induced an increase in amino acid and tea polyphenol contents in tea shoots under N deficiency conditions, whereas total N content, tea polyphenols and AAs in mature leaves and total N content in tea roots decreased significantly. When supplied with N (2 mmol/L and 4.5 mmol/L), the contents of tea polyphenols and caffeine in new shoots first increased and then decreased with the increase in Se concentration, while the total N content in mature leaves and roots increased. In leaves, CsAMT1.1, CsAMT1.2 and CsAMT3.1 had similar trends, and their expression levels were remarkably upregulated when supplied with 0.3 mg/L Se or 2 mmol/L N, respectively; the expression level of CsGS1.1 was significantly induced by N and Se, while CsGS1.2 and CsTS1 were mainly induced by N. In roots, CsAMT1.1 could play a major role in N uptake under the combined application of N and Se; CsGS1.2 expression was significantly induced compared to CsGS1.1 under the combined application of N and Se. This study explored the potential of the interaction of Se and N to promote tea quality and N uptake and utilization in tea plants.

1. Introduction

Tea is one of the most popular nonalcoholic beverages largely due to its abundant specialized metabolites; it is processed from the leaves of Camellia sinensis (L.) O. Kuntze [1]. Tea leaves are plucked and pruned multiple times throughout the year, so tea plants have a high demand for N, ranging from 300 to 450 kg/hm2 per year, to guarantee the regular growth of the tea plants [2]. N is involved not only in the growth and development of the tea plant but also in many important metabolic pathways with amino acids (AAs), caffeine, polyphenols and other substances responsible for the quality of tea [3]. Chinese tea gardens are mostly distributed in red and yellow soil areas, and the soil fertility is low; a significant amount of N fertilizer is allocated to these gardens to increase economic efficiency [4]. However, the extensive use of N fertilizer in tea cultivation has had a detrimental effect on the agroecosystem [5,6]. The application of excessive N leads to an influx of NH4+ into the soil, and NH4+ competes with salt-based ions for adsorption sites, resulting in soil acidification in tea gardens [7]. Some studies indicated that moderate N can lead to an increase in tea production [8]; however, the application of excessive N fertilization can impede N utilization, making it hard to enhance tea yield and quality [9]. Therefore, developing and optimizing a N management approach to increase tea quality and yields is critical [10]. Hence, it is essential to analyze N uptake and utilization in tea plants and to enhance the N utilization efficiency absorption for scientific administration during tea planting.
Se (Se) is an essential trace element with biological functions, and it is important for human health [11]. Plants can convert absorbed inorganic Se into selenoprotein and other forms of organic Se; selenoprotein is a good carrier and food source of Se supplementation for the body. Additionally, as a beneficial element for plants, Se can promote plant growth by improving photosynthetic efficiency and N accumulation [12,13]. In addition, some studies have suggested that the application of Se can promote the quality of some legumes [14]. Tea plants have the ability to accumulate Se [15]. Some studies have revealed that a suitable quantity of exogenous Se can boost photosynthesis and the uptake of minerals in tea plants, impede the absorption of detrimental elements and enhance biomass; in addition, it significantly boosts the amount of organic Se in tea and encourages the buildup of AAs, tea polyphenols, flavonoids and volatile secondary metabolites, thus enhancing the quality of tea leaves [16]. Different nutrients are not regulated independently in plants. It was found that there is a synergistic regulatory mechanism among different elements in plants [17]. At present, some studies have been conducted to evaluate the influence of N and Se on the growth and development of plants. Lei et al. found that Se application increased biomass and N accumulation in legumes [18]. Compared with sole N fertilizer, the combined application of Se and N significantly increased fruit yield and quality [19]. Similarly, the combination of N and Se could increase potato yield and Se content in tubers [20]. An analysis of tea plants revealed that the exogenous application of Se significantly increased Se content in all parts of tea plants and that the addition of N fertilizer under these conditions improved Se utilization by tea plants and increased Se content in all parts of tea plants [21]. Furthermore, the expression of genes that encode enzymes involved in N metabolism is similarly impacted by Se treatment. Studies have shown that Se application significantly increased the activities of glutamine synthetase (GS) and glutamate synthase (GOGAT) in tea leaves [22], with comparable outcomes observed in research conducted on pepper [23] and lettuce [24]. Sun et al. found that Se application could enhance the expression levels of CsGS, CsGOGAT and CsGDH in tea plants [25]. However, there is a lack of research on how N and Se interact with tea quality components and N metabolism. Hence, when considering the advancement of Se-enriched tea nationwide, it is crucial to judiciously distribute N and Se fertilizers and investigate the impacts of both on tea quality and N metabolism in tea plants.
Based on these studies, the primary objectives of this study were to examine differences in the tea quality compositions of tea plants (‘Chuancha No.2’) subjected to three concentrations of N and Se under hydroponic conditions and to investigate N uptake and utilization-related gene expression levels in tea plants in order to provide a theoretical foundation for the scientific fertilization of tea gardens in the region.

2. Materials and Methods

2.1. Plant Materials and Treatments

In this study, 1-year-old tea cuttings (Camellia sinensis, ‘Chuancha No.2’) were obtained from Xiangshui Cooperative, Ya’an, Sichuan, China. The selection of plants was based on an identical batch of one-year-old cuttings, ensuring congruity in their physiological attributes. The hydroponic experiment was conducted in the hydroponic chamber of Sichuan Agricultural University.
We chose cuttings that are firmly established and consistent and cleansed the soil from their roots. After introducing distilled water to the scale line in the black plastic basin, the tea seedlings were placed in the hydroponics room of the Department of Tea Science, Sichuan Agricultural University and fixed with foam boards at six plants per pot. Afterward, they were incubated in aeration for 7 days before being placed in a culture solution. The hydroponic nutrient solution formula refers to the hydroponics method of the Tea Leaf Research Institute, Chinese Academy of Agricultural Sciences [26]. The culture conditions were 70% humidity, 25 °C, a light cycle of 14 h/10 h (light/dark), nutrient solution pH of about 5.0, timely regulation of solution pH with H2SO4 and NaOH, 24 h daily ventilation, and small exhaust pumps to ensure oxygen to the roots. The pre-culture process concluded once the tea seedlings sprouted numerous white new roots and resumed their normal growth and development.
(NH4)2SO4 was used as the N source and set at three N levels for treatments: N deficiency (0 mmol/L, N0), suitable N (2 mmol/L, N1) and high N (4.5 mmol/L, N2) [27]; Na2SeO3 was used as the Se source and set at three Se levels for treatments: Se deficiency (0 mg/L, Se0), suitable Se (0.3 mg/L, Se1) and high Se (3 mg/L, Se2) [28] for a total of nine treatments, as shown in Supplementary Table S1. The nutrition solution was replaced once a week, and the other essential ingredients remained unaltered. Following 14 days in culture, the roots, mature leaves, and new shoots (one bud and two leaves) were removed. The samples were divided into two duplicates, one of which was fixed using a microwave oven (power 1.0 kW, 2 min) immediately after being plucked, dried at 70 °C and ground into powder for biochemical composition analysis. The remaining samples were snap-frozen with liquid nitrogen and stored at −80 °C for RNA extraction and gene expression analysis.

2.2. Determination of Major Tea Quality Components

The tea polyphenols were detected according to the National Standard of China (GB/T 8313-2018) [29]. The extraction method was as follows: A total of 0.2 g of crushed freeze-dried sample was placed into a 10 mL centrifuge tube, then 5 mL of 70% methanol preheated at 70 °C was added, upon which the tube was immediately moved into a 70 °C water bath, extracted for 10 min (stirred once every 5 min), cooled to room temperature after extraction, centrifuged at 3500 r/min for 10 min, and the supernatant was transferred to a 10 mL volumetric flask. The residue was extracted with 5 mL of 70% methanol in water again, and the above operation was repeated. The tea polyphenols were measured at 765 nm using a UV spectrophotometer (UV T5, Shanghai, China) according to the Folin–Ciocalteu method. The free amino acids were detected according to the National Standard of China (GB/T 8305-2013) [30]. The methods were as follows: Weigh 2 g of the crushed freeze-dried sample, add 40 mL of boiling water, and perform water bath extraction for 45 min. Use the ninhydrin colorimetry method to determine the extract. Determine the caffeine content according to the National Standard of China (GB/T 8312-2013) [31]. Briefly, weigh 3 g of crushed freeze-dried sample, add 40 mL of boiling water and perform water bath extraction for 45 min. An ultraviolet spectrophotometer was adopted to determine the extracts.

2.3. Determination of Carbon and Nitrogen Content

The samples were weighed and wrapped, and the N and carbon (C) contents were determined using a Vario MACRO Cube elemental analyzer (Vario Max CN Analyzer; Elementar Analysensysteme GmbH, Langenselbold, Germany).

2.4. Analysis of the Expression of Key Genes Involved in Nitrogen Uptake and Utilization

The RNA extraction and reverse transcription of test samples were performed with reference to the Rapid RNA Extraction Kit (EASYspin Plus Complex Plant RNA Kit, Aidlab Biotechnoligies Co., Ltd., Beijing, China) and TRUEscript RT MasterMix (Aidlab Biotechnologies Co., Ltd., Beijing, China) instructions. The TB Green chimeric fluorescence method was employed to perform real-time fluorescence quantitative PCR on CsAMT1.1, CsAMT1.2, CsAMT3.1, CsGS1.1, CsGS1.2 and CsTS1, utilizing the cDNA reverse-transcribed from the sample RNAs as the templates. Subsequently, the impact of various treatments on the expression of associated genes was examined. Zhang et al. provided the specific primers utilized for genes associated with N uptake [32]. The primers used for N assimilation-related genes were obtained from Tang et al. [33]. The primers for the theanine synthesis gene were obtained from Wei et al. [34]. CsGAPDH (GenBank ID KA295375) was employed as the internal reference gene, and the particular fluorescence quantitative qRT-PCR specific primers are displayed in Supplementary Table S2. Abbreviations as follows: GAPDH: glyceraldehyde-3-phosphate dehydrogenase; AMT: ammonium transport protein; GS: glutamine synthetase; TS: theanine synthetase. A TB Green Premix Ex Taq II kit (Takara, Japan) was utilized for real-time fluorescence quantification, with the reaction system consisting of 12.5 μL of TB Green Premix Ex Taq II, 1 μL of both upstream and downstream primers (10 μmol/L), 2 μL of cDNA and the addition of ddH2O to a total volume of 25 μL. The qRT-PCR reaction platform employed was the Burroughs CFX96 fluorescence quantitative PCR instrument (Bio-Rad, Hercules, CA, USA). The reaction procedure was pre-denaturation at 95 °C for 30 s, denaturation at 95 °C for 5 s, extension at 60 °C for 30 s and 40 cycles. The results were calculated as 2−∆∆Ct via the (Livak) method [35].

2.5. Statistical Analysis

SPSS 27 (SPSS, Chicago, IL, USA) was utilized to conduct a statistical analysis of the data. A two-way ANOVA and Duncan’s calibration were employed to assess the significance of the difference in the data. The data were graphed using Excel 2019 (Microsoft Excel, Redmond, WA, USA).

3. Results

3.1. Effects of Nitrogen and Selenium on the Contents of Tea Polyphenols, Free Amino Acids and Caffeine

3.1.1. Contents of Tea Polyphenol in Tea Shoots

An Analysis of variance (ANOVA) revealed that Se application had a highly significant effect on tea polyphenols of new shoots under hydroponic conditions (F = 1318.48; p ≤ 0.01), N application had a highly significant effect (F = 681.19; p ≤ 0.01), and N and Se dosing had a highly significant effect on tea polyphenols of new shoots (F = 1079.26; p ≤ 0.01). As shown in Figure 1A, under no N application, the polyphenols content of the new shoots significantly increased with the increased Se, especially under the Se2 (3 mg/L) treatment, with an increase of 13.26%. In addition, under both the N1 (2 mmol/L) and the N2 (4.5 mmol/L) treatments, the content of tea polyphenols improved under the application of suitable Se; however, under Se2 (3 mg/L) treatment, the content of tea polyphenols in new shoots was significantly reduced. Under the condition of no Se addition, with the addition of N application levels, the content of tea polyphenols in new shoots showed an increasing and then decreasing trend, especially under N2 (4.5 mmol/L) treatment, where it was substantially lower than N0 (0 mmol/L). The tea polyphenols content of new shoots improved with the N application rate in the Se1 (0.3 mg/L) treatment, and it was the highest under the N2 (4.5 mmol/L) treatment; the tea polyphenols content of new shoots decreased with increased levels of N application in the Se2 (3 mg/L) treatment.

3.1.2. Contents of Amino Acids in Tea Shoots

From the analysis of variance (ANOVA), it was found that the effect of Se application on the AAs of new shoots under hydroponic conditions reached a highly significant level (F = 75.36; p ≤ 0.01), the effect of N application on the AAs of new shoots reached a highly significant level (F = 20.04; p ≤ 0.01) and the effect of N and Se dosing on the AAs of new shoots reached a highly significant level (F = 123.11; p ≤ 0.01). As shown in Figure 1B, the amino acid content of the new shoots increased with Se application under N0 (0 mmol/L) and N1 (2 mmol/L)treatments; the raise rates were 14.54% and 9.54%, respectively, under the Se2 (3 mg/L) treatment. Under the N2 (4.5 mmol/L) treatment, the amino acids content of the new shoots increased under the application of suitable Se and then significantly decreased under the Se2 (3 mg/L) treatment. In all Se treatments, with the addition of N fertilizer employed, the content of amino acids in new shoots decreased first and then increased, and that of the N2 (4.5 mmol/L) treatment was significantly higher than that of the N0 (0 mmol/L) treatment.

3.1.3. Contents of Caffeine in Tea Shoots

From the analysis of variance (ANOVA), it can be seen that the effect of Se application on the caffeine of new shoots under hydroponic conditions reached a significant level (F = 202.16; p ≤ 0.01), the effect of N application on the caffeine of new shoots reached a highly significant level (F = 200.84; p ≤ 0.01) and the effect of N and Se dosing on the caffeine of new shoots reached a level of significance (F = 223.92; p ≤ 0.01). Figure 1C shows that the caffeine content of new shoots decreased with the application of Se1 (0.3 mg/L) under the N0 (0 mmol/L) treatment, while the caffeine content of the new shoots in the Se2 (3 mg/L) treatment prominently increased compared with the Se0 (0 mmol/L) treatment; the increase was 46.15%. Under the N1 (2 mmol/L) and N2 (4.5 mmol/L) treatments, adding the Se supply led to increased and then decreased caffeine content in new shoots. The caffeine content of new shoots increased and then decreased in the Se0 treatment with an expanding N supply. The caffeine content in the Se1 (0.3 mg/L) treatment climbed with increasing N application. Under the Se2 (3 mg/L) treatment, the caffeine content of new shoots was significantly reduced in the N1 treatment (2 mmol/L); however, both the N0 (0 mmol/L) and N2 (4.5 mmol/L) treatments had no significant difference.

3.2. Content of Tea Polyphenols and Amino Acids in Mature Leaves of Tea Plants

As shown in Table 1, the effects of Se and N application on tea polyphenols and amino acids of mature tea plant leaves under hydroponic conditions reached highly significant levels (p ≤ 0.01), and the effects of N and Se dosing on tea polyphenols and amino acids in mature leaves reached marked levels (p ≤ 0.01), respectively. Raising levels of Se application decreased and then increased the tea polyphenol content in mature leaves under N0 (0 mmol/L) and N1 (2 mmol/L) treatments. In contrast, the tea polyphenol content first increased and then fell with improving levels of Se application under the N2 (4.5 mmol/L) treatment, while compared to the Se0 (0 mg/L) treatment, the tea polyphenol content increased by 13.72% under the Se1 (0.3 mg/L) treatment. Increasing the N application led to a reduction in the tea polyphenol content in the N0 (0 mmol/L) treatment; the tea polyphenol content decreased and then elevated with the addition of the N application level in the Se1 (0.3 mg/L) treatment. Under the Se2 (3 mg/L) treatment, the tea polyphenol content dropped with increasing levels of N application; the tea polyphenol content was significantly lower under N2 (4.5 mmol/L) treatment than under N0 (0 mmol/L) treatment in mature leaves.
Table 1 shows that the amino acids content of mature leaves in the N0 treatment decreased with N0Se1 and then increased with N0Se2 with rising levels of Se application, and both the Se0 (0 mg/L) and Se2 (3 mg/L) treatments of the amino acids content had no significant difference. Similarly, under the N1 (2 mmol/L) treatment, both the Se0 (0 mg/L) and Se1 (0.3 mg/L) treatments of the amino acids content had no noticeable difference, but the amino acids content significantly increased under the Se2 (3 mg/L) treatment, with a growth rate of 42.44% compared to the Se0 (0 mg/L) treatment. The amino acids content first increased and then decreased with added levels of Se application under the N2 (4.5 mmol/L) treatment; moreover, there was no significant difference in amino acids content between the Se0 (0 mg/L) and Se2 (3 mg/L) treatments. In the Se0 (0 mg/L) treatment, the amino acids content was slightly higher under the N0 (0 mmol/L) treatment than the other two N treatments. The amino acids content was slightly higher under the N2 (4.5 mmol/L) treatment than the other two N treatments for the Se1 (0.3 mg/L) treatment. In addition, the amino acids content in the Se2 (3 mg/L) treatment increased and then decreased with improving levels of N application.

3.3. Total Nitrogen and Carbon Contents of Mature Leaves and Roots

As the results of the ANOVA in Supplementary Table S3 show, the effects of N and Se application on the mature leaf N content, root N content and root C content of tea plants under hydroponic conditions reached highly significant levels (p ≤ 0.01), respectively, while the effects of N and Se application on mature leaf C content were not significant. The effects of N and Se rationing on the mature leaf N content, mature leaf C content, root N content and root C content of tea plants reached highly significant levels (p ≤ 0.01).
Figure 2A,C show that similar results were also observed between the total N content of roots and mature leaves for different treatments; N content decreased with increasing levels of Se application under the N0 (0 mmol/L) treatment. The N content increased with increasing levels of Se application in the N1 (2 mmol/L) and N2 (4.5 mmol/L) treatments. Under the Se0 (0 mg/L) treatment, the N content in roots and mature leaves first decreased and then increased with the addition of N application; however, changes in N content were more found in the roots than in the mature leaves. Under the Se1 (0.3 mg/L) and Se2 (3 mg/L) treatments, the N content in mature leaves increased and then reduced with improving the level of N application, while in roots it showed the opposite trend. Figure 2B,D show that the C content of the mature leaves and roots in each treatment show different trends. The C content of mature leaves fell with increasing Se supply in the N0 (0 mmol/L) treatment. Under the N1 (2 mmol/L) treatment, raising levels of Se application led to an increase and then a decrease in mature leaves, and the C content was higher in the Se2 (3 mg/L) treatment than in the Se0 (0 mg/L) treatment. Under the N2 (4.5 mmol/L) treatment, the C content in the Se0 (0 mg/L) treatment first decreased and then climbed with the increase in Se application. The C content in the roots of each N treatment showed a trend of decreasing and then increasing with increasing Se use. Under the Se0 (0 mg/L) and Se1 (0.3 mg/L) treatments, the C content of the mature leaves slightly decreased with increasing N supply; meanwhile, additional N supply increased the C content in roots. Increasing N supply led first to growth and then dropped the C content in both mature leaves and roots under that of the Se2 (3 mg/L) treatment.

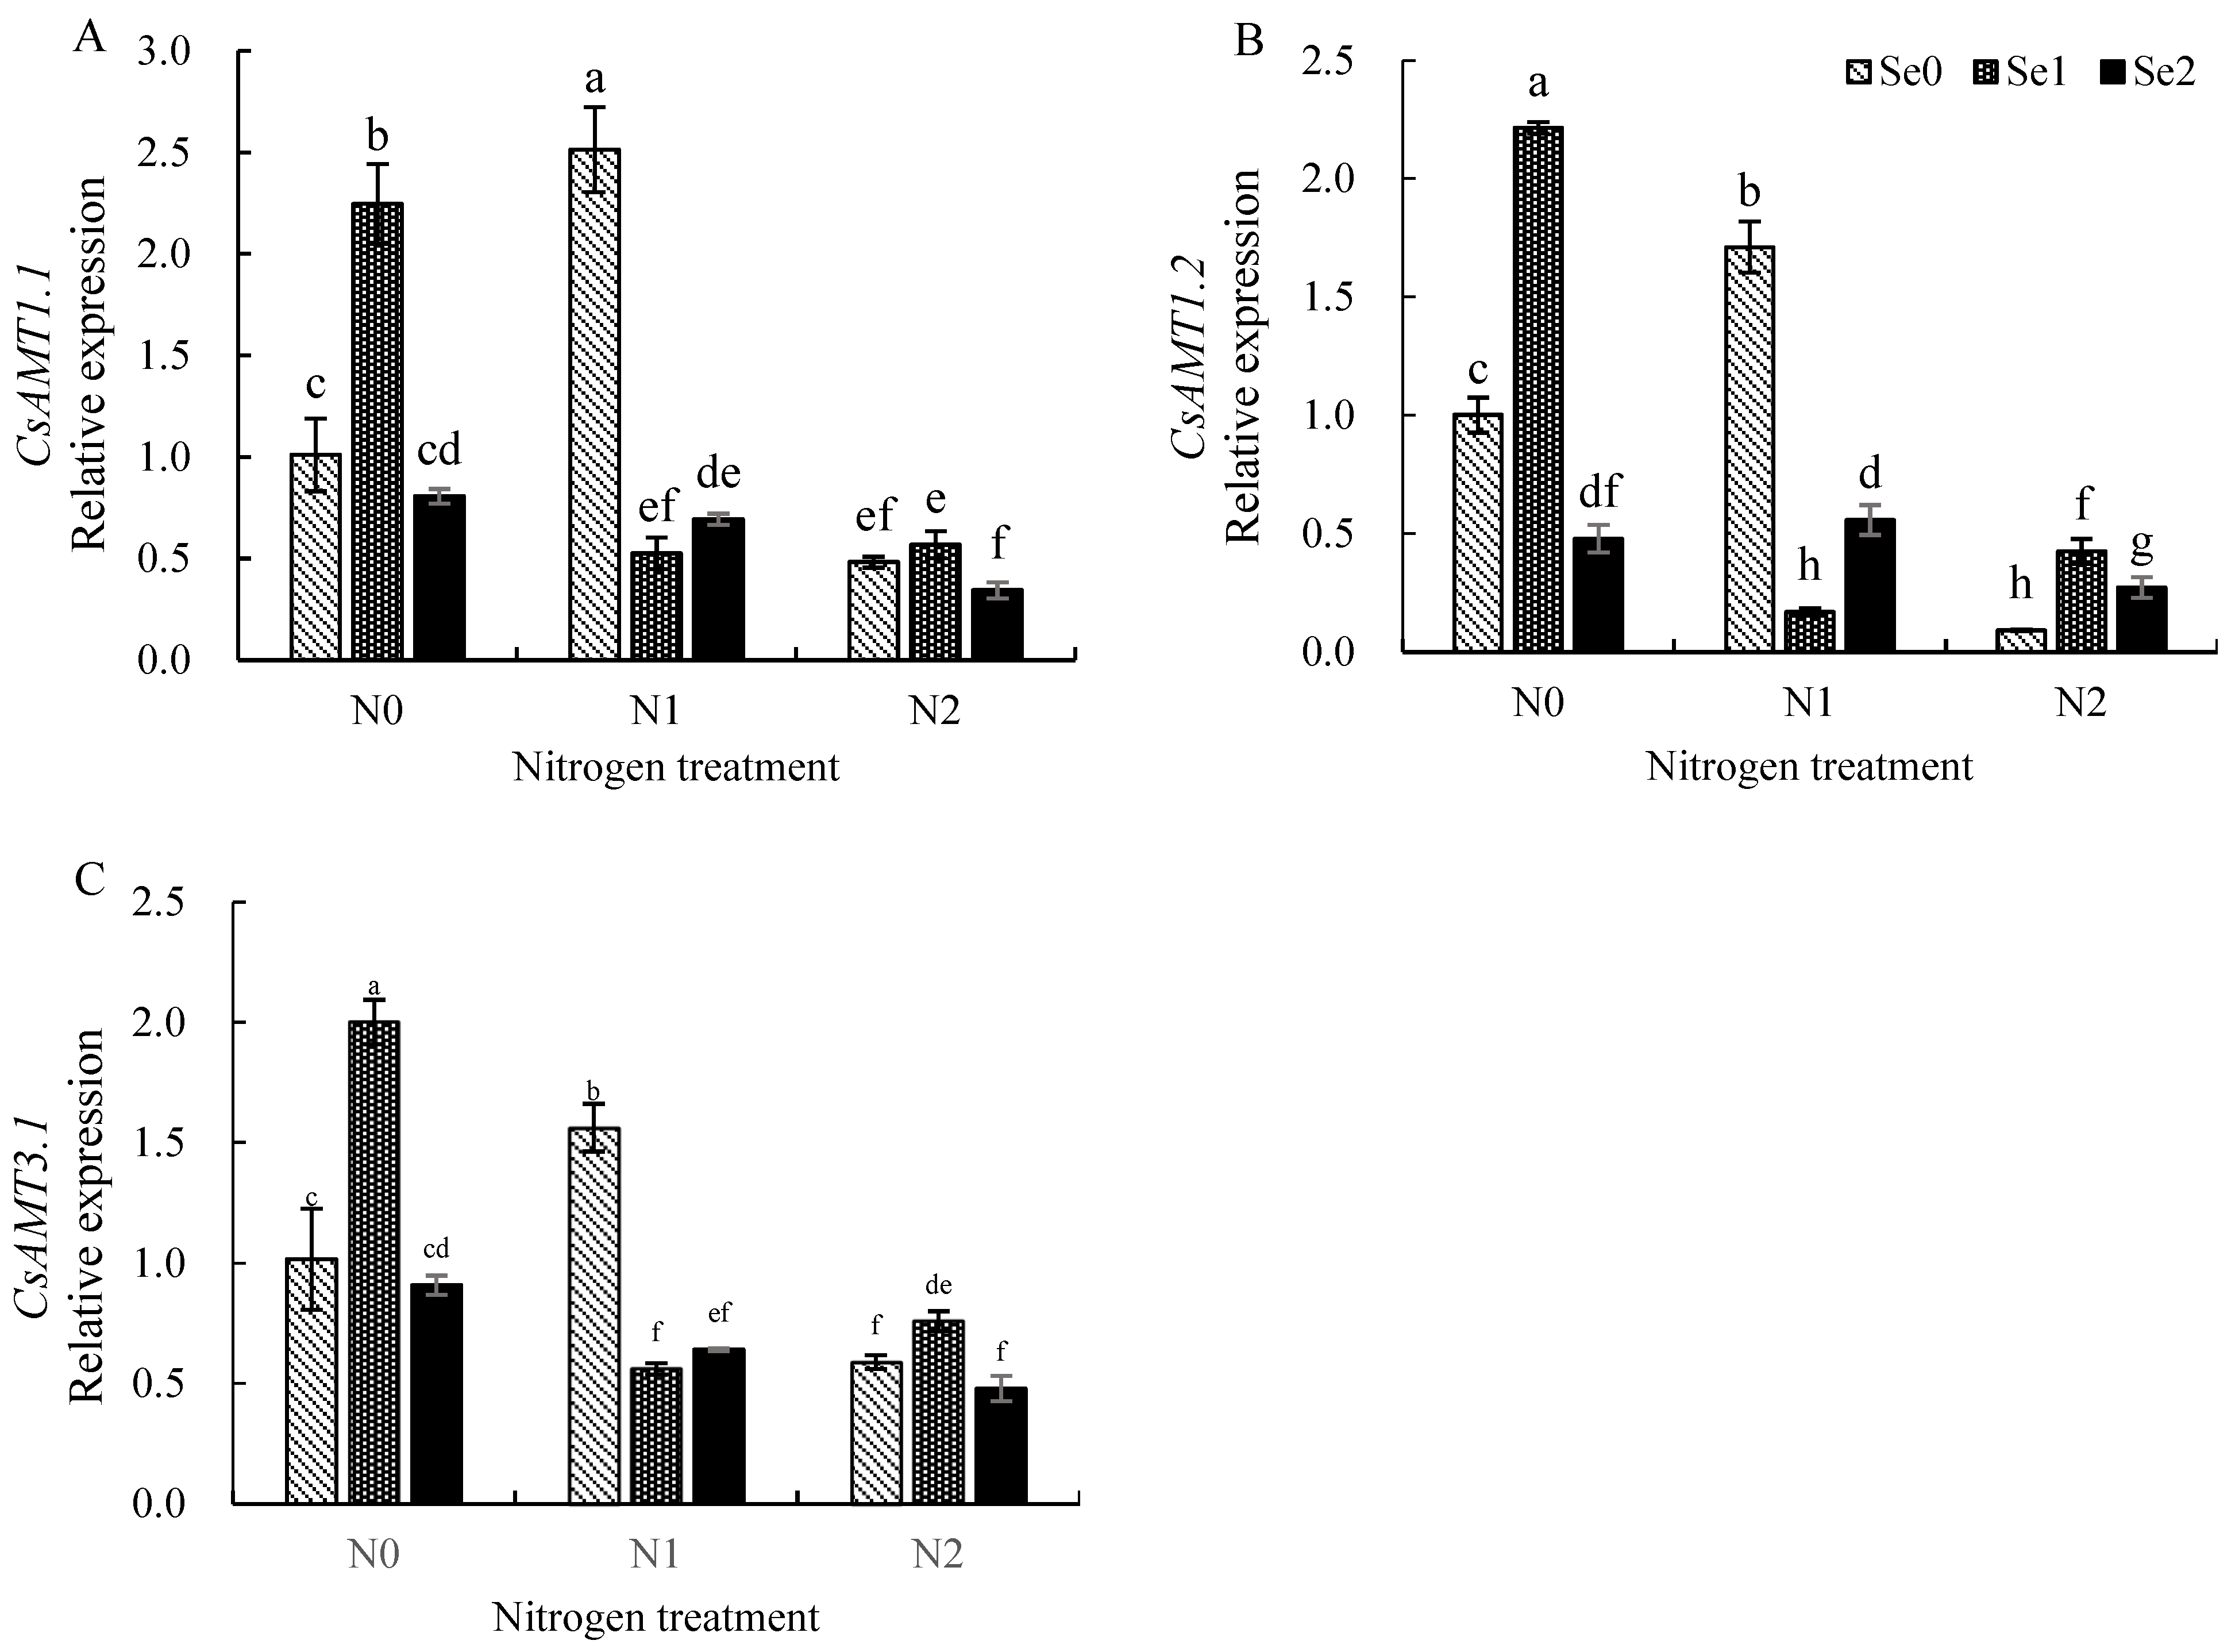
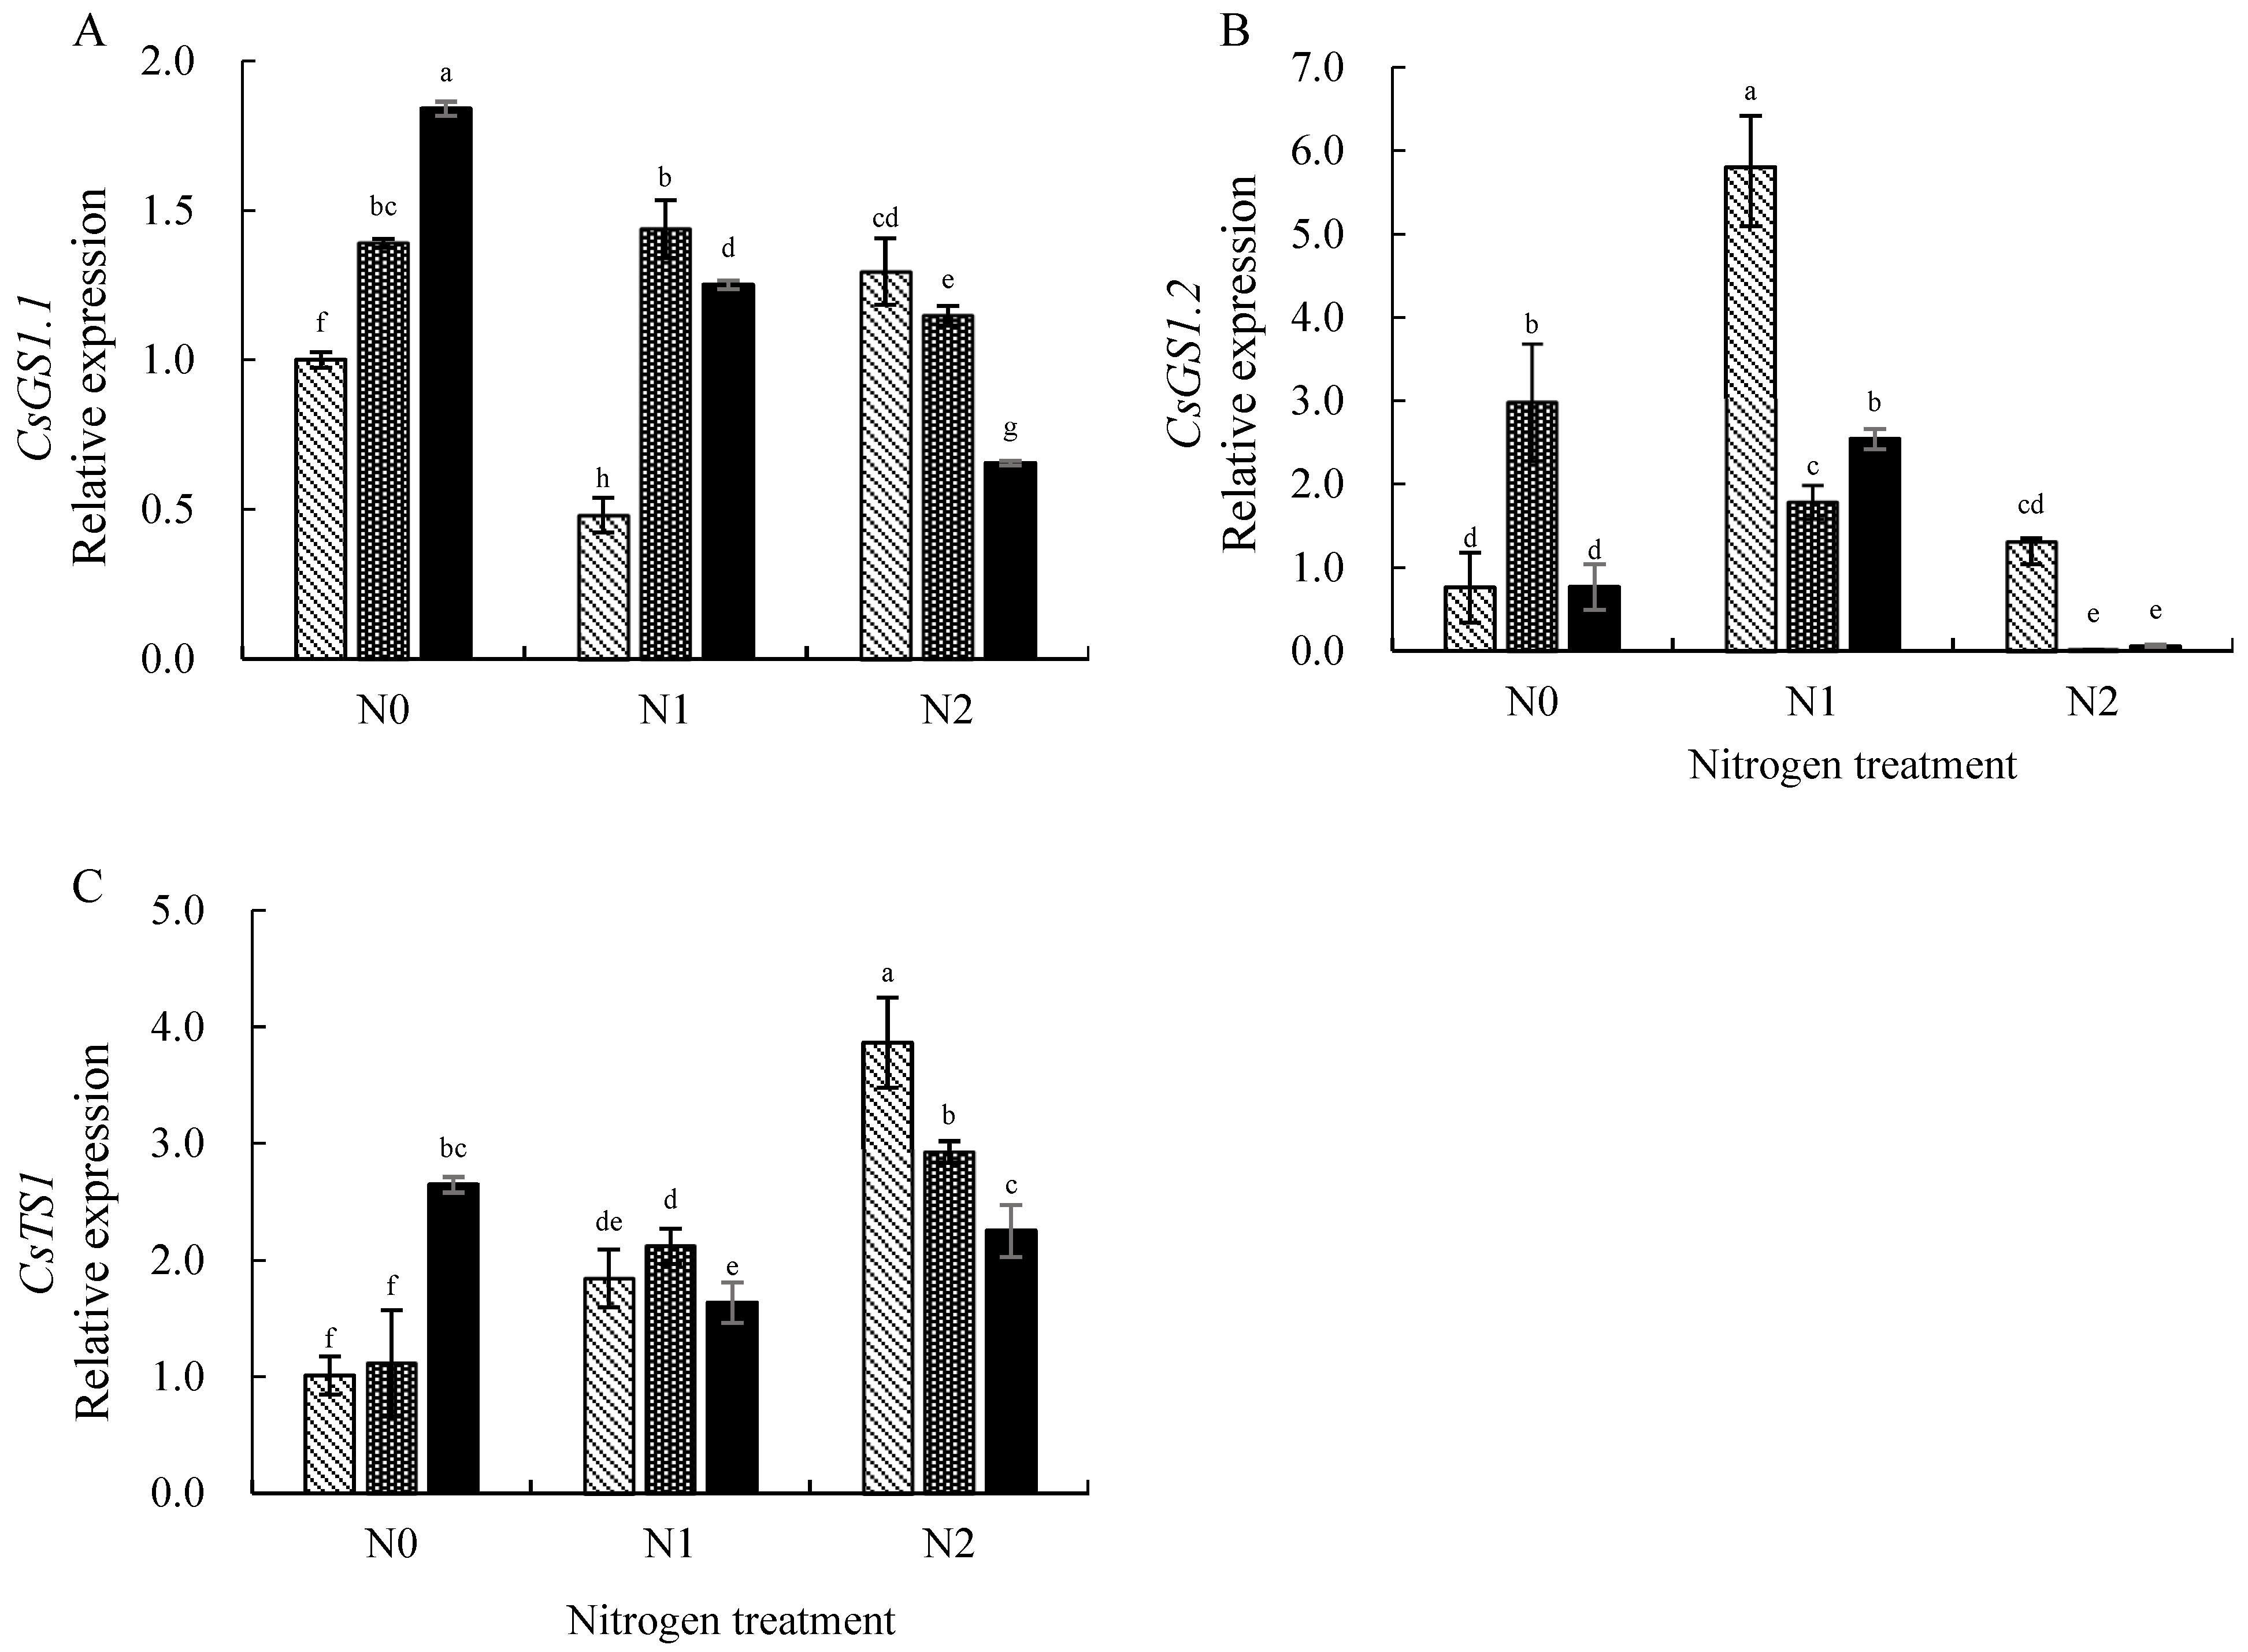
3.4. Expression Levels of Key Genes Involved in Nitrogen Uptake and Utilization in Tea Leaves

Six target genes (CsAMT1.1, CsAMT1.2, CsAMT3.1, CsGsS1.1, CsGS1.2 and CsTS1) were selected in this study. The CsGAPDH gene served as a reference. In this study, the relative expression in mature leaves without N and Se application was set to 1 to analyze the expression of genes in mature leaves.
ATMs have been characterized as responsible for N uptake in tea plants. In N- and Se-treated tea leaves, the expression patterns of CsAMT1.1, CsAMT1.2 and CsAMT3.1 were similar (Figure 3A–C). Regardless of all the N and Se concentrations and the pairing of the two treatments, the expression of CsAMT1.1, CsAMT1.2 and CsAMT3.1 in the leaves was inhibited, except for the application of Se1 (0.3 mg/L, N0Se1) and N1 (2 mmol/L, N1Se0) treatments alone (Figure 3A–C). In the N0 (0 mmol/L) treatment, the expression of CsAMT1.1, CsAMT1.2 and CsAMT3.1 were up-regulated under Se1 (0.3 mg/L) treatment, which saw 2.25-, 2.22-, and 2.00-fold increase compared with CK (N0Se0), respectively (Figure 3A–C). In the N1-treated tea leaves, the expression levels of CsAMT1.1, CsAMT1.2 and CsAMT3.1 increased in the Se0 (0.3 mg/L) treatment, which were 2.51-, 1.71- and 1.56-fold compared with CK, respectively, but their expression was suppressed with the addition of Se supply (Figure 3A–C).
In Figure 4A, under the N0 (0 mmol/L) treatment, the expression of CsGS1.1 increased with improving levels of Se application; however, in the Se2 (3 mg/L) treatment, the expression of CsGS1.1 was induced to 1.84-fold compared with CK. In the N1 (2 mmol/L) treatment, the expression of CsGS1.1 showed a trend of increasing and then decreasing with improving Se supply, and the expression of CsGS1.1 was induced to up-regulate under both the Se1 (0.3 mg/L) and Se2 (3 mg/L) treatments. Under the N2 (4.5 mmol/L) treatment, increasing Se application led to CsGS1.1 expression being down-regulated, but CsGS1.1 expression was significantly inhibited under Se2 treatment (3 mg/L). In the Se0 treatment, the expression of CsGS1.1 showed first increasing and then decreasing with the addition of N application; furthermore, the expression of CsGS1.1 was induced by both in Se1 (0.3 mg/L) treatment. Under the Se2 (3 mg/L) treatment, CsGS1.1 expression decreased with increasing levels of N application.
Obviously, the expression pattern of CsGS1.2 is different from CsGS1.1 (Figure 4B). In the N0 (0 mmol/L) treatment, the expression of CsGS1.2 showed first an increase and then a decrease with elevated Se supply, and the expression of CsGS1.2 was 2.98-fold increased compared with CK under the Se1 (0.3 mg/L) treatment. Under the N1 (2 mmol/L) treatment, the expression of CsGS1.2 was induced in all treatments, and especially under the Se0 treatment, the expression of CsGS1.2 was 5.80-fold compared with CK. Under the N2 (4.5 mmol/L) treatment, the expression of CsGS1.2 was significantly suppressed in the Se1 (0.3 mg/L) and Se2 (3 mg/L) treatments. Under the Se0 (0 mg/L) and Se2 (3 mg/L) treatments, the expression of CsGS1.2 showed a trend to increase and then decrease with the rising N application. Under the Se1 (0.3 mg/L) treatment, the expression of CsGS1.2 fell with increasing N application.
As shown in Figure 4C, the expression of CsTS1 was up-regulated and significantly higher than CK in each treatment except for the Se1 (0.3 mg/L, N0Se1) treatment. In the N0 treatment, the expression of CsTS1 significantly induced up-regulation under the Se2 (3 mg/L) treatment, with a 2.64-fold increase compared with CK. Under the N1 (2 mmol/L) treatment, the expression of CsTS1 under each Se treatment was non-significantly different from that under the Se0 (0 mg/L) treatment. Under the N2 (4.5 mmol/L) treatment, the expression of CsTS1 decreased with increasing Se application. The expression of CsTS1 elevated with addition N use under the Se0 (0 mg/L) and Se1 (0.3 mg/L) treatments. In the Se2 (3 mg/L) treatment, the expression of CsTS1 showed a trend of decreasing and increasing with improving N supply.

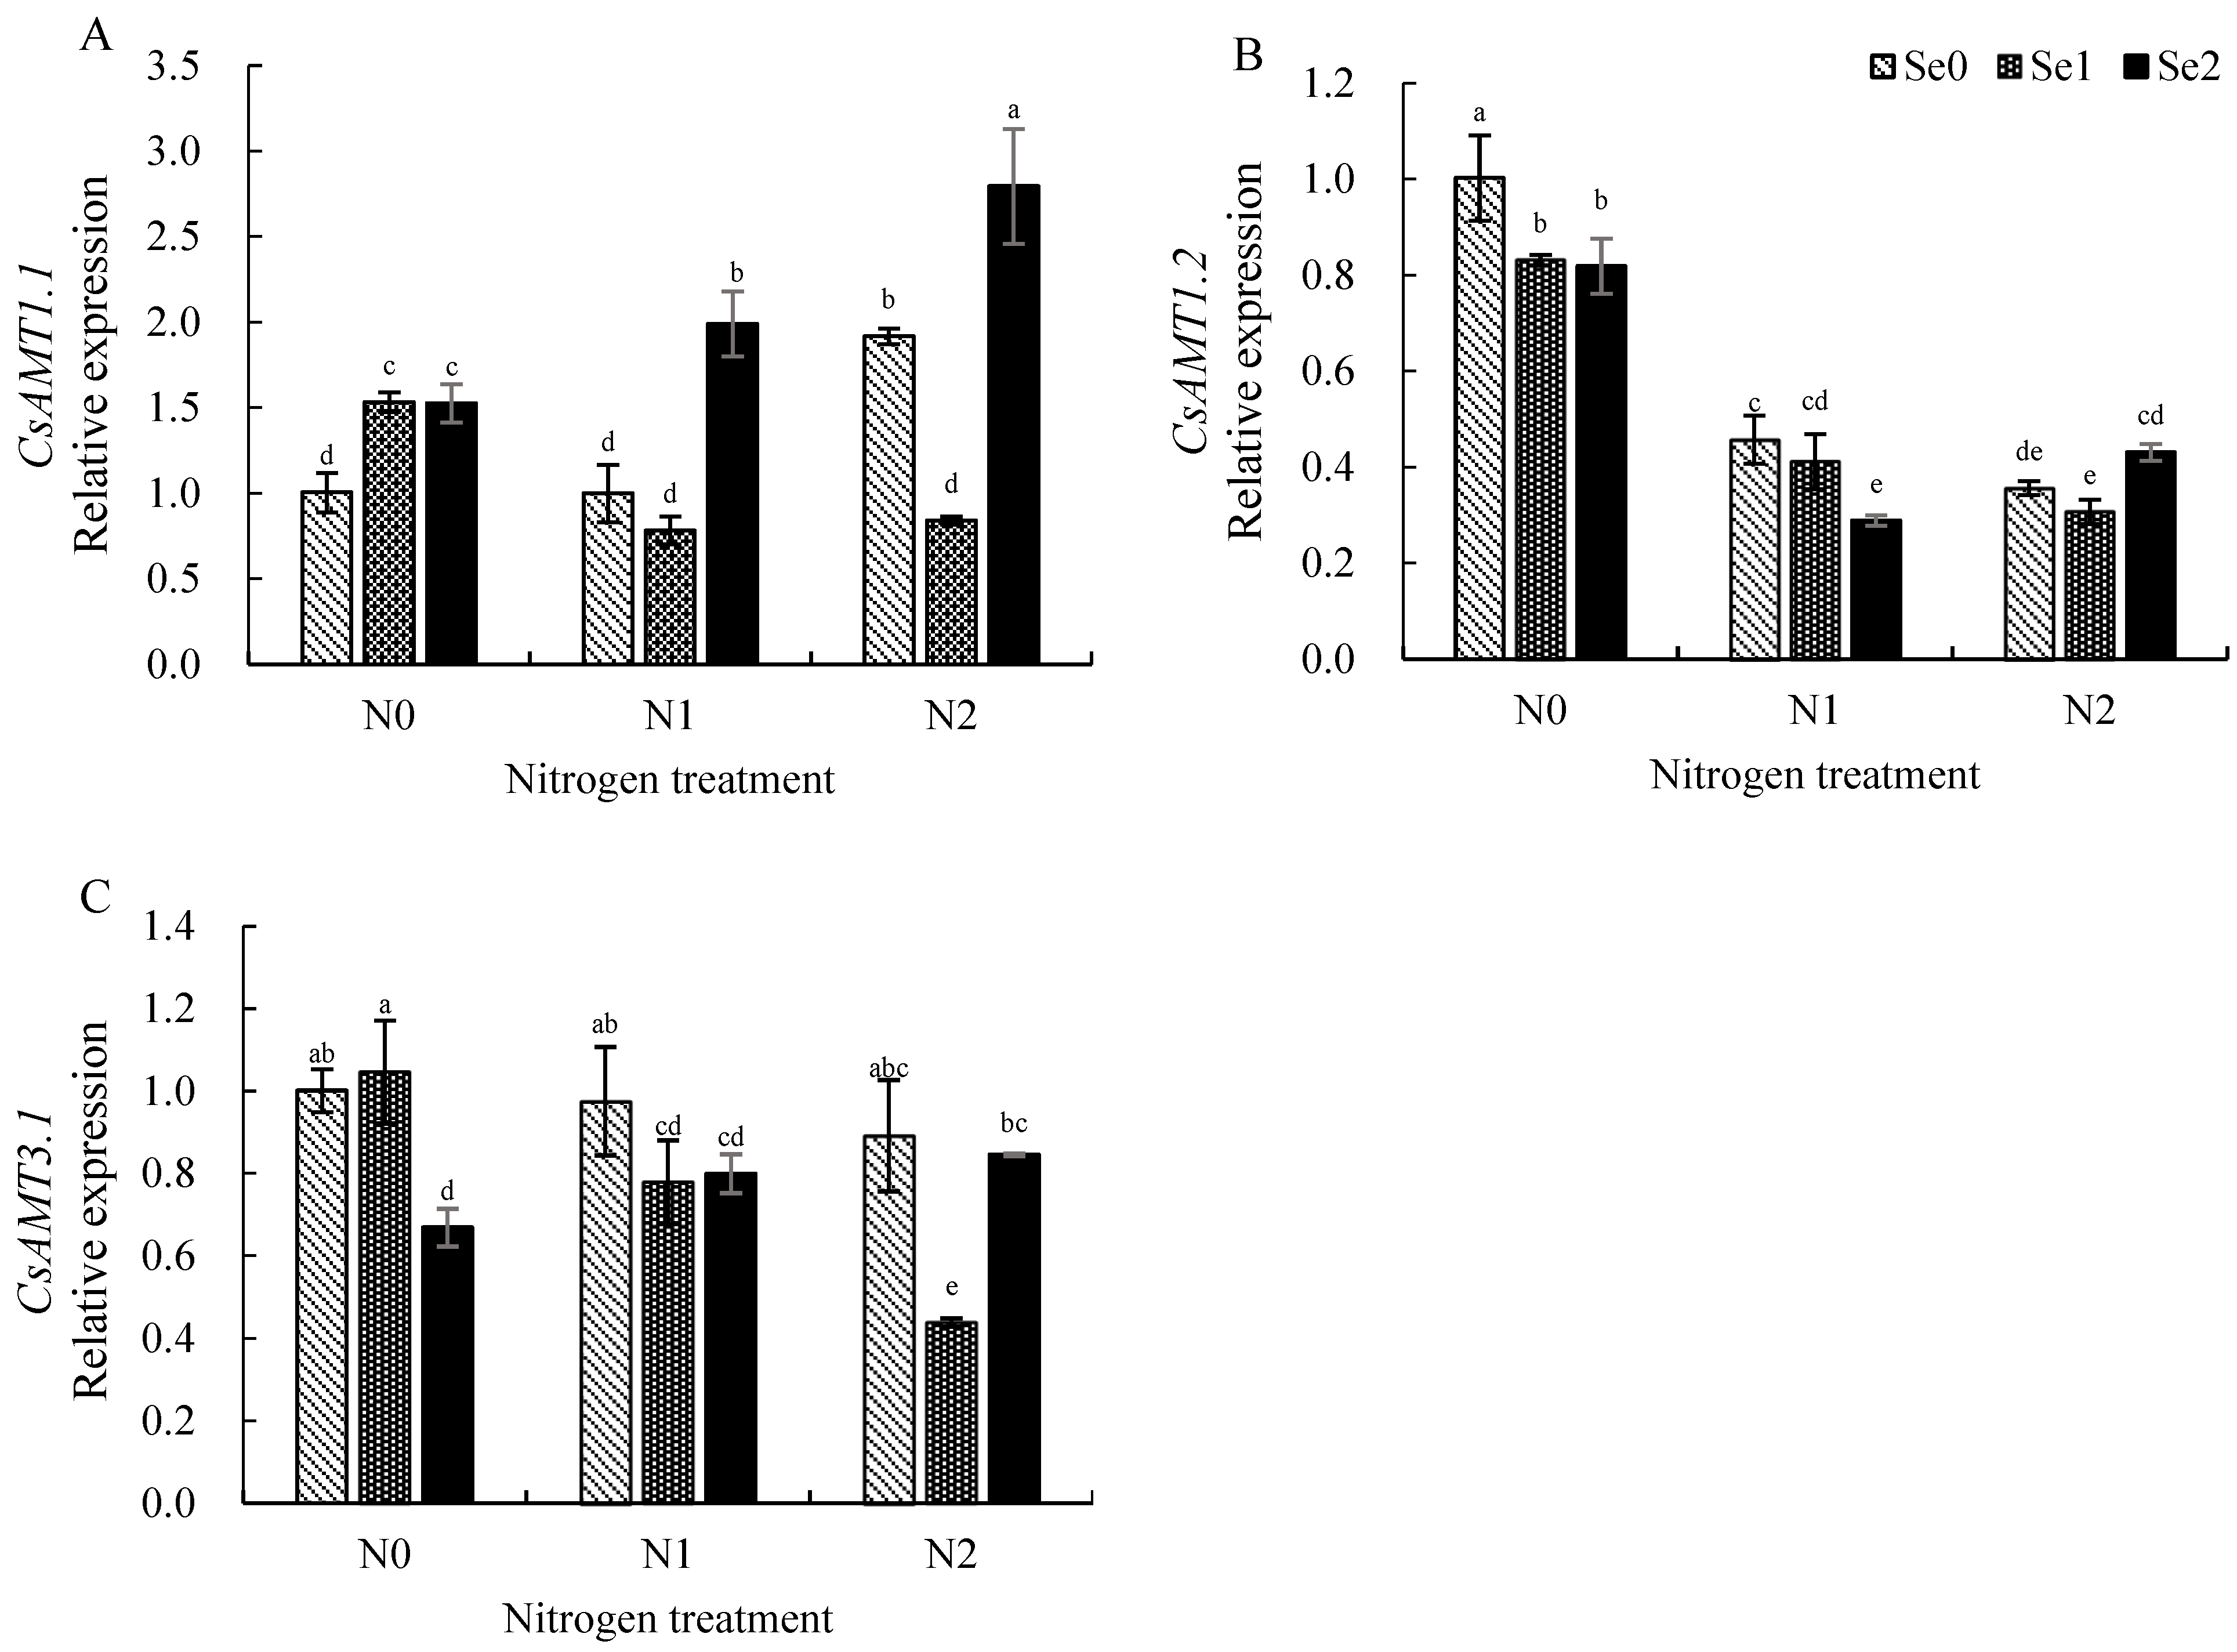
3.5. Expression Levels of Key Genes Involved in Nitrogen Uptake and Utilization in Tea Roots

The relative expression in roots under conditions without N and Se application (N0Se0) was set to 1 to analyze the expression of genes related to N metabolism in roots. As shown in Figure 5A, under the N0 (2 mmol/L) treatment, the expression of CsAMT1.1 is significantly up-regulated with increasing Se application. Under the N1 (2 mmol/L) and N2 (4.5 mmol/L) treatments, the expression of CsAMT1.1 showed a trend of increasing and then decreasing with the addition of Se application; however, in the Se2 (3 mg/L) treatment, the expression of CsAMT1.1 was significantly up-regulated. Under the Se0 treatment, the expression of CsAMT1.1 was markedly induced only under the N2 (4.5 mmol/L) treatment. In the Se1 (0.3 mg/L) treatment, the up-regulation of CsAMT1.1 was higher with the N0 treatment, whereas the expression of CsAMT1.1 did not differ with CK after additional N. Under the Se2 (3 mg/L) treatment, the expression of CsAMT1.1 was enhanced with increasing N application. Figure 5B shows that the expression of CsAMT1.2 was suppressed in all treatments compared with the CK, and the expression of CsAMT1.2 was down-regulated with the increase in Se application level under the N0 (0 mmol/L) and N1 (2 mmol/L) treatments, while the expression of CsAMT1.2 showed first a decrease and then an increase with Se application in the N2 (4.5 mmol/L) treatment. Under the Se0 (0 mg/L) and Se1 (0.3 mg/L) treatments, the expression of CsAMT1.2 fell with the addition of N supply. The expression of CsAMT1.2 showed a trend to decrease and then increase with improving N application under the Se2 (3 mg/L) treatment. As shown in Figure 6C, the expression of CsAMT3.1 was suppressed or did not show significant change in all treatments compared to the CK. Under the N0 (0 mmol/L) treatment, the expression of CsAMT3.1 was significantly inhibited in the Se2 (3 mg/L) treatment; however, increased Se application inhibited the expression of CsAMT3.1 under the N1 (2 mmol/L) and N2 (4.5 mmol/L) treatments. In the Se0 (0 mg/L) treatment, the expression of CsAMT3.1 was not affected by N concentration. The expression of CsAMT3.1 fell with increasing N application in the Se1 (0.3 mg/L) treatment. In the Se2 (3 mg/L) treatment, the expression of CsAMT3.1 increased with rising levels of N application.
Figure 6A shows that the expression of CsGS1.1 was suppressed in all treatments compared with CK. The expression of CsGS1.1 was suppressed by Se addition under the N0 (0 mmol/L) and N2 (4.5 mmol/L) treatments. Under the N1 (2 mmol/L) treatment, the expression of CsGS1.1 was inhibited by the Se0 (0 mg/L) and Se2 (3 mg/L) treatments. The expression of CsGS1.1 first dropped and then elevated with increasing N application under the Se0 (0 mg/L) treatment. In the Se1 (0.3 mg/L) treatment, the expression of CsGS1.1 showed a trend of increase and then decrease with the addition of N. Under the Se2 (3 mg/L) treatment, the expression of CsGS1.1 was not significantly different under differing N concentrations.
As shown in Figure 6B, under the N0 treatment, the expression of CsGS1.2 showed no significant difference between the Se treatments. The expression of CsGS1.2 was significantly induced to be up-regulated under the N1 (2 mmol/L) and N2 (4.5 mmol/L) treatments; furthermore, the expression of CsGS1.2 increased and then decreased with improved Se application. In the Se0 (0 mg/L) treatment, the expression of CsGS1.2 increased with additional levels of N application, and the expression of CsGS1.2 was 17.02-fold compared with CK under the N2 (4.5 mmol/L) treatment. Under the Se1 (0.3 mg/L) and Se2 (3 mg/L) treatments, the expression of CsGS1.2 was significantly up-regulated after increasing N.
Figure 6C shows that the expression of CsTS1 increased with addition levels of Se application under the N0 (0 mmol/L) treatment. In the N1 (2 mmol/L) treatment, the expression of CsTS1 showed a trend of rising and then decreasing with increasing Se application. Under the N2 (4.5 mmol/L) treatment, the expression of CsTS1 was significantly suppressed in the Se1 (0.3 mg/L) treatment. Under the Se0 (0 mg/L) treatment, the expression of CsTS1 was up-regulated in the N2 (4.5 mmol/L) treatment. The expression of CsTS1 first increased and then decreased with the level of N application under the Se1 (0.3 mg/L) treatment. Under the Se2 (3 mg/L) treatment, the expression of CsTS1 dropped with increasing N supply.

4. Discussion

4.1. Effect of Nitrogen and Selenium on Tea Quality Components

Polyphenols, amino acids and caffeine are associated with the quality of tea. N has a significant impact on improving the quality of tea, while Se can also influence the composition of key components in tea plants [16]. Se markedly enhanced levels of protein, soluble sugar, carotenoid, tea polyphenols and catechin [22]. In this study, under Se0 treatment, the caffeine and amino acid content of tea leaves under N2 (4.5 mmol/L) treatment was significantly lower than those of other treatments, while the contents of caffeine and tea polyphenols in the new shoots grew with increasing Se supply and were highest under the Se1 (0.3 mg/L) and N2 (4.5 mmol/L) treatments. Therefore, applying the appropriate amount of Se improves the decrease in tea polyphenol and caffeine content under high-N conditions. In the N0 (0 mmol/L) treatment, the amino acids content of new shoots increased with improved Se supply. Consequently, under N-deficient conditions, applying a certain concentration of Se can promote the N metabolism process of tea leaves and further increase the content of amino acids.
Wang et al. [28] found that appropriate concentrations of Se were beneficial to tea plant growth and tea quality, enhanced photosynthesis and root vigor, and increased tea polyphenol content in tea leaves, whereas excessive Se concentrations showed a stress response in tea seedlings and a decrease in tea polyphenols. Similar results were found by Li et al. [22]. In this study, under N2 (4.5 mmol/L) treatment, excessive concentrations of Se can reduce the content of tea polyphenols; however, the stress effect slows down with decreasing N concentration, which is probably due to the interaction effect of N and Se. Similarly, under N2 (4.5 mmol/L) treatment, the content of tea polyphenols is relatively low in mature leaves; however, Se1 (0.3 mg/L) treatments led to significantly higher tea polyphenol content. In the N1Se2 treatment, both tea polyphenols and amino acids in mature leaves were significantly higher than in other treatments.

4.2. Effect of Nitrogen and Selenium Rationing on the Total Nitrogen and Carbon Contents of Mature Leaves and Roots of Tea Plants

There are significant interactions between the elements N and Se. N is the most demanding mineral nutrient element in plant growth and development, participating in the formation of various plant contents [36]. The tea plant is a foliar cash crop and has a great demand for N. The present study shows that the effect of different Se concentrations on the total N content of mature leaves and roots has a similar pattern. Under the N0 (0 mmol/L) treatment, increasing Se had a negative effect on the accumulation of total N and total C in tea plants. Nevertheless, in the N0 (0 mmol/L) and N1 (2 mmol/L) treatments, increasing Se significantly elevated total N content in roots and mature leaves and showed positive effects. However, under the N2 (4.5 mmol/L) treatment, increasing Se significantly improved the total C content in mature leaves, while in roots it showed the opposite trend. The results prove that Se has opposite effects on C and N metabolism in the mature leaves and roots of tea plants at high N concentrations.

4.3. Effects of Nitrogen and Selenium on the Expression of Key Genes in Nitrogen Metabolism in Tea Plants

N use efficiency in plants is a complex process regulated by multiple genes, involving N uptake, assimilation transport and redistribution [37]. The absorption of ammonium N (NH4+-N) by the tea plant is favored, and the transportation of NH4+ into the tea plant’s cells is facilitated by ammonium transporter proteins (CsAMTs), which are then further divided into the glutamine-glutamate cycle (GS/GOGAT) to facilitate the metabolism of N-containing substances [38]. Hence, we selected the ammonium transporter protein genes CsAMT1.1, CsAMT1.2 and CsAMT3.1, the crucial enzyme genes involved in N assimilation CsGs1.1 and CsGs1.2, and the pivotal gene responsible for theanine metabolism CsTS1, further exploring differences in their expression patterns under N and Se dosing. In this study, N treatment interacted significantly with Se treatment in the expression of genes related to N metabolism. In the previous study, CsAMT3.1 was highly expressed in mature leaves, with the highest expression at a N of 2 mmol/L [39]. In the Se0 (0 mg/L) treatment, CsAMT3.1 was found to have a similar expression in mature leaves. In addition, under the Se0 (0 mg/L) treatment, except for CsGS1.1 and CsTS1, all other key genes for nitrogen transport and assimilation in mature leaves showed the highest expression levels under the N1 (2 mmol/L) treatment, and among them, the expression level of CsTS1 increased with the nitrogen application level. Interestingly, under conditions of no Se addition, the expression levels of CsGS1.1 and CsTS1 showed up-regulated expression under the N0 (0 mmol/L) treatment and showed down-regulated expression under the N2 (4.5 mmol/L) treatment. The results show that the expression levels varied among different tissues, indicating that these genes might have diverse functions in the growth and development of tea plants, and under N and Se dosing, these genes might have diverse functions.
Sun et al. [25] conducted a leaf surface application of Se to ‘Xinyang 10’ and found that exogenous Se resulted in significant induction of CsGS in tea leaves. We found that the induction effect of Se on CsGS by N and Se treatments is mainly manifested in the up-regulation of CsGS1.1 expression in mature leaves under N0 (0 mmol/L) and N1 (2 mmol/L) treatment. The expression patterns of CsAMT1.1, CsAMT1.2 and CsAMT3.1 in mature leaves changed similarly, and suitable Se treatment increased the expression level under no N application, which made it converge to or even exceed that under Se0N1 treatment. Thus, CsATMs and CsGS1.1 in mature leaves were significantly induced by Se; in the roots, N and Se dosing significantly induced the expression of CsAMT1.1 and CsGS1.2, especially under N2 (4.5 mmol/L) treatment.

5. Conclusions

In conclusion, the results indicate that tea polyphenols, amino acids and caffeine content can be significantly increased under N and Se dosing conditions, but the expression of key genes for N metabolism in leaves and roots can be significantly induced. Under no-N conditions, the amino acid and tea polyphenol content of the new shoots increased significantly with the addition of certain concentrations of Se. By decreasing the amount of N fertilizer and increasing the amount of Se fertilizer, the physicochemical properties of the soil will be improved, N accumulation will be increased, tea leaf quality will be maximized and N fertilizer utilization will be improved. In addition, the inhibitory effects of N on tea polyphenols and caffeine can be alleviated by a suitable Se supply under high-N conditions. Consequently, in the cultivation of tea plantations, when too much soil N fertilizer causes a decline in the essential elements of tea, such as polyphenols and caffeine, a suitable quantity of Se fertilizer can be added to enhance the tea’s quality. In leaves, CsAMT1.1, CsAMT1.2 and CsAMT3.1 may participate in N transport under suitable Se application conditions during N deficiency, and CsGS1.1 and CsTS1 play important roles in N assimilation in mature leaves under N and Se dosing conditions. In roots, under N and Se dosing conditions, CsAMT1.1 and CsGS1.2 may be responsible for N uptake and assimilation.

Supplementary Materials

The following supporting information can be downloaded at: https://www.mdpi.com/article/10.3390/agronomy13122997/s1, Table S1: The treatment of combine application of N and Se; Table S2: The specific primers of relevant genes designed for qRT-PCR; Table S3: Variance analysis of the effects of combined application of N and Se on carbon and N content in different parts of tea plant.

Author Contributions

Conceptualization, Y.B. and D.T.; investigation, Y.B., W.D., Z.J. and D.T.; data curation, Y.B. and S.Z.; validation, S.Z., Z.J. and L.L.; formal analysis, Y.B., Z.J. and L.L.; resources, D.T. and Q.T.; visualization, Y.B. and S.Z.; writing—original draft preparation, S.Z. and Y.B.; writing—review and editing, D.T., L.T., W.C. and Q.T.; supervision, Q.T., L.T. and W.C.; project administration, D.T.; funding acquisition, D.T. All authors have read and agreed to the published version of the manuscript.

Funding

This research was funded by the National Natural Science Foundation of China (32202538) and Sichuan Science and Technology Department (2022NSFSC0180).

Data Availability Statement

The data are not publicly available due to confidentiality agreements.

Conflicts of Interest

The authors declare no conflict of interest.

References

  1. Zhang, L.; Cao, Q.-Q.; Granato, D.; Xu, Y.-Q.; Ho, C.-T. Association between Chemistry and Taste of Tea: A Review. Trends Food Sci. Technol. 2020, 101, 139–149. [Google Scholar] [CrossRef]
  2. Zhang, W.; Ni, K.; Long, L.; Ruan, J. Nitrogen Transport and Assimilation in Tea Plant (Camellia Sinensis): A Review. Front. Plant Sci. 2023, 14, 1249202. [Google Scholar] [CrossRef]
  3. Tang, D.; Liu, M.-Y.; Zhang, Q.; Ma, L.; Shi, Y.; Ruan, J. Preferential Assimilation of NH4+ over NO3− in Tea Plant Associated with Genes Involved in Nitrogen Transportation, Utilization and Catechins Biosynthesis. Plant Sci. 2020, 291, 110369. [Google Scholar] [CrossRef]
  4. Ruan, J.; Ma, L.; Yi, X.; Shi, Y.; Ni, K.; Liu, M.; Zhang, F. Integrated Nutrient Management in Tea Plantation to Reduce Chemical Fertilizer and Increase Nutrient Use Efficiency. J. Tea Sci. 2020, 40, 85–95. [Google Scholar] [CrossRef]
  5. Ruan, J.; Ma, L.; Shi, Y.; Zhang, F. Effects of Litter Incorporation and Nitrogen Fertilization on the Contents of Extractable Aluminium in the Rhizosphere Soil of Tea Plant (Camallia Sinensis (L.) O. Kuntze). Plant Soil 2004, 263, 283–296. [Google Scholar] [CrossRef]
  6. Yan, P.; Wu, L.; Wang, D.; Fu, J.; Shen, C.; Li, X.; Zhang, L.; Zhang, L.; Fan, L.; Wenyan, H. Soil Acidification in Chinese Tea Plantations. Sci. Total Environ. 2020, 715, 136963. [Google Scholar] [CrossRef]
  7. Su, Y.; Wang, Y.; Zhang, Y.; Luo, Y.; Liao, W. Soil Acidification Control and Improvement Technology for Tea Plantations. China Tea 2018, 40, 9–11+15. [Google Scholar]
  8. Ma, L.; Yang, X.; Shi, Y.; Yi, X.; Ji, L.; Cheng, Y.; Ni, K.; Ruan, J. Response of Tea Yield, Quality and Soil Bacterial Characteristics to Long-Term Nitrogen Fertilization in an Eleven-Year Field Experiment. Appl. Soil Ecol. 2021, 166, 103976. [Google Scholar] [CrossRef]
  9. Chen, Y.; Wang, F.; Wu, Z.; Jiang, F.; Yu, W.; Yang, J.; Chen, J.; Jian, G.; You, Z.; Zeng, L. Effects of Long-Term Nitrogen Fertilization on the Formation of Metabolites Related to Tea Quality in Subtropical China. Metabolites 2021, 11, 146. [Google Scholar] [CrossRef]
  10. Liu, C.; Ren, D.; Liu, H.; Zhang, Y.; Wang, L.; Li, Z.; Zhang, M. Optimizing Nitrogen Management Diminished Reactive Nitrogen Loss and Acquired Optimal Net Ecosystem Economic Benefit in a Wheat-Maize Rotation System. J. Clean. Prod. 2022, 331, 129964. [Google Scholar] [CrossRef]
  11. Ye, R.; Huang, J.; Wang, Z.; Chen, Y.; Dong, Y. Trace Element Selenium Effectively Alleviates Intestinal Diseases. Int. J. Mol. Sci. 2021, 22, 11708. [Google Scholar] [CrossRef]
  12. Feng, R.; Wang, L.; Yang, J.; Zhao, P.; Zhu, Y.; Li, Y.; Yu, Y.; Liu, H.; Rensing, C.; Wu, Z.; et al. Underlying Mechanisms Responsible for Restriction of Uptake and Translocation of Heavy Metals (Metalloids) by Selenium via Root Application in Plants. J. Hazard. Mater. 2021, 402, 123570. [Google Scholar] [CrossRef]
  13. Teixeira, L.S.; Pimenta, T.M.; Brito, F.A.L.; Malheiros, R.S.P.; Arruda, R.S.; Araújo, W.L.; Ribeiro, D.M. Selenium Uptake and Grain Nutritional Quality Are Affected by Nitrogen Fertilization in Rice (Oryza Sativa L.). Plant Cell Rep. 2021, 40, 871–880. [Google Scholar] [CrossRef]
  14. Pilon-Smits, E.A.H. On the Ecology of Selenium Accumulation in Plants. Plants 2019, 8, 197. [Google Scholar] [CrossRef]
  15. Ren, H.; Li, X.; Guo, L.; Wang, L.; Hao, X.; Zeng, J. Integrative Transcriptome and Proteome Analysis Reveals the Absorption and Metabolism of Selenium in Tea Plants [Camellia Sinensis (L.) O. Kuntze]. Front. Plant Sci. 2022, 13, 848349. [Google Scholar] [CrossRef]
  16. Xiang, J.; Rao, S.; Chen, Q.; Zhang, W.; Cheng, S.; Cong, X.; Zhang, Y.; Yang, X.; Xu, F. Research Progress on the Effects of Selenium on the Growth and Quality of Tea Plants. Plants 2022, 11, 2491. [Google Scholar] [CrossRef]
  17. Ho, C.-H.; Lin, S.-H.; Hu, H.-C.; Tsay, Y.-F. CHL1 Functions as a Nitrate Sensor in Plants. Cell 2009, 138, 1184–1194. [Google Scholar] [CrossRef]
  18. Lei, Z.; Li, Q.; Tang, Y.; Zhang, H.; Han, C.; Wang, X.; Zhao, X.; Shi, G. Selenium Enhanced Nitrogen Accumulation in Legumes in Soil with Rhizobia Bacteria. J. Clean. Prod. 2022, 380, 134960. [Google Scholar] [CrossRef]
  19. Zhan, T.; Hu, C.; Kong, Q.; Shi, G.; Tang, Y.; Zhou, Y.; Guo, Z.; Zhai, H.; Xiao, X.; Zhao, X. Chitin Combined with Selenium Reduced Nitrogen Loss in Soil and Improved Nitrogen Uptake Efficiency in Guanxi Pomelo Orchard. Sci. Total Environ. 2021, 799, 149414. [Google Scholar] [CrossRef]
  20. Li, S.; Chen, H.; Jiang, S.; Hu, F.; Xing, D.; Du, B. Selenium and Nitrogen Fertilizer Management Improves Potato Root Function, Photosynthesis, Yield and Selenium Enrichment. Sustainability 2023, 15, 6060. [Google Scholar] [CrossRef]
  21. Liu, Q.; Lin, Y.; Hu, X.; Wu, A.; Ye, X.; Chen, F. Influences of N and phosphorus fertilizers on the absorption and accumulation of zinc, selenium, and other trace elements in tea plants. Acta Ecol. Sin. 2021, 41, 637–644. [Google Scholar]
  22. Li, D.; Zhou, C.; Zou, N.; Wu, Y.; Zhang, J.; An, Q.; Li, J.-Q.; Pan, C. Nanoselenium Foliar Application Enhances Biosynthesis of Tea Leaves in Metabolic Cycles and Associated Responsive Pathways. Environ. Pollut. 2021, 273, 116503. [Google Scholar] [CrossRef]
  23. Pérez-Millán, R.; Alfosea-Simón, M.; Simón-Grao, S.; Cámara-Zapata, J.M.; Zavala-González, E.A.; Aranda-Martinez, A.; Shahid, M.A.; García-Sánchez, F. Effects of Se Application on Polyamines and Carbon–Nitrogen Metabolism of Pepper Plants Suffering from Cd Toxicity. Agronomy 2021, 11, 2535. [Google Scholar] [CrossRef]
  24. Rios, J.J.; Blasco, B.; Rosales, M.A.; Sanchez-Rodriguez, E.; Leyva, R.; Cervilla, L.M.; Romero, L.; Ruiz, J.M. Response of Nitrogen Metabolism in Lettuce Plants Subjected to Different Doses and Forms of Selenium: Response of Nitrogen Metabolism to Selenium in Lettuce. J. Sci. Food Agric. 2010, 90, 1914–1919. [Google Scholar] [CrossRef]
  25. Sun, M.; Wang, J.; Liu, W.; Yin, P.; Guo, G.; Tong, C.; Chang, Y. Effect and Mechanism of Exogenous Selenium on Selenium Content and Quality of Fresh Tea Leaves. Not. Bot. Horti Agrobot. 2022, 50, 12814. [Google Scholar] [CrossRef]
  26. Ruan, J.; Gerendás, J.; Härdter, R.; Sattelmacher, B. Effect of Nitrogen Form and Root-Zone pH on Growth and Nitrogen Uptake of Tea (Camellia Sinensis) Plants. Ann. Bot. 2007, 99, 301–310. [Google Scholar] [CrossRef]
  27. Ruan, J.; Gerendás, J.; Härdter, R.; Sattelmacher, B. Effect of Root Zone pH and Form and Concentration of Nitrogen on Accumulation of Quality-related Components in Green Tea. J. Sci. Food Agric. 2007, 87, 1505–1516. [Google Scholar] [CrossRef]
  28. Wang, D.; Huang, Y.; Zhou, Z.; Li, T.; Wu, F.; Yao, Q. Effects of selenate at different concentrations on growth and physiological indexes of tea tree. Guihaia 2021, 41, 183–194. [Google Scholar]
  29. GB/T 8313-2018[S]; Determination of Total Polyphenols and Catechins Content in Tea. State Administration for Market Regulation: Beijing, China, 2018.
  30. GB/T 8314-2013[S]; Tea-Determination of Free Amino Acids Conten. General Administration of Quality Supervision, Inspection and Quarantine of the People’s Republic of China: Beijing, China, 2013.
  31. GB/T 8312-2013[S]; Tea-Determination of Caffeine Content. General Administration of Quality Supervision, Inspection and Quarantine of the People’s Republic of China: Beijing, China, 2013.
  32. Zhang, F.; Liu, Y.; Wang, L.; Bai, P.; Ruan, L.; Zhang, C.; Wei, K.; Cheng, H. Molecular Cloning and Expression Analysis of Ammonium Transporters in Tea Plants (Camellia Sinensis (L.) O. Kuntze) under Different Nitrogen Treatments. Gene 2018, 658, 136–145. [Google Scholar] [CrossRef]
  33. Tang, D.; Liu, M.; Zhang, Q.; Fan, K.; Shi, Y.; Ma, L.; Yi, X.; Ni, K.; Ruan, J. Isolation and expression profiles of cytosolic glutamine synthetase genes CsGS1s in tea plant (Camellia sinensis). Plant Physiol. J. 2018, 54, 71–80. [Google Scholar] [CrossRef]
  34. Wei, C.; Yang, H.; Wang, S.; Zhao, J.; Liu, C.; Gao, L.; Xia, E.; Lu, Y.; Tai, Y.; She, G.; et al. Draft Genome Sequence of Camellia Sinensis Var. Sinensis Provides Insights into the Evolution of the Tea Genome and Tea Quality. Proc. Natl. Acad. Sci. USA 2018, 115, E4151–E4158. [Google Scholar] [CrossRef]
  35. Livak, K.J.; Schmittgen, T.D. Analysis of Relative Gene Expression Data Using Real-Time Quantitative PCR and the 2−ΔΔCT Method. Methods 2001, 25, 402–408. [Google Scholar] [CrossRef]
  36. Chandran, A.K.N.; Priatama, R.A.; Kumar, V.; Xuan, Y.; Je, B.I.; Kim, C.M.; Jung, K.-H.; Han, C. Genome-Wide Transcriptome Analysis of Expression in Rice Seedling Roots in Response to Supplemental Nitrogen. J. Plant Physiol. 2016, 200, 62–75. [Google Scholar] [CrossRef]
  37. Kant, S.; Bi, Y.-M.; Rothstein, S.J. Understanding Plant Response to Nitrogen Limitation for the Improvement of Crop Nitrogen Use Efficiency. J. Exp. Bot. 2011, 62, 1499–1509. [Google Scholar] [CrossRef]
  38. Li, W.; Xiang, F.; Zhong, M.; Zhou, L.; Liu, H.; Li, S.; Wang, X. Transcriptome and Metabolite Analysis Identifies Nitrogen Utilization Genes in Tea Plant (Camellia Sinensis). Sci. Rep. 2017, 7, 1693. [Google Scholar] [CrossRef]
  39. Wang, Y.; Xuan, Y.; Wang, S.; Fan, D.; Wang, X.; Zheng, X. Genome-wide Identification, Characterization, and Expression Analysis of the Ammonium Transporter Gene Family in Tea Plants (Camellia Sinensis L.). Physiol. Plant. 2022, 174, e13646. [Google Scholar] [CrossRef]
Figure 1. Effects of N and Se on the contents of tea polyphenols, amino acids and caffeine. They should be listed as: (A) tea polyphenols content; (B) amino acids content; (C) caffeine content. Different letters indicate treatments that are significantly different at p < 0.05.
Agronomy 13 02997 g001
Figure 2. Effects of the combined application of N and Se on the contents of total N and total C in mature leaves and roots. (A) The N content of mature leaves; (B) the C content of mature leaves; (C) the N content of roots; (D) the C content of roots. Different letters indicate treatments that are significantly different at p < 0.05.
Agronomy 13 02997 g002
Figure 3. Effects of combined application of N and Se on the expression of CsATMs for N metabolism in mature leaves. (A) The relative expression of CsAMT1.1; (B) the relative expression of CsAMT1.2; (C) the relative expression of CsAMT3.1. Different letters indicate treatments that are significantly different at p < 0.05.
Agronomy 13 02997 g003
Figure 4. Effects of combined application of N and Se on the expression of CsGSs and CsTS1 for N metabolism in mature leaves. (A) The relative expression of CsGS1.1; (B) the relative expression of CsGS1.2; (C) the relative expression of CsTS1. Different letters indicate treatments that are significantly different at p < 0.05.
Agronomy 13 02997 g004
Figure 5. Effects of combined application of N and Se on the expression of CsATMs for N metabolism in roots. (A) The relative expression of CsAMT1.1; (B) the relative expression of CsAMT1.2; (C) the relative expression of CsAMT3.1. Different letters indicate treatments that are significantly different at p < 0.05.
Agronomy 13 02997 g005
Figure 6. Effects of combined application of N and Se on the expression of CsGSs and CsTS1 for N metabolism in roots.(A) The relative expression of CsGS1.1; (B) the relative expression of CsGS1.2; (C) the relative expression of CsTS1. Different letters indicate treatments that are significantly different at p < 0.05.
Agronomy 13 02997 g006
Table 1. Effects of combined application of N and Se on the contents of tea polyphenols and amino acids in mature leaves.
TreatmentTea Polyphenols Content (%)Amino Acid Content (%)
N0Se015.06 ± 0.053 b2.21 ± 0.028 bc
N0Se113.92 ± 0.070 e2.06 ± 0.029 e
N0Se214.50 ± 0.026 d2.20 ± 0.008 c
N1Se014.79 ± 0.070 c2.06 ± 0.023 e
N1Se112.98 ± 0.026 f2.05 ± 0.034 e
N1Se216.49 ± 0.388 a2.94 ± 0.004 a
N2Se012.55 ± 0.046 g2.13 ± 0.067 d
N2Se113.86 ± 0.070 e2.25 ± 0.017 b
N2Se212.36 ± 0.050 h2.08 ± 0.023 e
ANOVA (F-value)
N6918.26 **175.31 **
Se1340.83 **349.36 **
N × Se4130.62 **444.21 **
Notes: Tea polyphenols and amino acid content data in the table are mean ± standard deviation (n = 3). Different letters indicate treatments that are significantly different at p < 0.05. Significance level: ** p < 0.01.
Disclaimer/Publisher’s Note: The statements, opinions and data contained in all publications are solely those of the individual author(s) and contributor(s) and not of MDPI and/or the editor(s). MDPI and/or the editor(s) disclaim responsibility for any injury to people or property resulting from any ideas, methods, instructions or products referred to in the content.

