Article

Optimal Time for Haymaking and Potential Production of Grass Hay on Soybean Overseeding in Brazilian Savanna

by
Patrick Bezerra Fernandes
1,*,
Tiago do Prado Paim
1,
Luizmar Peixoto dos Santos
1,
Brunna Rafaela Souza
2,
Vanessa Nunes Leal
1,
Lucas Ferreira Gonçalves
1,
Flávio Lopes Claudio
2,
Darliane de Castro Santos
1,
Katia Cylene Guimarães
1 and
Estenio Moreira Alves
2
1
Instituto Federal de Educação, Ciência e Tecnologia Goiano Campus Rio Verde, Rodovia Sul Goiana, Km 01, Zona Rural, Rio Verde 75901-970, GO, Brazil
2
Instituto Federal de Educação, Ciência e Tecnologia Goiano Campus Iporá, Avenida Oeste, n.350, Parque União, Iporá 76200-000, GO, Brazil
*
Author to whom correspondence should be addressed.
Agronomy 2023, 13(12), 3046; https://doi.org/10.3390/agronomy13123046
Submission received: 20 November 2023 / Revised: 8 December 2023 / Accepted: 9 December 2023 / Published: 13 December 2023
(This article belongs to the Section Innovative Cropping Systems)

Abstract

:
The objective of this research was to determine the potential for hay production of Quenia guinea grass (Megathyrsus maximus cv. BRS Quenia), Congo grass (Urochloa ruziziensis), and Xaraes palisade grass (Urochloa brizantha cv. Xaraes) following soybean cultivation (Glycine max) in the Brazilian Cerrado. The experimental field was divided into 12 plots, with 4 replicates of each grass species. Chemical composition, forage mass (FM), and the potential for milk and carcass production were determined for the three grasses. Principal component analysis showed that the total digestible nutrients (TDN) had the most significant influence on milk and carcass potential. Quenia guinea grass reached maximum forage accumulation at 134 days after soybean harvest, representing 4191.51 kg ha−1 of FM. Congo grass and Xaraes palisade grass produced 4033.51 kg ha−1 and 4437.22 kg ha−1, respectively, in cuts made at 154 and 138 days. Quenia guinea grass had 20.71% soluble protein in its composition when harvested at 115 days. Regarding milk production potential, Congo grass, on the other hand, showed a linear reduction in milk production as the number of days after soybean harvest increased. As for carcass production potential, Congo grass demonstrated the highest carcass production potential (110.65 kg Mg−1 FM) at 107 cutting days. Xaraes palisade grass had the highest FM production, while Quenia guinea grass stood out in soluble protein. Conversely, Congo grass showed greater potential for hay production when overseeding in soybeans, as it excelled in carcass production potential. Therefore, for this grass, the ideal point for haymaking should occur within up to 107 days after sowing.

1. Introduction

The search for more efficient and sustainable production systems has led to the adoption of integrated production systems that aim to combine various agricultural and livestock activities within the same physical and chronological space, with the goal of sustainably optimizing land use and its abiotic resources. In such production systems, improvements in soil chemical composition and weed control are observed [1,2]. Forages play a crucial role in sustainable soil management by serving as agents that protect the soil from natural elements during the off-season [3].
Furthermore, forages produced in integrated systems can be conserved as hay, especially because climate conditions (dry period) favor hay production. Forage resources that are not directly grazed have significant potential for this purpose, especially for forages produced by direct seeding at the end of the productive cycle of oilseeds and cereals, such as soybean (Glycine max), maize (Zea mays), and sorghum (Sorghum bicolor). Typically, forage plants benefit from the residual nutrients from previous fertilization, reducing the cost of forage maintenance [4,5,6,7].
The use of conserved forages, especially in the form of hay, can be a valuable alternative for forage storage on properties utilizing integrated agricultural and livestock production systems. These systems achieve high stocking rates during certain times of the year thanks to leveraging the soil fertility, which is replenished with fertilizers for grain production during the crop season [8,9]. However, these high stocking rates can also pose risks for planning, making the system more susceptible to weather fluctuations or periods of low forage production. In such cases, a forage stock, such as hay or silage, can be essential for maintaining animal production and well-being.
Typically, Congo grass (Urochloa ruziziensis) is recommended for use in integrated systems, as it provides high mulch production for soil coverage [10]. However, its potential for hay production has not yet been explored in integrated production systems. According to Nascimento et al. [11], Urochloa brizantha grasses (such as Xaraes palisade grass) show significant potential for hay production. On the other hand, according to these authors, Massai guinea grass (Megathyrsus maximus cv. Massai) exhibits lower losses of soluble carbohydrates during the haymaking process, resulting in higher nutritional value of conserved forages. Another grass option for hay production could be Quenia guinea grass (Megathyrsus maximus cv. BRS Quênia), which offers high dry matter digestibility and superior nutritional value compared to other cultivars of Megathyrsus maximus due to its higher leaf-to-stem ratio [12].
Furthermore, for dynamic production systems, such as grass production following soybean cultivation, there remains a lack of information regarding the optimal timing for harvesting forages to produce hay while the grass is within the production system. In the case of Tamani guinea grass (Megathyrsus maximus cv. BRS Tamani), Gomes et al. [13] observed that after a regrowth period of 49 to 63 days, it was possible to achieve forage yields of 3.4 to 4.2 Mg ha−1. However, in the case of more productive grasses with Quenia guinea grass, the time required to reach the ideal stage for haymaking may potentially be delayed.
Therefore, the hypothesis being tested is that Quenia guinea grass, being part of a highly productive genus, will exhibit greater forage mass production and better chemical composition values when managed for hay production in integrated production systems through overseeding in soybean fields. Consequently, the objective is to monitor the development of Quênia guinea grass, Congo grass, and Xaraes palisade grass sown through overseeding in soybean fields, with the aim of determining their respective forage yields, the optimal time for haymaking, and potential for carcass and milk production in the Brazilian Cerrado (Brazilian Savanna).

2. Materials and Methods

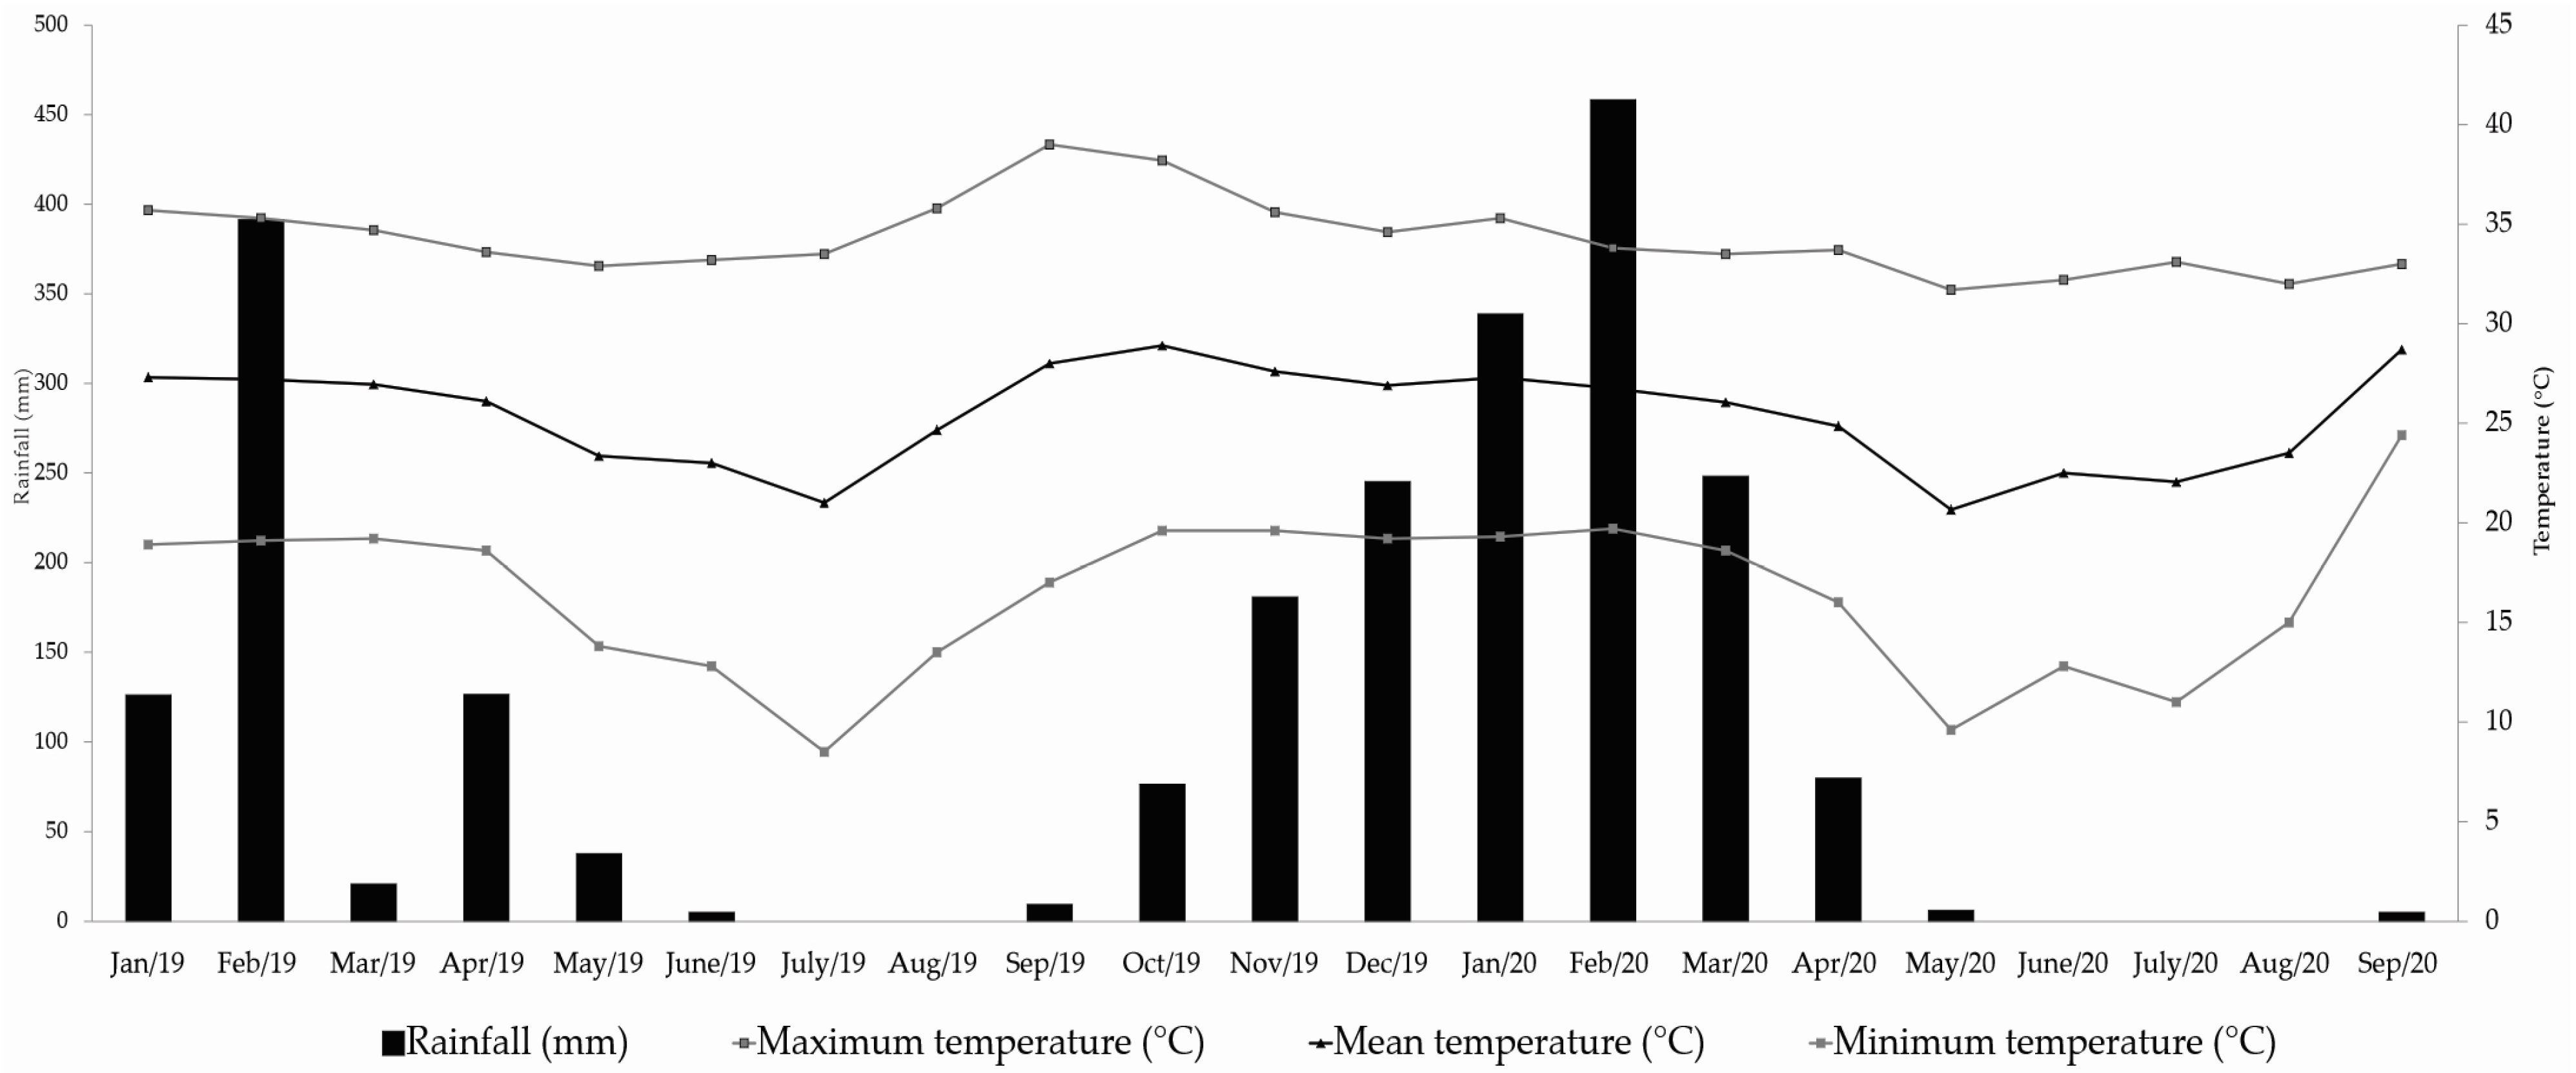
2.1. Experimental Field Characterization

The field experiment was carried out on a commercial farm in the state of Goiás, Brazil (16°32′30″ S 51°06′39″ W). The experiment began in January 2019 and ended in September 2020, thus involving two agricultural harvests. The region’s climate is tropical Aw with two defined seasons, rainy summer and dry winter, with an annual rainfall of 1414 mm and an average annual temperature of 23.1 °C [14]. Climatic information during the experiment was obtained from the automatic weather station of the National Meteorological Institute (INMET), located in the city of Iporá, Goiás, Brazil (Figure 1).

2.2. Treatments in the Production System

The experimental field was divided into 12 paddocks (each measuring 1000 m2), with 4 repetitions of each grass species: Quênia guinea grass (Megathyrsus maximus cv. BRS Quênia), Congo grass (Urochloa ruziziensis), and Xaraes palisade grass (Urochloa brizantha cv. Xaraes). The experiment spanned two years (2019 and 2020) with two phases of soybean (Glycine max) and grass (Figure 2). The grass seeds were overseeded in the soybean crop (at the R5.5 reproductive stage) in February 2019 and February 2020, with an application rate of 6 kg ha−1 of viable pure seeds. Overseeding was performed using a seed spreader attached to a spray bar.

2.3. Soil Characteristics

The soil of the experimental area was classified as Clayey Oxisol with a distrofic Red Latosol profile [15]. The soil’s chemical composition was determined prior to the experiment, and the following results were obtained for the 0–10, 10–20, and 20–40 cm soil layers (Table 1). After analyzing the soil, adjustments were made to correct its acidity and apply fertilizer before sowing soybeans (Glycine max). This involved the application of 1.17 Mg ha−1 of limestone to correct acidity, followed by the application of 80 kg ha−1 of phosphorus pentoxide (P2O5) and 78 kg ha−1 of potassium oxide (K2O).

2.4. Forage Collection for Availability and Chemical Composition Analysis

To determine the forage mass availability (FM), 7 cuts were performed in 2019 (at 35, 63, 89, 139, and 181 days after soybean harvest) and 4 cuts in 2020 (at 31, 59, 120, and 153 days after soybean harvest). Each forage sample from a paddock was composed of five subsamples taken at five random points within the paddock. Each subsample represented all available forages within 1 m2 (above 0.1 m from the ground). The remaining forages in the paddock were left in the field for the next cutting dates.
Forage samples collected at each cutting date were weighed in the field, and a representative sample was placed in paper bags, which were dried in a forced-air oven (at 65 °C) for 72 h. This allowed for the estimation of FM availability (kg ha−1). Then, the samples were ground in a Wiley grinder with a 1 mm sieve.
The chemical composition of forage samples was determined using near-infrared spectroscopy (NIRS) with a previously calibrated curve for these forage species in a commercial laboratory. The characteristics related to chemical composition are presented in Table 2.

2.5. Estimates of Milk and Carcass Production Potential

To generate values for milk production potential, the predictive spreadsheet developed by Shaver et al. [16] (available at http://urlfr.ee/xvyma/; accessed on 1 March 2023) was used. To measure carcass production potential, the spreadsheet by Dahlke [17] (available at http://iowabeefcenter.org/; accessed on 7 March 2023) was employed.
The obtained values for FM availability (kg ha−1) and chemical composition data (CP, MM, starch, NDF, dNDF48, EE) were incorporated into the spreadsheet developed by Shaver et al. [16], with the conversion of net energy values using equations adapted from NRC [18]. This allowed for the estimation of milk production potential per ton of forages (kg Mg−1 to FM) and, consequently, milk production potential per area (kg ha−1).
Estimates of carcass production potential (kg t FM−1) were carried out using the spreadsheet developed by Dahlke [17], incorporating the values of forage dry matter percentage, TDN, and dNDF48 obtained in the laboratory, in combination with estimates of maintenance and gain energy requirements (NEm and NEg) for beef cattle [19].

2.6. Statistical Analysis

Principal Component Analysis (PCA) was used to identify patterns and structures in the dataset. To perform PCA, the R software, version 4.2.1 (available at https://cran.r-project.org/bin/windows/base/old/4.2.1/; accessed on 2 April 2022) [20] was used in conjunction with the factoMineR [21] and factoextra [22] packages.
For the estimation of the evaluated effects, a mixed model analysis was performed, considering the grasses and days as fixed effects, while the year and paddock were considered as random effects: y = µ + Gi + Dj + Dj2 + yk + pt + εijkt. Here, y is the observed value; µ is the intercept of the equation; Gi corresponds to the grasses (Quenia guinea grass, Congo grass, and Xaraes palisade grass); Dj represents the number of days after soybean harvest when the cuts occurred as a continuous variable (2019: 35, 63, 89, 139, and 181 days; 2020: 31, 59, 120, and 153 days); Dj2 is the quadratic effect of days; yk represents the random effect of the years of the experiment (2019 and 2020); and pt represents the random effect of the paddocks within each treatment (1 to 12).
The model was subjected to analysis using the lmer function from the lme4 package [23] in the R software [20]. Subsequently, parameter estimates for the linear and quadratic equations for the effect of days after soybean harvest were calculated for each forage cultivar. Additionally, the coefficient of determination (R2) was computed for each equation. Furthermore, for models displaying quadratic behavior, the points of ‘y’ (observed value) and ‘x’ (days) were calculated. Thus, based on the slope of the equation coefficients, the maximum and minimum points were determined.

3. Results

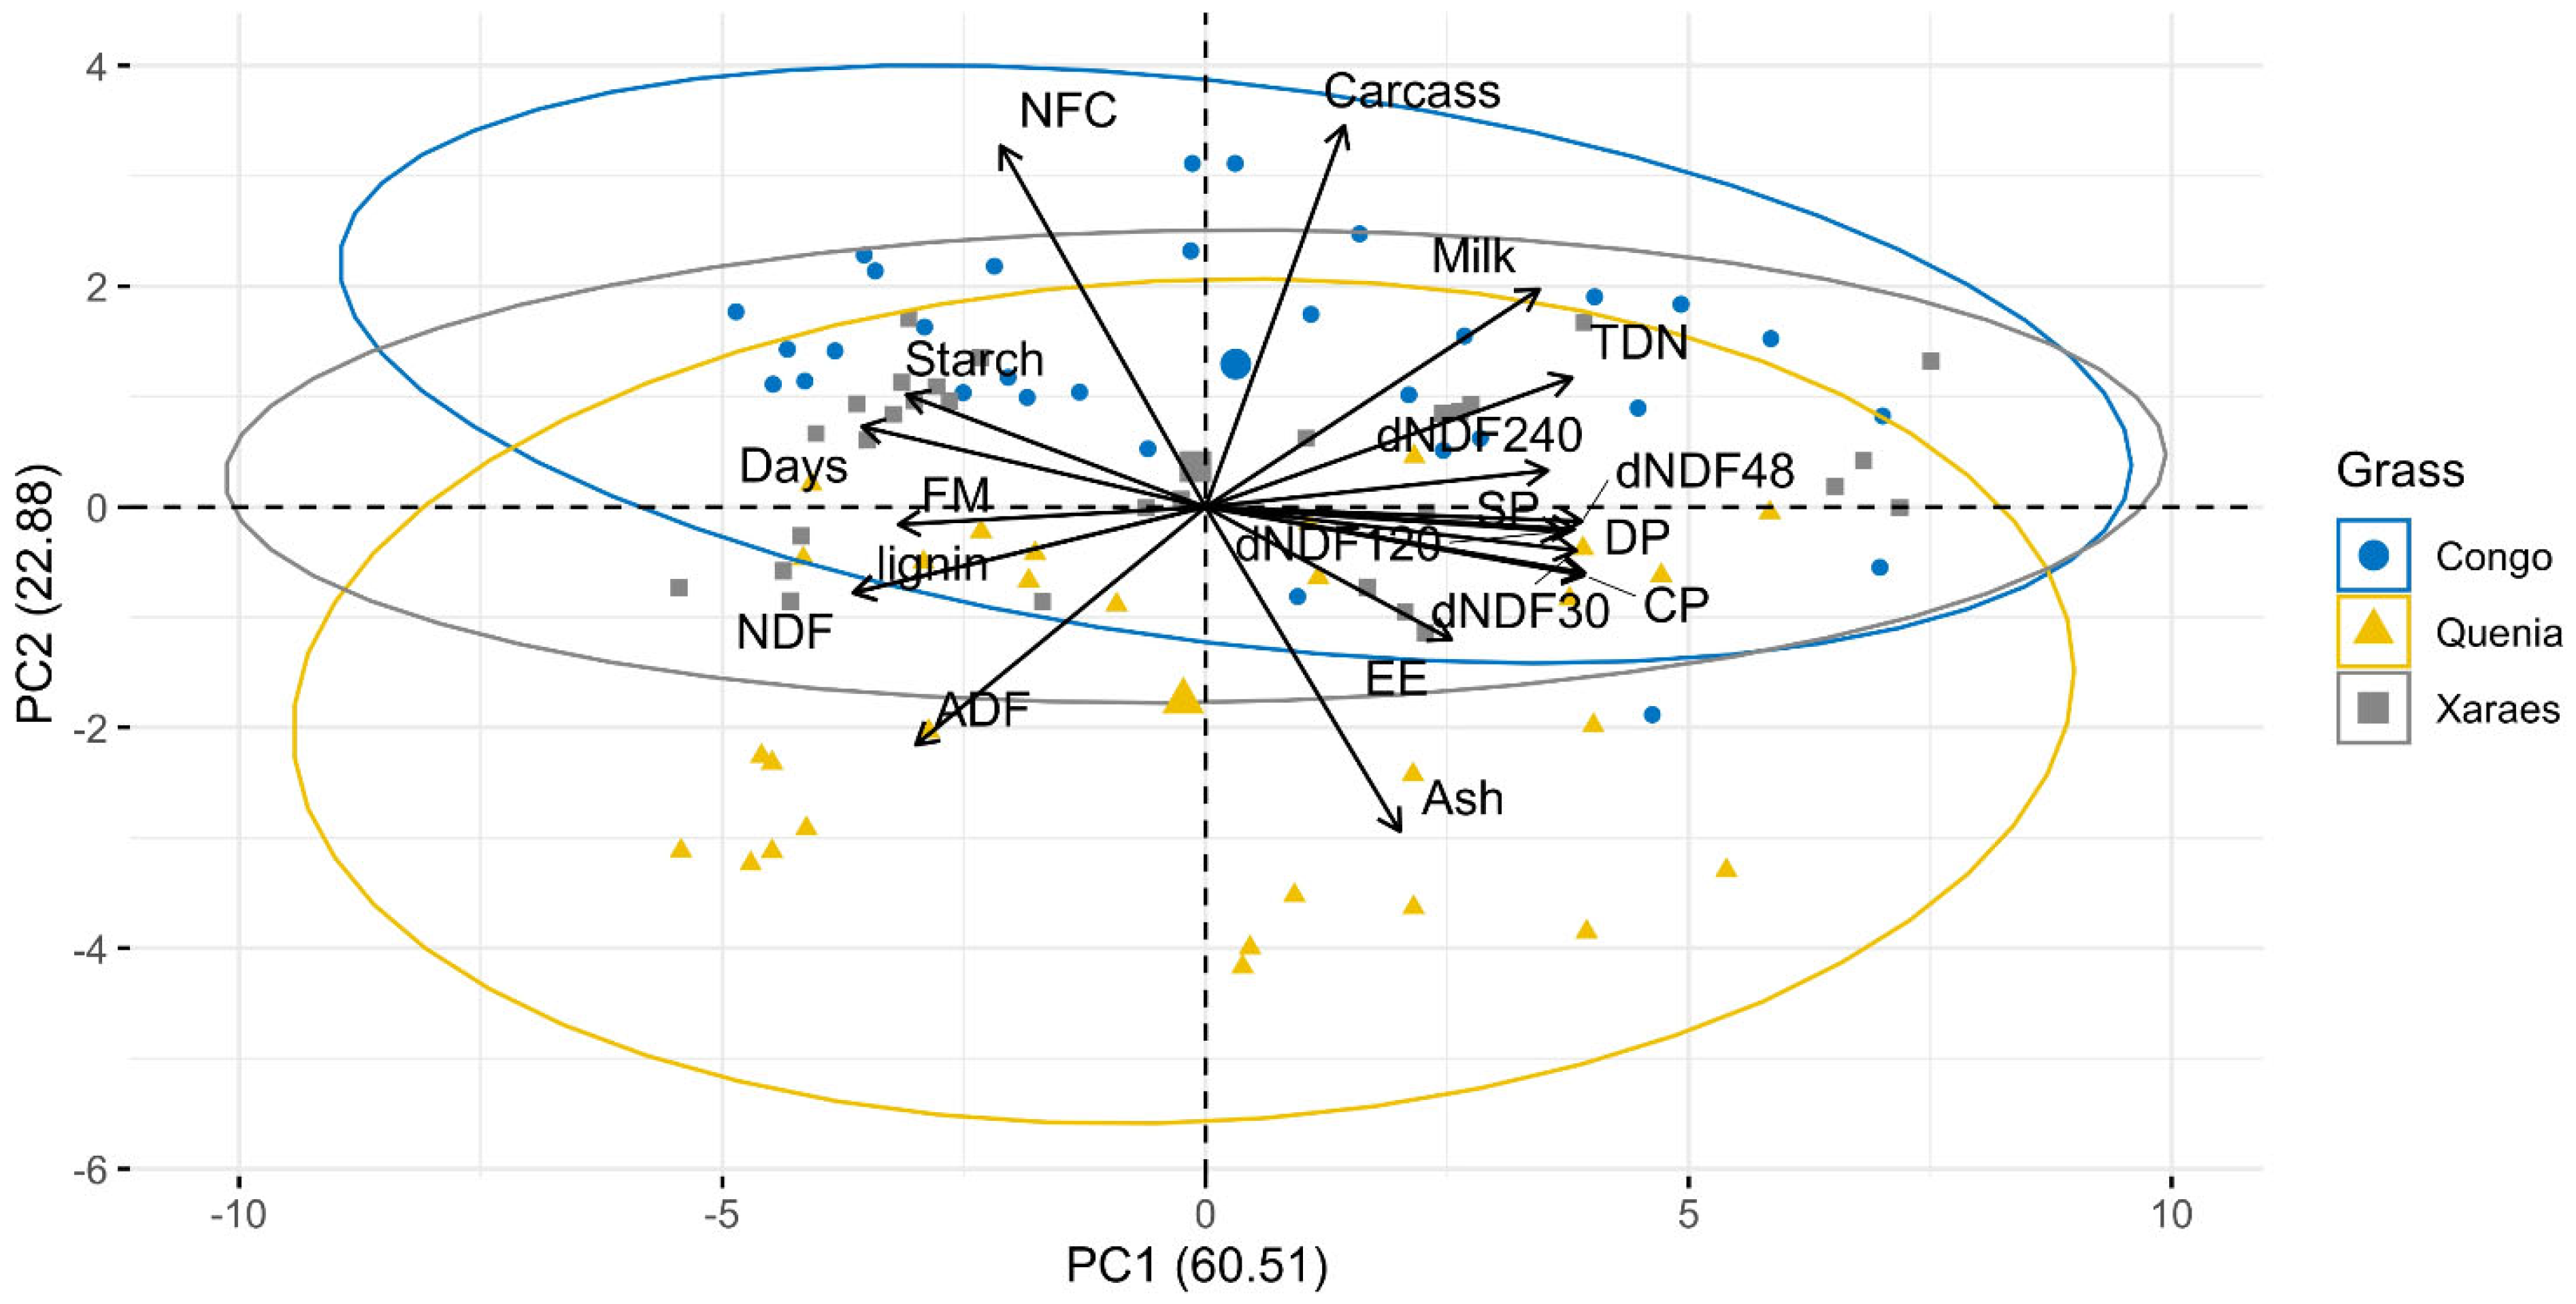
3.1. Association between Forage Mass, Chemical Composition, and Milk and Carcass Production Potential

Based on the PCA analysis, it is observed that the midpoint of the three grasses overseeded in soybean is evenly distributed (Figure 3). Furthermore, the PCA revealed that milk and carcass production potential are positioned in the same quadrant as TDN and NDF digestibility after 240 h of incubation.

3.2. Effect of Cutting Day on Forage Mass and Chemical Composition of Grasses Managed in Integrated Production Systems

A quadratic effect of days on forage mass (FM) was observed in all three grasses studied (Table 3). Thus, the maximum forage mass production was observed for Xaraes palisade grass, 4437.22 kg ha−1 of FM at 183 days. While the maximum points of the other grasses were 4191.51 and 4033.51 kg ha−1 of FM for Quenia guinea grass and Congo grass at 134 and 154 days after soybean harvest, respectively (Table 3).
MM and CP for the three studied grasses also exhibited a quadratic effect of cutting days. Thus, based on the slope of the equation parameters, it is observed that Quenia guinea grass exhibits minimum values of 7.42% for MM when the cut is performed at 113 days (Table 3). Minimum MM values of 3.14% for Congo grass and 2.92% for Xaraes palisade grass were obtained when the cuts were made at 134 and 153 days, respectively. For CP, when forage harvest was delayed (175, 160, and 181 days, respectively), minimum values of 4.78% for Quenia guinea grass, 4.06% for Congo grass, and 3.21% for Xaraes palisade grass were obtained.
Quenia guinea grass exhibited a minimum of 20.71% for SP when cut at 115 days (Table 3). Meanwhile, Congo grass, when cut at 155 days, reached a minimum value of 11.90%. On the other hand, Xaraes palisade grass, when harvested at 170 days, showed values of 3.13% for SP. Regarding DP for Quenia guinea grass and Congo grass, it is observed that when harvested at 174 and 157 days, minimum values of 4.76% and 4.42% are quantified. When the cut was made at 180 days, a value of 3.28% for DP in Xaraes palisade grass is observed.
Quenia guinea grass and Xaraes palisade grass, when harvested at 175 and 180 days, yield minimum values of 56.93% and 56.10% for TDN. When the cut is performed at 174 days, Congo grass has 59.13% TDN (Table 4).
The influence of cutting days on the starch concentration and NFC of Quenia guinea grass was not observed. Therefore, no adjustments were necessary for a linear or quadratic equation (Table 4). However, in the other cultivars, the opposite was observed. When cutting Congo grass at 123 days, a starch concentration of 2.97% was recorded. In the case of Xaraes palisade grass, the highest starch concentration (2.00%) was obtained when cutting was performed at 105 days (Table 4).
Congo grass exhibited a maximum value of 28.18% NFC when cut at 153 days. The equation used to determine NFC concentration in Xaraes palisade grass showed a better fit for a linear equation. Based on the slope of the parameters, it can be observed that the fraction of this nutrient in the forage canopy increases over time (Table 4).
A quadratic effect was observed for the NDF fraction, where when cut at 160 days, Quenia guinea grasses exhibited maximum values of 65.60% (Table 4). When cut at 141 and 148 days, Congo grass and Xaraes palisade grass showed maximum values of 61.58% and 63.73% NDF, respectively. Regarding the ADF concentration, cutting Quenia guinea grass at 133 days resulted in an average value of 36.55%. For Congo grass and Xaraes palisade grass, maximum values of 35.10% and 35.30% were obtained when cut at 149 and 145 days, respectively. As for the lignin fraction of Quenia guinea grass, when cut at 39 days, maximum values of 4.42% were recorded. At 75 days, values of 3.81% were measured in Xaraes palisade grass and 4.04% in Congo grass (Table 4).
A linear effect was observed in the dNDF30 and dNDF120 variables for Quenia guinea grass, as well as in the dNDF120 of Congo grass. Thus, it was observed that the digestibility of the fibrous fraction shows a significant reduction when the cut is performed later (Table 5).
Quadratic effects were identified for dNDF30 in Congo grass and Xaraes palisade grass (Table 5). In these two cultivars, the minimum digestibility values (46.29% and 43.65%, respectively) are achieved when cutting is performed at 171 and 174 days, respectively. Also, for both cultivars, dNDF48 showed a quadratic effect, resulting in minimum values of 60.27% for Congo grass when cut at 165 days and 58.90% for Xaraes palisade grass when harvested at 174 days (Table 5).
Regarding dNDF120, both Quenia guinea grass and Xaraes palisade grass exhibit minimum values of 65.70% and 61.41%, respectively, when cut at 165 and 180 days. In relation to dNDF240 for Quenia guinea grass, when harvested at 174 days, it shows a value of 74.95%, while Congo grass shows a value of 72.90% when harvested at 152 days. Finally, Xaraes palisade grass, harvested at 181 days, exhibits a digestibility of 70.83% (Table 5).

3.3. Potential for Milk and Carcass Production in Integrated Production Systems

Quenia guinea grass, when harvested at 177 days, exhibits minimum values of milk production potential at 1176.07 kg t FM−1, while for Xaraes palisade grass, when cut at 175 days, estimated values of 1267.74 kg t FM−1 are measured. Congo grass shows a linear equation to estimate milk production potential, so as the days of cutting progress, there is a reduction in milk production potential per t of hay (Table 6).
No linear or quadratic effects were observed to estimate carcass production potential per Mg of hay in Quenia guinea grass and Xaraes palisade grass. On the other hand, a quadratic effect was observed for Congo grass, where, when harvesting the forages at 107 days, it is possible to obtain 110.65 kg t FM−1 of carcass production potential (Table 6).

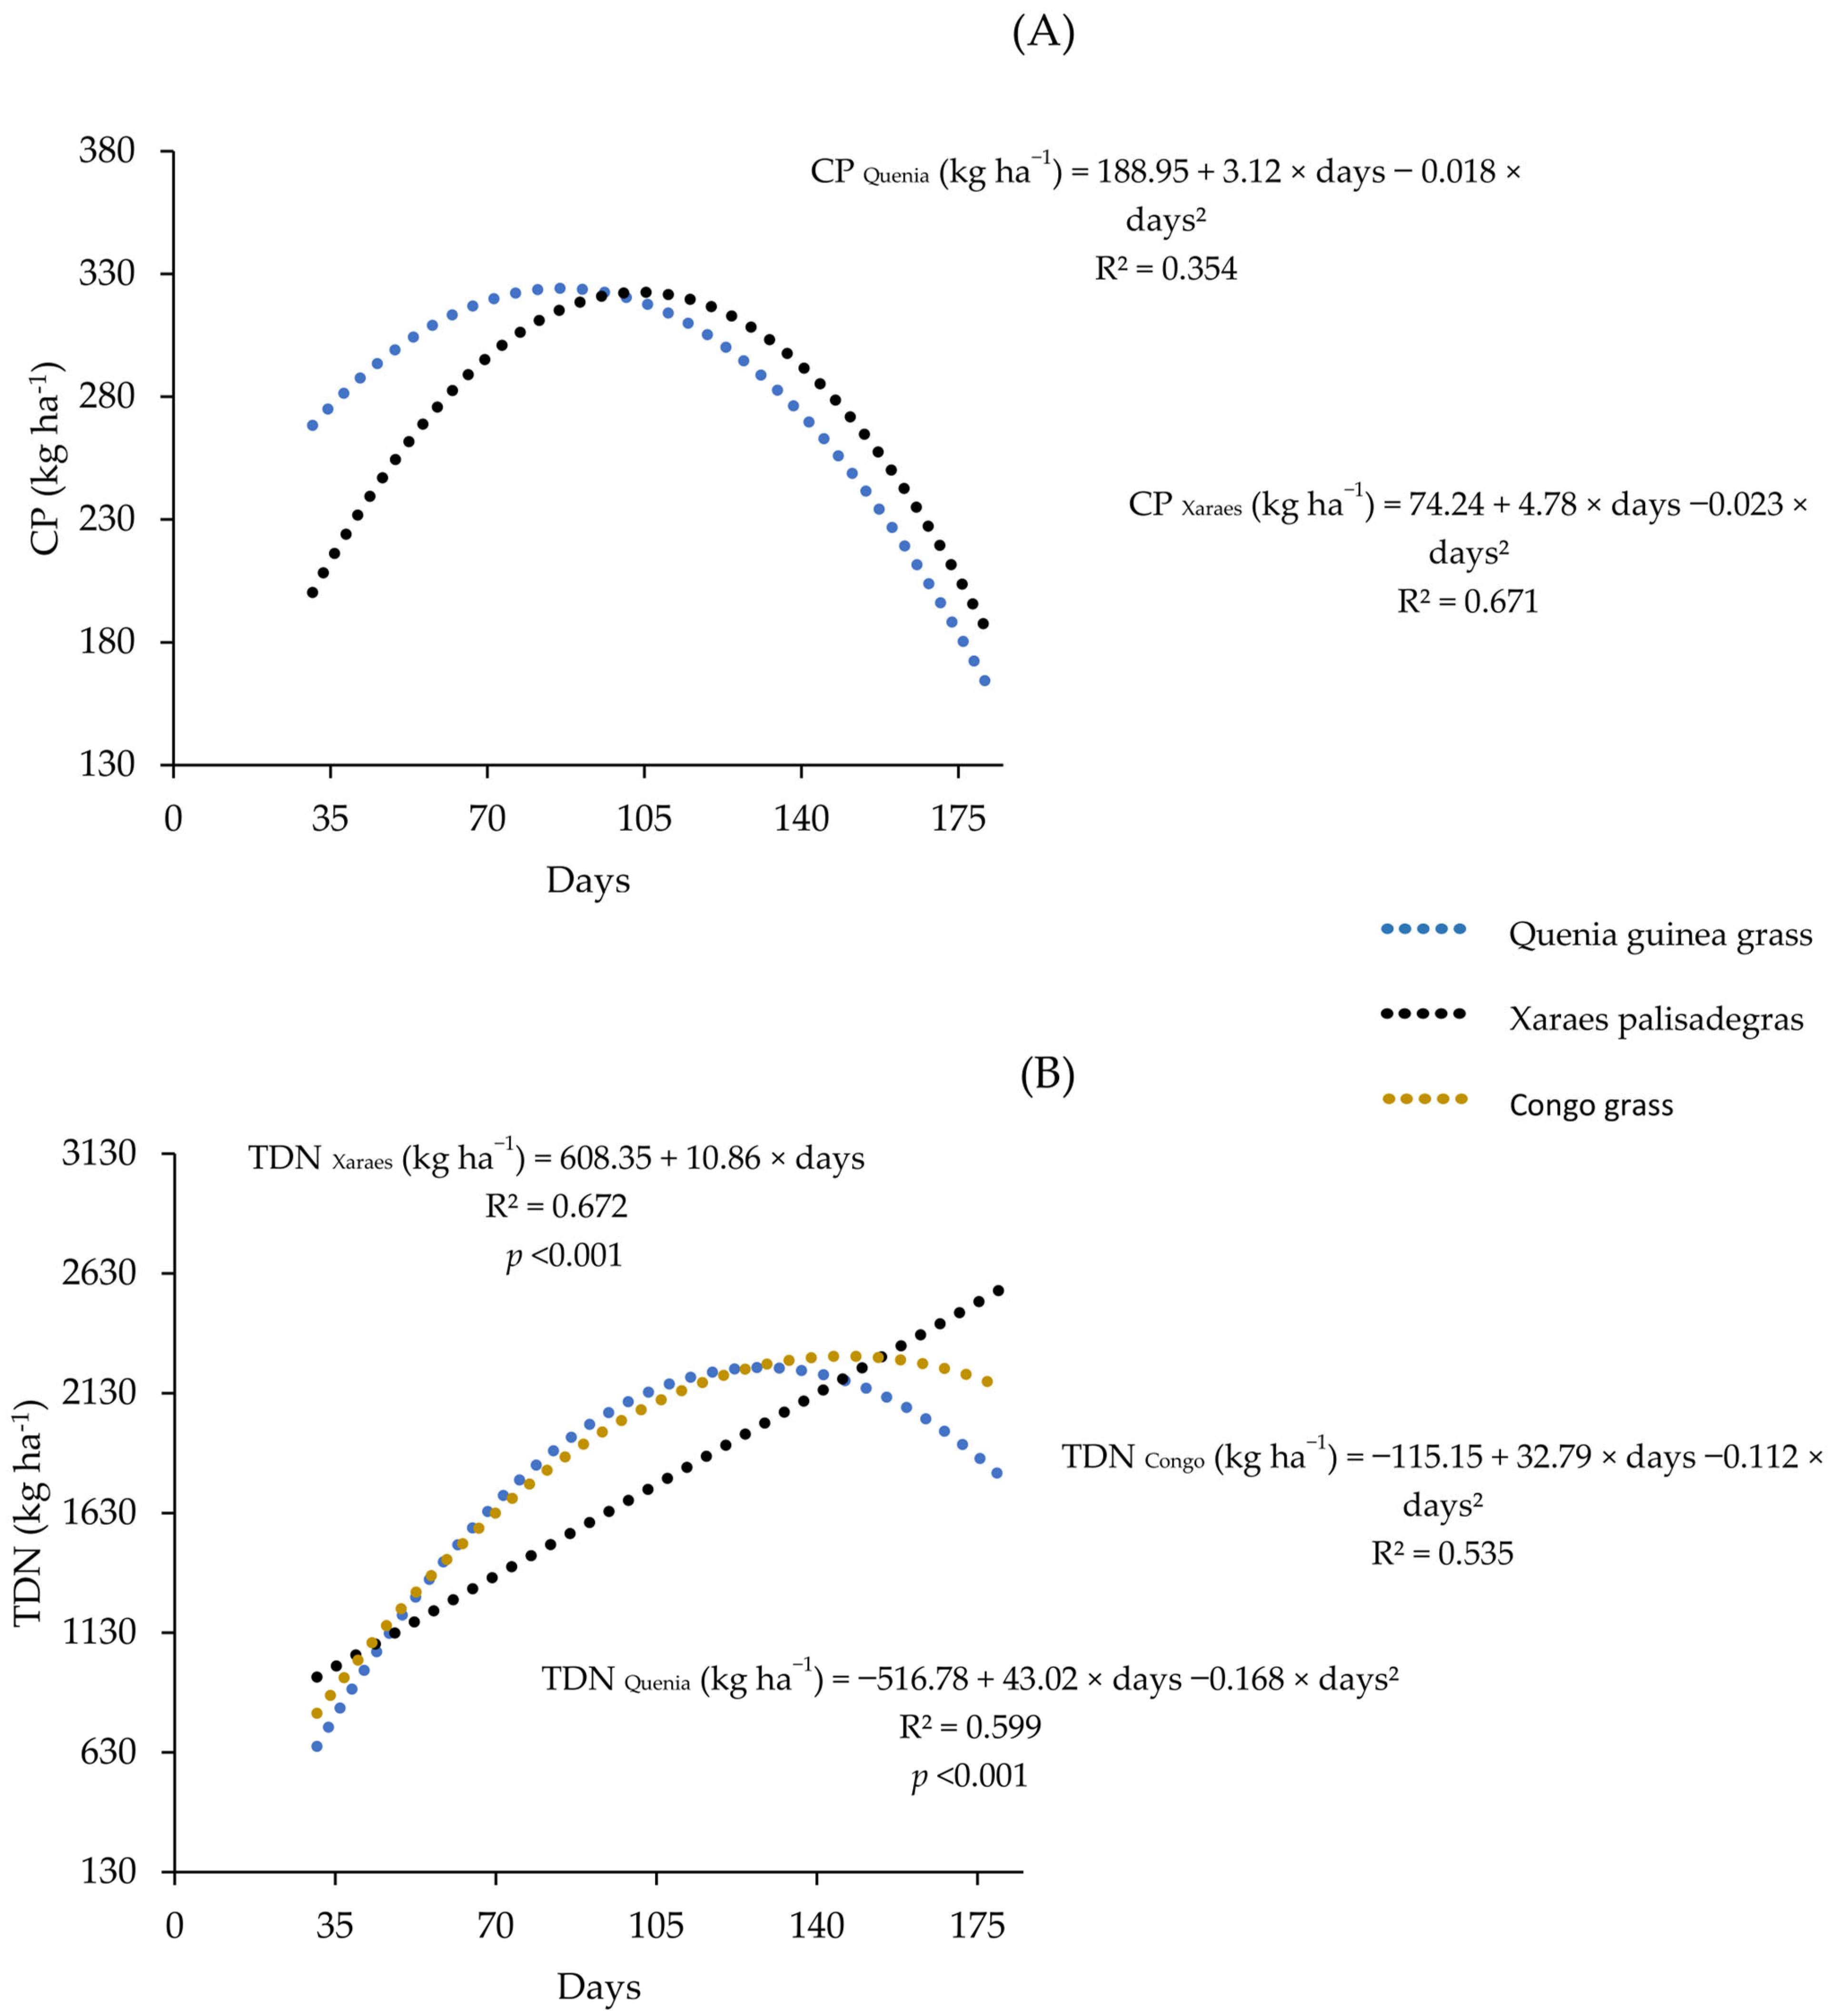
3.4. Production of Crude Protein, Total Digestible Nutrients, Milk, and Carcass Production Potential per Hectare

It was found that cutting Quenia guinea grass and Xaraes palisade grass at 87 and 104 days, respectively, resulted in estimates of 324.15 kg ha−1 of CP and 322.59 kg ha−1 of CP, respectively. On the other hand, it was not possible to find predictive equations for the amount of CP in kg ha−1 for Congo grass due to the lack of adequate adjustments in linear and quadratic equations, as well as low R2 values (Figure 4A).
Regarding the TDN content, when Quenia guinea grass was cut at 128 days, it yielded 2237.27 kg ha−1, while Congo grass reached 2284.81 kg ha−1 of TDN when cut at 146 days (Figure 4B). Analyzing the potential for milk production for the three types of grasses, a better fit was observed using quadratic equations. When Quenia guinea grass was cut at 129 days, a milk production potential of 5015.36 kg ha−1 was obtained. Congo grass reached 5400.84 kg ha−1 of milk when cut at 146 days. Xaraes palisade grass, cut at 170 days, showed 5421.08 kg ha−1 of milk (Figure 5A).
Regarding carcass production, Quenia guinea grass cut at 123 days showed a carcass production potential of 220.85 kg ha−1, while Xaraes palisade grass had a potential of 291.80 kg ha−1 of carcass when cut at 132 days. Congo grass, when cut at 134 days, exhibited a carcass production potential of 407.97 kg ha−1 (Figure 5B).

4. Discussion

4.1. Potential Dry Hay Mass Yield from Grasses in Integrated Production Systems

For hay production, it is recommended to use forage resources that exhibit fine stems and higher nutritional value, especially high CP content, as is the case with alfalfa (Medicago sativa) and Cynodon spp. [24,25]. However, these plants are extremely demanding in terms of soil fertility management. In the Brazilian Cerrado, essential nutrient availability for plant growth is limited due to high levels of active acidity and low organic matter content in the soil [26]. This can compromise the productive and sustainable performance of forage resource production.
As an alternative for ruminant nutrition in this environment, grasses from the genera Megathyrsus maximus and Urochloa spp. are extremely promising because they exhibit phenotypic plasticity to produce forages in this challenging and complex environment [27,28]. However, during the off-season, the reduction in temperature and precipitation (Figure 1) slows down growth, resulting in FM values of less than 2000 kg ha−1 in grasses of Megathyrsus maximus and Urochloa spp. [29,30].
Cultivating Quenia guinea grass, Xaraes palisade grass, and Congo grass in an integrated system can double forage production (Table 3). However, forage production should always seek a balance between quantity and quality. Managing grasses with very long intervals between cuts can lead to the excessive accumulation of morphological components (stem and dead material) with a high lignin and structural carbohydrate concentration, reducing the protein and soluble carbohydrate fractions within the plant structure [31]. As a result, harvests performed after 170 days yield CP and DP values below 7%. In such scenarios, these types of forages may not promote good ruminal microbial development [32,33]. Regarding SP in the studied cultivars, it is observed that Quenia guinea grass exhibited higher values. Therefore, by cutting at 115 days, it is possible to increase the rapid-degrading protein fractions in the rumen, which is desirable to enhance animal performance [34].
For all three tested grasses, NDF and ADF values are below 70% and 40%, respectively, even when cutting is delayed. In tropical climate grasses, NDF values typically range from 72% to 74%. Higher values are obtained during the reproductive phase or when there is a high proportion of stems and straw in the canopy [35,36,37]. ADF values generally do not exceed 41.80% [38]. Therefore, the results obtained with grasses planted in an integrated production system show that even when cutting is delayed, it is still possible to achieve NDF and ADF values below the level that would compromise forage intake.
Euclides et al. [39] conducted a study on Marandu palisade grass (Urochloa brizantha cv. Marandu) and Decumbens grass (Urochloa decumbens) and they found that simulated grazing samples had digestibility values of less than 50%. This result is common due to the higher stem participation caused by the management strategy, which increases the fibrous fraction and lignin in the forage canopy. However, in the case of growing Xaraes palisade grass and Congo grass in integrated systems, it was found that after 48 h of incubation, NDF digestibility values exceeded 58%. After 240 h of incubation, values above 70% NDF digestibility were achieved, even when cutting grasses was delayed. These results indicate that the integrated system alters the plant’s growth habit, impacting the reduction in the fibrous fraction and lignin polymers in the structural components of the tiller.
The grasses from the Urochloa spp. genera exhibited ash values below 4.0%, while Quenia guinea grass had a higher concentration. Megathyrsus maximus grasses are more demanding in soil fertility and, therefore, have a higher nutrient utilization efficiency [40], which can impact the higher mineral concentration in the forage mass. This increased mineral concentration in Megathyrsus maximus is important for nutrient cycling in integrated systems, providing greater nutrient availability for the successive crop. Especially in a systems fertilization strategy, this forage material has the potential to intensify nutrient cycling and benefit the production system. Silva et al. [41] found that the use of Megathyrsus maximus cultivars (Zuri guinea grass and Tamani guinea grass) in integrated production systems has the potential to increase the amount of assimilated carbon in the ecosystem. This, in turn, contributes to improving soil quality, promoting the sustainability of production over subsequent harvests.

4.2. Perspectives for Milk and Carcass Production Using Hay from Grasses in Integrated Production Systems

Cultivating Xaraes palisade grass in a soybean oversown system can lead to forage production that exceeds conventional production system expectations. In just a single cut, it is possible to achieve forage production equivalent to 49% of milk production per hectare when compared to the average value estimated by Vilela et al. [42]. As indicated by these authors, in tropical climates, when grasses are properly managed, they have the potential to generate an annual average of 11,250 kg ha−1 of milk.
The assessment of milk production potential is based on various variables, including CP, ash, starch, NDF, dNDF48, and EE. However, PC1 analysis (Figure 4) reveals that the TDN and dNDF240h variables were associated with milk production. Shaver et al. [16] developed a predictive spreadsheet in which TDN is adjusted to enhance milk potential prediction accuracy. Therefore, we can confidently state that these traits can serve as an indicator of forage quality for haying. Similarly, the potential for carcass production is also related to this variable, being in the same quadrant as TDN (Figure 3).
In the context of grass-based carcass production, Barbero et al. [43] observed that the annual average in Brazil is approximately 60 kg ha−1 of carcass. However, when Congo grass is managed after the soybean crop, the forages produced exhibit impressive potential, with the ability to generate up to 407.97 kg ha−1 of carcass. Congo grass stands out due to its finer stems and shorter height compared to other types of grass, resulting in a lower deposition of fibrous fractions in the canopy [12]. This allows for greater availability of NFC and TDN, making it a valuable choice for deferred grazing and hay production. Based on these characteristics, Congo grass can boost zootechnical performance for milk and carcass production in integrated production systems.

4.3. General Considerations

To estimate forage production in integrated production systems, specific equations were developed for the following different grass cultivars: Quenia guinea grass, Congo grass, and Xaraes palisade grass. These equations provide an initial prediction for farmers in the Central Brazil region to use as a reference for planning production systems, giving an approximate idea of the potential forage production in the scenario of overseeding forage plants in soybean crops. It also guides the timing between soybean harvest and forage plant cutting. However, it is important to note that depending on environmental conditions (temperature, altitude, precipitation, and soil fertility), the ideal timing for forage plant cutting for hay production may vary and be specific to each case. In this study, we have presented the characterization of how these forage growth dynamics and quality occur and how they can be monitored by technicians and farmers to identify the optimal cutting point, thereby increasing production efficiency and ensuring sustainability.
While CP, expressed as a percentage of DM or corrected to kg ha−1, is often used to determine forage quality, in the case of integrated production, it is necessary to consider other information as quality indicators. For this reason, other characteristics like TDN and dNDF240h are more relevant and have a stronger association with parameters of animal production, especially in the case of Congo grass (Figure 5)
Therefore, it is recommended to use the following equations to estimate the TDN of Congo grass, as well as milk and carcass production, which are associated with this characteristic:
TDN Congo (kg ha−1) = −115.15 + 32.79 × days − 0.112 × days2 (R2 = 0.535);
Milk Congo (kg ha−1) = −303.67 + 78.20 × days − 0.268 × days2 (R2 = 0.531);
Carcass Congo (kg ha−1) = −126.70 + 8.01 × days − 0.030 × days2 (R2 = 0.531);
In the case of Quenia guinea grass, the following recommended equations are presented to determine the quality of the forages produced:
TDN Quenia (kg ha−1) = −516.78 + 43.02 × days − 0.168 × days2 (R2 = 0.599);
Milk Quenia (kg ha−1) = −916.01 + 92.29 × days − 0.359 × days2 (R2 = 0.568);
Carcass Quenia (kg ha−1) = −50.49 + 4.42 × days − 0.018 × days2 (R2 = 0.605);
Xaraes palisade grass can also be an alternative for hay production in integrated production systems. Therefore, for this cultivar, the following prediction equations are provided:
TDN Xaraes (kg ha−1) = 608.35 + 10.86 × days (R2 = 0.672);
Milk Xaraes (kg ha−1) = −323.24 + 67.45 × days − 0.198 × days2 (R2 = 0.700);
Carcass Xaraes (kg ha−1) = −41.11 + 5.03 × days − 0.019 × days2 (R2 = 0.564);
Applying these equations will play a pivotal role in helping technicians and farmers in planning the production systems. Furthermore, by incorporating the potential for milk and carcass production, it will be possible to more accurately quantify the quality of the forages produced, which, in turn, will simplify the process of determining their value for commercial purposes.

5. Conclusions

The results indicated that Xaraés palisade grass had a higher yield of forage mass, while Quenia guinea grass stood out for its high fractions of soluble proteins. However, it is important to note that these characteristics did not impact the potential for milk and carcass production. Congo grass showed high potential in hay production when used as a cover crop in soybeans, particularly concerning carcass production, possibly due to the positive influence of TDN. To achieve the maximum potential for carcass production per ton of forages produced, Congo grass should be harvested 107 days after sowing.

Author Contributions

Conceptualization, T.d.P.P., E.M.A., D.d.C.S. and P.B.F.; methodology, F.L.C., V.N.L., B.R.S., L.P.d.S. and L.F.G.; software, P.B.F.; validation, T.d.P.P. and K.C.G.; formal analysis, T.d.P.P. and P.B.F.; investigation, P.B.F.; resources, T.d.P.P.; data curation, T.d.P.P.; writing—original draft preparation, P.B.F.; writing—review and editing, P.B.F.; visualization, T.d.P.P. and D.d.C.S.; supervision, T.d.P.P.; project administration, T.d.P.P.; funding acquisition, T.d.P.P. All authors have read and agreed to the published version of the manuscript.

Funding

This study was financed in part by the Coordenação de Aperfeiçoamento de Pessoal de Nível Superior—Brasil (CAPES), Finance Code 001. National Council for Scientific and Technological Development—CNPq: numbers 409400/2021-1 and 309962/2022-6. Goiano Federal Institute of Education, Science, and Technology (IF Goiano): number 19/2022.

Data Availability Statement

The datasets generated during and/or analyzed during the current study are available from the corresponding author upon reasonable request.

Acknowledgments

We acknowledge the administrative support of Goiano Federal Institute of Education Science and Technology (IF Goiano).

Conflicts of Interest

The authors have no conflict of interest to declare relevant to this article’s content.

References

  1. Dominschek, R.; Barroso, A.A.M.; Lang, C.R.; de Moraes, A.; Sulc, R.M.; Schuster, M.Z. Crop rotations with temporary grassland shifts weed patterns and allows herbicide-free management without crop yield loss. J. Clean. Prod. 2021, 306, 127140. [Google Scholar] [CrossRef]
  2. Almeida, E.M.; de Araújo, A.R.; Difante, G.D.S.; Motta Macedo, M.C.; Montagner, D.B.; Gurgel, A.L.C.; Zimmer, A.H.; Ferreira, A.D. Do Different Soil Use and Management Systems Change Root Weight? N. Z. J. Agric. Res. 2023, 65, 1–19. [Google Scholar] [CrossRef]
  3. Dias, M.B.C.; Costa, K.A.P.; Severiano, E.C.; Bilego, U.O.; Furtine Neto, A.E.; Almeida, D.P.; Brand, S.C.; Vilela, L. Brachiaria and Panicum maximum in an integrated crop–livestock system and a second-crop maize system in succession with soybean. J. Agric. Sci. 2020, 158, 206–217. [Google Scholar] [CrossRef]
  4. Moraes, A.; de Faccio Carvalho, P.C.; Anghinoni, I.; Lustosa, S.B.C.; de Andrade, S.E.V.G.; Kunrath, T.R. Integrated Crop–Livestock Systems in the Brazilian Subtropics. Eur. J. Agron. 2014, 57, 4–9. [Google Scholar] [CrossRef]
  5. Oliveira, S.; Costa, K.A.; Severiano, E.; da Silva, A.; Dias, M.; Oliveira, G.; Costa, J.V. Performance of Grain Sorghum and Forage of the Genus Brachiaria in Integrated Agricultural Production Systems. Agronomy 2020, 10, 1714. [Google Scholar] [CrossRef]
  6. Muniz, M.P.; Costa, K.A.P.; Severiano, E.C.; Bilego, U.O.; Almeida, D.P.; Furtini Neto, A.E.; Vilela, L.; Lana, M.A.; Leandro, W.M.; Castro Dias, M.B. Soybean Yield in Integrated Crop–Livestock System in Comparison to Soybean–Maize Succession System. J. Agric. Sci. 2021, 159, 188–198. [Google Scholar] [CrossRef]
  7. Leal, V.N.; Santos, D.d.C.; Paim, T.d.P.; Santos, L.P.d.; Alves, E.M.; Claudio, F.L.; Calgaro, G., Jr.; Fernandes, P.B.; Salviano, P.A.P. Economic Results of Forage Species Choice in Crop–Livestock Integrated Systems. Agriculture 2023, 13, 637. [Google Scholar] [CrossRef]
  8. Domiciano, L.F.; Mombach, M.A.; Carvalho, P.; da Silva, N.M.F.; Pereira, D.H.; Cabral, L.S.; Lopes, L.B.; Pedreira, B.C. Performance and Behaviour of Nellore Steers on Integrated Systems. Anim. Prod. Sci. 2018, 58, 920–929. [Google Scholar] [CrossRef]
  9. Da Silva, F.S.; Domiciano, L.F.; Gomes, F.J.; Sollenberger, L.E.; Pedreira, C.G.; Pereira, D.H.; Pedreira, B.C. Herbage Accumulation, Nutritive Value and Beef Cattle Production on Marandu Palisadegrass Pastures in Integrated Systems. Agrofor. Syst. 2020, 94, 1891–1902. [Google Scholar] [CrossRef]
  10. Ferreira, G.A.; Oliveira, P.S.R.; Alves, S.J.; da Costa, A.C.T. Soybean Productivity under Different Grazing Heights of Brachiaria ruziziensis in an Integrated Crop-Livestock System. Rev. Ciênc. Agron. 2015, 46, 755–763. [Google Scholar] [CrossRef]
  11. Nascimento, K.S.; Edvan, R.L.; Santos, C.O.; Sousa, J.M.S.; Nascimento, R.R.; Miranda, R.S.; Bezerra, L.R.; Biagiotti, D.; Lima Neto, A.F.; Araujo, M.J. Production aspects of hay of pasture tropical of Urochloa brizantha, Megathyrsus maximus and Andropogon gayanus: Forage mass yield characteristics, evaluation of losses, dehydration and nutritional value of hays. Crop Pasture Sci. 2022, 74, 1425–1437. [Google Scholar] [CrossRef]
  12. Barrios, S.C.L.; Carromeu, C.; Silva, M.A.I.; Matsubara, E.T.; Valle, C.B.; Jank, L.; Santos, M.F.; Assis, G.M.L.; Crivellaro, L.L.; Gonçalves, T.D.T.; et al. Pasto Certo® Version 2.0—An Application about Brazilian Tropical Forage Cultivars for Mobile and Desktop Devices. Trop. Grassl. Forrajes Trop. 2020, 8, 162–166. [Google Scholar] [CrossRef]
  13. Gomes, E.N.O.; Dias, A.M.; Junges, L.; Ítavo, L.C.V.; Difante, G.S.; Batistoti, J.O. Influence of the cut intervals on hay quality of Panicum maximum cv. BRS Tamani. Rev. Mex. Cienc. Pecu. 2023, 14, 450–465. [Google Scholar] [CrossRef]
  14. Cardoso, M.R.D.; Marcuzzo, F.F.N.; Barros, J.R. Classificação Climática de Köppen-Geiger para o Estado de Goiás e o Distrito Federal. ACTA Geográfica 2014, 8, 40–55. [Google Scholar] [CrossRef]
  15. Santos, H.G.; Jacomine, P.K.T.; Anjos, L.H.C.; Oliveira, V.A.; Lumbreras, J.F.; Coelho, M.R.; Cunha, T. Sistema Brasileiro de Classificação de Solos; EMBRAPA: Brasília, Brazil, 2018; p. 356. [Google Scholar]
  16. Shaver, R. Corn Silage Evaluation: MILK 2000 Challenges and Opportunities with MILK 2006. Available online: https://www.foragelab.com/Media/milk2006weblinkslides.pdf (accessed on 1 March 2023).
  17. Dahlke, G.R. Corn Silage to Beef Calculator; Iowa State University Animal Industry Report; Iowa State University: Ames, IA, USA, 2017; Volume 14, pp. 1–2. [Google Scholar]
  18. National Research Council. Nutrient Requirements of Dairy Cattle, 7th ed.; National Academy Press: Washington, DC, USA, 2001. [Google Scholar]
  19. National Research Council. Nutrient Requirements of Beef Cattle, 8th ed.; National Academies Press: Washington, DC, USA, 2016. [Google Scholar]
  20. R Core Team 2022. R: A Language and Environment for Statistical Computing. 2022. Available online: https://www.R-project.org/ (accessed on 10 January 2022).
  21. Lê, S.; Josse, J.; Husson, F. FactoMineR: An R package for multivariate analysis. J. Stat. Softw. 2008, 25, 1–18. [Google Scholar] [CrossRef]
  22. Kassambara, A.; Mundt, F. Factoextra: Extract and Visualize the Results of Multivariate Data Analyses. R Package Version 1.0.7. 2020. Available online: https://cran.r-project.org/package=factoextra (accessed on 15 March 2023).
  23. Bates, D.; Mächler, M.; Bolker, B.; Walker, S. Fitting Linear Mixed-Effects Models Using lme4. J. Stat. Softw. 2015, 67, 48. [Google Scholar] [CrossRef]
  24. Cacan, E.; Kokten, K.; Seydosoglu, S. Determining the performance of alfalfa population collected from a narrow agroeceological zone of Turkey. Ciênc. Rural 2020, 50, e20190721. [Google Scholar] [CrossRef]
  25. Corrêa, Y.; Santos, E.; Oliveira, J.; Carvalho, G.; Pinto, L.; Pereira, D.; Assis, D.; Cruz, G.; Panosso, N.; Perazzo, A.; et al. Diets Composed of Tifton 85 Grass Hay (Cynodon sp.) and Concentrate on the Quantitative and Qualitative Traits of Carcass and Meat from Lambs. Agriculture 2022, 12, 752. [Google Scholar] [CrossRef]
  26. Correia, J.R.; Reatto, A.; Spera, S.T. Solos e Suas Relações com o Uso e o Manejo. Capítulo 1. In Cerrado Correção do Solo e Adubação; EMBRAPA Cerrados: Brasília, Brazil, 2004; pp. 29–62, (In Portuguese). Available online: https://urlfr.ee/78vs9 (accessed on 2 February 2023).
  27. Jank, L.; Resende, R.M.S.; Valle, C.B.; Resende, M.D.V.; Chiari, L.; Cancado, L.J.; Simioni, C. Melhoramento Genético de Panicum maximum Jacq. In Melhoramento de Forrageiras Tropicais; Resende, R.M.S., Valle, C.B.d., Jank, L., Eds.; Embrapa Gado de Corte: Campo Grande, Brazil, 2008; pp. 55–87. [Google Scholar]
  28. Valle, C.B.; Jank, L.; Resende, R.M.S. O Melhoramento de Forrageiras Tropicais no Brasil. Rev. Ceres 2009, 56, 460–472. [Google Scholar]
  29. Euclides, V.P.B.; Montagner, D.B.; Difante, G.d.S.; Barbosa, R.A.; Fernandes, W.S. Sward Structure and Livestock Performance in Guinea Grass cv. Tanzania Pastures Managed by Rotational Stocking Strategies. Sci. Agric. 2014, 71, 451–457. [Google Scholar] [CrossRef]
  30. Pereira, M.; Morais, M.G.; Fernandes, P.B.; Santos, V.A.C.; Glatzle, S.; Almeida, R.G. Beef cattle production on Piatã grass pastures in silvopastoral systems. Trop. Grassl. Forrajes Trop. 2021, 9, 1–12. [Google Scholar] [CrossRef]
  31. Ferreira, E.A.; Abreu, J.G.; Martinez, J.C.; Braz, T.G.; Ferreira, D.P. Cutting ages of elephant grass for chopped hay production. Pesqui. Agropecu. Trop. 2018, 48, 245–253. [Google Scholar] [CrossRef]
  32. Detmann, E.; Valente, E.E.L.; Batista, E.D.; Huhtanen, P. An evaluation of the erformance and efficiency of nitrogen utilization in cattle fed tropical grass pastures with supplementation. Livest. Sci. 2014, 162, 141–153. [Google Scholar] [CrossRef]
  33. Silva, C.S.; Euclides, V.P.B.; Montagner, D.B.; Araújo, I.M.M.; Difante, G.S.; Orrico, M.A.P., Jr. Effects of different supplements on performance of steers grazing Mombaça guinea grass (Megathyrsus maximus) during the dry period. Trop. Grassl. Forrajes Trop. 2022, 10, 44–51. [Google Scholar] [CrossRef]
  34. Leite, R.G.; Cardoso, A.D.S.; Fonseca, N.V.B.; Silva, M.L.C.; Tedeschi, L.O.; Delevatti, L.M.; Ruggieri, A.C.; Reis, R.A. Effects of nitrogen fertilization on protein and carbohydrate fractions of Marandu palisadegrass. Sci. Rep. 2021, 11, 14786. [Google Scholar] [CrossRef] [PubMed]
  35. Euclides, V.P.B.; Macedo, M.C.M.; Valle, C.B.D.; Difante, G.D.S.; Barbosa, R.A.; Cacere, E.R. Valor nutritivo da forragem e produção animal em pastagens de Brachiaria brizantha. Pesqui. Agropecu. Bras. 2009, 44, 98–106. [Google Scholar] [CrossRef]
  36. Euclides, V.P.B.; Montagner, D.B.; Barbosa, R.A.; Valle, C.B.D.; Nantes, N.N. Animal performance and sward characteristics of two cultivars of Brachiaria brizantha (BRS Paiaguás and BRS Piatã). Rev. Bras. Zootec. 2016, 45, 85–92. [Google Scholar] [CrossRef]
  37. Euclides, V.B.P.; Carpejani, G.C.; Montagner, D.B.; Nascimento, D., Jr.; Barbosa, R.A.; Difante, G.S. Maintaining post-grazing sward height of Panicum maximum (cv. Mombaça) at 50 cm led to higher animal performance compared with post-grazing height of 30 cm. Grass Forage Sci. 2017, 73, 174–182. [Google Scholar] [CrossRef]
  38. Costa, R.R.G.F.; Costa, K.A.P.; Souza, W.F.; Epifanio, P.S.; Santos, C.B.; Silva, J.T.; Oliveira, S.S. Production and Quality of Silages Pearl Millet and Paiaguas Palisadegrass in Monocropping and Intercropping in Different Forage Systems. Biosci. J. 2018, 34, 957–967. [Google Scholar] [CrossRef]
  39. Euclides, V.P.B.; Flores, R.S.; Medeiros, R.N.; Oliveira, M.P. Diferimento de Pastos de Braquiária Cultivares Basilisk e Marandu, na Região do Cerrado. Pesq. Agropec. Bras. 2007, 42, 273–280. [Google Scholar] [CrossRef]
  40. Rodrigues, C.S.; Nascimento, D., Jr.; Detmann, E.; Silva, S.C.; Sousa, B.M.D.L.; Silveira, M.C.T.D. Functional Clusters of Tropical Forage Grasses. Rev. Bras. Zootec. 2012, 41, 1385–1393. [Google Scholar] [CrossRef]
  41. Silva, J.A.G.; Habermann, E.; Costa, K.A.P.; Costa, K.A.P.; Silva, L.M.; Severiano, E.C.; Costa, A.C.; Silva, F.G.; Oliveira, T.C.; Dario, B.M.M.; et al. Integration crop-livestock system increases the sustainability of soybean cultivation through improved soil health and plant physiology. Agric. Ecosyst. Environ. 2024, 359, 108770. [Google Scholar] [CrossRef]
  42. Vilela, D.; Andrade, R.G.; Leite, J.L.B.; Hott, M.C.; Magalhães, W.C.P., Jr. Produção de leite no Cerrado: Conjuntura e análises. In Geotecnologias: Aplicações na Cadeia Produtiva do Leite, 1st ed.; Hott, M.C., Andrade, R.G., Magalhães, W.C.P., Jr., Eds.; Atena Editora: Ponta Grossa, Brazil, 2022; Volume 1, pp. 77–81. [Google Scholar]
  43. Barbero, R.P.; Ribeiro, A.C.C.; Moura, A.M.; Longhini, V.Z.; Mattos, T.F.A.; Barbero, M.M.D. Production potential of beef cattle in tropical pastures: A review. Ciênc. Anim. Bras. 2021, 22, e69609. [Google Scholar] [CrossRef]
Figure 1. Rainfall and temperature (max, min, and mean) from January to December 2019 and from January to September 2020.
Agronomy 13 03046 g001
Figure 2. Conceptual model of soybean grain production associated with grass serving as cover crop during the off-season.
Agronomy 13 03046 g002
Figure 3. Biplot of principal components (PC) for Quenia guinea grass, Congo grass, and Xaraes palisade grass overseeding in soybean. Forage mass (FM); non-fiber carbohydrates (NFC); starch; ether extract (EE); total digestible nutrients (TDN); crude protein (CP); digestible protein (DP); soluble protein (SP); acid detergent fiber (ADF); ash; lignin (Lig); neutral detergent fiber (NDF); neutral detergent fiber digestibility after 30 h (dNDF30), 48 h (dNDF48), 120 h (dNDF120), and 240 h (dNDF240) of incubation; days, milk and carcass production potential.
Agronomy 13 03046 g003
Figure 4. Production per hectare of crude protein and total digestible nutrients in Quenia guinea grass, Xaraes palisade grass, and Congo grass overseeding with soybeans. R2: coefficient of determination. p-Value: probability of significant effect. (A) crude protein (CP). (B) total digestible nutrients (TDN).
Agronomy 13 03046 g004
Figure 5. Production per hectare of milk production potential, and carcass production in Quenia guinea grass, Xaraes palisade grass, and Congo grass overseeding with soybeans. R2: coefficient of determination. p-Value: probability of significant effect. (A) milk. (B) carcass.
Agronomy 13 03046 g005
Table 1. Chemical composition of soil.
Soil Layers (cm)
Item0–1010–2020–40
Potential acidity (pH in CaCl2)5.074.545.57
Potential acidity (cmolc dm−1)2.773.172.63
Aluminum (cmolc dm−3)0.000.060.03
Cation Exchange Capacity (cmolc dm−1)5.514.493.59
Calcium (cmolc dm−1)1.970.870.63
Magnesium (cmolc dm−3)0.590.330.26
* Phosphorus (mg dm−3)3.671.672.22
Potassium (mg dm−3)75.546.928.4
Base Saturation (%)49.829.326.8
* Mehlich I.
Table 2. The list of characteristics related to the chemical composition of hay produced in integrated systems.
ItemAbbreviation
Dry matter (% NM)DM
Crude protein (% DM)CP
Soluble protein (% CP)SP
Digestible protein (% DM)DP
Ash (% DM)MM
Neutral detergent fiber (% DM)NDF
Neutral detergent fiber digestibility after 48 h (% DM)dNDF30
Neutral detergent fiber digestibility after 30 h (% DM)dNDF48
Neutral detergent fiber digestibility after 120 h (% DM)dNDF120
Neutral detergent fiber digestibility after 240 h (% DM)NDF24
Acid detergent fiber (% DM)ADF
Non-fiber carbohydrates (% DM)NFC
Starch (% DM)NA
Lignin (% DM)NA
Ether extract (% DM)EE
Total digestible nutrientsTDN
NM: natural matter. NA: not applicable.
Table 3. Equations to estimate forage mass (FM), ash (MM), crude protein (CP), soluble protein (SP), and digestible protein (DP) for Quenia guinea grass, Congo grass, and Xaraes palisade grass overseeding in soybean.
p-Value
ItemGrassEquationR2LQ
FM (kg ha−1)Quenia guinea grassFM = −1761.87 + 89.05 × days − 0.333 × days20.791<0.001<0.001
Congo grassFM = −593.30 + 59.92 × days − 0.194 × days20.696<0.0010.007
Xaraes palisade grassFM = −1042.00 + 59.77 × days − 0.163 × days20.759<0.0010.023
MM (% DM)Quenia guinea grassMM = 9.95 − 0.045 × days + 0.0002 × days20.969<0.001<0.001
Congo grassMM = 10.30 − 0.107 × days + 0.0004 × days20.813<0.001<0.001
Xaraes palisade grassMM = 9.97 − 0.092 × days + 0.0003 × days20.916<0.001<0.001
CP (% DM)Quenia guinea grassCP = 29.37 − 0.280 × days + 0.0008 × days20.936<0.001<0.001
Congo grassCP = 29.50 − 0.319 × days + 0.0010 × days20.948<0.001<0.001
Xaraes palisade grassCP = 29.49 − 0.290 × days + 0.0008 × days20.977<0.001<0.001
SP (% CP)Quenia guinea grassSP = 47.28 − 0.461 × days + 0.002 × days20.831<0.001<0.001
Congo grassSP = 59.64 − 0.618 × days + 0.002 × days20.853<0.0010.009
Xaraes palisade grassSP = 60.89 − 0.678 × days + 0.002 × days20.917<0.001<0.001
DP (% DM)Quenia guinea grassDP = 28.91 − 0.278 × days + 0.0008 × days20.932<0.001<0.001
Congo grassDP = 29.07 − 0.314 × days + 0.0010 × days20.945<0.001<0.001
Xaraes palisade grassDP = 29.20 − 0.288 × days + 0.0008 × days20.917<0.001<0.001
DM: dry matter. R2: coefficient of determination. p-Value: probability of significant effect. L: linear effect. Q: quadratic effect.
Table 4. Equations to estimate Total Digestible Nutrients (TDN), starch, non-fiber carbohydrates (NFC), neutral detergent fiber (NDF), acid detergent fiber (ADF), and lignin for Quenia guinea grass, Congo grass, and Xaraes palisade grass overseeding in soybean.
p-Value
ItemGrassEquationR2LQ
TDN (% DM)Quenia guinea grassTDN = 69.18 − 0.140 × days + 0.0004 × days20.947<0.0010.001
Congo grassTDN = 71.21 − 0.139 × days + 0.0004 × days20.871<0.0010.001
Xaraes palisade grassTDN = 72.30 − 0.180 × days + 0.0005 × days20.916<0.001<0.001
Starch (% DM)Quenia guinea grassStarch = 1.94-0.3520.901
Congo grassStarch = −0.035 + 0.049 × days − 0.0002 × days20.798<0.0010.001
Xaraes palisade grassStarch = −0.202 + 0.042 × days − 0.0002 × days20.882<0.001<0.001
NFC (% DM)Quenia guinea grassNFC = 1.50-0.2050.877
Congo grassNFC = 14.23 + 0.183 × days − 0.0006 × days20.725<0.0010.001
Xaraes palisade grassNFC = 18.87 + 0.044 × days0.6360.0050.154
NDF (% DM)Quenia guinea grassNDF = 45.12 + 0.256 × days − 0.0008 × days2 0.832<0.001<0.001
Congo grassNDF = 43.80 + 0.253 × days − 0.0009 × days20.733<0.001<0.001
Xaraes palisade grassNDF = 41.83 + 0.296 × days − 0.0010 × days20.798<0.001<0.001
ADF (% DM)Quenia guinea grassADF = 29.53 + 0.106 × days − 0.0004 × days20.7460.0020.034
Congo grassADF = 26.25 + 0.119 × days − 0.0004 × days20.6570.0040.039
Xaraes palisade grassADF = 26.89 + 0.116 × days − 0.0004 × days20.591<0.0010.006
Lignin (% DM)Quenia guinea grassLignin = 3.02 + 0.071 × days − 0.0009 × days20.846<0.0010.008
Congo grassLignin = 2.12 + 0.045 × days − 0.0003 × days20.847<0.001<0.001
Xaraes palisade grassLignin = 2.91 + 0.030 × days − 0.0002 × days20.853<0.001<0.001
DM: dry matter. R2: coefficient of determination. p-Value: probability of significant effect. L: linear effect. Q: quadratic effect.
Table 5. Equations to estimate the digestibility of neutral detergent fiber after 30 h of incubation (dNDF30), digestibility of neutral detergent fiber after 48 h of incubation (dNDF48), digestibility of neutral detergent fiber after 120 h of incubation (dNDF120), and digestibility of neutral detergent fiber after 240 h of incubation (dNDF240) for Quenia guinea grass, Congo grass, and Xaraes palisade grass overseeding in soybean.
p-Value
ItemGrassEquationR2LQ
dNDF30
(% DM)
Quenia guinea grassdNDF30 = 62.78 − 0.122 × days0.967<0.0010.551
Congo grassdNDF30 = 69.58 − 0.273 × days + 0.0008 × days20.953<0.001<0.001
Xaraes palisade grassdNDF30 = 70.86 − 0.313 × days + 0.0009 × days20.973<0.001<0.001
dNDF48
(% DM)
Quenia guinea grassdNDF48 = 83.00 − 0.155 × days0.884<0.0010.448
Congo grassdNDF48 = 95.66 − 0.429 × days + 0.0013 × days20.912<0.001<0.001
Xaraes palisade grassdNDF48 = 92.06 − 0.382 × days + 0.0011 × days20.937<0.001<0.001
dNDF120
(% DM)
Quenia guinea grassdNDF120 = 95.65 − 0.363 × days + 0.0011 × days20.840<0.001<0.001
Congo grassdNDF120 = 88.84 − 0.149 × days0.701<0.0010.075
Xaraes palisade grassdNDF120 = 97.05 − 0.396 × days + 0.0011 × days20.864<0.001<0.001
dNDF240
(% DM)
Quenia guinea grassdNDF240 = 96.21 − 0.244 × days + 0.0007 × days20.945<0.001<0.001
Congo grassdNDF240 = 102.90 − 0.395 × days + 0.0013 × days20.925<0.001<0.001
Xaraes palisade grassdNDF240 = 96.93 − 0.289 × days + 0.0008 × days20.972<0.001<0.001
DM: dry matter. R2: coefficient of determination. p-Value: probability of significant effect. L: linear effect. Q: quadratic effect.
Table 6. Equations to estimate the milk and carcass production potential of Quenia guinea grass, Congo grass, and Xaraes palisade grass overseeding in soybeans.
p-Value
ItemGrassEquationR2LQ
Milk (kg t FM−1)Quenia guinea grassMilk = 1646.00 − 5.31 × days + 0.015 × days20.931<0.001<0.001
Congo grassMilk = 1593.73 − 1.63 × days0.741<0.0010.092
Xaraes palisade grassMilk = 1727.11 − 5.25 × days + 0.015 × days20.838<0.0010.001
Carcass (kg t FM−1)Quenia guinea grassCarcass = 61.29 -0.6400.256
Congo grassCarcass = 76.09 + 0.644 × days − 0.003 × days20.373<0.001<0.001
Xaraes palisade grass Carcass = 101.10 -0.7240.496
R2: coefficient of determination. p-Value: probability of significant effect. L: linear effect. Q: quadratic effect.
Disclaimer/Publisher’s Note: The statements, opinions and data contained in all publications are solely those of the individual author(s) and contributor(s) and not of MDPI and/or the editor(s). MDPI and/or the editor(s) disclaim responsibility for any injury to people or property resulting from any ideas, methods, instructions or products referred to in the content.

