Article

The Grapevine Transcription Factor VvTGA8 Enhances Resistance to White Rot via the Salicylic Acid Signaling Pathway in Tomato

1
Shandong Academy of Grape, Shandong Academy of Agricultural Sciences, No. 1-27, Shanda South Road, Jinan 250100, China
2
School of Landscape and Ecological Engineering, Hebei University of Engineering, No. 19, Taiji Road, Handan 056038, China
*
Authors to whom correspondence should be addressed.
Agronomy 2023, 13(12), 3054; https://doi.org/10.3390/agronomy13123054
Submission received: 9 November 2023 / Revised: 30 November 2023 / Accepted: 10 December 2023 / Published: 13 December 2023
(This article belongs to the Topic Interaction between Plants and Fungi and Oomycetes)

Abstract

:
White rot, caused by Coniella vitis, is a devastating disease in grapevine (Vitis vinifera) that seriously affects yield and quality. Breeding resistant grapevine varieties is a highly economical, environmentally friendly, and effective strategy to protect against the disease; however, this strategy requires a comprehensive understanding of the genes and pathways related to resistance. In this study, we sequenced the transcriptome of V. vinifera L. cv. GF, a highly resistant variety, at six time points after C. vitis inoculation. A transcriptome analysis showed that the salicylic acid (SA) signaling pathway was activated in response to C. vitis. Transient silencing of the VvTGA8 gene in the cv. GF greatly increased susceptibility to C. vitis. Subcellular localization studies showed that the VvTGA8 gene is localized in the nucleus. Heterologous expression of VvTGA8 in Solanum lycopersicum improved resistance to C. vitis and increased levels of the SA signaling pathway marker genes SlPR1 and SlPR2 significantly. To explore the mechanism by which VvTGA8 mediates disease resistance, we silenced SlICS1, a key gene in the SA synthesis pathway, through virus-induced gene silencing to inhibit SA synthesis in a VvTGA8 overexpression line, resulting in significantly weakened resistance to C. vitis and decreased expression levels of SlPR1 and SlPR2. We conclude that VvTGA8 is involved in SA signaling pathway, which activates the expression of pathogenesis-related genes in the nucleus, thereby mediating resistance to C. vitis in grapevine. This study provides an excellent target gene for disease-resistant breeding and gene editing in grapevine.

1. Introduction

White rot is a major fungal disease in grapevine (Vitis vinifera L.) and occurs in all major growing regions of the world [1]. The main pathogens of grape white rot include Coniella diplodiella, Pilidiella castaneicola, and Coniella vitis [2,3,4]. C. vitis is the dominant pathogen causing white rot in Chinese grapevine-producing areas [4]. All aboveground tissues of grapevines, including leaves, ears, tender stems, and berries, can be infected by C. vitis through stomata or wounds [1]. Concentric whorls of spots form after the initial infection and then gradually expand [5]. White rot severely affects the quality and yield of grapevines, resulting in yield losses of greater than 16% each year [6].
Recent achievements have been made in our understanding of grape disease resistance. VqWRKY31, a WRKY family transcription factor in Vitis quinquangularis, promotes stilbene synthesis to mediate resistance to powdery mildew by binding to the promoter regions of the STS9 and STS48 genes [7]. VvNAC72 increases cytotoxicity and reactive oxygen species levels by binding to the promoter region of VvGLYI-4 and inhibiting its expression, thereby mediating resistance to downy mildew [8]. The ERF transcription factor VaERF16, identified in Vitis amurensis, forms a transcriptional complex with VaMYB306 that binds to the promoter region of VaPDF1.2 and mediates resistance to Botrytis cinerea by activating its transcriptional activity [9]. Several other genes that contribute to disease defense responses in grapevine have been reported, including VvDOF3, VriATL156, VpCDPK9, VpCDPK13, and MrRPV1 [10,11,12,13].
However, few studies have focused on the resistance of grapevines to C. vitis, and the mechanism underlying resistance in the species is still unclear. Transcriptome sequencing of the white-rot-resistant variety V. vinifera L. × V. labrusca L. cv. Zhuosexiang and the susceptible variety V. vinifera L. cv. Victoria under C. diplodiella inoculation revealed differences in the expression of genes related to salicylic acid (SA) and jasmonic acid (JA) synthesis and identified four key transcription factors, NPR1, TGA4, Pti6, and MYC2, involved in the response to pathogen inoculation [14]. The VvPR1 gene mediates grapevine resistance to C. vitis, and a cis-acting element on the promoter of VvPR1 recruited transcription factors, such as VvWRKY, VvNPR1, and VvTGA2, to promote VvPR1 expression after SA treatment [6]. Based on simplified sequencing data for 386 grapevine germplasms, eight candidate genes related to white rot resistance were obtained by a genome-wide association analysis, all of which were up-regulated after C. vitis inoculation [15]. Map-based cloning of the grapevine white rot resistance gene using an interspecific hybrid population revealed a stable QTL on chromosome 3 that explained 17.9% of phenotypic variation [16]. However, further research is needed to understand how grapevines defend against white rot.
SA is an important endogenous hormone in plants that not only participates in multiple processes related to plant growth and development, but also plays a crucial role in plant defense against pathogens [17]. The members of TGACG-binding (TGA) family are important transcription factors in the SA signaling pathway; these transcription factors mediate the expression of pathogenesis-related (PR) genes, thereby triggering the plant immune response [18,19]. In Arabidopsis thaliana, there were ten TGA members, which were divided into five clades based on sequence homology: clade I (TGA1/4), clade II (TGA2/5/6), clade III (TGA3/7), clade IV (TGA9/10), and clade V (TGA8). Initially, clades I, II, and III members mainly participated in plant immunity [20]. For example, in A. thaliana, TGA1 and TGA2 interact with NPR1 to enhance its DNA binding ability, thus activating the expression of defense-related genes [21,22]. In rice, OsTGA1 directly regulates the expression of PR genes and mediates resistance to bacterial blight by interacting with the NPR1 homolog NH1 [23]. The SA signaling pathway induced by pathogens activates the kinase activity of BIN2, which in turn promotes the phosphorylation of TGA3, forming a positive feedback mechanism and contributing to cascade activity related to immune signals and disease resistance in A. thaliana [24]. Nevertheless, a growing number of reports indicate that clades IV and V were also involved in the regulation of defense response [25,26,27]. For example, A. thaliana TGA2, 5, 6, and 8 were found to have a common role in defense responses [27]. However, the mechanisms underlying the function of TGAs in white rot resistance in grapevines remain unclear.
In this study, a grapevine white-rot-resistant variety was evaluated by transcriptome sequencing after C. vitis inoculation. Furthermore, based on a weighted gene co-expression network analysis (WGCNA) and Kyoto Encyclopedia of Genes and Genome (KEGG) functional annotation analysis, we found that the SA signaling pathway plays an important role in grapevine resistance to white rot. We verified the function of the VvTGA8 gene and explored the mechanism by which it mediates grapevine white rot resistance.

2. Materials and Methods

2.1. Grapevine Samples for RNA-seq

Two-year-old V. vinifera L. × V. labrusca L. cv. GuiFeimeigui (GF) and V. vinifera L. cv. Red Globe (RG) were planted in a greenhouse at 25 °C, 80% relative humidity, 16 h of light/8 h of dark, and a luminosity of 260 mmol·m−2·S−1. To harvest C. vitis spores, the GP1 strain was cultured in the dark at 28 °C on PDA medium for 2 days; then, the activated GP1 strain was inoculated into liquid sporulation medium (1.5 g/L ammonium sulfate, 10 g/L grape branch sawdust) for 10 days under shaking cultivation at 28 °C and 180 rpm. Conidia were harvested by centrifugation and diluted to a concentration of 1 × 10⁶ conidia/mL. The concentration was determined using a thoma hemacytometer under stereomicroscope. GF leaves were inoculated with C. vitis and collected 6, 12, 24, 36, 48, and 72 h after inoculation. Three biological replicates were taken from each experiment, and six leaves were taken from each replicate.

2.2. Total RNA Extraction, Library Construction, and Sequencing

Total RNA was extracted from each sample using a CATB-pBIOZOL Kit (Bioflux, Redwood City, CA, USA) according to the operating instructions. Total RNA was analyzed qualitatively and quantitatively using a NanoDrop and Agilent 2100 bioanalyzer (Thermo Fisher Scientific, Waltham, MA, USA). The mRNA was purified using oligo (dT)-attached magnetic beads and used for library construction. The quality-checked libraries were used for DNA nanoball (DNB) preparation and sequencing.

2.3. RNA-seq Data Analysis

Clean reads were generated by removing adapters and low-quality reads. Clean reads were aligned to the reference genome PN40024 12X.v2 using HISAT2. Transcripts were assembled and merged using StringTie according to GFF annotations. Mapped reads were counted using featureCounts and normalized to obtain the fragments per kilobase of transcript per million fragments mapped (FPKM) values for each gene. Then, DESeq2 was used to analyze the differentially expressed genes (DEGs) between the two groups. To identify DEGs, log2 (fold change) ≥ 1 and adjusted p value ≤ 0.05 were used as thresholds. The RNA-seq data have been deposited in the NCBI Short Read Archive database (SRA accession: PRJNA995417)

2.4. Weighted Gene Co-Expression Network and Pathway Enrichment Analysis

The WGCNA method was used to evaluate DEGs using the WGCNA package in R. A soft power threshold of 16, which was selected to build the scale-free network. To minimize the number of clusters, the modified settings were set to minModuleSize = 50 and mergeCutHeight = 0.23. Gene function was annotated against the KEGG database to obtain KO numbers. An enrichment analysis was performed and the results were visualized using the ClusterProfiler package in R. The enriched pathways were identified with p ≤ 0.05.

2.5. Virus-Induced Gene Silencing Analysis

A specific fragment of the VvTGAs (including VvTGA7, VvTGA8, and VvTGA9) and SlICS1 was amplified from V. vinifera cv. GF and Solanum lycopersicum cv. Micro-Tom cDNA and integrated into the pTRV2 vector to construct pTRV2:VvTGAs and pTRV2:SlICS1, which were introduced into Agrobacterium tumefaciens strain GV3101. The A. tumefaciens strain carrying the pTRV2:VvTGAs/pTRV2:SlICS1 plasmid was mixed with the A. tumefaciens strain carrying the pTRV1 vector at a 1:1 ratio, and the mixture was infiltrated into grapevine leaves [28]. The control vector pTRV2:PDS was used to assess the effectiveness of virus-induced gene silencing (VIGS), and effective silencing of the PDS gene resulted in albinism in the leaves. After 4 weeks, white leaves were observed on the PDS-silenced plants. RT-qPCR was used to determine the efficiency of silencing.

2.6. Subcellular Localization Analysis of VvTGA8

To evaluate the subcellular localization of VvTGA8, the full-length coding region and coding region without the NLS sequence were inserted into pBGFP4 vectors fused to GFP sequences under the control of the cauliflower mosaic virus (CaMV) 35S promoter, using a vector carrying GFP alone as a control. The fusion vector was transfected into A. tumefaciens strain GV3101, which was injected into tobacco (Nicotiana benthamiana) leaf epidermal cells for transient expression [29]. Two days after injection, subcellular localization of the fusion proteins was observed using laser scanning confocal microscopy at an excitation wavelength of 488 nm and an emission wavelength of 510 nm. Cell nuclei were stained using 4′,6-diamidino-2-phenylindole (DAPI).

2.7. Overexpression of VvTGA8 in Tomato Plants

The full-length sequence of VvTGA8 amplified from the cDNA of GF was inserted into the transformation vector pBI121 to construct pBI121:VvTGA8, and the target gene was driven by the CaMV-35S promoter and terminated by the Nos terminator. The recombinant vector was transformed into A. tumefaciens LBA4404, and the cotyledon explants of S. lycopersicum cv. Micro-Tom were transformed by the A. tumefaciens-mediated method [30]. The T0 generation of transformed plants was obtained on MS medium (kanamycin 50 mg·L−1), and the micro-plants were transplanted into flower pots. The harvested transgenic seeds were sown on MS medium (kanamycin 50 mg·L−1), and the surviving T1 generation micro-plants were transplanted into flower pots for cultivation. All potted tomatoes were grown under standard greenhouse conditions.

2.8. Salicylic Acid Measurements

Tomato leaves were inoculated with conidia of C. vitis GP1 (1 × 10⁶ conidia/mL) and leaf tissue was taken after 24 h. Samples were quickly frozen in liquid nitrogen, ground, and extracted with methanol, and the extracts were dried with a vacuum centrifugal concentrator. After two extractions, the upper extract was concentrated and dried, and the methanol was dissolved and filtered through a filter membrane [31]. The SA content was determined by HPLC (Waters, Milford, MA, USA) [32]. The flow rate of the mobile phase was 0.8 mL·min−1, the column temperature was 40 °C, the UV detection wavelength was 230 nm, and the sample size was 10 µL. SA standards were used to establish standard curves. All experiments were carried out with three replicates.

2.9. Gene Expression Analysis

To analyze the expression patterns of VvTGAs in V. vinifera, grapevine leaves were inoculated with the conidia suspension of C. vitis GP1 (1 × 10⁶ conidia/mL), and samples were collected at six time points (6, 12, 24, 36, 48, and 72 h), with each sample containing six leaves. To analyze the expression of genes related to the SA signaling pathway, grapevine and tomato leaves were inoculated with the conidia suspension of C. vitis, and samples were collected 24 h later, with six leaves per sample. Sample RNA was extracted and analyzed by RT-qPCR using a QuantStudio 6 Flex real-time PCR system (Applied Biosystems, Foster City, CA, USA). The amplification conditions were as follows: initial denaturation at 95 °C for 10 min, followed by 40 cycles of denaturation at 95 °C for 15 s, annealing at 60 °C for 30 s, and extension at 72 °C for 20 s. The relative expression levels of the genes were assessed using the 2−ΔΔCT method using V. vinifera Actin-7 (XM_002282480) and S. lycopersicum GAPDH (U97257) as the internal reference genes [33]. All primers used for RT-qPCR are listed in Supplementary Table S1.

3. Results

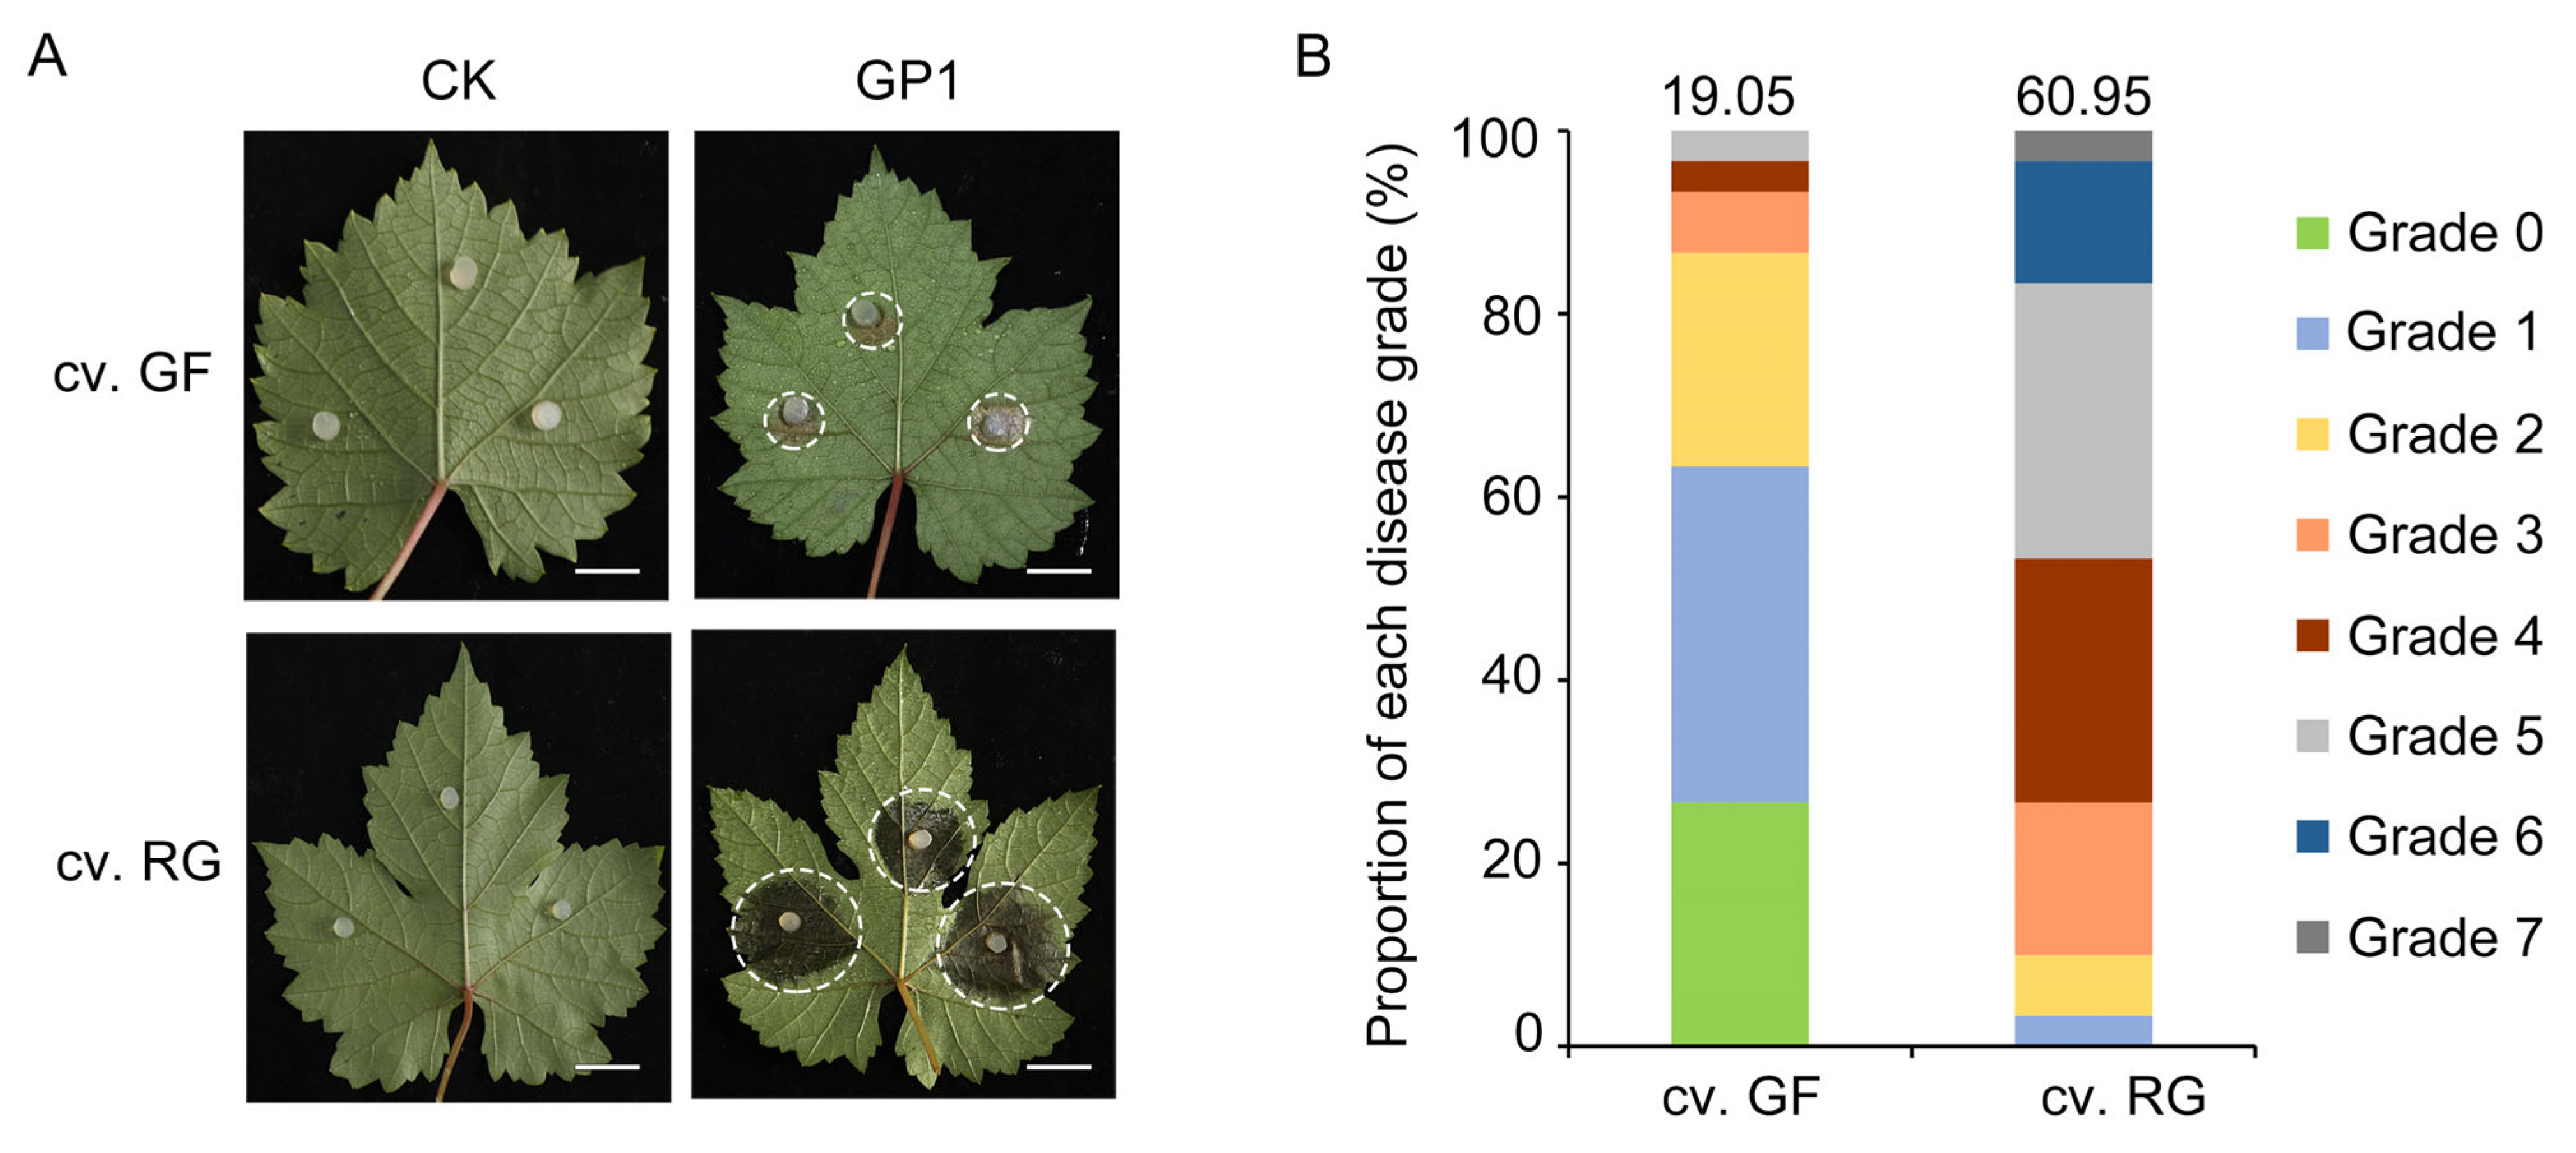
3.1. Differences among Grapevine Varieties in Resistance to C. vitis

After 3 days of inoculation with C. vitis GP1, mature leaves of the disease-resistant grapevine variety GF and the susceptible variety RG were observed. C. vitis exhibited strong infectivity toward grapevine leaves (Figure 1A), and the lesion area in RG was significantly larger than that in the resistant cultivar GF. At 3 days post-inoculation, the relative disease index (RDI) was 60.95 for RG and 19.05 for GF (i.e., the RDI of RG was 3.20-fold higher than that of GF), indicating that the grapevine variety GF possesses stronger resistance against C. vitis (Figure 1B).

3.2. Differential Gene Expression Analysis
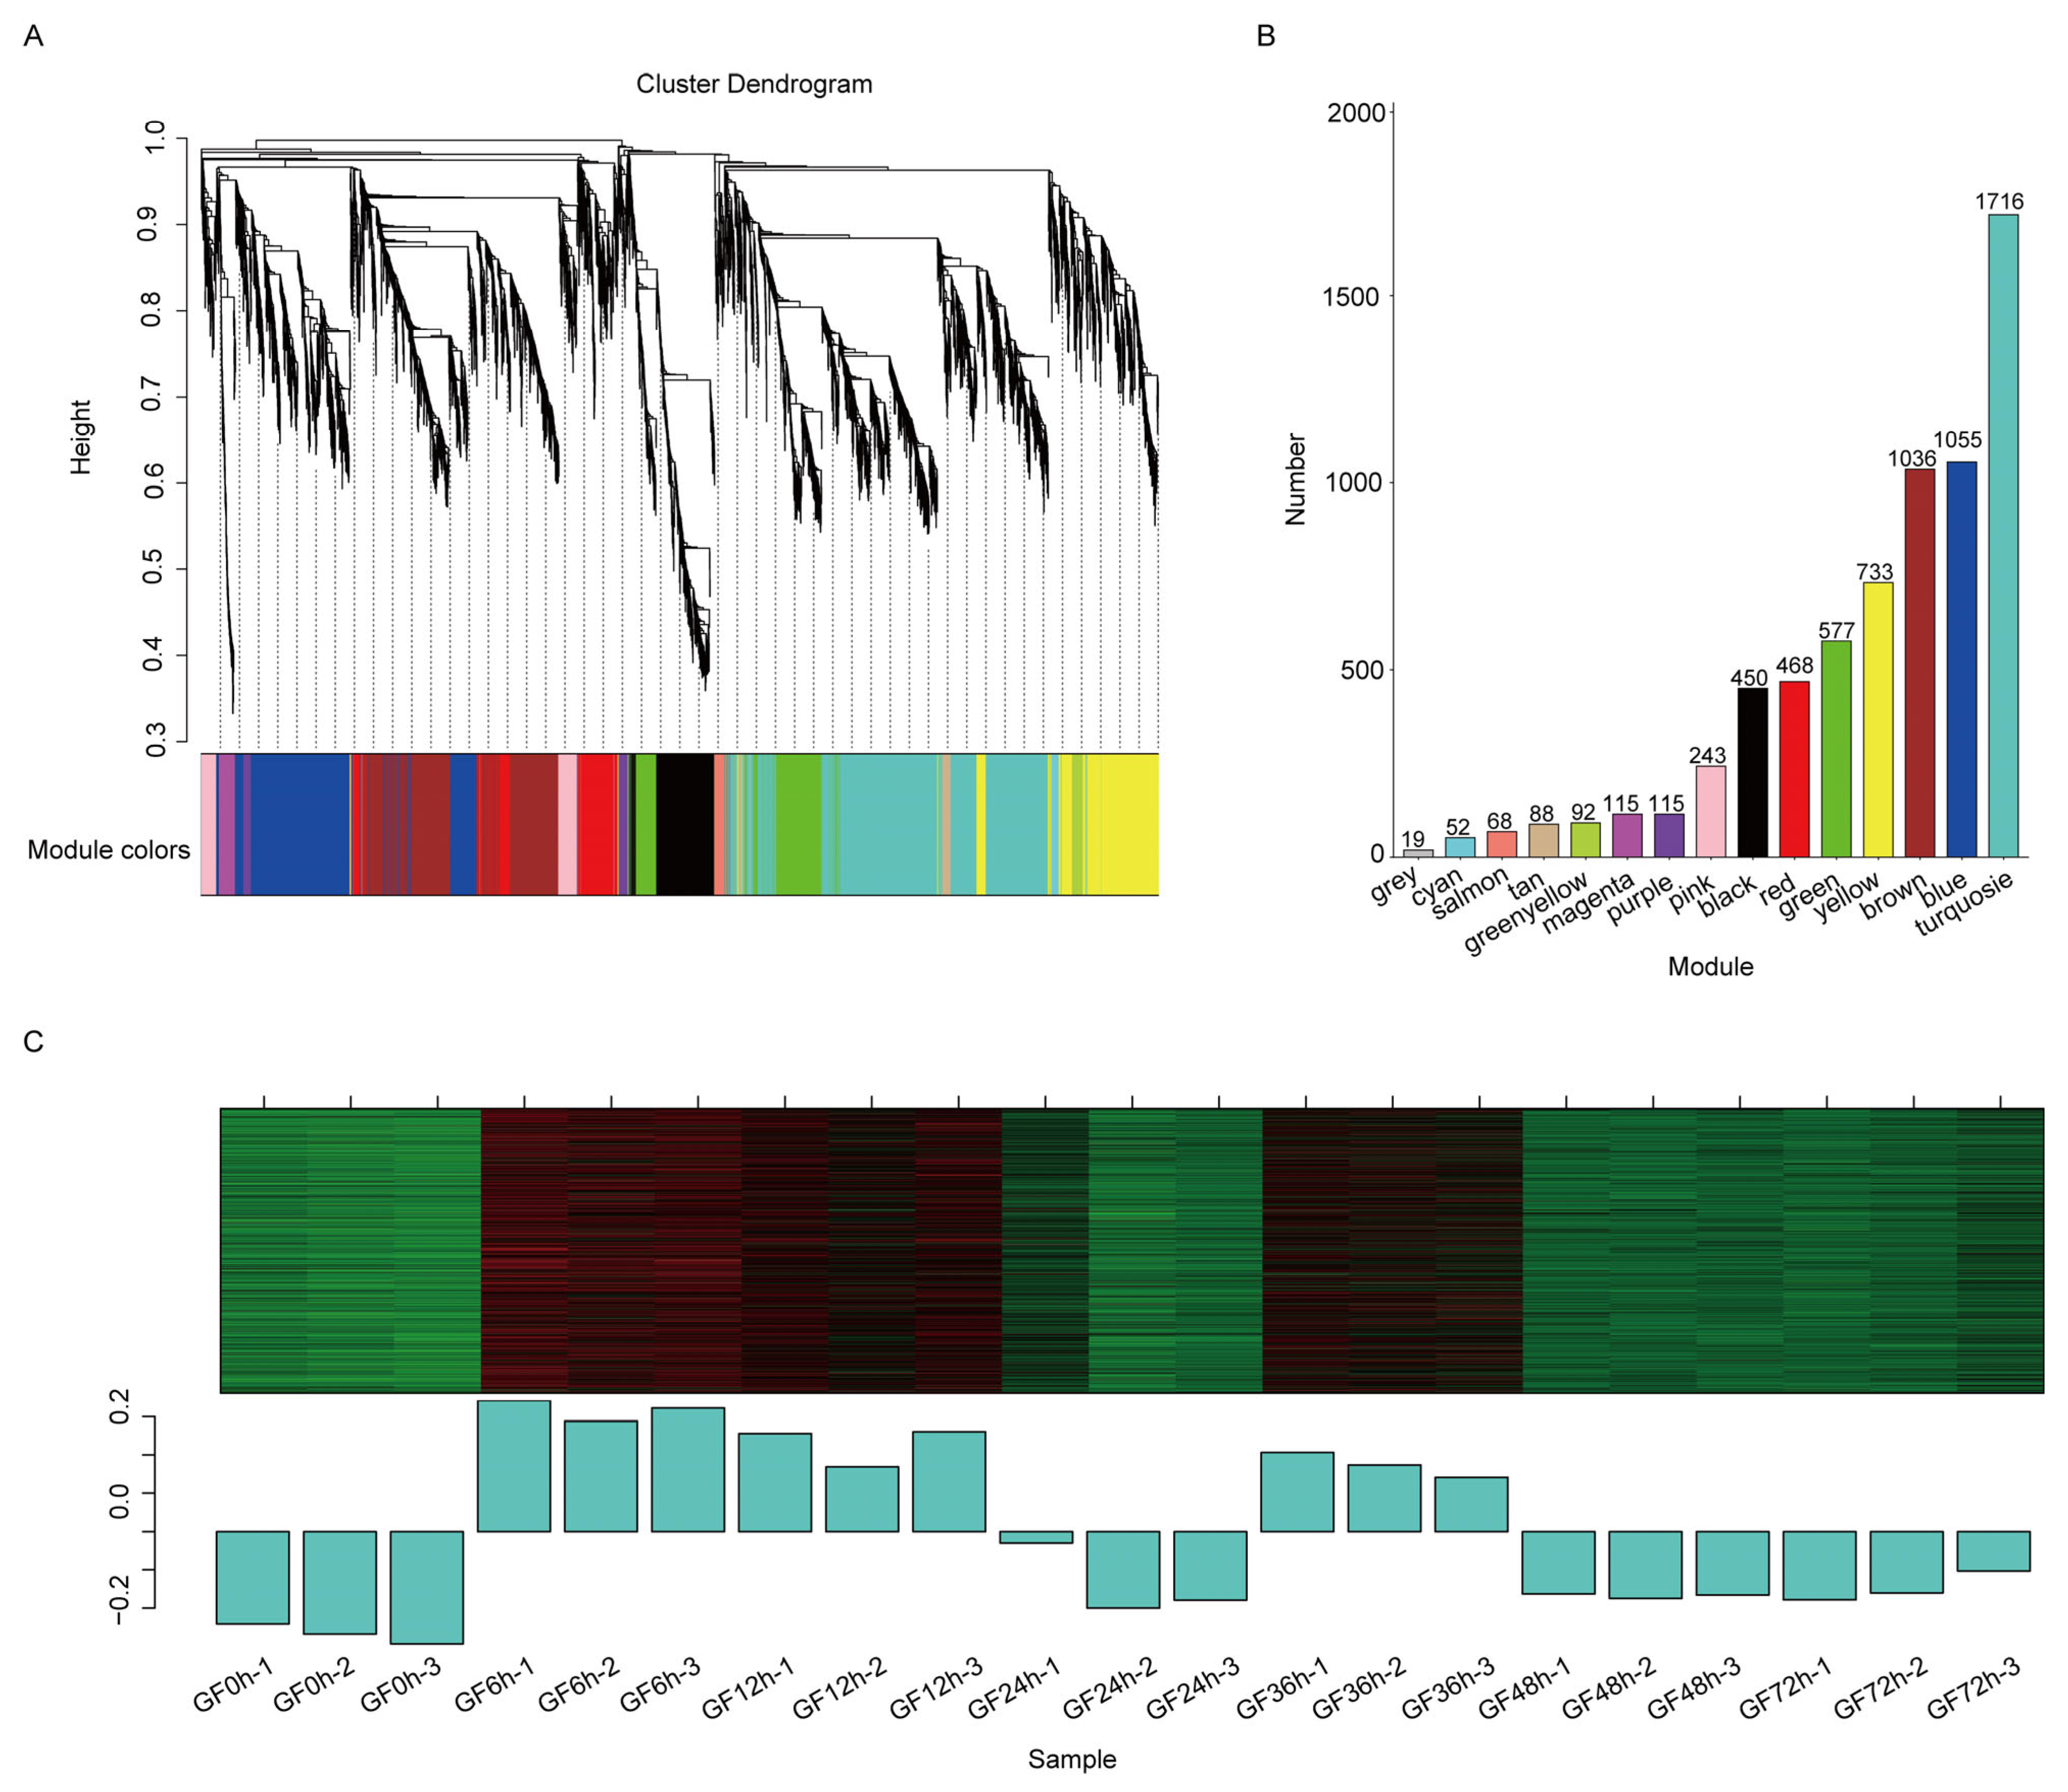
RNA samples from grape leaves were sequenced by using the DNBSEQ sequencing platform. For each sample, an average of 10.54 Gb of data were obtained, with a Q30 percentage above 92.36%. The clean reads for each sample had unique alignment rates from 81.48% to 89.76%. To assess the repeatability among transcriptome samples, a principal component analysis (PCA) was conducted based on gene expression levels. The samples from each group clustered together, indicating good repeatability. PC1 separated the control group (GF0h) from the other groups, suggesting that substantial transcriptional changes occurred in grapevine leaves after infection by C. vitis. PC2 and PC3 separated different groups, indicating that variation in transcript levels following infection was time-dependent (Figure 2A). A total of 6827 DEGs were found. In particular, 4415 (1982 downregulated and 2433 upregulated), 3805 (1558 downregulated and 2247 upregulated), 2046 (505 downregulated and 1541 upregulated), 4307 (1892 downregulated and 2415 upregulated), 1636 (494 downregulated and 1142 upregulated), and 2206 (411 downregulated and 1795 upregulated) DEGs were found at 6, 12, 24, 36, 48, and 72 h after inoculation, respectively, compared with the control (Figure 2B). The numbers of DEGs at 6, 12, and 36 h were significantly higher than those at other time points; accordingly, we speculated that these three time points were important for the grapevine response to C. vitis.

3.3. WGCNA of DEGs

To reveal gene sets involved in resistance to C. vitis, WGCNA was employed. All DEGs were clustered based on correlations in expression levels, resulting in 15 modules, shown in different colors in Figure 3A. The number of genes varied substantially among modules. The turquoise module included the largest number of genes (i.e., 1716), while the cyan module had the fewest genes (i.e., 52). Additionally, 19 genes could not be assigned to any module and are shown in gray (Figure 3B). The genes in the turquoise module actively responded to C. vitis inoculation; during the early stages after inoculation (i.e., at 6 and 12 h), these genes were significantly upregulated. At 24 h after inoculation, the genes were not as highly upregulated. However, 36 h after inoculation, the DEGs showed significant upregulation again, followed by downregulation at 48 and 72 h time after inoculation (Figure 3C). These results indicated that genes within the turquoise module showed fluctuations in expression.

3.4. Analyses of KEGG Pathway Enrichment and VvTGAs

To understand the biological processes involved in the grapevine response to C. vitis, the major biochemical metabolic and signal transduction pathways associated with DEGs in the turquoise module were analyzed using the KEGG database. The DEGs were significantly enriched in several KEGG modules, such as plant–pathogen interaction, plant hormone signal transduction, MAPK signaling pathway–plant, and biosynthesis of secondary metabolites, indicating a potential association between the turquoise module and the grapevine response to C. vitis (Figure 4A). In the SA signaling pathway, NPR1, TGA, and PR1 were the key genes, and their homologs in grapevine showed expression changes after C. vitis inoculation (Figure 4B). In particular, the TGA transcription factors (VvTGAs) were significantly up-regulated, suggesting that VvTGAs are candidate genes involved in the response to C. vitis inoculation in grapevine. Ten VvTGAs were identified in the grapevine genome, consistent with TGAs in the A. thaliana genome (Table S2). A phylogenetic analysis based on neighbor-joining showed that VvTGAs did not correspond to AtTGAs (Figure 4C). A gene expression analysis of VvTGAs showed that three genes, Vitvi18g00346 (named VvTGA7), Vitvi01g00260 (named VvTGA8), and Vitvi08g01710 (named VvTGA9), were significantly upregulated after C. vitis inoculation, and these genes may be related to SA-mediated functional resistance in grapevine (Figure 4D).

3.5. Role of VvTGA8 in Grapevine Resistance to C. vitis

To elucidate the role of the candidate genes VvTGA7, VvTGA8, and VvTGA9 in resistance to C. vitis, a VIGS experiment was conducted based on grapevine cv. GF, which exhibits resistance to white rot (Figure S1). Tobacco rattle virus was used as the vector for VIGS. After candidate genes were silenced for 4 weeks, the silencing efficiencies of VvTGA7, VvTGA8, and VvTGA9 reached 51.71%, 45.14%, and 42.22%, respectively (Figure 5B). The VvTGA-silenced plants were inoculated with C. vitis, and phenotypes were observed 3 days after inoculation. The VvTGA8-silenced plants exhibited significantly lower resistance to C. vitis compared with the control plants (TRV:00) (Figure 5A). The average lesion diameter was 2.04-fold higher in TRV:VvTGA8 plants than in the control plants, indicating weakened resistance to C. vitis (Figure 5C).

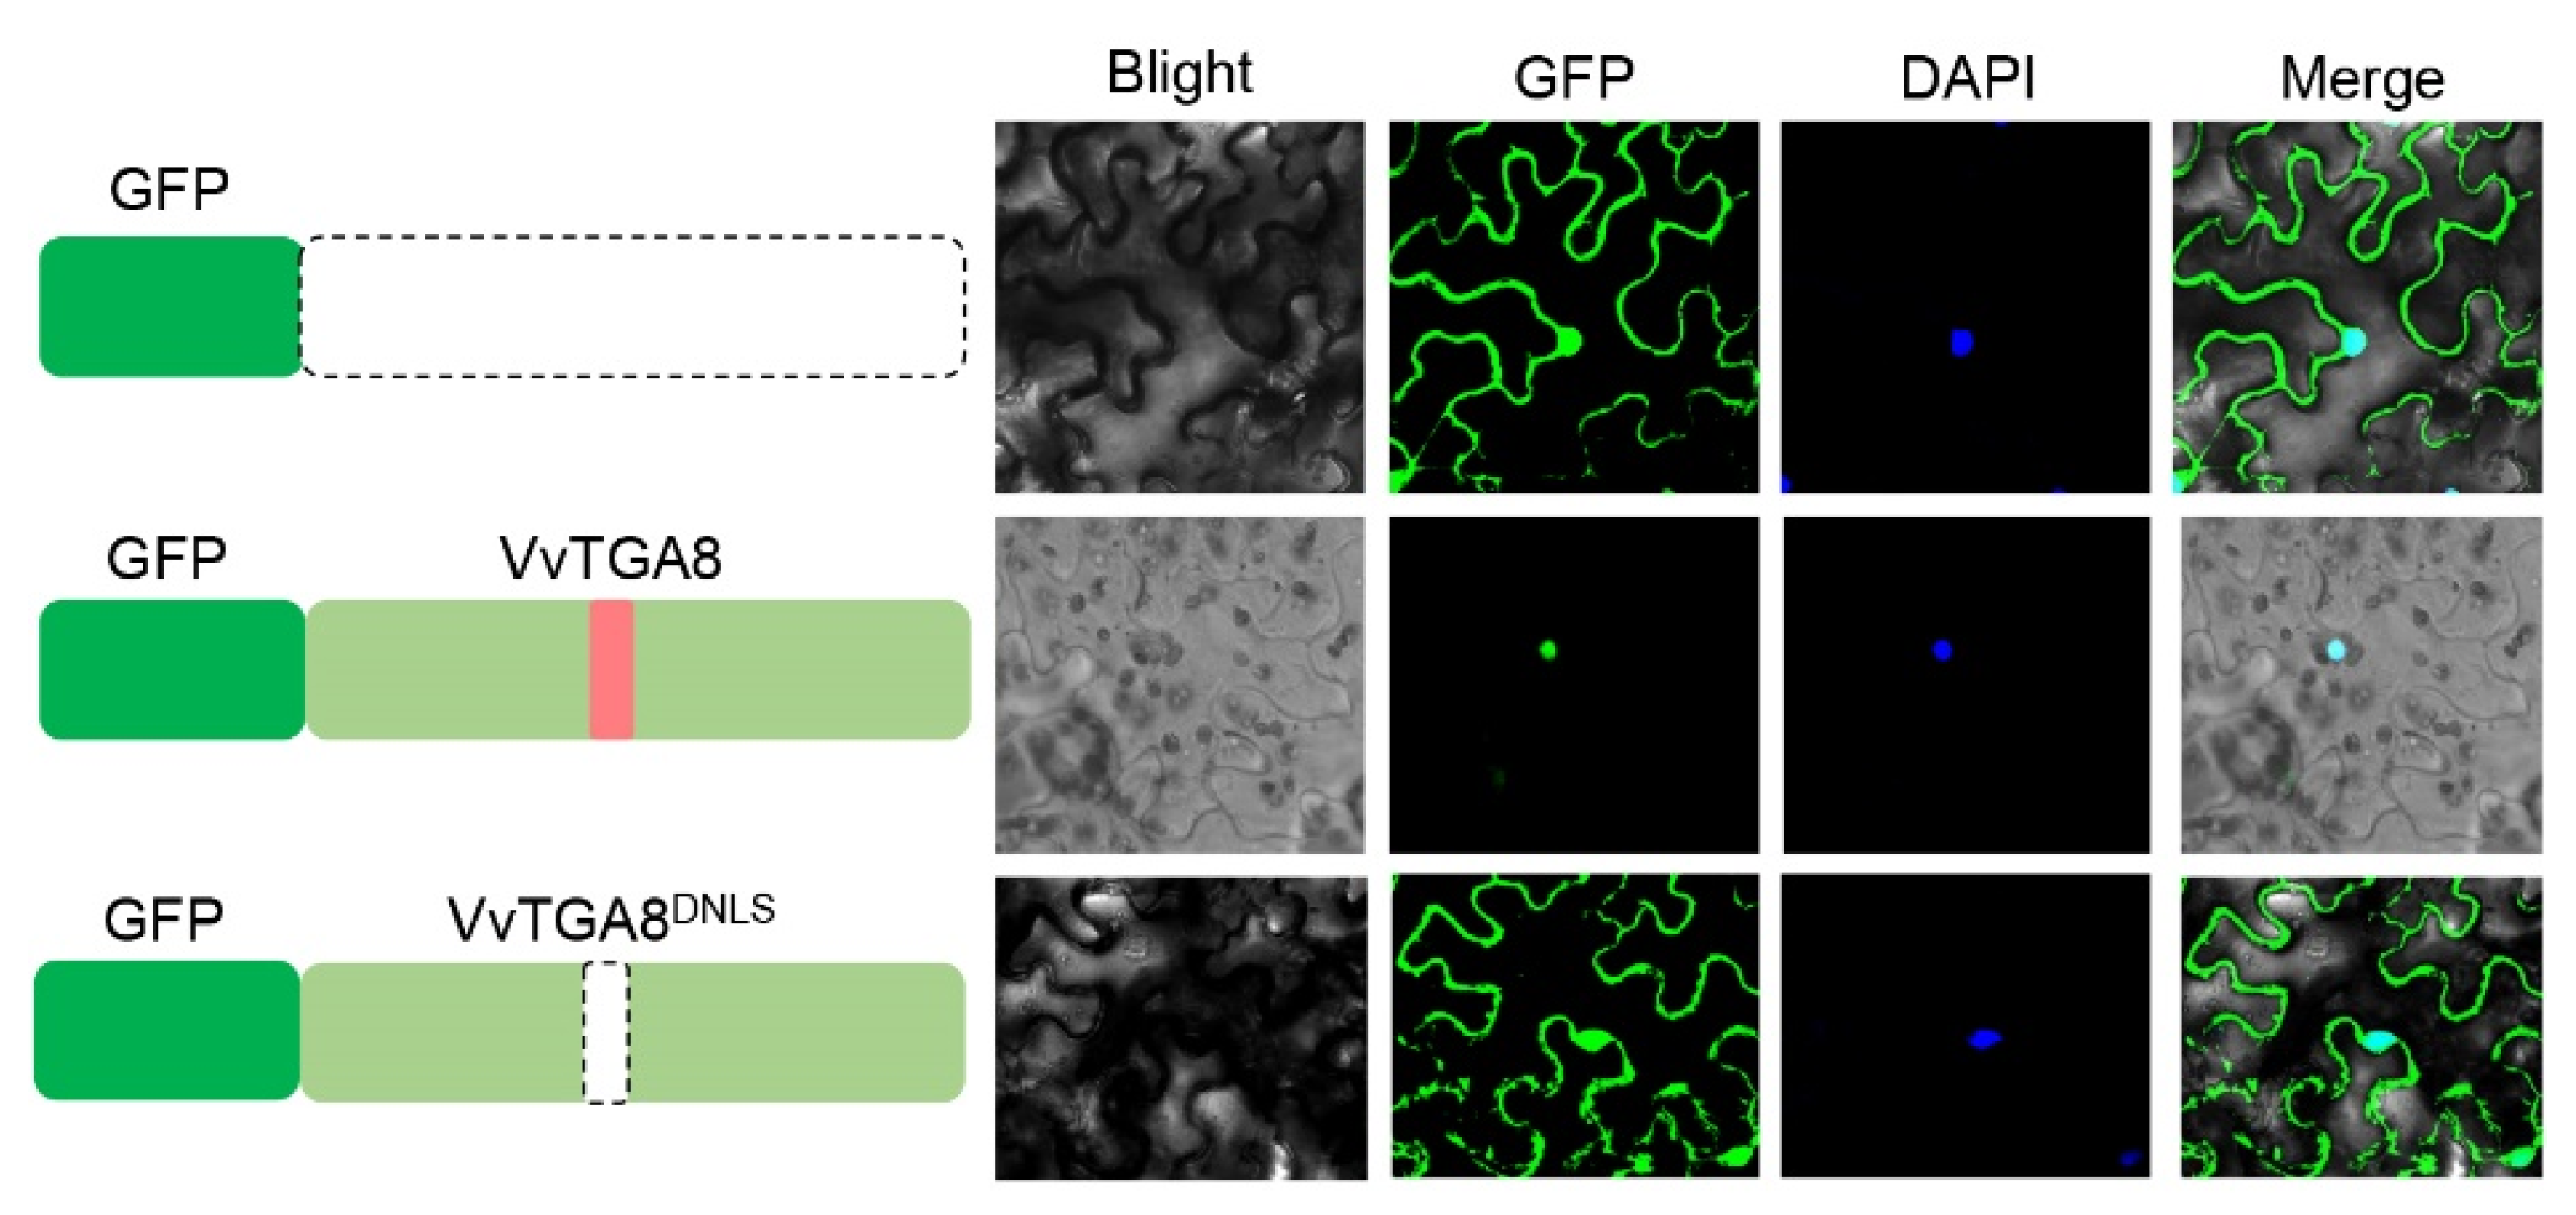
3.6. VvTGA8 Localized in Cell Nuclei

The candidate gene VvTGA8 was analyzed using the cNLS Mapper website (https://nls-mapper.iab.keio.ac.jp/cgi-bin/NLS_Mapper_form.cgi) (accessed on 15 September 2023), and the prediction results indicated the presence of one nuclear localization signal (NLS) at amino acid positions 180–211 (Table S3). To investigate the subcellular localization of VvTGA8, both the full-length VvTGA8 sequence and a mutant sequence lacking the NLS were cloned and inserted into the pBGFP4 vector. These constructs were then transiently transformed into tobacco leaf cells. After incubation for 2 days, the transformed cells were observed using laser scanning confocal microscopy. The control cells transformed with pBGFP4 exhibited fluorescence throughout the entire cell. However, cells transformed with pBGFP4-VvTGA8 showed fluorescence only in the nucleus. When the NLS was deleted in the pBGFP4-VvTGA8DNLS construct, fluorescence was observed throughout the entire cell again. This experiment suggests that VvTGA8 is localized in the cell nucleus, and the predicted NLS plays a crucial role in mediating its nuclear localization (Figure 6).

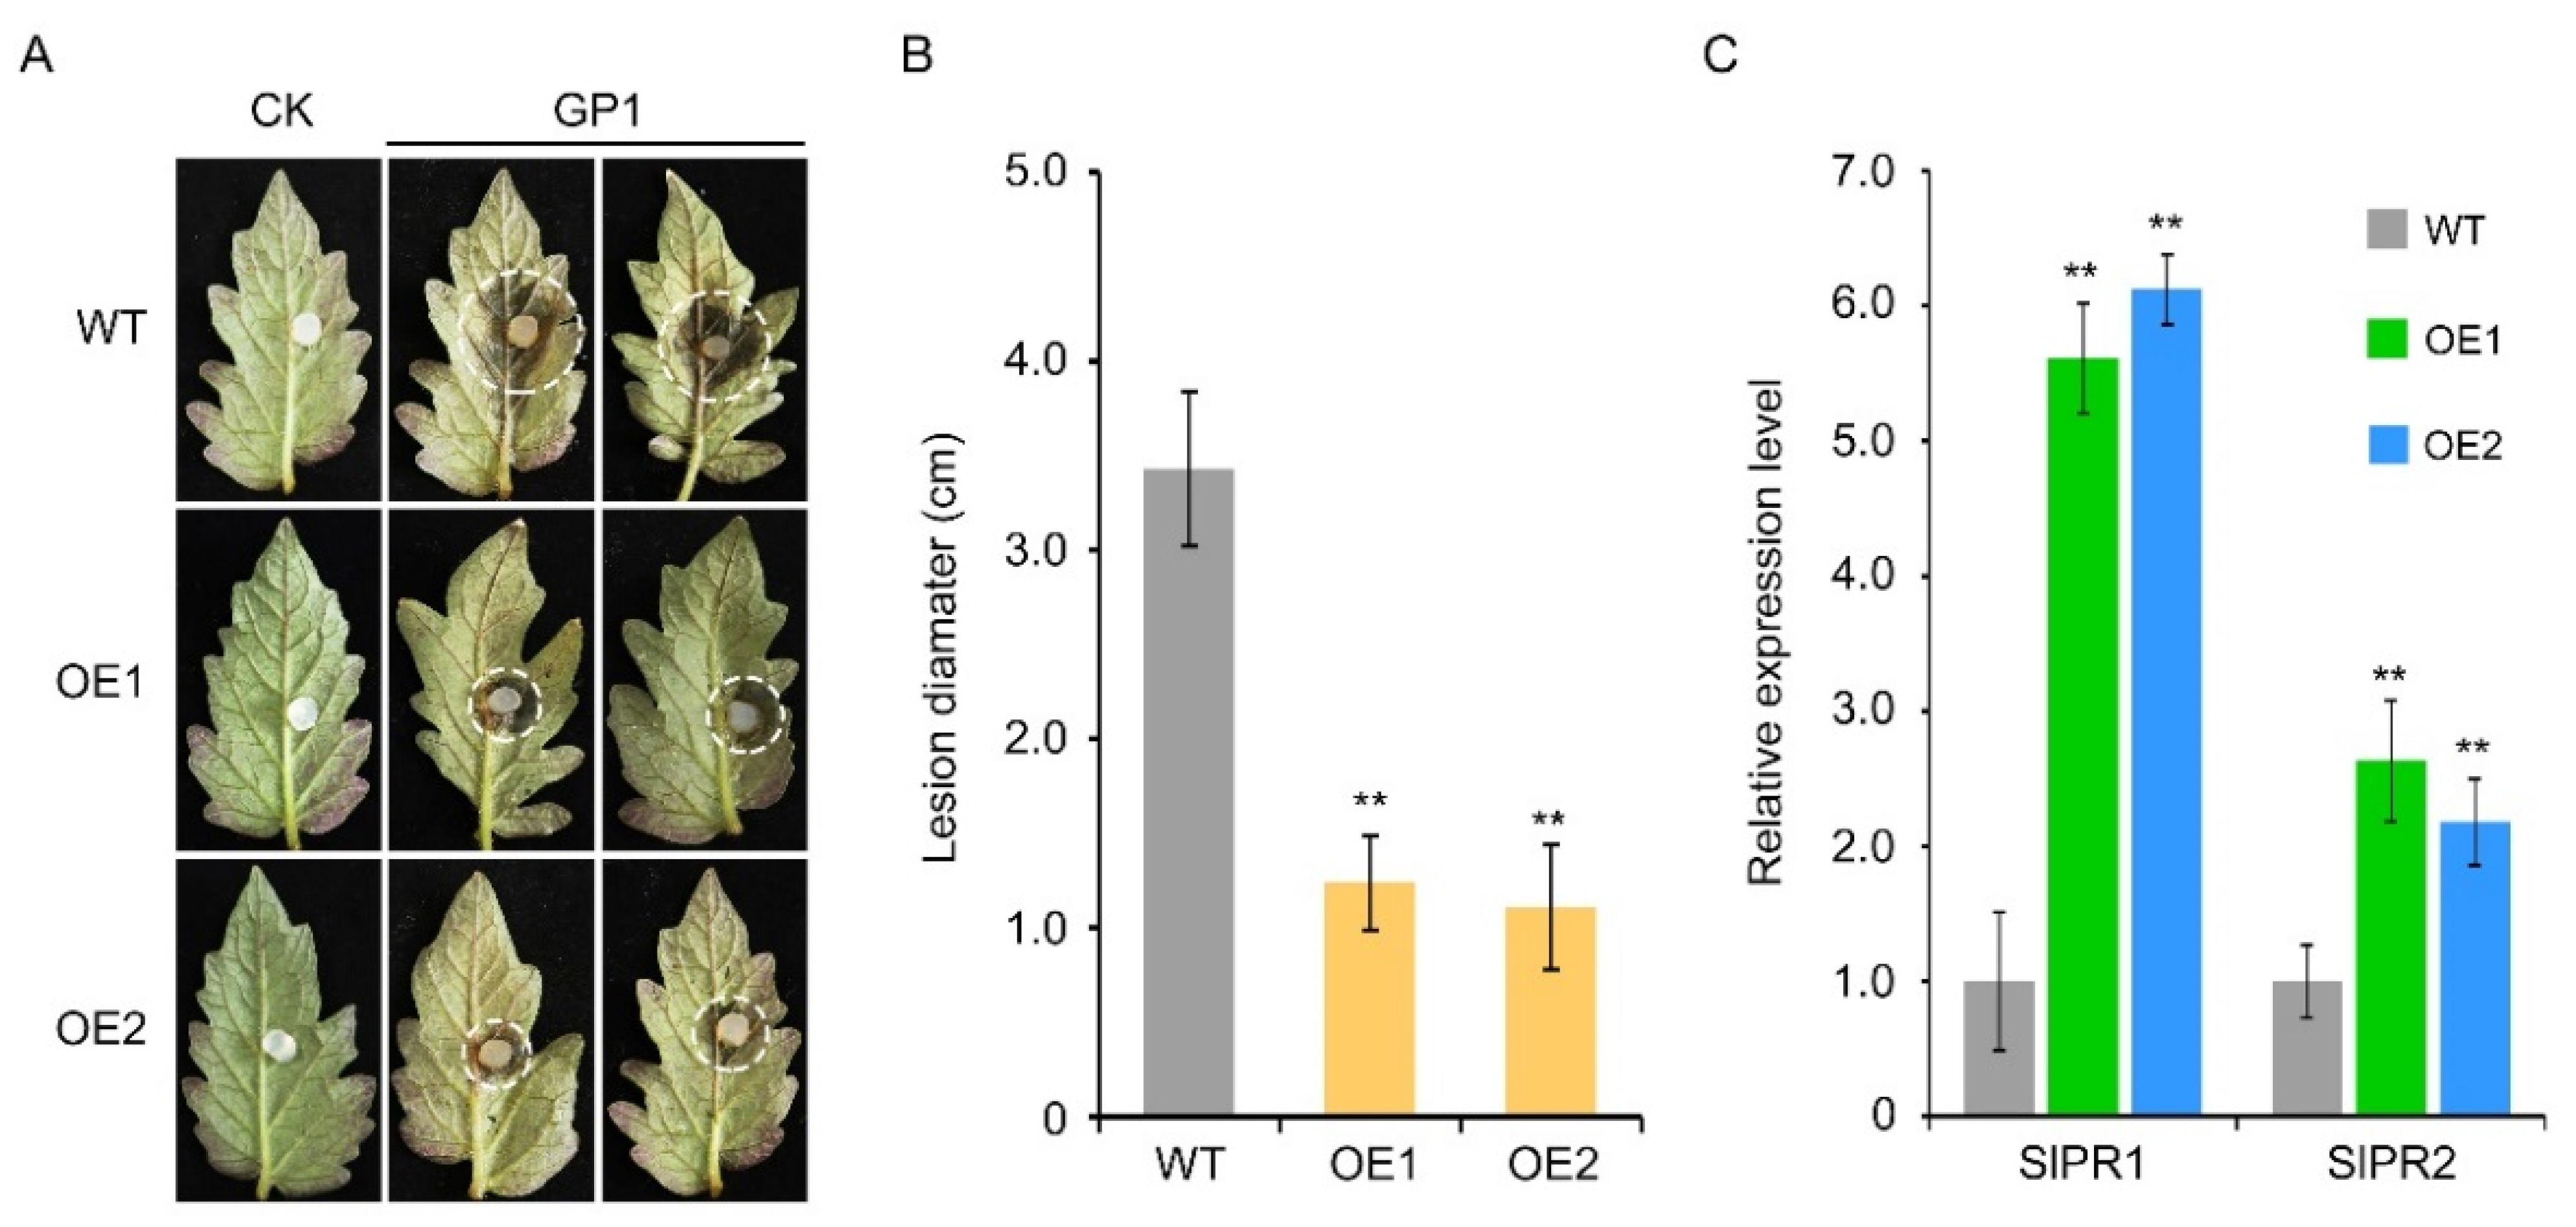
3.7. Heterologous Expression of VvTGA8 in Tomato Improves Resistance to C. vitis

To further verify the function of VvTGA8 in resistance, we obtained transgenic S. lycopersicum lines overexpressing VvTGA8 (Figure S2). We selected two VvTGA8 gene overexpression lines (OE1 and OE2) for inoculation with C. vitis and observed the resistance phenotypes after 3 days (Figure 7A). The lesion diameters in OE1 and OE2 were only 36.15% and 32.36% of those in the wild type, respectively, indicating that tomato resistance to C. vitis improved significantly (Figure 7B). We evaluated the expression patterns of the SA signaling pathway marker genes SlPR1 and SlPR2 after inoculation with C. vitis. SlPR1 expression levels were 5.61- and 6.12-fold higher in the OE1 and OE2 lines, respectively, than in the wild type, and SlPR2 levels were 2.63- and 2.18-fold higher, respectively (Figure 7C).

3.8. VvTGA8 Confers Protective Effects via the Salicylic Acid Signaling Pathway

To inhibit SA synthesis, we silenced SlICS1, a key gene in the SA synthesis pathway, in the VvTGA8-overexpressing line (OEVvTGA8) based on the VIGS strategy (Figure S3). The expression level of SlICS1 in SlICS1-silenced plants was only 46.51% of that in the control plants (TRV:00), indicating that SlICS1 was effectively silenced (Figure 8A,B). The OEVvTGA8 line, control plants, and SlICS1-silenced plants contained 3.13 ng·mg−1, 2.94 ng·mg−1, and 1.53 ng·mg−1 SA, respectively, after inoculation with C. vitis, indicating that SA synthesis in plants was significantly reduced after SlICS1 silencing (Figure 8C). At 3 days after inoculation with C. vitis, the resistance phenotypes of the OEVvTGA8 line, control plants, and SlICS1-silenced plants are shown in Figure 8D. The lesion diameter in SlICS1-silenced plants increased significantly to 2.83 cm, which was 1.73-fold higher than in the control plants, suggesting that the resistance level was significantly reduced (Figure 8E). Furthermore, SlPR1 and SlPR2 expression levels in SlICS1-silenced plants were 26.82% and 66.28% of those in control plants after inoculation with C. vitis, respectively (Figure 8F).

4. Discussion

Grapevine white rot, caused by C. vitis, seriously affects the yield and quality of grapevines [35]. Planting white-rot-resistant grapevine varieties is recognized as the most economical, safe, and effective strategy for preventing and controlling the disease; however, a lack of genetic resources and insufficient understanding of mechanisms underlying disease susceptibility limit the selection and breeding of white rot-resistant grapevine varieties [36]. In this study, 3 days after inoculation with C. vitis, the RDI of GF was only 19.05, while the RDI of RG was as high as 60.95, indicating that GF has strong resistance to C. vitis (Figure 1). To better explore the genetic resources of grapevine white rot resistance and the underlying mechanisms, transcriptome sequencing was used to evaluate GF under C. vitis inoculation. PCA and DEG identification showed that there were obvious changes in transcript levels after C. vitis inoculation, and the changes in transcript levels were time-specific (Figure 2). Through WGCNA, we found that the genes in the turquoise module showed increases in expression in response to C. vitis inoculation (Figure 3). A KEGG enrichment analysis revealed that the turquoise module genes were enriched in four main pathways, plant–pathogen interaction, plant hormone signal transduction, MAPK signaling pathway–plant, and biosynthesis of secondary metabolites, providing insight into the processes involved in the grapevine response to C. vitis (Figure 4). The heterologous expression of VvTGA8 in tomato and silencing of SlICS1 revealed that VvTGA8 is involved in the SA signaling pathway, and we speculate that cv. GF may mediate resistance to C. vitis via the SA signaling pathway.
TGA genes are important transcription factors in the SA signaling pathway. They have been studied in Arabidopsis, rice, and peach, but their role in C. vitis resistance in grapevine has not been evaluated [22,23,37]. The VvTGA8 gene was upregulated significantly in the grapevine-resistant variety (GF), but not in the susceptible variety (RG) after inoculation with C. vitis, and this may explain the difference in resistance between grapevine varieties (Figure 4D). VvTGA8-silenced GF showed significantly reduced resistance to C. vitis (Figure 5). VvTGA8 overexpression in S. lycopersicum significantly improved the resistance to C. vitis and activated the expression of SlPR1 and SlPR2, further supporting the role of VvTGA8 in resistance to C. vitis (Figure 7). A study has shown that the overexpression of MaTGA8 from banana significantly enhances resistance to Fusarium oxysporum TR4 in A. thaliana [38]. In addition, TGA8 promotes root growth by promoting stem cell regeneration, meristem activity, and cell elongation in A. thaliana [27]. This study provides the first evidence for the role of VvTGA8 in resistance in grapevine.
SA signaling pathways are the main signaling pathways for plant-mediated disease resistance [39]. In this study, the SA signaling pathway was significantly activated in GF following C. vitis inoculation (Figure 4B). Silencing SlICS1, a key SA synthesis gene, in the OEVvTGA8 line decreased the expression of SlPR1 and SlPR2 after inoculation with C. vitis, resulting in weakened resistance; these findings indicate that VvTGA8 is involved in the SA signaling pathway and thereby mediates resistance to C. vitis via PRs. These findings were consistent with previous results showing that the SA content is higher in the resistant genotype V. davidii than in the susceptible genotype V. vinifera after C. vitis inoculation, and the up-regulated expression of VvPR1 could be induced by SA treatment [6]. In addition, plant resistance to biotrophic or hemi-biotrophic pathogens is mainly mediated through the SA signaling pathway [17], suggesting that C. vitis, which causes white rot in grapevine, is a hemi-biotrophic pathogen.
There are ten VvTGA genes in the grapevine genome, equal to the number in A. thaliana, where TGA1 has been extensively studied. In A. thaliana, NPR1 is also a key factor in plant-mediated resistance and systemic acquired immunity in response to biotrophic or hemi-biotrophic pathogens [40]. TGA1 binds to the promoter region of PR1 after interactions with NPR1 and mediates resistance to Pseudomonas syringae by PR1 in A. thaliana [41]. However, it has also been reported that there may be NPR1-independent binding between TGA1 and the PR1 promoter in A. thaliana [42]. In S. lycopersicum, the expression of the SA signaling pathway marker gene PR1 was reduced in TGA1.a-silenced lines, which increased susceptibility to P. syringae [43]. In addition, TGA1 and its homologues have been studied in maize, grapevine, peach, and other taxa [8,44,45]. However, whether VvNPR1 is necessary for VvTGA8-mediated resistance and the mechanism by which VvTGA8 specifically regulates PR expression in grapevine still need further exploration. The above research will provide new targets for marker-assisted selection and molecular design breeding, thus promoting the sustainable development of modern agriculture.

5. Conclusions

In conclusion, this study carried out transcriptome sequencing of resistance varieties of grapevine in response to C. vitis inoculation at different time points. Data analysis revealed that the DEGs were enriched for the SA signaling pathway. TGAs are key genes in plant resistance mediated by the SA signaling pathway, among which the VvTGA8 gene is involved in SA and plays a positive role in resistance to C. vitis through increasing PRs expression in grapevine. In this study, a new C. vitis resistance gene was discovered, and its resistance mechanism was initially revealed, which provides new targets for molecular breeding and gene editing for C. vitis resistance in grapevine.

Supplementary Materials

The following supporting information can be downloaded at: https://www.mdpi.com/article/10.3390/agronomy13123054/s1, Figure S1: Expression of PDS gene in wild type (WT), control plants (TRV:00), and PDS-silenced plants as determined by RT-qPCR. WT represent Vitis vinifera cv. GF. Error bars calculated based on three biological replicates using standard deviation. ** indicates significant difference (p < 0.01), according to unpaired Student’s t-tests. Figure S2: Identification of Solanum lycopersicum overexpression lines of VvTGA8 gene. (A) Diagram of the VvTGA8-overexpressing transformation vector pBI121:VvTGA8. (B) PCR products targeting a fragment of VvTGA8 amplified from DNA extracted from VvTGA8-overexpression lines. (C) RT-PCR amplification of VvTGA8 cDNA in the transgenic S. lycopersicum lines. GAPDH is shown as a control. Error bars represent standard errors of three biological replicates, ** indicates statistical significance (p < 0.01), according to unpaired Student’s t-tests. Figure S3: Expression of PDS gene in wild type (WT), control plants (TRV:00), and PDS-silenced plants as determined by RT-qPCR. WT represent VvTGA8-overexpressing (OEVvTGA8) line of S. lycopersicum. Error bars calculated based on three biological replicates using standard deviation; ** indicates significant difference (p < 0.01), according to unpaired Student’s t-tests. Table S1: Information of the PCR primers used in this study. Table S2: TGA genes protein sequence in Arabidopsis thaliana and Vitis vinifera. Table S3: Information of VvTGA8 gene.

Author Contributions

Conceptualization, T.L. and N.L.; methodology, L.Y.; software, X.Y.; validation, X.J.; formal analysis, Y.W.; investigation, Y.W.; resources, X.T.; data curation, X.Y.; writing—original draft preparation, Q.L.; writing—review and editing, T.L.; visualization, T.L.; supervision, Y.W.; project administration, N.L.; funding acquisition, N.L. All authors have read and agreed to the published version of the manuscript.

Funding

This work was funded by the Hebei Natural Science Foundation (C2019402343), Science and Technology Project of Hebei Education Department (QN2020206), Guide Fund of Shandong Academy of Grape (SDAG2021B02, SDAG2021B06, SDAG2021B10), Innovation Project of Shandong Academy of Agricultural Sciences (CXGC2023A41, CXGC023A47, CXGC2023F15), Shandong Province Key Research and Development Plan (2022TZXD001102), A typical case of serving rural revitalization model construction (2022DXAL0226), and Shandong Provincial Natural Science Foundation (ZR2021QC131).

Data Availability Statement

The RNA-seq data presented in this study are openly available in the NCBI Sequence Read Archive (SRA) under project number PRJNA995417.

Conflicts of Interest

The authors declare no conflict of interest.

References

  1. Ji, T.; Languasco, L.; Li, M.; Rossi, V. Effects of temperature and wetness duration on infection by Coniella diplodiella, the fungus causing white rot of grape berries. Plants 2021, 10, 1696. [Google Scholar] [CrossRef] [PubMed]
  2. Li, D.; Wan, Y.Z.; Wang, Y.J.; He, P.C. Relatedness of resistance to anthracnose and to white rot in Chinese wild grapes. Vitis 2008, 47, 213–215. [Google Scholar] [CrossRef]
  3. He, Z.; Cui, C.Y.; Jiang, J.X. First report of white rot of grape caused by Pilidiella castaneicola in China. Plant Dis. 2017, 101, 1673. [Google Scholar] [CrossRef]
  4. Chethana, K.W.T.; Zhou, Y.; Zhang, W.; Liu, M.; Xing, Q.K.; Li, X.H.; Yan, J.Y.; Chethana, K.W.T.; Hyde, K.D. Coniella vitis sp. nov. is the common pathogen of white rot in chinese vineyards. Plant Dis. 2017, 101, 2123–2136. [Google Scholar] [CrossRef]
  5. Yin, X.T.; Li, T.G.; Wei, Y.F.; Liu, Q.B.; Jiang, X.L.; Yuan, L.F. First report of Coniella vitis causing white rot on Virginia creeper (Parthenocissus quinquefolia) in China. Plant Dis. 2023, 9, 27. [Google Scholar] [CrossRef] [PubMed]
  6. Rahman, F.U.; Khan, I.A.; Aslam, A.; Liu, R.T.; Sun, L.; Wu, Y.D.; Aslam, M.M.; Khan, A.U.; Li, P.; Jiang, J.F.; et al. Transcriptome analysis reveals pathogenesis-related gene 1 pathway against salicylic acid treatment in grapevine (Vitis vinifera L.). Front. Genet. 2022, 13, 1033288. [Google Scholar] [CrossRef]
  7. Yin, W.C.; Wang, X.H.; Liu, H.; Wang, Y.; Nocker, S.; Tu, M.X.; Fang, J.H.; Guo, J.Q.; Li, Z.; Wang, X.P. Overexpression of VqWRKY31 enhances powdery mildew resistance in grapevine by promoting salicylic acid signaling and specific metabolite synthesis. Hortic. Res. 2022, 9, 064. [Google Scholar] [CrossRef]
  8. Li, T.M.; Cheng, X.; Wang, X.W.; Li, G.G.; Wang, B.B.; Wang, W.Y.; Zhang, N.; Han, Y.L.; Jiao, B.L.; Wang, Y.J.; et al. Glyoxalase I-4 functions downstream of NAC72 to modulate downy mildew resistance in grapevine. Plant J. 2021, 108, 394–410. [Google Scholar] [CrossRef] [PubMed]
  9. Zhu, Y.X.; Zhang, X.M.; Zhang, Q.H.; Chai, S.Y.; Yin, W.C.; Gao, M.; Li, Z.; Wang, X.P. The transcription factors VaERF16 and VaMYB306 interact to enhance resistance of grapevine to Botrytis cinerea infection. Mol. Plant Pathol. 2022, 23, 1415–1432. [Google Scholar] [CrossRef]
  10. Yu, Y.H.; Bian, L.; Wan, Y.T.; Jiao, Z.L.; Yu, K.K.; Zhang, G.H.; Guo, D.L. Grape (Vitis vinifera) VvDOF3 functions as a transcription activator and enhances powdery mildew resistance. Plant Physiol. Biochem. 2019, 143, 183–189. [Google Scholar] [CrossRef]
  11. Vandelle, E.; Ariani, P.; Regaiolo, A.; Danzi, D.; Lovato, A.; Zadra, C.; Vitulo, N.; Gambino, G.; Polverari, A. The grapevine E3 ubiquitin ligase VriATL156 confers resistance against the downy mildew pathogen Plasmopara viticola. Int. J. Mol. Sci. 2021, 22, 940. [Google Scholar] [CrossRef]
  12. Hu, Y.; Cheng, Y.; Yu, X.N.; Liu, J.; Yang, L.S.; Gao, Y.Y.; Ke, G.H.; Zhou, M.; Mu, B.; Xiao, S.Y.; et al. Overexpression of two CDPKs from wild Chinese grapevine enhances powdery mildew resistance in Vitis vinifera and Arabidopsis. New Phytol. 2021, 230, 2029–2046. [Google Scholar] [CrossRef]
  13. Qu, J.J.; Dry, I.; Liu, L.L.; Guo, Z.X.; Yin, L. Transcriptional profiling reveals multiple defense responses in downy mildew-resistant transgenic grapevine expressing a TIR-NBS-LRR gene located at the MrRUN1/MrRPV1 locus. Hortic. Res. 2021, 8, 161. [Google Scholar] [CrossRef] [PubMed]
  14. Su, K.; Guo, Y.S.; Zhao, Y.H.; Gao, H.Y.; Liu, Z.D.; Li, K.; Ma, L.; Guo, X.W. Candidate genes for grape white rot resistance based on SMRT and Illumina sequencing. BMC Plant Biol. 2019, 19, 501. [Google Scholar] [CrossRef] [PubMed]
  15. Zhang, Y.; Fan, X.C.; Li, Y.F.; Sun, H.S.; Jiang, J.F.; Liu, C.H. Restriction site-associated DNA sequencing reveals the molecular genetic diversity of grapevine and genes related to white rot disease. Sci. Hortic. 2020, 261, 108907. [Google Scholar] [CrossRef]
  16. Li, P.; Tan, X.B.; Liu, R.T.; Rahman, F.U.; Jiang, J.F.; Sun, L.; Fan, X.C.; Liu, J.H.; Liu, C.H.; Zhang, Y. QTL detection and candidate gene analysis of grape white rot resistance by interspecific grape (Vitis vinifera L.× Vitis davidii Foex.) crossing. Hortic. Res. 2023, 10, 063. [Google Scholar] [CrossRef] [PubMed]
  17. Vlot, A.C.; Dempsey, D.A.; Klessig, D.F. Salicylic acid, a multifaceted hormone to combat disease. Annu. Rev. Phytopathol. 2009, 47, 177–206. [Google Scholar] [CrossRef] [PubMed]
  18. Kinkema, M.; Fan, W.H.; Dong, X.N. Nuclear localization of NPR1 is required for activation of PR gene expression. Plant Cell 2000, 12, 2339–2350. [Google Scholar] [CrossRef]
  19. Mou, Z.L.; Fan, W.H.; Dong, X.N. Inducers of plant systemic acquired resistance regulate NPR1 function through redox changes. Cell 2003, 113, 935–944. [Google Scholar] [CrossRef]
  20. Gatz, C. From pioneers to team players: TGA transcription factors provide a molecular link between different stress pathways. Mol. Plant-Microbe Interact. 2013, 26, 151–159. [Google Scholar] [CrossRef]
  21. Després, C.; DeLong, C.; Glaze, S.; Liu, E.W.; Fobert, P.R. The Arabidopsis NPR1/NIM1 protein enhances the DNA binding activity of a subgroup of the TGA family of bZIP transcription factors. Plant Cell 2000, 12, 279–290. [Google Scholar] [CrossRef]
  22. Budimir, J.; Treffon, K.; Nair, A.; Thurow, C.; Gatz, C. Redox-active cysteines in TGACG-BINDING FACTOR 1 (TGA1) do not play a role in salicylic acid or pathogen-induced expression of TGA1-regulated target genes in Arabidopsis thaliana. New Phytol. 2021, 230, 2420–2432. [Google Scholar] [CrossRef]
  23. Moon, S.J.; Park, H.J.; Kim, T.H.; Kang, J.W.; Lee, J.Y.; Cho, J.H.; Lee, J.H.; Park, D.S.; Byun, M.O.; Kim, B.G.; et al. OsTGA2 confers disease resistance to rice against leaf blight by regulating expression levels of disease related genes via interaction with NH1. PLoS ONE 2018, 13, e0206910. [Google Scholar] [CrossRef]
  24. Han, Q.; Tan, W.R.; Zhao, Y.Q.; Yang, F.; Yao, X.H.; Lin, H.H.; Zhang, D.W. Salicylic acid-activated BIN2 phosphorylation of TGA3 promotes Arabidopsis PR gene expression and disease resistance. EMBO J. 2022, 41, e110682. [Google Scholar] [CrossRef] [PubMed]
  25. Noshi, M.; Mori, D.; Tanabe, N.; Maruta, T.; Shigeoka, S. Arabidopsis clade IV TGA transcription factors, TGA10 and TGA9, are involved in ROS-mediated responses to bacterial PAMP Flg22. Plant Sci. 2016, 252, 12–21. [Google Scholar] [CrossRef]
  26. Venturuzzi, A.L.; Rodriguez, M.C.; Conti, G.; Leone, M.; Caro, M.D.P.; Montecchia, J.F.; Zavallo, D.; Asurmendi, S. Negative Modulation of SA signaling components by the capsid protein of tobacco mosaic virus is required for viral long-distance movement. Plant J. 2021, 106, 896–912. [Google Scholar] [CrossRef]
  27. Hu, X.C.; Yang, L.Y.; Ren, M.F.; Liu, L.; Fu, J.; Cui, H.C. TGA factors promote plant root growth by modulating redox homeostasis or response. J. Integr. Plant Biol. 2022, 64, 1543–1559. [Google Scholar] [CrossRef] [PubMed]
  28. Kurth, E.G.; Peremyslov, V.V.; Prokhnevsky, A.I.; Kasschau, K.D.; Miller, M.; Carrington, J.C.; Valerian, V.D. Virus-derived gene expression and RNA interference vector for grapevine. J. Virol. 2012, 86, 6002–6009. [Google Scholar] [CrossRef]
  29. Li, T.G.; Wang, B.L.; Yin, C.M.; Zhang, D.D.; Wang, D.; Song, J.; Zhou, L.; Kong, Z.Q.; Klosterman, S.J.; Li, J.J.; et al. The Gossypium hirsutum TIR-NBS-LRR gene GhDSC1 mediates resistance against Verticillium wilt. Mol. Plant Pathol. 2019, 20, 857–876. [Google Scholar] [CrossRef] [PubMed]
  30. Li, Z.Q.; Jiao, Y.T.; Zhang, C.; Dou, M.R.; Weng, K.; Wang, Y.J.; Xu, Y. VvHDZ28 positively regulate salicylic acid biosynthesis during seed abortion in Thompson seedless. Plant Biotechnol. J. 2021, 19, 1824–1838. [Google Scholar] [CrossRef] [PubMed]
  31. Yu, Y.H.; Jiao, Z.L.; Bian, L.; Wan, Y.T.; Yu, K.K.; Zhang, G.H.; Guo, D.L. Overexpression of Vitis vinifera VvbZIP60 enhances Arabidopsis resistance to powdery mildew via the salicylic acid signaling pathway. Sci. Hortic. 2019, 256, 108640. [Google Scholar] [CrossRef]
  32. Hu, Y.; Gao, Y.R.; Yang, L.S.; Wang, W.; Wang, Y.J.; Wen, Y.Q. The cytological basis of powdery mildew resistance in wild Chinese Vitis species. Plant Physiol. Biochem. 2019, 144, 244–253. [Google Scholar] [CrossRef] [PubMed]
  33. Livak, K.J.; Schmittgen, T.D. Analysis of relative gene expression data using real-time quantitative PCR and the 2−ΔΔCT method. Methods 2001, 25, 402–408. [Google Scholar] [CrossRef] [PubMed]
  34. Zhang, Y.; Fan, X.C.; Sun, H.S.; Jiang, J.F.; Liu, C.H. Identification and evaluation of resistance to white rot in grape resources. J. Fruit Sci. 2017, 34, 1095–1105. [Google Scholar] [CrossRef]
  35. Bucalossi, G.; Fia, G.; Dinnella, C.; Toffoli, A.D.; Canutia, V.; Zanoni, B.; Servili, M.; Ella Pagliarini, E.; Toschi, T.G.; Monteleone, E. Functional and sensory properties of phenolic compounds from unripe grapes in vegetable food prototypes. Food Chem. 2020, 315, 126291. [Google Scholar] [CrossRef] [PubMed]
  36. Li, T.G.; Zhang, D.D.; Zhou, L.; Kong, Z.Q.; Hussaini, A.S.; Wang, D.; Li, J.J.; Short, D.P.G.; Dhar, N.; Steven, J.K.; et al. Genome-wide identification and functional analyses of the CRK gene family in cotton reveals GbCRK18 confers Verticillium wilt resistance in Gossypium barbadense. Front. Plant Sci. 2018, 9, 1266. [Google Scholar] [CrossRef]
  37. Li, C.H.; Wang, K.T.; Huang, Y.X.; Lei, C.Y.; Cao, S.F.; Qiu, L.L.; Xu, F.; Jiang, Y.B.; Zou, Y.Y.; Zheng, Y.H. Activation of the BABA-induced priming defence through redox homeostasis and the modules of TGA1 and MAPKK5 in postharvest peach fruit. Mol. Plant Pathol. 2021, 22, 1624–1640. [Google Scholar] [CrossRef] [PubMed]
  38. Lin, P.; Dong, T.; Chen, W.L.; Zou, N.X.; Chen, Y.L.; Li, Y.Q.; Chen, K.L.; Wang, M.Y.; Liu, J.F. Expression analysis of MaTGA8 transcription factor in banana and its defence functional analysis by overexpression in Arabidopsis. Int. J. Mol. Sci. 2021, 22, 9344. [Google Scholar] [CrossRef]
  39. Xv, X.D.; Chen, Y.; Li, B.Q.; Zhang, Z.Q.; Qin, G.Z.; Chen, T.; Tian, S.P. Molecular mechanisms underlying multi-level defense responses of horticultural crops to fungal pathogens. Hortic. Res. 2022, 9, uhac066. [Google Scholar] [CrossRef]
  40. Henanff, G.L.; Farine, S.; Kieffer-Mazet, F.; Miclot, A.; Heitz, T.; Mestre, P.; Bertsch, C.; Chong, J. Vitis vinifera VvNPR1.1 is the functional ortholog of AtNPR1 and its overexpression in grapevine triggers constitutive activation of PR genes and enhanced resistance to powdery mildew. Planta 2011, 234, 405–417. [Google Scholar] [CrossRef]
  41. Fu, Z.Q.; Yan, S.P.; Saleh, A.; Wang, W.; Ruble, J.; Oka, N.; Mohan, R.; Spoel, S.H.; Tada, Y.; Zheng, N.; et al. NPR3 and NPR4 are receptors for the immune signal salicylic acid in plants. Nature 2012, 486, 228–232. [Google Scholar] [CrossRef]
  42. Johnson, C.; Boden, E.; Arias, J. Salicylic acid and NPR1 induce the recruitment of trans-activating TGA factors to a defense gene promoter in Arabidopsis. Plant Cell 2003, 15, 1846–1858. [Google Scholar] [CrossRef] [PubMed]
  43. Ekengren, S.K.; Liu, Y.; Schiff, M.; Dinesh-Kumar, S.P.; Martin, G.B. Two MAPK cascades, NPR1, and TGA transcription factors play a role in Pto-mediated disease resistance in tomato. Plant J. 2003, 36, 905–917. [Google Scholar] [CrossRef] [PubMed]
  44. Luján-Soto, E.; Aguirre de la Cruz, P.I.; Juárez-González, V.T.; Reyes, J.L.; Sanchez, M.d.l.P.; Dinkova, T.D. Transcriptional regulation of zma-MIR528a by action of nitrate and auxin in maize. Int. J. Mol. Sci. 2022, 23, 15718. [Google Scholar] [CrossRef] [PubMed]
  45. Wang, K.T.; Li, C.H.; Lei, C.Y.; Jiang, Y.B.; Qiu, L.L.; Zou, X.Y.; Zheng, Y.H. β-aminobutyric acid induces priming defence against Botrytis cinerea in grapefruit by reducing intercellular redox status that modifies posttranslation of VvNPR1 and its interaction with VvTGA1. Plant Physiol. Biochem. 2020, 156, 552–565. [Google Scholar] [CrossRef]
Figure 1. Resistance assessment of grapevine defense against C. vitis. (A) Phenotypes of the disease-resistant variety GF and the susceptible variety RG after inoculation with C. vitis GP1. The white dashed circle was used to mark the boundaries of the diseased area on the grapevine leaves. Bar = 1 cm. (B) Disease progression in the disease-resistant variety GF and the susceptible variety RG after inoculation with C. vitis GP1. Plants were classified into grades 0–7 according to the lesion area as a percentage of the leaf surface area as follows: Grade 0, no disease; Grade 1, 0.1–5.0%; Grade 2, 5.1–15.0%; Grade 3, 15.1–30.0%; Grade 4, 30.1–45.0%; Grade 5, 45.1–65.0%; Grade 6, 65.1–85.0%; Grade 7, 85.1–100.0% [34]. For each cultivar, the disease grades of 45 leaves were counted. The disease grade was converted into the relative disease index (RDI), calculated as follows: RDI = G r a d e   o f   d i s e a s e   ×   N u m b e r   o f   l e a v e s T o t a l   n u m b e r   o f   l e a v e s   ×   H i g h e s t   g r a d e × 100.
Agronomy 13 03054 g001
Figure 2. Principal component analysis (PCA) and differential gene expression analysis. (A) PCA plot of all samples. The percentages indicate the proportion of variance explained by each principal component. Each group consisted of three samples, and samples within the same group are represented by the same color. (B) Bar chart summarizing the DEGs at different time points post-inoculation, with GF0h as the control group. Red: Total number of differentially expressed genes; green: downregulated genes; blue: upregulated genes.
Agronomy 13 03054 g002
Figure 3. Weighted gene co-expression network analysis (WGCNA) of differentially expressed genes (DEGs). (A) Module hierarchical clustering. Each color in the figure represents a module. (B) Bar plot showing the number of genes within each module. (C) Expression patterns of genes in the turquoise module. The upper panel represents the clustering heatmap of genes within the module, where red indicates high expression and green indicates low expression. The lower panel represents the expression patterns of module eigengenes across different samples.
Agronomy 13 03054 g003
Figure 4. KEGG enrichment and VvTGAs expression analyses. (A) KEGG enrichment plot of genes in the turquoise module. (B) DEGs were enriched for the SA signaling pathway. (C) Phylogenetic relationships among TGAs from V. vinifera and A. thaliana. An unrooted phylogenetic tree was constructed based on the TGA amino acid sequences from V. vinifera and A. thaliana using the neighbor-joining method with 1000 bootstrap replicates. (D) Expression patterns of VvTGAs from V. vinifera. RT-qPCR was used to examine the expression levels of VvTGAs at 6, 12, 24, 36, 48, and 72 h after C. vitis inoculation. A red square indicates up-regulation and blue square indicates down-regulation. Color gradients indicate fold-change values (log2 values). The blue dashed line box indicates three candidate VvTGA genes.
Agronomy 13 03054 g004
Figure 5. Validation of the disease resistance function of the candidate genes VvTGA7, VvTGA8, and VvTGA9 using virus-induced gene silencing (VIGS). (A) Resistance phenotypes of the control plants (TRV:00), and VvTGA7-, VvTGA8-, VvTGA9-silenced plants (TRV:VvTGA7, TRV:VvTGA8, and TRV:VvTGA9) 3 days after inoculation with C. vitis. The white dashed circle was used to mark the boundaries of the diseased area on the grapevine leaves. Bar = 1 cm. (B) Expression of VvTGA7, VvTGA8, and VvTGA9 in control plants and gene-silenced plants. The relative expression levels of three genes were evaluated using the 2−ΔΔCT method with actin-7 as the internal reference genes. (C) Statistical analysis of lesion diameter in control plants and gene-silenced plants. Error bars represent standard errors of three biological replicates, ** p < 0.01, according to unpaired Student’s t-tests.
Agronomy 13 03054 g005
Figure 6. Subcellular localization of VvTGA8. The full-length coding sequence of VvTGA8 and the sequence with the deleted nuclear localization signal VvTGA8DNLS were inserted into the pBGFP4 expression vector. The empty vector pBGFP4 was used as a control. The transformed samples were observed using laser scanning confocal microscopy at a magnification of ×200, with excitation and emission wavelengths of 488 nm and 510 nm, respectively. Cell nuclei were stained using 4′,6-diamidino-2-phenylindole (DAPI). The dark green, green, and pink columns represent the GFP, VvTGA8, and nuclear localization signal peptide, respectively. The black dashed circle represents the deletion peptides.
Agronomy 13 03054 g006
Figure 7. Resistance to C. vitis in S. lycopersicum overexpressing VvTGA8. (A) Resistance phenotypes of wild-type (WT) S. lycopersicum and VvTGA8-overexpressing lines (OE1 and OE2) after inoculation with C. vitis for 3 days. The white dashed circle was used to mark the boundaries of the diseased area on the tomato leaves. (B) Lesion diameters were measured in the WT, OE1, and OE2 lines 3 days after inoculation with C. vitis. (C) Relative expression of the SA signaling pathway marker genes SlPR1 and SlPR2 in the WT, OE1, and OE2 lines 24 h after inoculation with C. vitis. The relative expression levels of the SlPR1 and SlPR2 genes were assessed by RT-qPCR. Error bars represent standard errors of three biological replicates; ** p < 0.01, according to unpaired Student’s t-tests.
Agronomy 13 03054 g007
Figure 8. VvTGA8 mediates tomato resistance to C. vitis via the SA signaling pathway. (A) Leaf phenotypes of silenced lines after 4 weeks. (B) Expression of SlICS1 in the OEVvTGA8 line and silenced plants, as determined by RT-qPCR. (C) SA content in the OEVvTGA8 line, control, and SlICS1-silenced plants at 24 h after inoculation with C. vitis. The phenotypes (D) and statistical analysis of lesion diameters (E) in OEVvTGA8 line, control, and SlICS1-silenced plants at 3 days after inoculation with C. vitis. (F) Relative expression of the SA signaling pathway marker genes SlPR1 and SlPR2 in the OEVvTGA8 line, control, and SlICS1-silenced plants at 24 h after inoculation with C. vitis. Relative expression levels of SlPR1 and SlPR2 were assessed by RT-qPCR. Error bars represent standard errors of three biological replicates, ** p < 0.01, according to unpaired Student’s t-tests. The white dashed circle was used to mark the boundaries of the diseased area on the tomato leaves.
Agronomy 13 03054 g008
Disclaimer/Publisher’s Note: The statements, opinions and data contained in all publications are solely those of the individual author(s) and contributor(s) and not of MDPI and/or the editor(s). MDPI and/or the editor(s) disclaim responsibility for any injury to people or property resulting from any ideas, methods, instructions or products referred to in the content.

