Abstract
Subsoiling (SS) is an important technology in conservation tillage, but soil-disturbance characteristics in the SS are rarely described. Research on soil-disturbance characteristics during SS is conducive to the design and optimization of subsoilers, which provides a basis for reducing draft force and energy consumption. This study conducted SS experiments at five different tillage depths in the field with a specific field in situ test-rig facility, and in situ videotaping was made from five positions during SS. The microrelief test, draft force test, disturbance cross-section test and disturbance process analysis were conducted after SS. The results showed that draft force increased with tillage depth as a quadratic function. Soil displacement parameters and soil crack parameters extracted from the video of SS were significantly correlated with tillage depth, which could be used for a quantitative description of the paddy soil-disturbance characteristics. Cross-sectional area showed a trend of “increasing then decreasing” with increasing tillage depth, reaching a maximum at a tillage depth of 20 cm. When the tillage depth was greater than 20 cm, the bottom of the disturbing boundary formed a “mole cavity”. Fallback rate was used to describe the change in disturbed height or width during and after SS, which exceeded 100% at maximum. The surface roughness of microrelief and the size of the average clods reached the maximum at tillage depth of 20 cm. Considering the shallow cultivation layer of paddy soil in rice–wheat rotation, the recommended tillage depth of 20 cm could achieve maximum soil disturbance and minimum energy consumed.
1. Introduction
In recent decades, food security has been threatened by rapid global population growth and efforts are being made to increase food production [1,2]. As an important method in conservation tillage (CT), subsoiling (SS) can loosen the soil without turning it over, creating a loose and deep soil cultivation layer, reducing soil strength, improving water infiltration, promoting root growth, and increasing crop yield [3,4]. As an important part of the study on the effects of SS, the parameterization of characteristics such as soil breaking and lifting during SS can be used to improve the structure and operating parameters of soil-engaging tillage implements and effective control and optimization of tillage process, thus improving tillage systems for maximum soil disturbance and minimum energy consumed.
Many studies have been conducted on the effects of SS. For example, SS and straw return alter soil microbial community characteristics [5,6], SS effects on soil physical properties [7,8,9], SS improves soil chemical distribution [10,11], SS promotes root growth [12,13], SS increases crop yields [14,15], and the design of the various functions on subsoiler is also being improved [16,17]. With the development of modern technologies, the application of simulation models such as finite element method (FEM) and discrete element method (DEM) [18,19,20] have predicted soil-disturbance characteristics and improved the understanding of the mechanics of soil tool interaction. However, soil-disturbance characteristics and its effects during SS in the field are still lacking quantitative description. For example, the soil lifting width and height caused by subsoiler need to be accurately described and the microrelief and soil cracking need to be visually presented during SS. The structure and operating parameters of soil-engaging tillage implements can be combined with the soil-disturbance characteristics to improve the tillage system, which further determines the need for subsequent operations, such as secondary field preparation, which is related to the design of CT systems. It is a technical challenge to reveal the soil tillage process, which involves the possibility of simplifying tillage procedures, achieving cultivating–seeding compound operation, and even combining SS, sowing, fertilizing and straw return, as well as solving the problem of conservation agriculture requiring maximum soil disturbance but minimum energy consumed, and the need to deepen the cultivation layer without disturbing the soil and minimizing microrelief.
In the intensive rice–wheat rotation agriculture carried out in East China, heavy-duty machines have been used to prepare seedbeds within the constraints of a short transition period between crops, which has led to paddy soil compaction and resulted in a shallow cultivation layer and a dense hardpan underneath [21,22]. In the rice season, puddling (wet tillage) resulted in severe soil fragmentation resulting in mud formation kept under continuous submergence. The advantages of puddling include suppressing weeds, reducing filtration losses, and creating anaerobic conditions, all of which benefit rice [23]. However, the repeated and continuous puddling disrupted soil structure, created a shallow cultivation layer, delayed seeding, and reduced root growth, adversely affecting subsequent wheat performance [24]. It was reported that wheat yields under puddling conditions decreased by an average of 8% compared to rice planted under direct sowing or puddling conditions [25]. Therefore, proper SS in the wheat season could improve the paddy soil physical properties and plant factors and thus increase wheat yields [26].
To parameterize soil-disturbance characteristics in the field, a SS experiment was conducted using a specific field in situ test-rig facility. The in situ videotaping method was used for the first time to simultaneously record the process of SS from five positions to obtain the disturbance characteristics of paddy soil. The microrelief, disturbance cross-section and tillage resistance test after SS were used to quantitatively describe the characteristics and effects of soil disturbance with different tillage depths. The objectives of this study were to (1) use in situ videotaping method to obtain soil displacement parameters and soil crack parameters during SS, and (2) investigate the effect of SS depth on the disturbance process and failure mechanism of paddy soil.
2. Materials and Methods
2.1. Characterization of Soil
The experiment was conducted in the field within a typical tableland landscape, Babaiqiao Town (118°59′ E, 31°98′ N), Luhe District, Nanjing, Jiangsu Province, China, in November 2020. The site is in the lower reaches of the Yangtze River basin where the rice–wheat rotation has a long history. The rice is planted in early June and the wheat in early November every year. The experiment was conducted after rice harvest and during soil preparation before wheat sowing. The soil was clay loam in texture, which contains 21.30% sand, 39.84% silt, and 38.86% clay. Soil bulk density, water content and total porosity of 0~30 cm are shown in Table 1.

Table 1.
Physical properties in 0~30 cm soil depth.
2.2. Experimental Set-Up
Chisel-shaped tines were often used in SS operations for long-term cultivated fields to ensure sufficient soil disturbance in deep soil. In this study, a subsoiler with a chisel-shaped tine was selected for the experiment (Figure 1), which was composed of straight shank, curved shank and tine. The subsoiler was selected based on the Chinese standards, the subsoiler and share shaft (JB/T 9788-1999). The subsoiler shank had a thickness of 25 mm. The subsoiler tine and shank were made of 65 Mn steel.
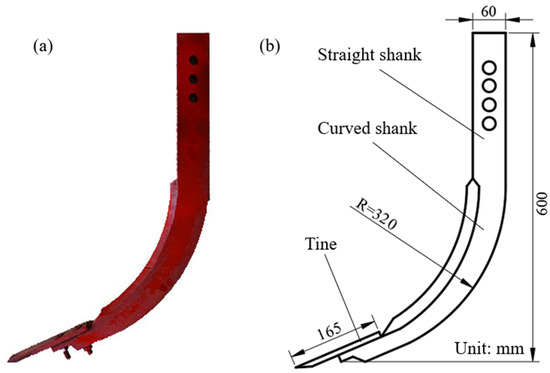
Figure 1.
Schematic diagram of the subsoiler (a) Actual subsoiler, (b) Parameters of subsoiler.
To ensure uniform speed of the drag and avoid the influence of the tractor on the soil in the process of SS, the multi-functional in situ test-rig facility was designed and manufactured for this study (Figure 2), which mainly included a movable carriage, traction motor, lifting motor, electric generator, control cabinet, control system and data-acquisition system. The test-rig was an independent structure with a span of 8 m and 1.8 m wide. A 13.5 kW electric generator was used for power and a 4 kW electric motor for traction. There was a movable carriage connected to 2 chains. The control cabinet could control the movable carriage forward and backward in terms of speed and up and down in terms of tillage depth, which was easy to operate wirelessly through a remote. The subsoiler was attached to the movable carriage. Four load sensors were equipped between the 2 chains and movable carriage. The horizontal drag force during the operation of the machine was recorded by load sensors and the change in drag force was collected by the computer.
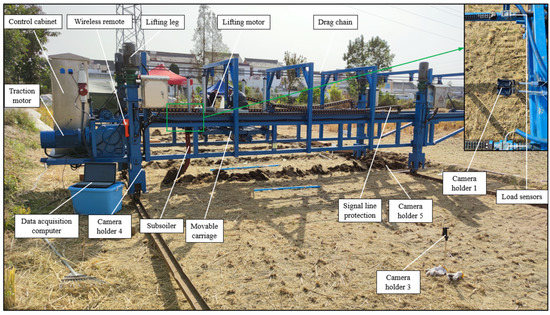
Figure 2.
Multi-functional in situ test-rig facility.
2.3. Experimental Design of SS Videotaping
An area of 80 m2 (10 × 8 m) was randomly selected in the experimental plot. The test-rig was moved laterally parallel to the 8 m side. The test-rig was moved 2 m for each test to prevent the intersection of the disturbance area or the disturbance of test-rig for the next test. Tillage depth was the main factor for SS quality and energy consumption [27], which was usually in the range of 10~30 cm [28], but for paddy soil, tillage depth greater than 30 cm was too deep, affecting the operation of the machine and destroying the soil that prevented underwater infiltration. Therefore, tillage depth was performed with 5 different tillage depths: 10, 15, 20, 25 and 30 cm, with a tillage distance of 5 m at each depth and a tillage speed of 0.05 m s−1.
Soil-disturbance process of SS at each tillage distance was recorded simultaneously by 5 cameras, numbered 1, 2, 3, 4 and 5 (Figure 3). The coordinate system was established in the forward direction (y-axis) of the subsoiler, and 5 cameras were placed according to Table 2.
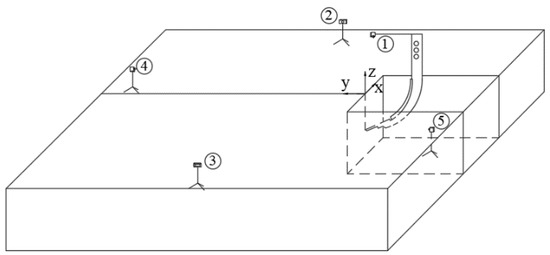
Figure 3.
Camera locations of SS.
Table 2.
Camera location coordinates.
2.4. Parameters during SS
2.4.1. Soil Displacement Parameters
The soil-disturbance process of SS was the lifting and falling of soil blocks periodically, this paper obtained the indicators of SS with the static image of the highest point of lifting soil in the video, specifically including lifting length R, lifting width W and lifting height H in the x, y and z directions. Among them, H and R were captured from videos of Cameras 2 and 3 (Figure 4a), and W was captured from the video of Camera 4 (Figure 4b). Six static images from each video were used to obtain parameters. The image was edited using the software Digimizer (MedCalc Software Ltd., Ostend, Belgium) based on the size of the subsoiler shank.
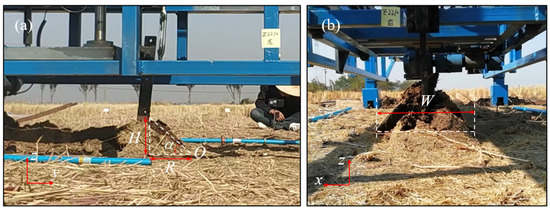
Figure 4.
Soil displacement image (a) Soil lifting length R (cm), lifting width W (cm), (b) Soil lifting height H (cm).
2.4.2. Soil Crack Parameters
To obtain the parameters of the crack pattern, techniques of digital image processing are often used. The procedure of digital image processing is shown in Figure 5. First, static crack images were captured from Camera 1 (Figure 5a). Second, the crack was carefully picked out of the image using the image matting software Adobe Photoshop 2021 (Adobe Systems Incorporated, San Jose, CA, USA) (Figure 5b). Finally, to determine the crack area, perimeter, length and width, the crack image is loaded into the software Digimizer to generate a binary red and white image. This process was called binarization (Figure 5c).
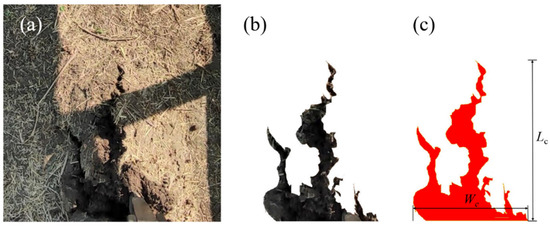
Figure 5.
Procedure of crack image processing (a) Initial crack image, (b) Matting image, (c) Binarization crack image, Lc (cm) is crack length, Wc (cm) is crack width.
Morphological parameters were obtained by image processing in the software Digimizer based on the size of the subsoiler shank. The crack area density Dc (%) was the ratio of the crack area A (cm2) to the total surface area of the soil specimen S (cm2), which was disturbance length R (cm) × disturbance width W (cm) in this paper, which was considered to be one of the most important indicators of the extent of cracking [29].
2.5. Parameters after SS
2.5.1. Draft Force and Specific Draft
Draft forces were measured in real time for each test using calibrated S-type load sensors of 2 tons maximum load capacity. Data acquisition was conducted using LabVIEW 2010 graphical software (National Instruments Corporation, Austin, TX, USA). Acquired data were saved to a laptop in LabVIEW measurement format (LVM), at a rate of 500 Hz and later converted to MS Excel spreadsheets for processing. The draft force was obtained by subtracting the sum of the back 2 sensors from the sum of the front 2 sensors, with 2 sensors at the front and 2 sensors at the back of the movable carriage. After MS Excel processing, the filtered draft force was obtained as shown in Figure 6, and the average value of the wave stable section was selected as the draft force F at each test.
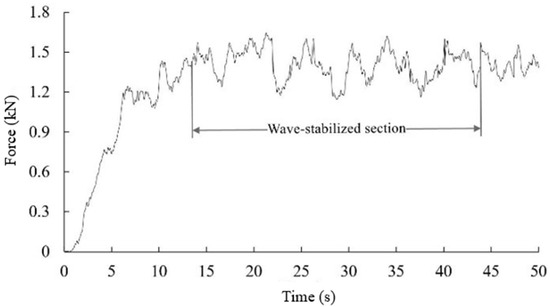
Figure 6.
Filtered draft force.
Additionally, specific draft was obtained from the force per cross-sectional area of worked soil [30].
2.5.2. SS Cross-Section and Surface Roughness
According to Manuwa [28] and field observation, the general form of soil disturbance was quantified by the parameters shown in Figure 7a. A pin-type profilometer was made to measure the SS upheaving boundary and disturbed boundary (Figure 7b). The profilometer consisted of 100 steel braziers, 3 m long and 1.2 m wide, with 10 mm braziers spacing and a measuring height range from −450 to 400 mm. After tillage, the profilometer was placed vertically on the soil surface, the clamp was released and the steel braziers were allowed to fall freely with the SS surface profile to measure the upheaving boundary. Then the disturbed soil was carefully removed and the profilometer was placed vertically on the groove to measure the disturbed boundary. These measurements were repeated 3 times at 1 m intervals for each SS groove.
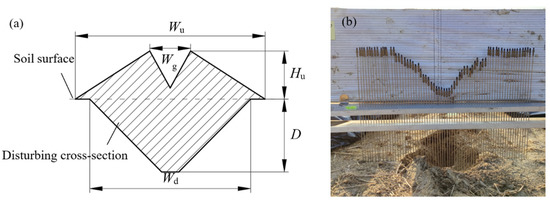
Figure 7.
Dimension and measurement of soil-disturbance cross-section (a) Parameter description of soil cross-section after SS, Wu (cm) is upheaving width, Wg (cm) is groove width, Hu (cm) is upheaving height, D (cm) is tillage depth, Wd (cm2) is disturbance width, (b) Determining the cross-section using a pin-type profilometer.
On the soil surface after SS, a horizontal line was made over the highest point as a baseline, as shown in Figure 8. In the range of upheaving width Wu with d0 (10 mm) as equal marking points, the vertical distance from each marking point to the horizontal baseline after SS was measured, respectively. The mean and standard deviation were calculated as in Equation (3). The standard deviation was expressed as surface roughness. The above test was measured 3 times to determine the mean value.
where ak (cm) is the vertical distance from the surface after SS to the horizontal baseline of the kth measurement, akj (cm) is the vertical distance from the surface after SS to the horizontal baseline at the jth equivalent point of the kth measurement, nk is the number of measurement points in the kth measurement and SRk (cm) is soil surface roughness of the kth measurement.
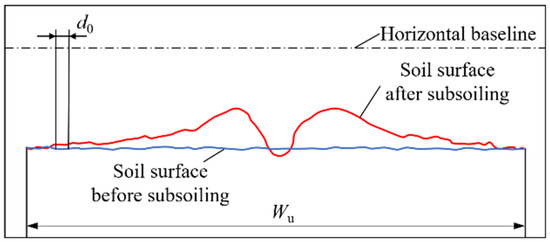
Figure 8.
Soil surface before and after SS, Wu (cm) is upheaving width, d0 (cm) is distance of equal marking point.
2.6. Data Analysis
Analysis of variance (ANOVA) was conducted on soil displacement parameters and soil crack parameters at the 95% confidence interval. The data in the table are displayed as averages. All analyses were performed using IBM SPSS Statistics 26.0 software (IBM Corp., Armonk, NY, USA).
3. Results and Discussion
3.1. Draft Force and Specific Draft
Draft force is an important parameter for the structural design of subsoiler and power matching for tractors [28]. Figure 9a showed that draft force increased with increasing depth and showed a nonlinear quadratic function relationship, which was consistent with the result of Ibrahmi [31] and Manuwa [28]. The draft force of 20 cm tillage depth increased 176.7% compared to 15 cm tillage depth, while 25 cm and 30 cm tillage depth increased 256.1% and 438.5% compared to 20 cm tillage depth. The above results may be related to the change of soil properties of paddy soil (Table 1), i.e., with increasing tillage depth, soil bulk density increased, soil porosity decreased, soil became compacted, soil disturbance increased and therefore draft force increased rapidly.
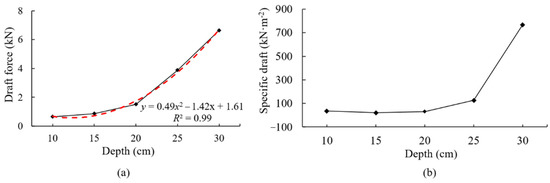
Figure 9.
Variation curves of draft force and specific draft at different tillage depths (a) Draft force, (b) Specific draft.
Specific draft could indirectly reflect the tillage efficiency of tillage implements [16,32]. Figure 9b showed that the specific draft lacked regularity with the change in tillage depth, when the tillage depths were 10, 15 and 20 cm, the specific draft showed a gentle linear decrease, and the specific draft was around 35 kN m−2. However, when the tillage depth increased to 25 cm, the specific draft reached 126.3 kN m−2, when the tillage depth reached 30 cm, the specific draft increased sharply to 768.6 kN m−2, compared to the tillage depth of 20 cm, the increases were 299.7% and 2332.3%, respectively.
3.2. Soil Displacement Parameters during SS
Soil displacement parameters from the video are shown in Table 3. The results indicated that the lifting length R and lifting width W increased with the tillage depth D, while the lifting height H and lifting angle α showed a trend of “increasing then decreasing” with the increase of tillage depth D. The lifting height H and lifting angle α of 20 cm tillage depth reached the maximum and were significantly different from other tillage depths, respectively.
Table 3.
Soil displacement parameters of SS.
3.3. Soil Crack Parameters during SS
Soil crack parameters during SS are shown in Table 4. The crack length Lc and crack area density Dc decreased with increasing tillage depth D. The crack area A showed significant differences at each depth. The crack width Wc reached a maximum at a tillage depth of 20 cm.
Table 4.
Soil crack parameters during SS.
3.4. Soil-Disturbance Process during SS
The soil-disturbance process was obtained from images, which were captured in time sequence from the videos (Figure 10), where the tine of subsoiler entered the soil at 2 s. At 3.7 s, the tine of subsoiler started to “squeeze” into the soil, and the “V” shaped crack started to appear in the subsoil from Camera 5. The soil surface started to bulge slightly and create small cracks from Cameras 1 and 4. At 4.9 s, the soil with shear failure was lifted along the curved shank, cracks on the soil profile and the soil surface continued to increase from Cameras 5 and 1, respectively, and the soil continued to be lifted upward from Camera 4. The soil failure process was consistent with Hang [33] and Spoor [34]. At 7.8 s, the lifted soil was sheared by the curved shank and produced many clods and cracks, but the image showed that only the soil on the right side of subsoiler continued to be sheared and lifted, the soil failure process showed asymmetric failure from Camera 5. The surface soil fragmentation almost reached the maximum at the time and produced large cracks from Camera 1. The soil was almost lifted to the maximum height at the time from Camera 4. Godwin [32] showed that the surface cracks formed by the narrow tine cultivator such as a chisel shovel was alternately distributed from left to right, which was consistent with the results of this study. At 12 s, the subsoiler had passed the lifted soil and most of the soil finished falling back. Only a small amount of soil adhered to the subsoiler and moved forward from Camera 5. The subsoiler was continuously soil breaking, the soil was lifted when the subsoiler passed, and then dropped from Cameras 1 and 4.
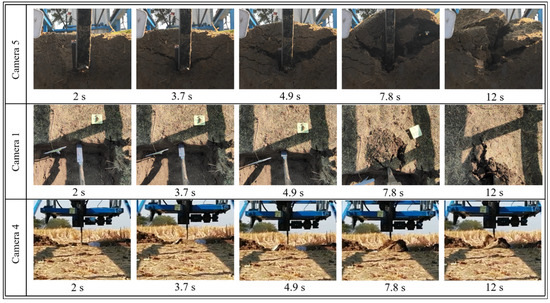
Figure 10.
Soil-disturbance process during SS. 2 s, 3.7 s, 4.9 s, 7.8 s and 12 s were the times when the subsoiler entered the soil.
3.5. Soil-Disturbance Cross-Section after SS
Several researchers have reported that there was a critical depth for SS [32,35], above which soil moved forward, upward and to both sides, forming a crescent-shaped failure, and below which soil moved forward and to both sides; the crescent-shaped failure was transformed to lateral failure. Crescentic failure occurred at a certain depth when the shear resistance of soil upward flow was less than the resistance of lateral flow. The critical depth meant that these two resistances were equal (Figure 11).

Figure 11.
Effect of subsoiler on patterns of soil failure [32].
Similar soil failure patterns were also found in this paper. Figure 12 indicated that the shear resistance of soil lateral flow existed in the soil-disturbance cross-section at 20, 25, and 30 cm depths, which meant that the critical depth was about 15 cm deep. After SS, the soil above the critical depth was disturbed and lifted to both sides, forming a crack in the middle, with a “peak-like” uplifted form above the soil surface, and the disturbing boundary was a “wide upper and narrow lower” fan shape. However, the subsoil became wet, sticky and consolidated in the progress of paddy farming [36,37]. Therefore, the soil below the critical depth was laterally compressed by the subsoiler, and the “squeezed” soil fell back to the middle under its gravity after the subsoiler passed, forming the “mole cavity” at the bottom of disturbed boundary, which is shown in Figure 13. When the tillage depth was less than or close to 20 cm, the overall shape of disturbance boundary was “fan-shaped”, and when the tillage depth was greater than 20 cm, the bottom of disturbed boundary formed a “mole cavity”, which was consistent with the result of Godwin [38] at the tillage depth of 50 cm. In addition, the soil-disturbance cross-sections in Figure 12 for tillage depths greater than 20 cm differed from the indoor soil bin experiments of Hang [33] and the dryland farming experiments of Hang [39] and Godwin [32] due to the difference in soil properties.
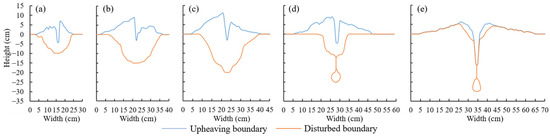
Figure 12.
Soil-disturbance cross-sections at different tillage depths (a) tillage depth of 10 cm, (b) tillage depth of 15 cm, (c) tillage depth of 20 cm, (d) tillage depth of 25 cm, (e) tillage depth of 30 cm.
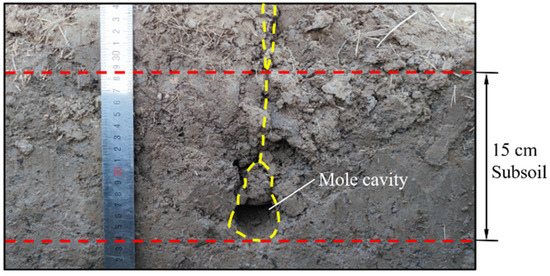
Figure 13.
Disturbed boundary bottom “mole cavity”.
The variation in tillage depth of the subsoiler caused changes not only in the morphology of the soil-disturbance cross-section but also in the upheaving parameters and disturbance boundary parameters. Table 5 showed the parameters of soil-disturbance cross-sections after SS in Figure 12, the results indicated that the upheaving width Wu increased with the tillage depth D, while the disturbance width Wd, groove width Wg and upheaving height Hu showed a trend of “increasing then decreasing” with the increase of tillage depth D, reaching a maximum at a tillage depth of 20 cm. Similarly, the cross-sectional area Scs showed a trend of “increasing then decreasing” with increasing tillage depth D, reaching a maximum of 480.44 cm2 at a tillage depth of 20 cm. From Table 5 and Figure 9, it can be known that the draft force increased significantly with the tillage depth, but the cross-sectional area did not increase correspondingly or even decreased, which resulted in a rapid increase in specific draft and a significant decrease in tillage energy efficiency, and the SS could not achieve the purpose of energy saving. Therefore, considering the energy input and the extent of soil disturbance, the tillage depth of SS should be controlled at about 20 cm in paddy soil.
Table 5.
Parameters of soil-disturbance cross-sections.
The soil was lifted as the subsoiler passed and fell back after the subsoiler passed. Table 3 showed the parameters during SS and Table 5 showed the parameters after SS, where lifting height during SS corresponded to upheaving height after SS and lifting width during SS corresponded to upheaving width after SS. In this paper, fallback rate was used to describe the change in height or width during and after SS, which was calculated according to the equation as:
where Fbr (%) is fallback rate, Ds (cm) is height or width during SS and As (cm) is height or width after SS. Fbr is shown in Figure 14. The results indicated that the height and width of the disturbed soil fell back and became smaller after SS, and all the height fallback rates were greater than the width fallback rates at different tillage depths, which was due to the upward lift of the subsoiler and the soil fell back by gravity when the subsoiler passed. The fallback rate differed between height and width at different depths. The fallback rate of height decreased with increasing tillage depth, with the maximum fallback rate exceeding 100% at the tillage depth of 10 cm; however, the fallback rate of width did not show a significant regularity with increasing tillage depth.
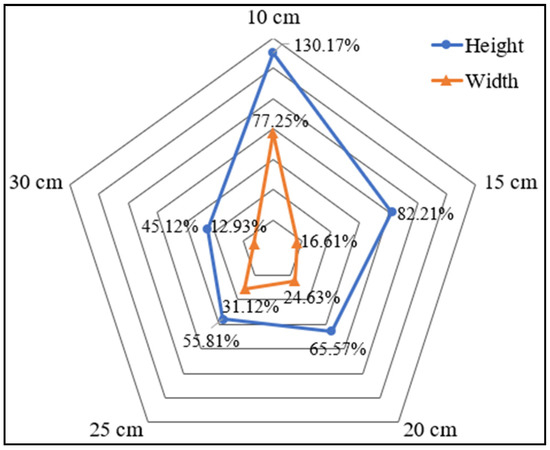
Figure 14.
Fallback rate at different tillage depths.
The above results indicate that the tillage depth of subsoiler has a great influence on the loosening and uplifting of paddy soil. When the tillage depth exceeded the critical depth (about 15 cm), the soil failure mode changed from crescent-shaped failure to crescent-shaped failure above the critical depth and lateral failure below the critical depth. The critical depth may be related to the plow pan of paddy soil. Huo [40] showed significant changes in soil compaction within the 15 cm soil depth after the harvester rolled, but did not cause significant changes in the soil depth below 15 cm for paddy soil. In this paper, from the data in Table 1, the results show that the depth of plow pan was also about 15 cm, and the soil physical properties near the depth had changed significantly, with an increase of 15.3% in soil bulk density, a decrease of 16.4% in soil porosity, and a decrease of 14.4% in soil water content in the 15~20 cm soil depth compared with the 10~15 cm soil depth. The soil below the plow pan was more compact and difficult to loosen and lift than the soil above the plow pan, so it was lateral compression failure when affected by the subsoiler. Overall, soil disturbance was greatest at a tillage depth of 20 cm, when soil upheaving height and disturbance area reached their maximum. However, when the tillage depth was more than 20 cm, and more parts of the subsoiler were below the critical depth, forming a lateral squeeze on the soil instead of effective loosening, the cross-sectional area became less and the upheaving height decreased.
3.6. Microrelief after SS
Tillage affected soil microrelief, with high surface roughness and total porosity increasing soil infiltration and thus soil water storage [41]. After SS, the cracks were asymmetrically distributed on the soil surface along the forward direction of subsoiler (Figure 15), which was consistent with the results of Godwin [38]. Figure 15 showed that the soil surface was disturbed differently by subsoiler. Soil surface disturbance was greater at tillage depths of 10 cm, 15 and 20 cm, and less at tillage depths of 25 and 30 cm. To indicate the size of the raised clods on the soil surface by the subsoiler, three larger clods were selected in Figure 15 to measure the size, and combined with the results of the surface roughness after SS as shown in Table 6, the surface roughness and the size of the average clods reached the maximum at tillage depth of 20 cm. Therefore, the results showed that tillage depth of 20 cm was suitable for SS with maximum energy efficiency and maximum soil disturbance, and tillage depth of 30 cm was suitable for minimal damage to the surface roughness after SS and agronomic requirements such as wheat root penetration, which was different from the suitable tillage depth of 25 cm in the North China Plain [42].
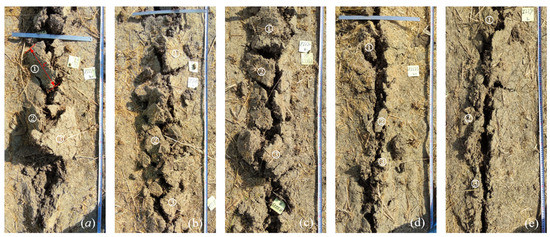
Figure 15.
Microrelief after SS (a) tillage depth of 10 cm, (b) tillage depth of 15 cm, (c) tillage depth of 20 cm, (d) tillage depth of 25 cm, (e) tillage depth of 30 cm.
Table 6.
Surface roughness and average maximum clod diameter.
3.7. Analysis and Discussion of Soil-Disturbance Processes
Analysis of the subsoiler structure and soil conditions provide macroscopic soil tillage mechanics for the above experimental results. The shallow cultivated layer in the rice–wheat rotation area was caused by conventional puddled and flood transplanted rice, repeat tractor compaction, years of shallow rotary tillage and paddy-dryland rotation. A large-scale regional survey showed that the effective cultivated layer of paddy soil was only 11~17 cm [43]. The soil profile survey in this experimental area also found that the effective cultivated layer after rice harvest was about 15 cm [40,44].
The micro-element analysis of the curved shank obtained the theoretical lifting height H’ (Figure 16) as
where L′ is the distance of movement along the horizontal direction per unit time during the lifting of disturbed soil, and ε is the acute angle between the tangent line of curved shank and the horizontal line. With the increase of tillage depth D, ε increased and the theoretical lifting height H′ increased when the subsoiler moved the same distance L′ (Figure 16); however, in this paper, lifting height H increased with the increase of tillage depth D at 10~20 cm and decreased of tillage depth D at 25~30 cm, which was related to soil properties.
H′ = L′tanε
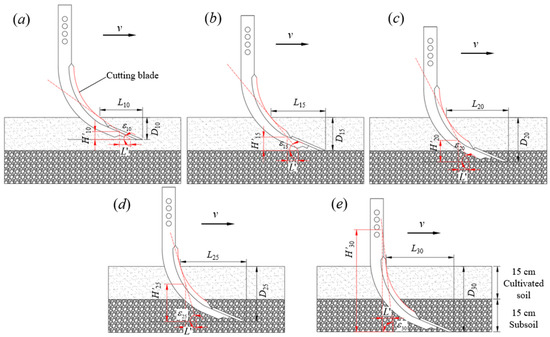
Figure 16.
Performances of different SS depths (a) tillage depth of 10 cm, (b) tillage depth of 15 cm, (c) tillage depth of 20 cm, (d) tillage depth of 25 cm, (e) tillage depth of 30 cm.
For SS, the curved shank was mainly for soil climbing, the cutting blade was mainly for soil breaking, and the shovel tine was mainly for soil lifting. During the process of SS, the soil experienced lifting, climbing, breaking and falling back. When the tillage depth was 10 cm, the disturbed soil was shallow with low soil bulk density, low soil porosity and blocking, which resulted in the disturbed soil being mainly large clods. The curve of the curved shank was long above the soil surface, the disturbed soil had enough travel to climb along the curved shank, and under gravity and the cutting blade, the soil climbed to a certain height and then fell (Figure 16a). When the tillage depth was 15 cm, the tillage depth did not reach the depth of the subsoil, compared to the 10 cm tillage depth, and more soil was disturbed in the cultivation layer, which led to an increase in the height and width of disturbed soil (Figure 16b). When the tillage depth was 20 cm, the shovel tine began to enter the subsoil, but not all of it, due to the high soil bulk density of subsoil,. The shovel tine lifted more soil relative to the shallow tillage depth, and soil climbing height along the curved shank increased, so the disturbed soil reached the maximum at this tillage depth (Figure 16c). When the tillage depth was 25 cm, the shovel tine was completely submerged in the subsoil. Due to the subsoil being hard, the shovel tine was prevented from lifting the soil, resulting in a sharp increase in the draft force. The subsoil was wet, sticky and plastic, resulting in more soil movement from upward to the two sides, thus forming a “mole cavity” (Figure 16d). When the tillage depth was 30 cm, the curved shank was almost completely submerged in the soil, and the soil lost its climbing ability. At this time, the draft force increased rapidly, and the soil moved more to both sides, resulting in a lower upheaving height and an increase in disturbance width (Figure 16e).
When the subsoiler lateral movement distance was 5 cm per unit time (1 s), the soil theoretical climbing height along the shovel tine and curved shank is shown in Table 7. The theoretical lifting height was fitted to the 0~20 cm tillage depth to obtain the curve as y = 0.61x − 2.65, R2 = 0.99. The actual lifting height in Table 3 was fitted to the 0~20 cm tillage depth to obtain the curve as y = 0.23x + 13.25, R2 = 0.87. The lifting angle and acute angle had similar trends to the lifting height. It can be shown that the theoretical and actual lifting height in 0~20 cm tillage depth had similar trends, with the increase of tillage depth, and lifting height increased, but when the tillage depth exceeded 20 cm, the shovel tine completely entered the subsoil, resulting in a rapid increase in draft force. Therefore, a special subsoiler is required to be designed for the rice–wheat rotation areas. Although increasing the lifting height was beneficial to make full use of tillage energy to loosen the soil, excessive lifting height often increased the soil surface roughness after tillage, which was not conducive to seed-drill efficiency [45], and even caused the subsoil to move to the soil surface, which was contrary to the agronomic requirement of loosening the soil rather than overturning it [46].
Table 7.
Parameters in Figure 16.
Lifting length and horizontal length both increased with tillage depth, which was consistent with the findings of Tong [47]. The horizontal length was fitted to the 0~30 cm tillage depth to obtain the curve as y = 0.57x + 15.20, R2 = 0.92. The lifting length in Table 3 was fitted to the 0~30 cm tillage depth to obtain the curve as y = 0.35x + 21.86, R2 = 0.99, which was consistent with the results of Guo [48], who proposed the horizontal length of the subsoiler in the range of tillage depth. Although increasing the horizontal length could effectively increase the ability of subsoiler to break the soil, this required higher stiffness and strength of the subsoiler. Therefore, combined with the soil physical properties and agronomic requirements, reasonable determination of tillage parameters of the subsoiler was the key to improve the quality of tillage.
4. Conclusions
In this paper, we used the field in situ test-rig facility to investigate the effect of tillage depth on soil disturbance with a subsoiler using the in situ videotaping method, and obtained detailed data on soil displacement parameters and soil crack parameters. Conclusions were drawn as follows:
(i) The in situ videotaping method could provide soil displacement parameters and soil crack parameters of the SS, which were significantly correlated with tillage depth.
(ii) The cross-sectional area showed a trend of “increasing then decreasing” with increasing tillage depth, reaching a maximum at a tillage depth of 20 cm. When the tillage depth was greater than 20 cm, the bottom of the disturbing boundary formed a “mole cavity”. The surface roughness of microrelief and the size of the average clods reached the maximum at tillage depth of 20 cm.
(iii) Considering the shallow cultivation layer of paddy soil in the rice–wheat rotation, the recommended tillage depth of 20 cm could achieve maximum soil disturbance and minimum energy consumed.
(iv) Field in situ videotaping method, tillage resistance test and the soil-disturbance cross-section test provided several parameters of SS and before and after SS, and field in situ and accurate research for soil tillage mechanics will need to use multiple testing methods in the future.
Author Contributions
Conceptualization, L.L. and Q.D.; methodology, L.L. and H.S.; investigation, L.L.; writing—original draft preparation, L.L.; writing—review and editing, L.L., H.S., R.H., Y.L., G.X. and Q.D.; visualization, H.S.; supervision, Q.D.; funding acquisition, Q.D. All authors have read and agreed to the published version of the manuscript.
Funding
This research was funded by the National Key Research and Development Program of China (No. 2022YFD2300304) and the Graduate Student Research Innovation Program of Jiangsu Province (No. KYCX21_0573).
Institutional Review Board Statement
Not applicable.
Informed Consent Statement
Not applicable.
Data Availability Statement
Not applicable.
Conflicts of Interest
The authors declare no conflict of interest.
References
- Karandish, F. Applying grey water footprint assessment to achieve environmental sustainability within a nation under intensive agriculture: A high-resolution assessment for common agrochemicals and crops. Environ. Earth Sci. 2019, 78, 200. [Google Scholar] [CrossRef]
- Ittersum, V.; Martin, K. Crop Yields and Global Food Security. Will Yield Increase Continue to Feed the World? Eur. Rev. Agric. Econ. 2016, 97, 191–192. [Google Scholar] [CrossRef]
- Jiang, X.; Tong, J.; Ma, Y.; Sun, J. Development and verification of a mathematical model for the specific resistance of a curved subsoiler. Biosyst. Eng. 2020, 190, 107–119. [Google Scholar] [CrossRef]
- Wang, X.; Zhou, H.; Huang, Y.; Ji, J. Variation of Subsoiling Effect at Wing Mounting Heights on Soil Properties and Crop Growth in Wheat–Maize Cropping System. Agriculture 2022, 12, 1684. [Google Scholar] [CrossRef]
- Zhang, L.; Su, X.; Meng, H.; Men, Y.; Liu, C.; Yan, X.; Song, X.; Sun, X.; Mao, L. Cotton stubble return and subsoiling alter soil microbial community, carbon and nitrogen in coastal saline cotton fields. Soil Tillage Res. 2023, 226, 105585. [Google Scholar] [CrossRef]
- Liu, X.; Peng, C.; Zhang, W.; Li, S.; An, T.; Xu, Y.; Ge, Z.; Xie, N.; Wang, J. Subsoiling tillage with straw incorporation improves soil microbial community characteristics in the whole cultivated layers: A one-year study. Soil Tillage Res. 2022, 215, 105188. [Google Scholar] [CrossRef]
- Franca, J.S.; Reichert, J.M.; Holthusen, D.; Rodrigues, M.F.; de Araujo, E.F. Subsoiling and mechanical hole-drilling tillage effects on soil physical properties and initial growth of eucalyptus after eucalyptus on steeplands. Soil Tillage Res. 2021, 207, 104860. [Google Scholar] [CrossRef]
- Zhang, Q.; Wang, S.; Zhang, Y.; Li, H.; Liu, P.; Wang, R.; Wang, X.; Li, J. Effects of subsoiling rotational patterns with residue return systems on soil properties, water use and maize yield on the semiarid Loess Plateau. Soil Tillage Res. 2021, 214, 105186. [Google Scholar] [CrossRef]
- Getahun, G.T.; Kätterer, T.; Munkholm, L.J.; Parvage, M.M.; Keller, T.; Rychel, K.; Kirchmann, H. Short-term effects of loosening and incorporation of straw slurry into the upper subsoil on soil physical properties and crop yield. Soil Tillage Res. 2018, 184, 62–67. [Google Scholar] [CrossRef]
- Guo, X.; Wang, H.; Yu, Q.; Ahmad, N.; Li, J.; Wang, R.; Wang, X. Subsoiling and plowing rotation increase soil C and N storage and crop yield on a semiarid Loess Plateau. Soil Tillage Res. 2022, 221, 105413. [Google Scholar] [CrossRef]
- Müller, M.; Schneider, J.R.; Klein, V.A.; Da Silva Júnior, J.P.; Chavarria, G. Root growth and crop performance of soybean under chemical, physical, and biological changes after subsoiling. Agron. J. 2020, 112, 932–947. [Google Scholar] [CrossRef]
- Wang, C.; Yan, Z.; Wang, Z.; Batool, M.; El-Badri, A.M.; Bai, F.; Li, Z.; Wang, B.; Zhou, G.; Kuai, J. Subsoil tillage promotes root and shoot growth of rapeseed in paddy fields and dryland in Yangtze River Basin soils. Eur. J. Agron. 2021, 130, 126351. [Google Scholar] [CrossRef]
- Wang, H.; Zhang, D.; He, J.; Wang, L.; Ren, J.; Zhang, S.; Bai, W.; Song, J.; Lv, G.; Li, J. Changes in Soil Properties, Bacterial Communities and Wheat Roots Responding to Subsoiling in South Loess Plateau of China. Agronomy 2022, 12, 2288. [Google Scholar] [CrossRef]
- Voronov, S.; Pleskachiov, Y.; Kurbanov, S.; Magomedova, D.; Zargar, M. Tillage System and Seeding Rate Impact on Yield, Oil Accumulation and Photosynthetic Potential of Different Cultivars of Safflower (Carthamus tinctorius L.) in Southern Russia. Agronomy 2022, 12, 2904. [Google Scholar] [CrossRef]
- Qiang, X.; Sun, J.; Ning, H. Impact of Subsoiling on Cultivated Horizon Construction and Grain Yield of Winter Wheat in the North China Plain. Agriculture 2022, 12, 236. [Google Scholar] [CrossRef]
- Song, W.; Jiang, X.; Li, L.; Ren, L.; Tong, J. Increasing the width of disturbance of plough pan with bionic inspired subsoilers. Soil Tillage Res. 2022, 220, 105356. [Google Scholar] [CrossRef]
- Wang, Y.; Li, N.; Ma, Y.; Tong, J.; Pfleging, W.; Sun, J. Field experiments evaluating a biomimetic shark-inspired (BioS) subsoiler for tillage resistance reduction. Soil Tillage Res. 2020, 196, 104432. [Google Scholar] [CrossRef]
- Aday, S.H.; Ramadhan, M.N. Comparison between the draft force requirements and the disturbed area of a single tine, parallel double tines and partially swerved double tines subsoilers. Soil Tillage Res. 2019, 191, 238–244. [Google Scholar] [CrossRef]
- Sun, J.; Wang, Y.; Ma, Y.; Tong, J.; Zhang, Z. DEM simulation of bionic subsoilers (tillage depth >40 cm) with drag reduction and lower soil disturbance characteristics. Adv. Eng. Softw. 2018, 119, 30–37. [Google Scholar] [CrossRef]
- Zhang, L.; Zhai, Y.; Chen, J.; Zhang, Z.; Huang, S. Optimization design and performance study of a subsoiler underlying the tea garden subsoiling mechanism based on bionics and EDEM. Soil Tillage Res. 2022, 220, 105375. [Google Scholar] [CrossRef]
- Torotwa, I.; Ding, Q.; Makange, N.R.; Liang, L.; He, R. Performance evaluation of a biomimetically designed disc for dense-straw mulched conservation tillage. Soil Tillage Res. 2021, 212, 105068–105077. [Google Scholar] [CrossRef]
- Zhou, W.; Lv, T.; Chen, Y.; Westby, A.P.; Ren, W.; González, A.P. Soil Physicochemical and Biological Properties of Paddy-Upland Rotation: A Review. Sci. World J. 2014, 2014, 856352–856358. [Google Scholar] [CrossRef] [PubMed]
- Saharawat, Y.S.; Singh, B.; Malik, R.K.; Ladha, J.K.; Gathala, M.; Jat, M.L.; Kumar, V. Evaluation of alternative tillage and crop establishment methods in a rice–wheat rotation in North Western IGP. Field Crop. Res. 2010, 116, 260–267. [Google Scholar] [CrossRef]
- Dwivedi, B.S.; Singh, V.K.; Shukla, A.K.; Meena, M.C. Optimizing dry and wet tillage for rice on a Gangetic alluvial soil: Effect on soil characteristics, water use efficiency and productivity of the rice–wheat system. Eur. J. Agron. 2012, 43, 155–165. [Google Scholar] [CrossRef]
- Kumar, V.; Bellinder, R.R.; Gupta, R.K.; Malik, R.K.; Brainard, D.C. Role of herbicide-resistant rice in promoting resource conservation technologies in rice–wheat cropping systems of India: A review. Crop Prot. 2008, 27, 290–301. [Google Scholar] [CrossRef]
- Liang, L.; Xu, G.; Ding, Q.; Wang, J.; Xing, Q.; Torotwa, I. Post-paddy tillage affects soil physical processes of rain-fed rice-wheat (RFRW) rotation. Soil Sci. Soc. Am. J. 2022, 87, 30–42. [Google Scholar] [CrossRef]
- Lou, S.; He, J.; Li, H.; Wang, Q.; Lu, C.; Liu, W.; Liu, P.; Zhang, Z.; Li, H. Current Knowledge and Future Directions for Improving Subsoiling Quality and Reducing Energy Consumption in Conservation Fields. Agriculture 2021, 11, 575. [Google Scholar] [CrossRef]
- Manuwa, S.I. Performance evaluation of tillage tines operating under different depths in a sandy clay loam soil. Soil Tillage Res. 2009, 103, 399–405. [Google Scholar] [CrossRef]
- Zhang, Z.B.; Zhou, H.; Lin, H.; Peng, X. Puddling intensity, sesquioxides, and soil organic carbon impacts on crack patterns of two paddy soils. Geoderma 2016, 262, 155–164. [Google Scholar] [CrossRef]
- Arvidsson, J.; Keller, T.; Gustafsson, K. Specific draught for mouldboard plough, chisel plough and disc harrow at different water contents. Soil Tillage Res. 2004, 79, 221–231. [Google Scholar] [CrossRef]
- Ibrahmi, A.; Bentaher, H.; Hbaieb, M.; Maalej, A.; Mouazen, A.M. Study the effect of tool geometry and operational conditions on mouldboard plough forces and energy requirement: Part 1. Finite element simulation. Comput. Electron. Agr. 2015, 117, 258–267. [Google Scholar] [CrossRef]
- Godwin, R.J.; O Dogherty, M.J. Integrated soil tillage force prediction models. J. Terramech. 2007, 44, 3–14. [Google Scholar] [CrossRef]
- Hang, C.; Huang, Y.; Zhu, R. Analysis of the movement behaviour of soil between subsoilers based on the discrete element method. J. Terramech. 2017, 74, 35–43. [Google Scholar] [CrossRef]
- Spoor, G. Alleviation of soil compaction: Requirements, equipment and techniques. Soil Use Manage. 2006, 22, 113–122. [Google Scholar] [CrossRef]
- Aikins, K.A.; Ucgul, M.; Barr, J.B.; Jensen, T.A.; Antille, D.L.; Desbiolles, J.M.A. Determination of discrete element model parameters for a cohesive soil and validation through narrow point opener performance analysis. Soil Tillage Res. 2021, 213, 105123. [Google Scholar] [CrossRef]
- Gathala, M.K.; Ladha, J.K.; Saharawat, Y.S.; Kumar, V.; Kumar, V.; Sharma, P.K. Effect of Tillage and Crop Establishment Methods on Physical Properties of a Medium-Textured Soil under a Seven-Year Rice−Wheat Rotation. Soil Sci. Soc. Am. J. 2011, 75, 1851–1862. [Google Scholar] [CrossRef]
- Hobbs, P.R.; Gupta, R.K. Resource-Conserving Technologies for Wheat in the Rice–Wheat System. Improv. Product. Sustain. Rice-Wheat Syst. Issues Impacts 2003, 65, 149–171. [Google Scholar] [CrossRef]
- Godwin, R.J.; Spoor, G.; Leeds-Harrison, P. An experimental investigation into the force mechanics and resulting soil disturbance of mole ploughs. J. Agric. Eng.-Italy 1981, 26, 477–497. [Google Scholar] [CrossRef]
- Hang, C.; Gao, X.; Yuan, M.; Huang, Y.; Zhu, R. Discrete element simulations and experiments of soil disturbance as affected by the tine spacing of subsoiler. Biosyst. Eng. 2018, 168, 73–82. [Google Scholar] [CrossRef]
- Huo, L.; Liang, L.; Abbas, A.; White, D.; Ding, Q.; Wang, X.; He, R. Soil disturbance under small harvester traffic in paddy-based smallholder farms in China. Agron. J. 2020, 112, 1441–1451. [Google Scholar] [CrossRef]
- Guzha, A.C. Effects of tillage on soil microrelief, surface depression storage and soil water storage. Soil Tillage Res. 2004, 76, 105–114. [Google Scholar] [CrossRef]
- Wang, L.; Guo, H.; Wang, L.; Cheng, D. Suitable Tillage Depth Promotes Maize Yields by Changing Soil Physical and Chemical Properties in A 3-Year Experiment in the North China Plain. Sustainability 2022, 14, 15134. [Google Scholar] [CrossRef]
- Lennartz, B.; Horn, R.; Duttmann, R.; Gerke, H.H.; Tippkötter, R.; Eickhorst, T.; Janssen, I.; Janssen, M.; Rüth, B.; Sander, T.; et al. Ecological safe management of terraced rice paddy landscapes. Soil Tillage Res. 2009, 102, 179–192. [Google Scholar] [CrossRef]
- Ding, Q.; Ge, S.; Ren, J.; Li, Y.; He, R. Characteristics of subsoiler traction and soil disturbance in paddy soil. Trans. Chin. Soc. Agric. Mach. 2017, 48, 47–56, 63. (In Chinese) [Google Scholar] [CrossRef]
- Conte, O.; Levien, R.; Debiasi, H.; Sturmer, S.L.K.; Mazurana, M.; Muller, J. Soil disturbance index as an indicator of seed drill efficiency in no-tillage agrosystems. Soil Tillage Res. 2011, 114, 37–42. [Google Scholar] [CrossRef]
- American Society of Agricultural Engineers. Terminology and definitions for agricultural tillage implements. In ASAE Standards 2003: Standards Engineering Practices Data; American Society of Agricultural Engineers: St. Joseph, MI, USA, 2003. [Google Scholar]
- Tong, J.; Moayad, B.Z. Effects of rake angle of chisel plough on soil cutting factors and power requirements: A computer simulation. Soil Tillage Res. 2006, 88, 55–64. [Google Scholar] [CrossRef]
- Guo, Z.; Zhou, Z.; Tong, J.; Ren, L. A 2-D finite element analysis for cutting performance of a parabolic curved cutting surface. J. Luoyang Inst. Technol. 2002, 23, 1–4. (In Chinese) [Google Scholar] [CrossRef]


Disclaimer/Publisher’s Note: The statements, opinions and data contained in all publications are solely those of the individual author(s) and contributor(s) and not of MDPI and/or the editor(s). MDPI and/or the editor(s) disclaim responsibility for any injury to people or property resulting from any ideas, methods, instructions or products referred to in the content. |
© 2023 by the authors. Licensee MDPI, Basel, Switzerland. This article is an open access article distributed under the terms and conditions of the Creative Commons Attribution (CC BY) license (https://creativecommons.org/licenses/by/4.0/).