Article

Evaluation of the Effect of Water Stress on Clonal Variations of Cv. Monastrell (Vitis vinifera L.) in South-Eastern Spain: Physiology, Nutrition, Yield, Berry, and Wine-Quality Responses

by
Pascual Romero
1,*,
Pablo Botía
1,
Rocío Gil-Muñoz
2,
Francisco M. del Amor
3 and
Josefa María Navarro
1
1
Irrigation and Stress Physiology Group, Instituto Murciano de Investigación y Desarrollo Agrario y Medioambiental (IMIDA), C/ Mayor s/n, 30150 La Alberca, Murcia, Spain
2
Oenology and Viticulture Group, Instituto Murciano de Investigación y Desarrollo Agrario y Medioambiental (IMIDA), C/ Mayor s/n, 30150 La Alberca, Murcia, Spain
3
Department of Crop Production and Agri-Technology, Instituto Murciano de Investigación y Desarrollo Agrario y Medioambiental (IMIDA), C/ Mayor s/n, 30150 La Alberca, Murcia, Spain
*
Author to whom correspondence should be addressed.
Agronomy 2023, 13(2), 433; https://doi.org/10.3390/agronomy13020433
Submission received: 1 December 2022 / Revised: 23 January 2023 / Accepted: 25 January 2023 / Published: 31 January 2023
(This article belongs to the Section Water Use and Irrigation)

Abstract

:
The present study aims to analyze the physiological and agronomical response to drought among seven local and traditional field-grown Monastrell clones (4, 94, 188, 360, 276, 372, and 373) over four seasons (2018–2021) under optimum irrigation conditions (control) and water stress (stress). We have focussed on measuring Monastrell interclonal variability in plant water relations and leaf gas exchange, vegetative growth, leaf mineral nutrition, yield, water use efficiency (WUE), and grape and wine quality. A classification of the different clones according to drought-tolerance degree and agronomical/oenological performance was established. The classification revealed that (a) The most drought-tolerant clone (i.e., clone 4) was neither the most productive (8600 kg ha−1), the most efficient in terms of water use (average of 25 kg m−3), nor the one that presented a better grape quality; (b) The most productive and efficient clone (i.e., clone 94) (11,566 kg ha−1, average of 30 kg m−3) was also a drought-tolerant clone, but it provided the worst berry and wine qualities with the lowest aromatic/nutraceutical potential, and it is not recommended for premium red wine production; (c) Conversely, clone 360 provided the highest berry quality, but at the expense of a greatly reduced vigor and yield (4000 kg ha−1) and a lower WUEyield (average of 10 kg m−3); (d) Low-vigor clones 372 and 276 were the most sensitive to drought conditions and put more water conservation mechanisms into play, i.e., a tighter control of vine water use and reduced leaf transpiratory surface, under soil water deficit and high vapor pressure deficit (VPD). In addition, these clones reached a balance between drought tolerance, productive water use efficiency (WUEyield), and berry and wine quality, because they provided moderate yields (7400–7700 kg ha−1), a high WUEyield (average between 17–19 kg m−3 applied water), and an enhanced berry and wine quality with greater oenological, nutraceutical, and aromatic potential; (e) High-vigor clone 188 also displayed several mechanisms of drought tolerance (tighter stomatal control of water use), maintained a higher yield (10,500 kg ha−1) and a very high WUEyield (29 kg m−3), enhanced berry quality (similarly to 276 or 372), and improved oenological/aromatic potential, and can also be recommended for the application of low water volume deficit irrigation (DI) strategies under semi-arid conditions.

1. Introduction

Current projections of future wine-growing regions with climate change suggest dramatic shifts in viticultural areas [1,2,3]. Unless emissions are strongly reduced, many warmer-climate regions that currently grow grapes (for example, semi-arid areas from southern Europe, especially the south-east of Spain) are expected to become too hot and dry for the cultivation of high-quality grapes in the future [4]. Challenges for water management will be exacerbated in the near, mid, and long term, depending on the magnitude, rate, and regional details of future climate change, and will be particularly challenging for regions with constrained resources for water management [5]. Agronomic adaptation to a higher water scarcity in semi-arid wine-growing regions includes modifying viticultural practices (e.g., deficit irrigation (DI), canopy management, training systems, soil management, etc.) and selecting the most resilient, efficient, and drought-adapted genotypes (i.e., rootstocks, cultivars, and clones) [6,7,8]. For instance, irrigation is effective in reducing drought risk and climate impacts in many regions and has several livelihood benefits, but an appropriate management is needed to avoid potential adverse outcomes, which can include accelerated depletion of groundwater and other water sources and an increased soil salinization [5].
On the other hand, predicted impacts of climate change on crops could also be mitigated by exploiting the existing genetic diversity within crops. For instance, wine grapes possess a tremendous genetic diversity (both intercultivar and intracultivar) in traits that affect the response to climate conditions, such as phenology and drought tolerance, to cope with a high diversity of climate regimes, but this diversity is still scarcely exploited [4]. Instead, in many countries, the same 12 varieties (international varieties), which represent a mere 1% of total diversity among the 1100 commercial varieties of grapevines that are planted worldwide, take up to 70–90% of total hectares [4]. Of special relevance are the local/traditional varieties/clones, which often outperform modern, widely-planted cultivars and which have led to a growing interest in better understanding, preserving, and exploiting this diversity. Indeed, the diversification of rootstocks and clones as a way of increasing genetic variability, avoiding the cultivation of a single rootstock and clone combination, has been proposed in winegrapes [9], in an effort to explore clone × rootstock interactions when comparing tolerance to abiotic stresses in different cultivars [10]. Exploring grapevine intracultivar variability (e.g., clones) is particularly interesting because there is consistent evidence of significant interclonal variability in water use efficiency at a leaf level (WUEleaf (A/gs)), carbon isotopic discrimination (δ13C), stomatal regulation, photosynthetic capacity, and biomass/yield traits [11,12,13,14,15], and, indeed, it respects the cultural and social components of winegrape cultivation and the wine typicity associated with local terroir. Therefore, identifying new clones with a superior drought tolerance would provide genetic material that has a greater water use efficiency, thereby reducing reliance on supplemental irrigation [16].
Recent results provide molecular support for the intravarietal variability previously observed at an agronomic and physiological level, sustaining that phenomena of phenotypic plasticity can occur not only at the cultivar, but also at the clone level [17]. Therefore, there is a growing interest in selecting genotypes that are better adapted to future environmental conditions, and the first step is to understand the physiological/agronomical responses under different conditions of the currently available genetic pool [13]. For an efficient clonal selection, genotype sensitivity to environmental conditions is a very important trait to consider in order to determine whether a genotype can be selected for cultivation in a wide range of environments, or whether it is only adapted to very specific conditions [11]. Clones are propagated vegetatively, and thus are usually identical from a genetic point of view; they represent small genetic differences within a variety, much smaller than the differences that occur between varieties which originate from sexual reproduction. However, different clones from one grape variety can differ not only in their stomatal regulation and photosynthetic performance, but also in their productive traits and their ability to produce berries and wines with different composition and organoleptic characteristics (e.g., a different aromatic volatile profile) [18,19]. Monastrell (Mourvedre in France, and Mataro in Australia and California) is an ancient, native, late-ripening, black-skinned grape variety originating from the Spanish Levante (south-eastern, Spain) that has been grown in vineyards all around the western Mediterranean countries for centuries. It is well adapted to these rigorous and dry climates of high temperatures and recurrent drought cycles. In this sense, certain physiological characteristics of tolerance to drought have been identified in Monastrell, which give it a good capacity to adapt to moderate water stress (WS) [20]. Moreover, recent studies have revealed the existence of significant levels of genetic diversity among Monastrell clones in the south-east of Spain [21,22], but there is little knowledge about its physiological and agronomic behavior under rainfed and deficit irrigation conditions.
The present study aims to analyze the physiological and agronomical response to drought among seven local, traditional, and non-studied field-grown cv. Monastrell clones over four seasons under optimum irrigation conditions (control) and under water stress. We have focussed on a holistic approach to measure Monastrell interclonal variability in plant water relations and gas exchange, vegetative growth, leaf mineral nutrition, yield, WUE, and grape and wine quality. A classification of the different clones according to the drought-tolerance degree (e.g., water savers vs. water spenders) and agronomical/oenological performance has been established.

2. Material and Methods

2.1. Field Conditions, Plant Materials, and Irrigation Treatments

All of the trials and experiments were carried out in a plot of 0.12 ha of adult Monastrell variety trellis vines in an experimental orchard located in Cehegín (Murcia) (38°6′38.13″ N, 1°40′50.41″ W, 432 m a. s. l.) during years 2018–2021. Grapevines (Vitis vinifera L., var. Monastrell, syn. Mourvedre) were 20+ years old, and the Monastrell clones studied are 4, 94, 188, 276, 360, 372, and 373, grafted on rootstock 110R. These traditional clones were recovered from a prospection made in old vineyards in the Region of Murcia, SE Spain, in the 2000s. Planting density was 3 m between rows and 1 m between plants (3333 vines/ha). The soil of the plot is clayey (>40% clay, 36%–38 silt) and has an organic-matter content between 0.82–1.05%, a pH of 7.40, an electrical conductivity of 0.13 dS m−1, an active limestone (CaCO3) between 17–19%, a cation exchange capacity of 18 meq/100 g, a C/N ratio between 7.1–8.1, a total N between 0.067–0.078%, and an assimilable P between 10.7–14.7 mg/kg. The irrigation water that was used came from a well and had a pH of 7.96 and an electrical conductivity of 0.68–0.81 dS m−1. Climate is Mediterranean semi-arid, with hot and dry summers and a scarce annual rainfall (Table 1). The training system was a bilateral cordon trellised to a three-wire vertical system (Figure 1). The vine rows ran NW–SE. Six two-bud spurs (12 nodes) were left after pruning, while in May, green non-productive shoots were removed from each vine in the same manner for all of the treatments, according to the grower’s practice in the area.
Crop evapotranspiration (ETc = Eto × Kc) was estimated using varying crop coefficients (Kc)—based on those proposed by the FAO, adjusted for the Mediterranean area— and reference evapotranspiration (ETo) values (Table 1). The applied Kc values were 0.35 in April, 0.45 in May, 0.52 in June, 0.75 in July–mid August, 0.60 in mid-August–early September, and 0.45 in mid-September–October. The ETo was calculated weekly from the mean values of the preceding 12–15 years, using the Penman Monteith-FAO method and the daily climatic data collected in the meteorological station (Campbell mod. CR 10X) located at the experimental vineyard and belonging to the Servicio de Información Agraria de Murcia (SIAM, IMIDA).
Each clone was irrigated from April to October using high-frequency drip irrigation (2–5 times per week during the late evening, depending on the phenological period), applying an optimized regulated deficit irrigation (RDI) strategy throughout the year (Control treatment) and a severe deficit irrigation strategy where no irrigation was applied from the fruit set to the end of the cycle (Stress treatment, Table 2). All of the clones of each treatment were irrigated with similar annual water volumes, applying the same control and DI strategy from 2018 to 2020 (Table 2). In 2021, irrigation was optimized in each clone according to the physiological and agronomic results obtained in the three previous years, and a different annual irrigation water volume was applied to each clone (Table 2). The amount of water applied in the orchard was measured with flow meters (model MFSM-L, Hidroconta, Murcia, Spain). Water was applied by one pressure-compensated emitter per plant (2 L h–1) with one drip-irrigation line per row. All of the clones received the same annual amount of organic fertilizer (liquid organic matter–amino acid complex/compost, 50 L ha−1 month−1), supplied through the irrigation drip system from April to August. In the stressed vines, fertilizer was applied directly into the soil when irrigation was cut.
A completely randomized design was used in the vineyard with two factors: Clone (7 clones) and Irrigation conditions (control and stress treatments), with 15 repetitions per combination. Therefore, each clone had 15 control vines and 15 stressed vines arranged in the same trellis row (Figure 1). Due to its small size and to the high soil homogeneity (there were no significant differences in soil characteristics, such as texture, organic matter, pH, or cation exchange capacity), the experimental design was elaborated without repetitions of complete blocks. To cut off irrigation in plants with stress treatment, a key in the drip line was provided to open or close when irrigation or drought had to be applied. Inter-row and under-vine weeds were removed mechanically during the season, soil management was no tillage, and vineyard management and all of the phytosanitary treatments were applied following the rules of organic production.

2.2. Vine Water Status, Leaf Gas Exchange and Leaf Hydraulic Conductivity

In 2020 and 2021, the stem water potential (Ψs) (and occasionally, leaf water potential, Ψl) was determined monthly from the beginning of the fruit set (June) until harvest (September). Six to eight healthy, fully exposed, and expanded mature leaves from the main shoots in the middle-upper part of the vine canopy were taken per clone-treatment combination. Leaves were enclosed in aluminium foil and covered with plastic at least 2 h before midday measurement. Ψs was measured at noon (12:00–13:30 p.m., local time) using a pressure chamber (Model 600; PMS Instrument Co., Albany, OR, USA). In 2020 and 2021, leaf gas exchange rates were measured monthly between 09:00 and 10:30 a.m. (early morning) and between 12:15–13:45 p.m., local time (midday), from June to September on selected clear and sunny days. Measurements were made on leaves that were similar to those used for the stem water potential measurements (one leaf on each of six or eight vines per clone–treatment combination, depending on the year). Gas exchange rates were measured with a portable photosynthesis measurement system (LI-6400, Li-Cor, Lincoln, NE, USA) equipped with a broadleaf chamber (6.0 cm2). During measurements, leaf temperature was between 23–37 °C, leaf-to-air vapor pressure deficit was between 1.4–5.3 kPa, and relative humidity was 30–50%. Molar air flow rate inside the leaf chamber was 500 μmol mol–1. All of the measurements were taken at a reference CO2 concentration similar to ambient (400 μmol mol–1) and at a saturating photosynthetic photon flux density (PPFD) of 1500 μmol m–2 s –1.
Conductance from stem to leaf (Kleaf) was estimated with the evaporative flux method, using the following equation [23]:
Kleaf = Emax/(Ψs − Ψl)
where Ψs is the midday stem water potential in a non-transpiring leaf, Ψl is the midday leaf water potential in a transpiring leaf, and Emax is the maximum transpiration rate (measured between 12:00–16:00 p.m.). Gradient of water potential in the leaves (ΔΨ) was calculated as the difference between Ψl and Ψs.

2.3. Isotope Carbon Composition

In September, in 2019 and 2020, before harvest, dry, powdered berry samples were packed in tin capsules and analyzed with isotope ratio mass spectrometry (Continuous Flow Isotope Ratio Mass Spectrometer, Micromass Isoprime, EuroVector SpA, Milan, Italy), according to [24]. The 13C:12C ratios were expressed in δ notation [25].

2.4. Leaf Mineral Analysis

Leaf samples were collected at the end of July (veraison) in 2018, 2019, 2020, and 2021 for mineral analysis. About 12 leaves per plant from the main shoots (5th or 6th leaf starting from the top of the shoot) were collected from 6 vines per clone and treatment. They were washed, dried at 65 °C for 48 h, and milled. After plant tissue was digested, ashes were dissolved in HNO3, and K, Mg, Ca, Na, P, Fe, Mn, Zn, and B were analyzed with an inductively coupled plasma optical emission spectrometer (Varian MPX Vista, Palo Alto, CA, USA). Nitrogen concentration was determined with a LECO FP-428 protein detector.

2.5. Main Shoot Length and Total Leaf Area

TLA per plant was measured once a year (from 2018 to 2021) at the end of July (veraison) and was estimated by selecting 5 representative main shoots per vine and calculating their average shoot length in 6–8 vines per clone–treatment combination. Total shoot length was measured with a tape measure. The total number of main shoots per vine was also recorded each year, at the end of July, in the same vines. Total leaf area (TLA) per vine was estimated using a non-destructive method: a first order polynomial linear equation relating main shoot length (SL) to total leaf area (TLA) of the main shoot for the rootstock 110R: TLA (cm2) = −1227 + 37.3SL, r = 0.96 *** [26]. TLA per plant was estimated by multiplying the average shoot leaf area by the total number of main shoots of the vine.

2.6. Yield Response, WUE, and Sink/Source Ratios

Each year at harvest (from 2018 to 2021), yield components were measured for 15 vines per clone-treatment combination. Harvest date was in accordance with the grower’s practice in the area, when °Brix reached 23.0–24.0. Yield per vine, number of clusters per vine, cluster weight, berry number per cluster, and berry weights were calculated. Vegetative growth and productive data of the different years were used to calculate several vine vigor indices and sink/source ratios, such as yield/pruning weight, TLA/yield, and TLA/pruning weight. The productive water use efficiency (WUEyield) was expressed as the mass of fresh grapes produced per m3 of applied water. Photosynthetic nitrogen use efficiency (NUEph) (ratio of photosynthesis rate to nitrogen content in the leaf) was also calculated [27].

2.7. Berry Composition and Berry Quality Index

Samples of mature berries were collected from each grapevine in September 2018, 2019, 2020, and 2021, when maturity was around 23–24 °Brix (coinciding with harvest) and transported to the laboratory. Harvest dates were determined on the basis of weekly analyses of grape composition total soluble solids (TSS) and acidity during the ripening period. Samples consisted of 800–900 g of berries, randomly collected from different clusters in each vine. Berries were crushed by an automatic blender (Coupe 550 G T), avoiding seed breakage. A first sub-sample of this crushed sample of grapes was centrifuged, and the juice was used for the analysis of pH, TSS (Digital Brix refractometer, HI 96801, Hanna Instruments, Smithfield, RI, USA) solutes per berry (g), titratable acidity, and organic acids (tartaric and malic), as described in detail in [26]. Yeast available nitrogen content (YAN) of must was also measured in 2021 using the Sörensen method [28]. A second sub-sample was used for the phenolic potential determination of the grapes, calculated according to the method described by [29] and [30]. We also calculated the berry quality indices (QIs) in Monastrell grapevines described by [26,31].

2.8. Microvinifications

Microvinifications (3 per clone) were performed at the end of the experiment in 2021. When there were enough grapes (>20 kg of grapes), microvinifications were carried out. This was only possible in five clones (in the control treatment): 4, 94, 276, 372, and 188. Then, grapes were weighted, destemmed, crushed, and distributed in 30-L tanks. Tanks were introduced in a cool room (4 °C) for 3–4 days to produce cryofermentation. After that, we removed the tanks from the cool room to increase their temperature, and selected yeasts (Sacharomyces cerevisiae, Laffort, DSM. Servian, France, 10 g of dry yeast/100 kg of grapes) were added to all of the vinifications. After this, all of the steps were conducted at 23 ± 1 °C during alcoholic fermentation (ALF). Throughout the pomace contact period (13 days), the cap was punched down twice a day, and temperature and must density were recorded. Later, a light pressing was carried out and wine was collected, deposited again in the tanks, and left to stand for a few days (6 days). After that, malolactic fermentation was started, applying 200 mL of wine lees and maintaining a temperature between 17–18 °C. After 20 days, wines were cleaned, protected with sulphurous (8 g SO2/100 kg grapes) and tartaric acids to correct the acidity, and bottled (750 mL) for a posterior analysis. They were analyzed at the end of the malolactic fermentation.

2.9. Wine Chemical Composition

Color intensity (CI) was calculated as the sum of the absorbances at 620 nm, 520 nm, and 420 nm [32]. CIELab parameters (lightness, L*; redness-greenness, a*; yellowness-blueness, b*) were determined by measuring the transmittance of the wine every 10 nm from 380 to 770 nm, using the D65/10° for the illuminant/observer, with 0.2-cm path length glass cells. The chroma (C*) and hue angle (h*) were calculated by the formulae C* = (a*2 + b*2)½ and h* = (tan−1 b*/a*). Total anthocyanins and total phenols were measured spectrophotometrically, following the methods described by [33] and [34], respectively. Wine quality index (QI) was calculated as it was previously described [31]. Anthocyanins and flavonol derivatives in wine samples were directly analyzed by HPLC-UV-VIS (mod. 1260, Agilent Technologies, Santa Clara, CA, USA). Chromatograms were recorded at 360 nm for flavonols and 520 nm for anthocyanins, according to the methodology described by [35]. Resveratrol was extracted with ethyl acetate, as described by [36]. Tannin levels were measured using methylcellulose as a precipitant, according to [37]. Total free amino acids in wines were determined by the AccQ Tag-ultra Ultra Performance Liquid Chromatography (UPLC) method (Waters, 2006, Waters, Milford, MA, USA), as described in detail in [38].

2.10. Determination of Volatile Aromatic Compounds in Wines

Analysis of volatile compounds in wines was performed by solid-phase microextraction (SPME) and gas chromatography-mass spectrometry, according to [39]. For the isolation of volatile compounds by SPME, a divinylbenzene-carboxen-polydimethylsiloxane 50/30 microns (DVB/CAR/PDMS) fibre was used. For the analysis of wine volatile compounds, 10 mL of wine, 3 g of sodium chloride, and 25 μL of the internal standard (2-octanol; 100 μg/L) were added to the same vial. The vial was loaded onto a Gerstel autosampling device (Gerstel GmbH & Co.KG, Mellinghofen, Germany). The program of the autosampling device consisted in swirling the vial at 500 r.p.m. for 15 min at 40 °C, then inserting the fibre into the headspace for 30 min at 40 °C, and thereupon transferring the fibre to the injector for desorption at 260 °C for 5 min. The conditions of the gas chromatograph and the mass spectra can be found in [39]. Injections were conducted in the splitless. MS was operated in electron ionization mode at 70 eV and in SCAN mode with the transfer line to the MS system maintained at 230 °C. Peak identification was carried out by comparing mass spectra with those of the mass library (Wiley 6.0) (Wiley Chichester, UK) and comparing the calculated retention indices with those published in the literature. The compounds that were positively identified were quantitatively analyzed by total ion current using the calibration curves proposed for each sample. All of the samples were analyzed in triplicate.

2.11. Statistical Analysis

Data were analyzed using analysis of variance (ANOVA) procedures, and means were separated by Duncan´s multiple range test, using Statgraphics v. 5.1 software (Statistical Graphics Corporation, Warrenton, VA, USA). A two-way ANOVA procedure was used to discriminate the effects of clone and irrigation treatment and their interaction. Linear and non-linear regressions were fitted using SigmaPlot 11.0 (Systat, Richmond, CA, USA).

3. Results

3.1. Period 2018–2020 All of the Clones Were Irrigated Using the Same Irrigation Strategy and Water Volume

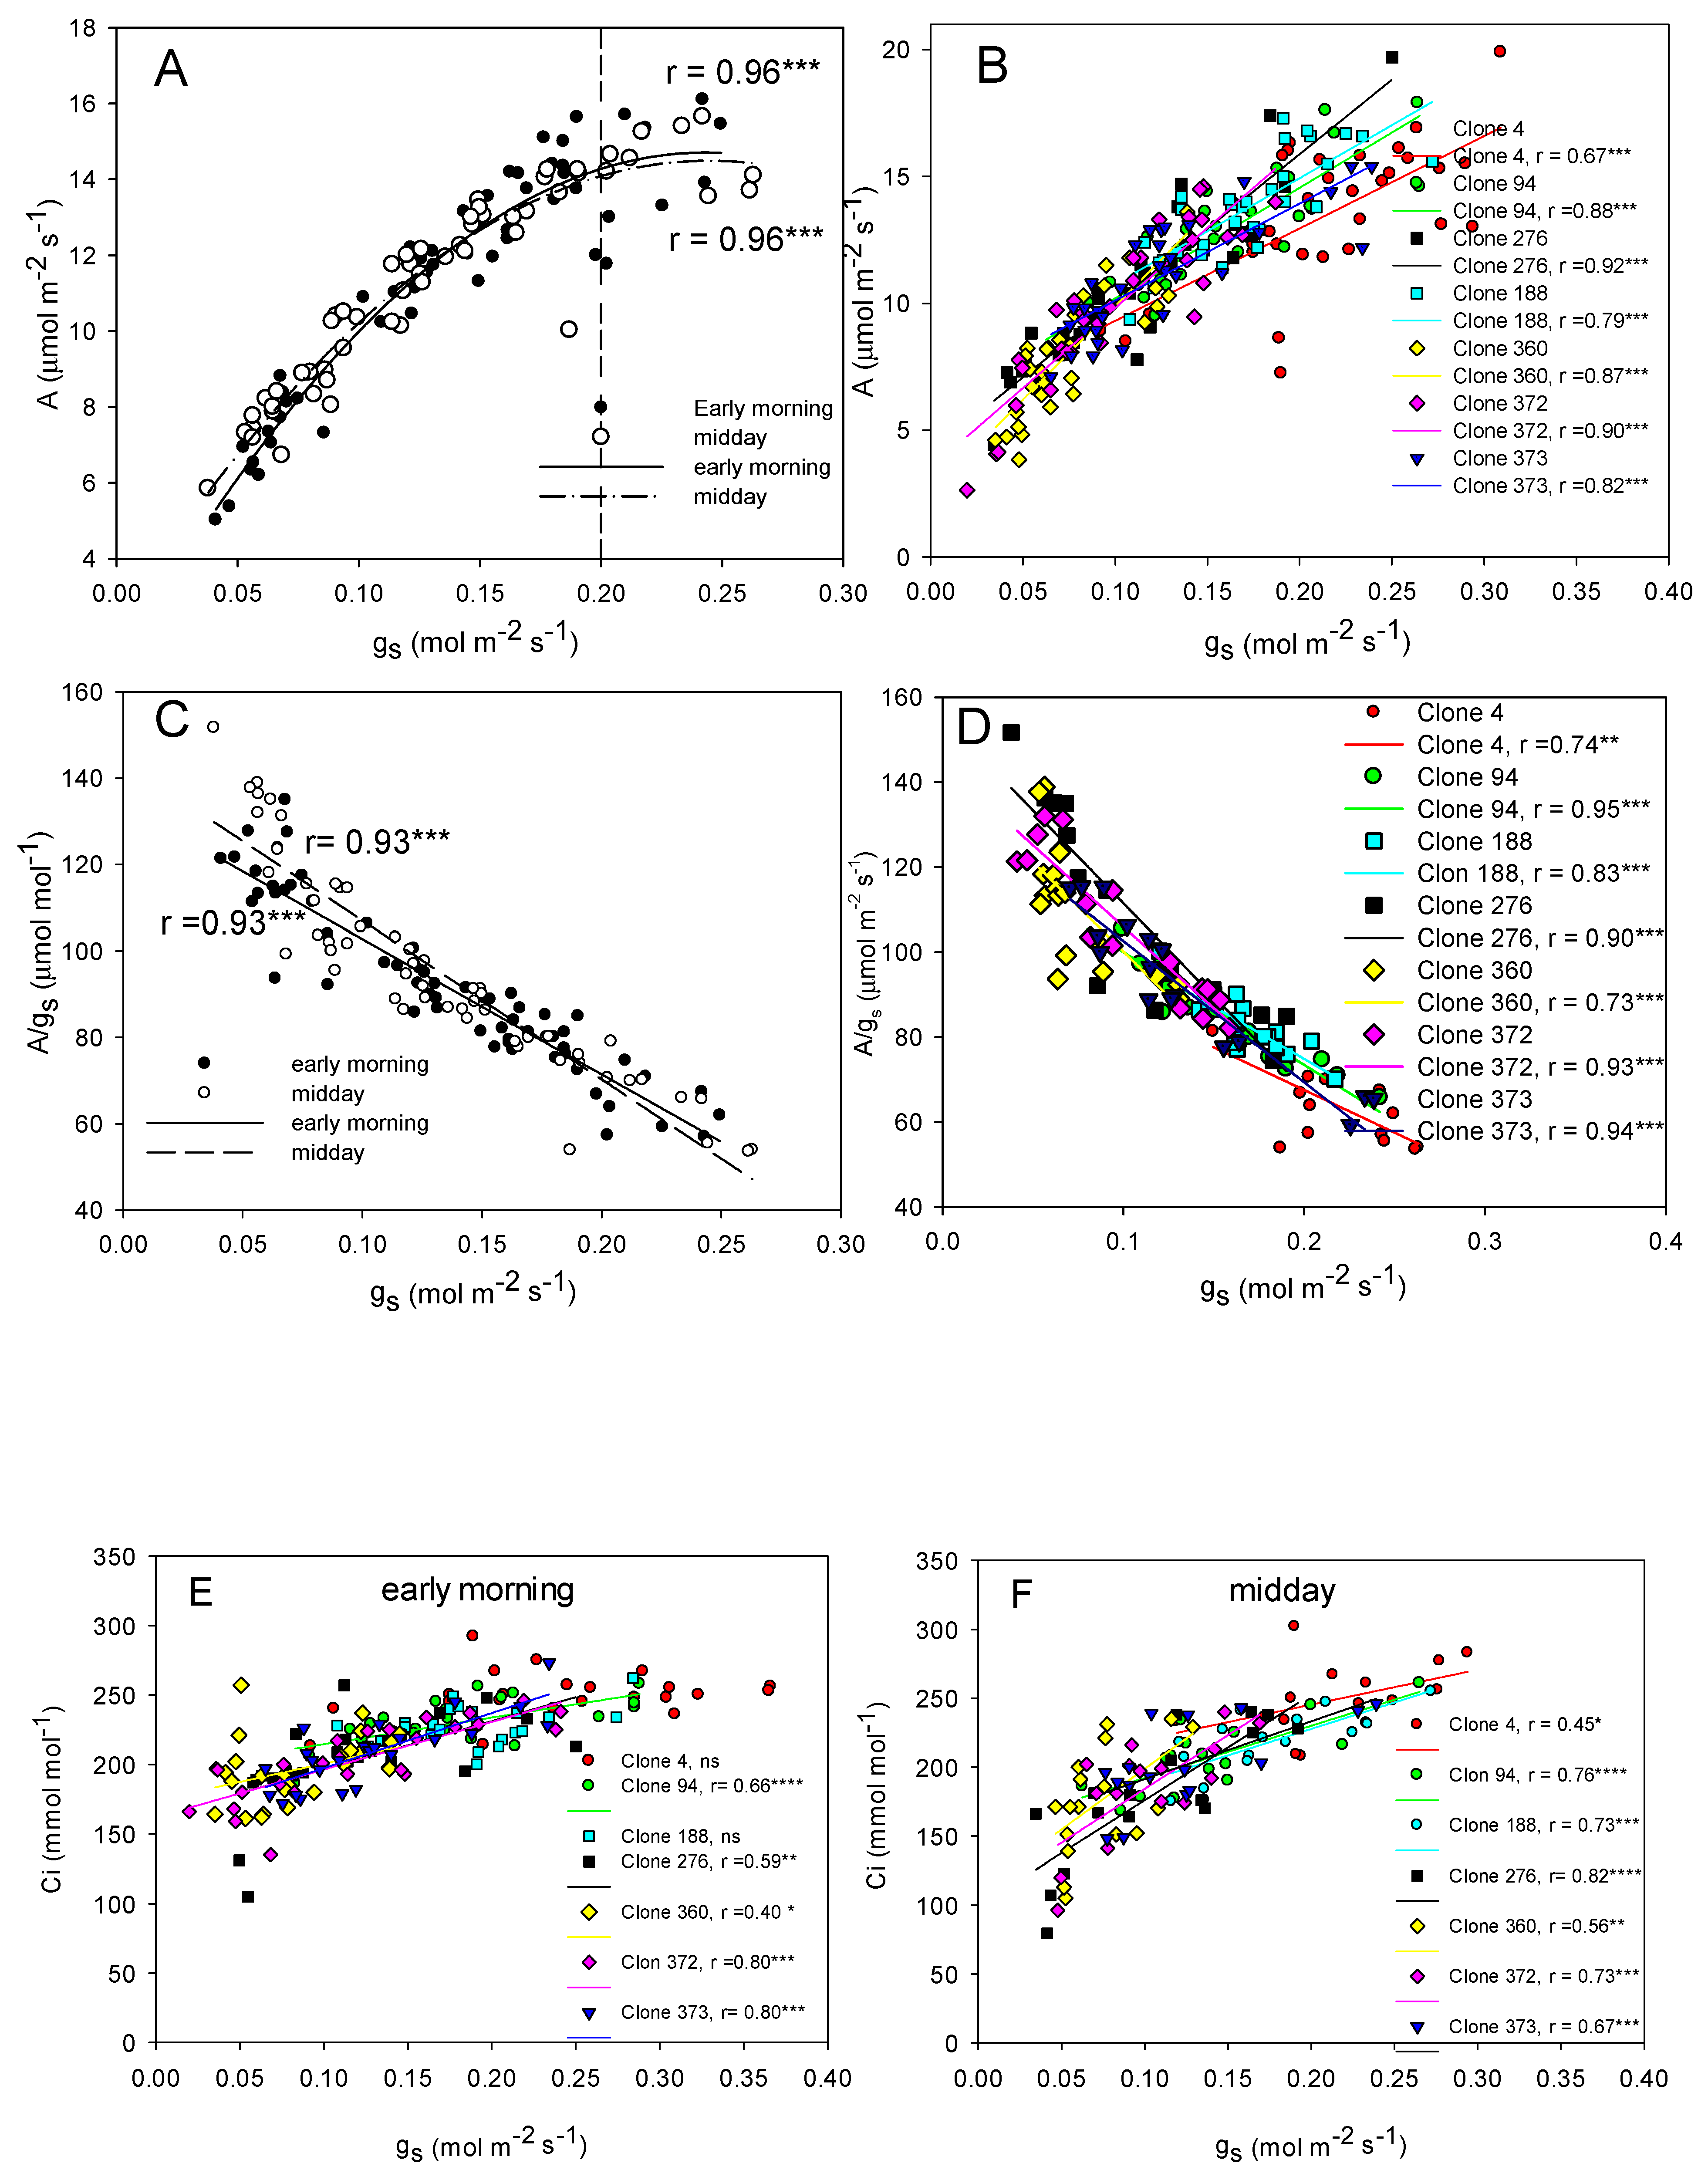
3.1.1. Vine Water Status and Leaf Gas Exchange

Clones 4, 94, and 188 maintained a better vine water status (measured by Ψs) and a greater gradient of water potential (ΔΨ) in the leaves (4 and 188) than clones 360, 372, and 276 (Table 3). This was also reflected in significantly greater rates of daily leaf gas exchange (A, gs, and E) maintained during the growing season, especially in clone 4, followed by clones 94 and 188, compared to clones 360, 372, or 276. These differences were more accentuated during the post-veraison period. In addition, Ci was also significantly higher in clones 4 and 94 (pre-veraison, 2020) and clones 4, 94, and 188 (post-veraison, 2020) compared to the rest of the clones (especially clones 372 and 360 with lower gs and Ci) (Table 3). Moreover, high-vigor clones (especially clone 4) were significantly more efficient in the photosynthetic nitrogen use (NUEph) than low-vigor clones, and particularly clone 360, which showed the lowest NUEph (Table 3).
Clone 4 was the least efficient in water use at the leaf level (lower A/gs, A/E), especially during the post-veraison period (2020), compared to 94 and 188 and even to the rest of the clones. In contrast, clone 360, the most water-stressed (followed by 372 and 276), showed the highest A/gs and A/E (post-veraison, 2020). In addition, carbon isotopic (δ13C) in berries, a surrogate parameter that acts as an indicator of long term WUE, was also significantly lower (more negative) in vines from clone 4 than in vines from other clones (Table 3). Conversely, clones 360, 372, and 276 showed the highest values of δ13C in berries (in 2019 and 2020). There were significant negative linear relationships between A/gs, WUEyield, A/gs, and yield (Figure 2A–D), between WUEyield and δ13C (Figure 2E,G), and between yield and δ13C (Figure 2F), and a significant positive linear relationship between A/gs and δ13C (Figure 2E).
Generally speaking, taking into account the average of two years, Ψs was not signif-icantly affected by water stress, except for two clones (4 and 276), which showed a signif-icantly higher Ψs under water stress compared to their controls (Figure 3A). In the otherclones, Ψs did not change substantially under water stress compared to the control. Thesignificant and positive linear relationship between ΔΨ in the leaves and leaf transpira-tion (similar in control and stress vines) suggests that, in general, vines with a greater E were associated with a greater leaf ΔΨ (Figure 3B). However, this positive relationshipwas only significant in clones 276 and 372 (Figure 3C). In addition, there were no signifi-cant differences in Kleaf among clones (Figure 3C).
Essentially, the stress treatment significantly decreased leaf gas exchange (A, gs, Ci) and increased A/gs in all of the clones during the pre-veraison period in 2020 (Table 3). However, during post-veraison, significant interactive effects in gas exchange parameters (A, gs, Ci, E, A/gs) indicated different leaf gas exchange regulation under water stress, depending on the clone (Table 3). Therefore, during post-veraison, vines from 276 and 373, under water stress, showed a significant decrease in A, gs, and E and an increased A/gs at the early morning compared to their control vines (Figure 4A–D). In the same way, at midday, clone 276 under WS had a strong decrease in A, gs, and E (38–52%) and an enhanced A/gs (38%) compared to its control. Other clones, such as 373 and 188, also restricted their leaf gas exchange at midday, but to a lesser extent; between 16% and 9.5% on average, respectively (significantly lower gs in 188 under WS compared to their Control) (Figure 4E–H). In other clones, there were no significant differences in leaf gas exchange between control and stress vines at the early morning or midday.
The significant relationships found between midday stem water potential (Ψs) and leaf gas exchange parameters (Figure 5) revealed that: (1) in general, low-vigor clones had lower Ψs than high-vigor clones (minimum around −1.7 MPa vs. 1–3 MPa, respectively); the point cloud is always leftmost (Figure 5A); (2) for the same Ψs, high-vigor clones showed a greater leaf gas exchange (A, E, gs) and lower (A/gs) than low-vigor clones, and this was accentuated by severe water stress (gs and A/gs) (Figure 5A,C,E,G); (3) clone 4 maintained greater gs for the same Ψs value, compared to the rest of the clones (Figure 5B); (4) clone 4 maintained greater gs when WS developed (lower slope); in contrast, in clones 188 and 373, leaf gas exchange decreased sharply when water stress developed (higher slope) (Figure 5B,D,F); (5), while clone 4 practically did not enhance A/gs under WS, clone 373 and mainly clone 360 linearly enhanced it when WS developed (Figure 5H). For values above −1.3 MPa, an abrupt rise in A/gs was observed.
The analysis of regulation of daily leaf gas exchange from the early morning to midday also showed that A and gs decreased more in clone 276 (16% and 18%, respectively) and in clone 94 (12% and 19%, respectively) compared to the rest of the clones (Figure 6). In addition, in these clones, E increased less from the early morning to midday (22–23%) compared to the rest of the clones (between 35–55%). These clones also showed a slightly greater increase in A/gs at midday compared to the rest of the clones, where A/gs decreased at midday (Figure 6). The analysis of the behavior of E (from the early morning to midday) for each clone under control and WS conditions also revealed different daily regulation of water use at a leaf level, with clones 4 and 188 showing significant increases at midday in E under control and water stress (Figure S1, supporting information), compared to the rest of the clones (with no significant differences). In addition, clones also had different seasonal regulation (from pre-veraison to post-veraison) of leaf gas exchange, with vines from clones 4 and 188 showing a lower seasonal stomatal regulation (significantly lower decrease in A and enhanced gs and E) compared to the rest of the clones (especially 276 and 360), where A, gs, and E decreased substantially as the summer progressed (Tables S1 and S2, supporting information). This is also supported by the positive linear relationship between E and the daily atmospheric vapour pressure deficit (VPD) during the season (Figure 7); this relationship was similar in all of the clones, except in clone 276, where E increased linearly as atmospheric VPD intensified during the summer in control irrigated vines, but it increased less in water stressed vines (less steep slope) (Figure 7A).
There were significant relationships between gs and A (positive, Figure 8A) and gs and A/gs (negative, Figure 8C) at the early morning and at midday. Moreover, a detailed analysis of these relationships indicated that for the same value of gs (between 0.10 and 0.30 mol m−2 s−1), clone 4 had a lower A than clones 276, 188, or 372, over all at higher gs (>0.15 mol m−2 s−1) (Figure 8B). In addition, for the same gs value, clone 4 also showed a lower A/gs compared to other clones; this effect was more accentuated with a low gs (Figure 8D). In addition, there were significant relationships between stomatal conductance (gs) and intercellular CO2 concentration (Ci) for each clone, except for clone 4, which showed an unchanged Ci for a wide range of gs (from 0.35 to 0.15 mol m−2 s−1) at the early morning, compared to the rest of the clones, where Ci decreased linearly as stomatal closure occurred (Figure 8E). This effect was more accentuated at midday, with clone 4 showing a lower slope (significant relationship), while in clones 276 and 372, Ci decreased most quickly as stomatal closure occurred (higher slope) (Figure 8F).

3.1.2. Leaf Mineral Nutrition

Leaf mineral analysis for the period 2018–2020 revealed that clone 276 had a significantly enhanced concentration of K and a decreased concentration of Mg compared to the rest of the clones (Table 4). Moreover, clone 360 had a significantly increased leaf Mg and Cu content compared to the other clones. Clones 360 and 4 also had a significantly increased leaf B content compared to the rest of the clones. In general, WS enhanced B concentration in leaves. Moreover, the analysis of the significant clone × treatment interaction indicated that WS significantly decreased leaf N and Mg content in clone 276 compared to their control, while K and Mg leaf content was increased by WS in clone 360. In contrast, WS decreased leaf K content in clones 373 and 188 (Table 4).

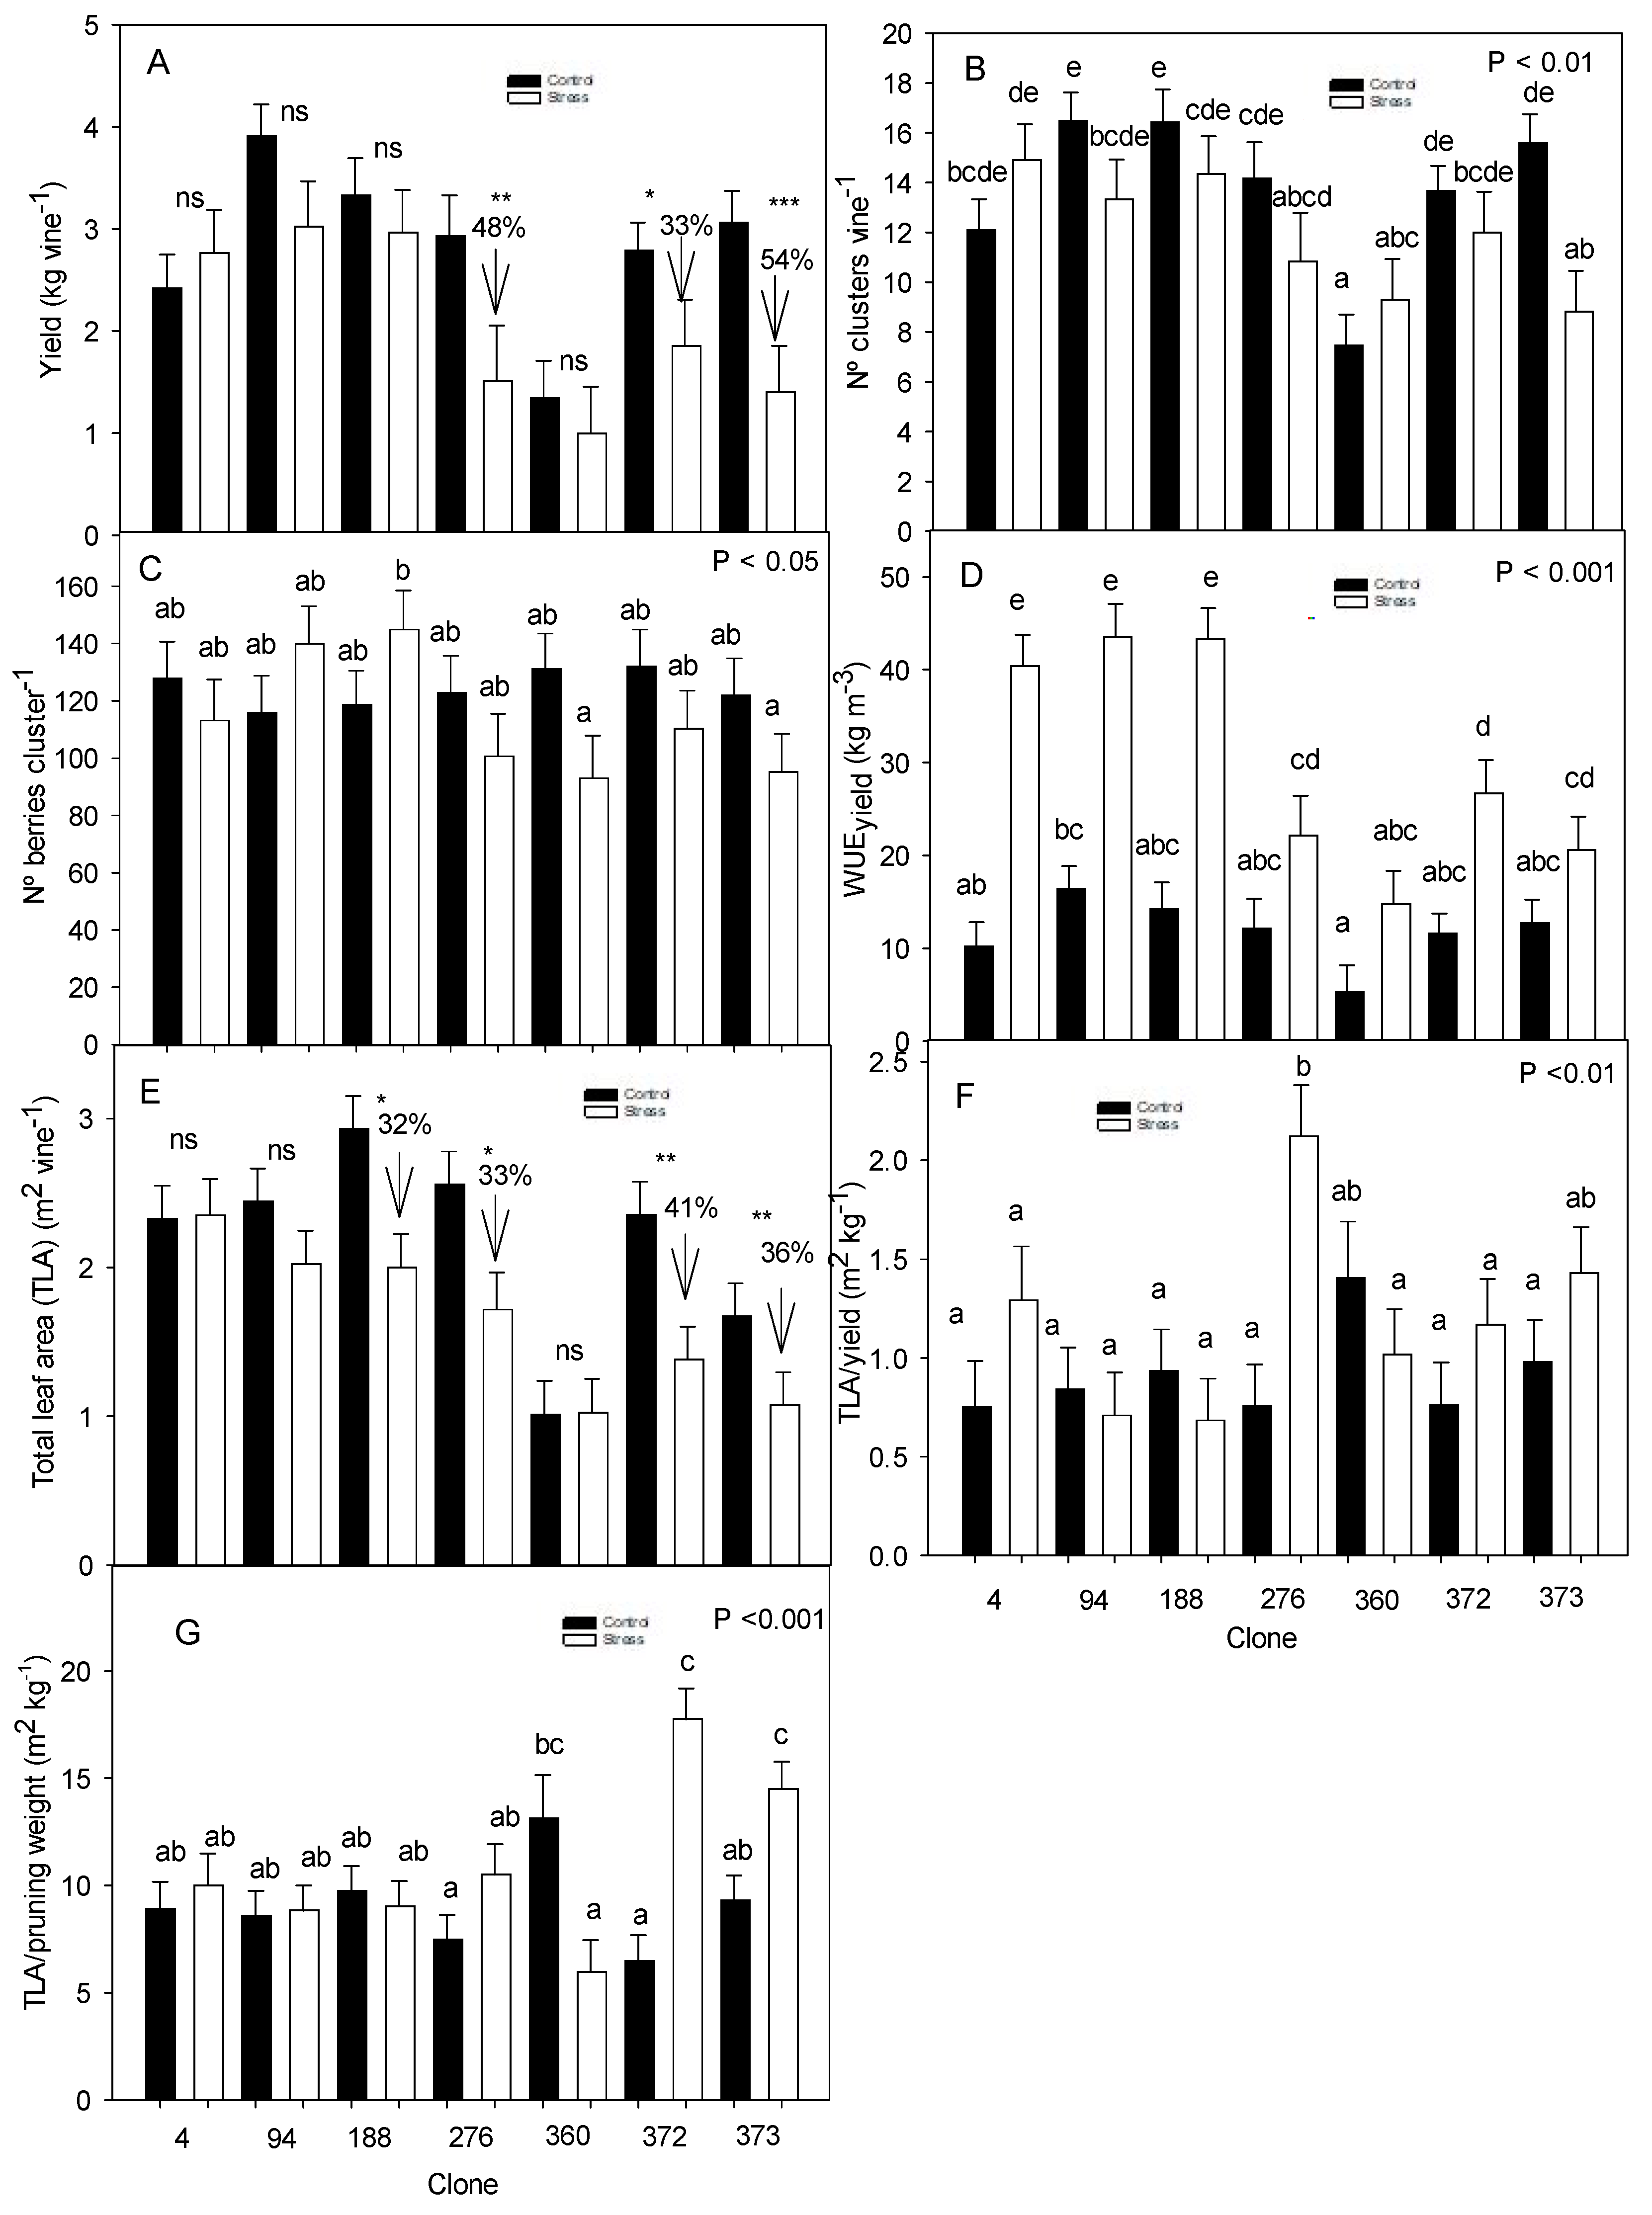
3.1.3. Vegetative Development and Yield Response

In the 3-year period (2018–2020), the most vigorous (greater TLA, pruning weight, and shoot length) and productive (higher yield) clones were 94, 188, and 4, in this order, and the least vigorous and productive was clone 360 (Table 5). The most productive clones also showed the highest WUEyield. All of the yield parameters were significantly affected by the clone, with clones 188 and 94 showing the highest number of clusters, cluster weight, and berry size compared to the rest of the clones, and clone 360 displaying the lowest values of these yield parameters and the lowest WUEyield. In addition, sink/source ratios indicated that clone 276, followed by 360 and 373, showed the highest TLA/yield ratios, and 188 and 94, the lowest ratios (Table 5). Furthermore, TLA/pruning weight ratio were lower in clones 276 and 94 compared to 372 and 373 (with the highest values) (Table 5). The analysis of the interaction indicated that under WS, yield was significantly reduced between 33–54% in clones 372, 276, and 373 (in this order) compared to their controls, mainly due to a lower number of clusters per vine (373), and a lower berry weight (372, 276) (Figure 9A–C, Table 5). Moreover, total leaf area decreased more under WS in clone 372, followed by 373, 276, and 188, significantly enhancing TLA/yield ratio (276) and TLA/pruning weight ratio (372, 373) (Figure 9E–G). The WUEyield significantly increased under WS in high-vigor clones (4, 94, and 188) and in low-vigor clone 372, compared to their controls, reaching a very high WUEyield of >40 kg m−3 (4, 94, 188) (Figure 9D).

3.1.4. Berry and Must Quality Parameters

The analysis of technological berry quality (period 2018–2020) revealed that high-vigor clones had significantly higher berry weight (188, 94), total acidity (4), malic acid (4, 94, and 188) and a higher juice percentage (94) than low-vigor clones (Table 6). In contrast, high-vigor clones had significantly lower pH (94), IM (4), and tartaric/malic ratio (4, 94, and 188) than low-vigor clones. Moreover, the lowest productive and vigorous clone (360) also showed the lowest berry weight and juice % and the highest TSS, pH, and tartaric acid, compared to the rest of the clones (Table 6). There was also a significant effect of WS in most of the berry technological parameters (decreasing berry weight, pH, malic acid, and juice %, and increasing tartaric acid and tartaric/malic ratio), but this depended on the clone (Table 6). There were significant interactive effects (clone × treatment) in berry weight (decreasing by WS in 372 and 276), pH (decreasing by WS in 188), malic acid (decreasing by WS in 360 and 188), and tartaric/malic ratio (increasing by WS in 360, 276, and 188).
Low-vigor clones also showed higher color intensity (373, 276, 360), seed maturity index, and tannins concentration (360) than high-vigor clones (94, 4) (Table 7). It is noted that high-vigor clone 188 had also a significantly higher polyphenol content compared to 94 or 372, and a similar polyphenol content than 360. Moreover, WS increased anthocyanins concentration in the must, compared to control, but this depended on the clone. Therefore, clones 372 and 94 under WS increased the concentration of total anthocyanins, and clone 360 under WS increased polyphenol content compared to their controls (Table 7). In addition, global berry quality indices (QI) calculated for the period 2018–2020 revealed that WS (compared to the control) significantly enhanced berry quality, regardless of the clone, but the improvement in QIoverall berry was greater in low-vigor clones (276 (48%) > 372 (25%) > 360 (24%) > 373(13%)) compared to high-vigor clones (188 (20%)> 94 (19%) > 4(10%)) (Table 8).
Clone 360 increased mineral content in the must (K, Ca, Mg, P, B, Mn, and Zn) compared to the rest of the clones (Table 9). In contrast, high-vigor clones (94 and 188) had the lowest mineral concentration, especially for K, Ca, P, Zn in clone 94 and Mn and Zn in clone 188. In general, WS significantly increased the concentration of P and B and decreased Cu in the must compared to the control. In addition, significant interactive effects also showed that low-vigor clones 276 under WS increased Ca, Mn, P, Zn, 372 under WS increased Mg, Mn, and B and decreased Cu, and 360 and 373 under WS increased B and P, respectively, compared to their controls. In contrast, in high-vigor clones 188, 4, and 94, WS significantly decreased K, Mn, and P, respectively, compared to their controls (Table 9).

3.2. Year 2021 Optimization of the Irrigation Water Volume for Each Clone

3.2.1. Vine Water Status and Leaf Gas Exchange

There were no clear differences in vine water status among clones (high-vigor vs. low-vigor) during 2021 (Table 3). However, it is noted that clone 4 (irrigated with less water than low vigor clones, Table 2), maintained a higher Ψs than the rest of the clones during the pre-veraison period in June and the post-veraison period in August (compared to 276). Moreover, leaf gas exchange in clone 4 was also significantly higher than in the rest of the clones during the growing season (even compared to high-vigor clones 188 and 94, irrigated with the same low water volume). This was specially accentuated during the post-veraison period (Table 3). In contrast, A/gs was significantly lower in clone 4 compared to the rest of the clones (pre-veraison) and clones 94, 276, and 372 (post-veraison).
Conversely, the lowest-vigor clone 360, irrigated with more water volume during the growing season in 2021 (between 85% more water than clones 372, 373, and 276 and 209% more than 4, 94, and 188), maintained a vine water status, leaf gas exchange, and WUEleaf similar to more irrigated clones, except for clone 4 (Table 3). In addition, clone 276 maintained a greater water stress and lower leaf gas exchange and higher WUEleaf (A/gs) during the growing season compared to other clones (especially in the post-veraison period).

3.2.2. Leaf Mineral Nutrition

The leaf mineral analysis in 2021 did not reveal great differences in leaf mineral nutrition (Table S3, supporting information). Therefore, clone 276 had a significantly higher leaf K concentration than 360, 372, 94, and 4, and a lower concentration of Mg (related to 360 and 188) and Mn (related to 373). In addition, WS enhanced leaf Zn concentration (276) compared to their control and significantly decreased the leaf Fe concentration (360 and 94) and Cu concentration (372, Table S3, supporting information).

3.2.3. Vegetative Development and Yield Response

In general, in 2021, there was a clear reduction in vegetative development and yield response in all of the clones (Table 5), probably associated with the lower water volume applied in some clones and a lower and anomalous rainfall in this year (Table 1). Despite being irrigated with less water, high-vigor clones (94, 188, and 4) maintained a significantly higher yield (number of clusters, cluster weight, number of berries per cluster) and WUEyield than low-vigor clones (276, 360, 373, 372). Compared to irrigated vines, yield reduction in high-vigor clones under stress (rainfed conditions) was around 43% (4), 24% (94), and 17% (188). In low-vigor clones, yield reduction under WS was between 21% (373) and 93% (276) compared to the control (data not shown).
Vegetative development (main shoot length and TLA) was also higher in high-vigor clones (especially in clone 4), compared to low-vigor clones (Table 5). Clone 360 was again the least vigorous (lower TLA, and SL) and productive (lower yield, number of clusters, berry weight) when compared to other clones. Clone 276 had a significantly enhanced TLA/yield ratio compared to the rest of the clones, particularly under WS, as a consequence of a drastic yield reduction. In general, in 2021, WUEyield decreased in all clones compared to the average 2018–2020, due to reduced yield (Table 5). However, in high-vigor clones (in the control treatment), WUEyield was substantially increased by 100% (4), 43% (94), and 36% (188), compared to the average of other years (2018–2020, in the control treatment), as a consequence of a decreased irrigation water volume in 2021. In low-vigor clones, except for clone 276 under WS, where WUEyield decreased drastically, in clones 372, 373, and 360, WS also enhanced WUEyield by 34% (372), 158% (373), and 165% (360) compared to their controls (data not shown).

3.2.4. Berry and Must Quality Parameters and Oenological Potential

In 2021, there were no significant differences in pH, total acidity, IM, and juice % among clones (Table 10). Moreover, vines from clone 360 (irrigated with more water in 2021, Table 2) showed a significantly lower berry weight and water percentage and a higher concentration of tartaric and malic acids and YAN than the rest of clones. High-vigor clones (4, 94, and 188), despite being irrigated with less water, showed a similar berry weight, a higher % water, and a lower TSS (188, 94) and tartaric/malic ratio (clone 4) than low-vigor clones (Table 10). WS also decreased berry weight, juice, and water percentages in a significant way compared to the control, but some of these effects depended on the clone. For example, WS significantly decreased the berry water percentage only in clones 276 and 372, and the juice percentage only in clone 276. Moreover, under stress conditions, clone 360 had significantly more malic acid than clones 372, 373, and 94 (Table 10).
The analysis of mineral composition of the must in 2021 revealed that clone 360 had the highest concentration of K, Ca, Mg, P, and Cu, and clone 276 had the highest concentration of Zn, significantly higher than the rest of clones (Table S4). In contrast, clone 373 had the lowest concentration of Ca and Mg. The significant interactions also indicated that WS enhanced the concentration of Ca (360), Mg (360, 372), P and Zn (276), and B (372, 276, and 4) compared to their controls. In contrast, WS significantly decreased Cu (372) and Zn (372, and 188) (Table S4).
The lowest vigor/productive clone, 360, also had the highest concentration of polyphenols, tannins, and TPI (Table 11). Indeed, seed maturity index was also the highest in this clone. In clone 276, the concentration of total and extractable anthocyanins was the highest this year. In contrast, clone 94 showed the lowest concentration of polyphenols and tannins compared to the rest of the clones. WS decreased tone and enhanced the concentration of total and extractable anthocyanins, polyphenol content, TPI, and tannins, although there were significant interactive effects (clone × treatment). Therefore, WS decreased tone in clones 372, 276, and 188, and enhanced the concentration of total anthocyanins in clone 276 and tannins in almost all of the clones (Table 11).
The berry quality indices in 2021 showed a significantly higher QItechnological berry in clone 373 under WS than control (Table 8). Indeed, QIphenolic berry was the highest in clone 360, followed by clone 276, and had its lowest values in clone 188. Additionally, WS significantly enhanced QIphenolic berry, regardless of the clone. Moreover, QIoverall berry significantly enhanced in clones 360 and 276, and had its lowest values in clones 188 and 94. The significant interactive effects also revealed that WS enhanced QIoverall berry in low-vigor clones (373, 372, and 276) between 75% and 88% compared to their controls, but not in high-vigor clones (4, 188, and 94, which were rainfed in 2021), showing a similar QIoverall berry than their controls (Table 8).
The wine chemical composition and their chromatic characteristics were also significantly affected by the clone in 2021 (Table 12). Thus, more productive and vigorous clones, such as clone 4, showed the highest alcohol content, but lower pH, color intensity, total anthocyanins and tannins, and a higher CIElab parameter L* compared to other clones. Other productive clones, such as clone 188, showed the highest pH and total anthocyanins, while clone 94 showed the lowest alcohol degree and CIElab parameter b*, and the highest concentration of some amino acids (Tyr, Met, Val, Ile, Leu, and Phe) (Table 12). In contrast, a moderate/low-vigor and productive clone such as 372 gave the highest color intensity, a*, and total tannins (Table 12). In addition, the concentrations of several individual derivatives of anthocyanins and flavonols were the highest in wines from clone 372 (quercetin 3-galactoside) and clone 4 (quercetin 3 glucoside + glucuronide, myricetin 3 glucoside + glucuronide). Conversely, concentrations were the lowest in 94 wines (Table 12). Mineral composition of wines also gave significant differences among clones, with clone 188 showing the highest K and the lowest Fe and Cu contents, clone 372 presenting the highest P and Na and the lowest Mg contents, and clone 4 with the highest concentration of Ca, Fe, Na, Mn, and Zn (Table S5).
The analysis of volatile aromatic compounds (VOCs) in wines revealed that alcohols and esters were the major groups in terms of the number and concentration of aromatic compounds, followed by volatile fatty acids, terpenes, and norisoprenoids (Table 13). Wines from clone 372 had the highest concentrations of total aromatic compounds, mainly alcohols (2-methyl 1-propanol) and esters (ethyl acetate). Clone 4 also accumulated a high concentration of VOCs (1-propanol, 1-hexanol, ethyl octanoate, 3-methyl tio 1-propanol, nerolidol, octanoic acid) compared to other clones. On the other hand, wines derived from clone 188 had the lowest total concentration of aromatic compounds, with a lower concentration of alcohols (2-methyl 1-propanol, 3-methyl 1-butanol, 1-hexanol) and a higher concentration of some esters (ethyl octanoate, ethyl dodecanoate, ethyl hexadecanoate), volatile fatty acids (decanoic acid hexanoic acid), terpenes (linalool, citronellol), and norisoprenoids (β-damascenone) compared to the rest of the clones (Table 13). Of the 17 odor-active volatile compounds described for Monastrell wines that can have a significant contribution to the Monastrell red wines aroma, 8 compounds were found in these wines (1-hexanol, 1-propanol, 2-phenylethanol, linalool, nerolidol, ethyl hexanoate, ethyl octanoate, ethyl acetate), all of them above odor thresholds values.
Taking into account the physiological and agronomical behavior of the clones under irrigated and rainfed conditions during the 4-year period, we conducted a classification of these Monastrell clones in accordance with three relevant aspects: (1) drought tolerance, (2) productive water use efficiency, and (3) berry and wine quality potential, looking for an optimum balance among these three traits (Figure 10).

4. Discussion

4.1. Traditional Monastrell Clones Show a High Variability in WUE

Our results show that the choice of the clone had a significant impact on the vine water status, leaf photosynthesis, and vine water use, vigor, productivity, WUE, and berry and wine quality of cv. Monastrell, indicating the existence of a great phenotypic plasticity among traditional Monastrell clones in SE Spain and confirming the presence of significant levels of intracultivar genetic diversity (a high variability) in this variety [21,22]. In the same way, a huge genetic variability between the clones with regards to their agronomic behavior and berry and wine composition has been found in other varieties (cvs. Tempranillo, Graciano, Sangiovese) [40,41]. Similarly, other studies demonstrated that even the few genetic differences existing among clones of the same cultivar (i.e., cv. “Nebbiolo”) can affect the physiological and agronomical aptitudes of the grapevine through fine transcriptional reprogramming events mainly linked to carbohydrate and secondary metabolic changes [17].
Our results indicate a specific clone–rootstock interaction when comparing abiotic stress tolerance (e.g., drought tolerance), water use efficiency, and oenological potential in different cultivars, as it has been previously described [9,10]. It is important to note that large differences in A, gs, and E (vine water use) were observed among Monastrell genotypes (Table 3), which demonstrates that some genotypes present large fluxes of CO2 and water, and others, low gas exchange fluxes, as observed in clones from other varieties [12,13]. Therefore, clones also play an essential role in the water stress response in grapevines.
Although the rootstock plays a central role in the improvement of water use efficiency (WUE) [26], this study also shows a great variability in WUE among Monastrell clones at a leaf level (WUEleaf) (average A/gs of 65–137 μmol mol−1, Table 3) and a plant level (average WUEyield between 10–30 kg m−3, δ13Cberries, −24–−27 ‰, Table 3 and Table 5), indicating that intracultivar clones constitute a major source of variation in water use efficiency, as was also observed in different varieties [11,12,13,14,15]. The most productive water use-efficient clones (94 and 188, Table 5) showed very high WUEyield values (28–30 kg m−3), similar to the highest found in cv. Gaglioppo in Italy (9–29 kg m−3) [42].
The values of WUEyield reported in field-grown deficit irrigated grapevines vary widely depending on the rootstock and the edaphoclimatic and irrigation conditions [43]. In Monastrell vines grafted on different rootstocks in SE Spain, they ranged between 9–18 kg m−3 [26]. It is noticed that with the same irrigation water volume (around 80 mm year−1, Table 2), and similar soil conditions, these traditional Monastrell clones (in the control treatments) reached WUEyield values up to 14–16 kg m−3 (clones 188, 94, respectively) (Figure 9D), substantially higher than those obtained from a commercial Monastrell clone grafted on the same rootstock (110R) (10.47 kg m−3) and in the same experimental and soil conditions [26]. Probably, more demanding climatic conditions in the 2012–2016 period in the rootstock experiment (VPD 1.00 kPa, ETo 1240 mm year−1 and a lower rainfall, with 302 mm year−1) compared to the 2018–2021 period in the clone experiment (VPD 1.16 kPa, ETo 1095 mm year−1 and a higher rainfall, with 393 mm year−1) may also help explain these differences in WUE. Moreover, the very high WUEyield (>40 kg m−3) reached in high-vigor clones (94, 4, and 188) under WS (Figure 9D) indicates that these clones are very productive with very little irrigation water (23 mm year−1, Table 2), suggesting a greater drought tolerance and water use efficiency than in low-vigor clones. Future research combining high-WUE drought tolerant rootstocks (e.g., 140Ru) [26] and these high-WUE drought tolerant Monastrell clones (e.g., clones 4 or 188) under semi-arid-deficit irrigation (DI)/rainfed conditions would be necessary, because it could reduce reliance on supplemental irrigation and make vineyards more sustainable in semi-arid areas, even for dry farming.
In spite of low water irrigation volumes (Table 2), physiological indicators (Ψs and gs) were, in most of the clones and years, within the optimum water stress ranges and thresholds that were proposed (moderate water stress, −1.2 > Ψs > −1.4 MPa and 0.15 > gs > 0.05 mol m−2 s−1) in order to avoid severe damage in DI vineyards [44,45,46]. It is also noticed than high-vigor clones, such as 4, 94, and 188, were the most water use efficient vines from a productive point of view (WUEyield, Table 5), but were the least efficient at the leaf/organ level (the lowest A/gs, A/E, δ13Cberries, Table 3), whereas the opposite effect was observed with low/medium vigor and less productive clones (360, 373, 372, and 276). This is also supported by the significant negative linear relationships found between A/gs, δ13Cberries, yield, and WUEyield (Figure 2). δ13Cberries, which integrates the entire grape ripening period, confirmed that the most negative genotypes (4, 94) had a lower WUEleaf (A/gs) and suffered lower WS. Meanwhile, 276 and 360 showed the least negative values (−24‰) and higher A/gs, which is indicative of a greater WS [15,47].
Significant relationships between long-term A/gs and WUEyield have been also found in Monastrell and other grapevine varieties [13,48,49,50]. In our study, improvements in WUEyield were not related to an increase in A/gs (Figure 2A,C). A significant positive relationship was found between A/gs and δ13Cberries, as reported in different grapevine genotypes [14,15]. The agreement found between A/gs and δ13Cberries (Figure 2E), better than with WUEyield (Figure 2C vs. 2G), as has also been found in other varieties (cv. Grenache) [13,15], indicates that WUEyield, which refers to the fraction of carbon that is translocated into yield, does not only depend on purely physiological factors. Rather, carbon partitioning and sink/source adjustments due to different resources distribution and a different response to environmental conditions (i.e., VPD) could have been involved [15,50]. For instance, as a consequence of a reduced plant carbon gain, low-vigor clones under WS reduced yield by around 48% (276), 54% (373), and 33% (372) (compared to their controls, Figure 9A) and modified sink/source ratios, showing a higher TLA/yield ratio (276) and TLA/pruning weight ratio (372, 373) than high-vigor clones (188 or 94), which indicates that low-vigor clones distributed more resources towards leaf area development than towards yield or above-ground biomass accumulation (pruning weight) (Table 5). Therefore, these genotypes would be capable of establishing a high leaf area in spring and then have a strong stomatal control when water is not available (summer) [12].

4.2. Clones Show Different Hydraulic Behavior, Stomatal Regulation, and Vine Water Use

Vitis species possess the ability to show different strategic behaviours in response to drought [51]. In our study, differences in the gs–Ψs and A–Ψs, relationships (Figure 5B,D) indicate a different stomatal regulation among Monastrell clones, as observed in other varieties [15]; for instance, for the same Ψs, high-vigor clones (4 and 188) maintained higher gs than low-vigor clones (276, 360, 373). Moreover, some clones displayed a tighter stomatal control and tended to close their stomata earlier than others when water stress developed (e.g., clones 188, 94, 373 or 276 had higher slopes, between 0.19 and 0.28, data not shown, vs. clone 4 with a lower slope of 0.062, data not shown) (Figure 5B). Slopes higher than 0.25 in gss relationship have been related with a tight stomatal regulation in winegrapes [15,52].
A tighter and earlier stomatal closure indicates a short-term cost-effective strategy (stress avoidance strategy) that slows the dry-down by decreasing water loss by transpiration [53,54,55]. These genotypes are considered “plastic”, due to their ability to modify their performances under different environmental conditions [56]. Moreover, reducing the canopy size could provide another excellent emergency strategy for vineyards that face extreme drought [54]. Clones with smaller canopies and, as a consequence, a reduced transpiratory surface (especially 360 and 373), substantially reduced vine water use under water stress, also releasing water tension in the xylem and saving water [53]. Interestingly, WS reduced TLA in low/medium-vigor clones (276, 360, 373) between 33–41% (compared to their controls), while high-vigor clones (especially 4, 94) did not reduce TLA under WS (Figure 9E).
Despite an increased stomatal closure and reduced leaf area, Ψs was also substantially reduced in these vines (near-anisohydric behavior), contrary to the response that is frequently observed in anisohydric species [55,57]. However, a tight regulation of Ψl is not necessarily associated with a greater stomatal control nor with a more constrained assimilation during drought [58]. Variation in (an)isohydry may result from a slight deviation in the balance between transpiration rate (controlled by stomatal aperture) and whole plant hydraulic conductance. Therefore, the drop in water potential may suggest that hydraulic conductance is limiting water transport on the path from the soil through the plant to the leaves [53,59], and it is not enough to offset the water losses by transpiration. Indeed, a lower gs may also be the result of hydraulic signalling, e.g., changes in plant hydraulic conductivity [60].
The higher anisohydric behavior (greater water stress) and greater water loss control (i.e., tighter stomatal regulation of E and reduced plant transpiratory surface) experienced by these low-vigor clones would indicate that they were the most sensitive clones to drought conditions and put into play more water conservation mechanisms under water stress. It is also noticed that clone 276 presented the highest sensitivity to water stress among all of the clones for several reasons: under water stress, it had a tighter stomatal regulation of transpiration (Figure 10A) and a significantly lower leaf N and Mg content (below optimum values, Table 4), which could have a higher effect on photosynthetic activity (approximately 40% of A reduction at the early morning and midday, Figure 4A,D), a greater yield reduction (48%, Figure 9A), and lower Ψs (more negative), juice, and water percentages in the berries (2021) (Figure 3A and Table 10).
In contrast, high-vigor Monastrell clones (4, 94, 188) showed a nearly-isohydric behavior and maintained a better vine water status (measured by Ψs and gs) during the growing season, which suggests a greater root water uptake/water transport capacity and irrigation efficiency in invigorating clones compared to low-vigor clones [26], despite being grafted on the same drought-tolerant rootstock (110R). In addition, high-vigor vines maintained a higher plant carbon assimilation (higher leaf gas exchange and total leaf area, Table 3 and Table 5) during the growing season and had a higher water spending under irrigated and non-irrigated conditions (Figure 4). These genotypes (especially clones 4 and 94) showed an “elastic” behavior, as they maintained unchanged A and WUEleaf levels (A/gs) under both well-watered and water-stressed conditions [56]. The lower disposition to a rapid stomatal closure and the maintenance of a higher stomatal aperture in high-vigor clones (e.g., clone 4) did not translate into substantial reductions in Ψs, contrary to what was observed in other varieties (cv. Syrah) [61]. Greater E, leaf ΔΨ, and leaf area development (e.g., clones 4, Table 3 and Table 5) would also suggest an enhanced whole plant hydraulic conductance that is able to offset the water losses by transpiration, maintaining a high Ψs (less negative). Nevertheless, the an-(isohydric) classification has been called into question [62], as recent analysis shows that a continuum exists in the range of stomatal sensitivities to water stress in V. vinifera, rather than an isohydric–anisohydric dichotomy, that is further enriched by the diversity of scion–rootstock combinations [63] or even depending on the intensity of the water deficit [64].
It is also noticed that the same physiological patterns were repetitively encountered when water was substantially restricted in these clones (year 2021). The same groups of high-vigor clones maintained a better water status and a greater stomatal aperture and leaf gas exchange and were systematically more productive and the most efficient (WUEyield) despite watering with less water, while low-vigor clones (irrigated with more water, Table 2) maintained a lower leaf gas exchange and leaf area and were less efficient (Table 3 and Table 5). This suggests that those differences are truly fixed at a genetic level, regardless of ambient/irrigation conditions, as observed in clones from other varieties [11]. It is still unclear which of the two, iso/anisohydric, represents cultivars that are better adapted to drought, but a major factor associated with water deficit tolerance in other Vitis genotypes (e.g., cv. Ramsey, Cabernet Sauvignon/M4) was associated with the maintenance of a better water status in the vine and a higher stomatal conductance and photosynthesis during soil water deficit, as a consequence of a greater rooting depth and a higher uptake of water from the soil [65,66]. Indeed, during the highest evaporative demand period, high-vigor clones 94 and 188′s vines showed a different physiological behavior compared to those of the high-vigor clone 4: (1) a more anisohydric behavior (more vine water stress during the growing season), (2) more efficiency at the leaf level in the short term (higher A/gs) and the long-term (higher δ13C), and (3) a stronger stomatal regulation of gas exchange and water use (seasonal and daily). Thus, clones 94 and 188 behaved like more water saver clones compared to clone 4, which was the highest water spender and the least efficient at the leaf (A/gs) and plant (WUEyield, δ13Cberries) levels. Indeed, when irrigation water was reduced in 2021 (Table 2), vines from clone 4 continued to systematically maintain a greater leaf gas exchange and total leaf area, and a better vine water status than clones 94 and 188 (Table 3), which indicates a greater drought tolerance and suggests that this clone can be more adequate for rainfed conditions or more severe DI strategies.

4.3. Clones Differ in Their Photosynthetic Ability and Their Sensibility to Atmospheric VPD and Soil Water Deficit

The significant and close relationships between gs and A (positive), and between gs and A/gs (negative) indicate that differences in A among clones come mainly from differences in stomatal control (Figure 8 A–D). In addition, the gradual linear reduction of Ci as water stress developed and stomatal closure occurred (Figure 8E,F) would also indicate that the decreased CO2 availability in the mesophyll was mainly due to stomatal limitation (by stomatal closure) in this range of moderate water stress. In grapes, the photosynthetic machinery appears to be very tolerant to mild, and even medium, levels of water deficit, and it seems that non-stomatal limitations become dominant only when grapevine gs falls below 0.05 mol m−2 s−1 [67], something that was rarely observed in this study (Table 3). Our results support that there is a high degree of co-regulation in the plant to cope with water deficits through their stomata, thus providing multiple layers of regulation to balance water loss and CO2 assimilation in dry environments and under moderate water stress [54].
However, a more detailed analysis about the specific A/gs-gs and A-gs relationships established for each genotype (Figure 8A–D) indicated that for the same gs value (mainly at high gs range), A was systematically higher in clones 372, 276, or 188 (Figure 8B) (in this order, with greater slopes, 63.20, 58.71, 41.84, respectively, data not shown) than in clone 4 (lower slope, 36.45), suggesting also that some variability exists in the photosynthetic capacity among clones, regardless of the stomatal control. The absence of differences in N, Ca, or P content of leaves among clones does not indicate differences in photosynthetic machinery [27] (e.g., chlorophyll content), but could rather be related to differences in leaf CO2 diffusion capacity (not gs, but mesophyll conductance), or in the biochemical properties of the leaf (higher Rubisco content or more efficient Rubisco) [11,68]. However, leaf content of Mg did increase with more severe water stress (clone 360). These results confirm those obtained from other grape varieties [69]. At veraison, although N, P, K, Ca, Cu, B, and Zn values were low in all of the clones and close to the lower limits of the optimum ranges proposed for whole grape leaves in irrigated vineyards [70], there were no leaf deficiencies of these elements in this low-input vineyard.
Clone 4 also maintained a higher and more constant Ci than low-vigor clones at early morning and midday as stomatal closure occurred (276, 372, 360, higher slope), and, for the same gs value, Ci was higher in clone 4 than in other clones (Figure 8E,F). Photosynthetic intensity is related to Ci [27], so a greater Ci in clone 4 suggests that there is a greater stomatal aperture and CO2 availability in the carboxylation sites and could explain the greater A. Moreover, high-vigor clones (especially clone 4) were also more efficient in the photosynthetic nitrogen use (NUEph) than low-vigor clones. However, it is also noticed that for the same value of gs, (overall at high gs), maintaining a lower A and a higher Ci (clone 4), compared to higher A and lower Ci (e.g., clones 276, 372) (Figure 8), would indicate a higher photosynthetic efficiency in low-vigor clones (276, 372) than in clone 4, which can adapt their photosynthetic machinery to maintain high and fairly constant CO2 partial pressure inside the leaf.
A decreased gs as a consequence of water stress increased A/gs differently depending on the clone (Figure 8D). This gs vs. A/gs relationship may provide the sensibility of each clone to water deficit according to the slope of the linear regression obtained from this relationship; thus, a lower slope means a lower sensibility of the clone to water deficit [12]. Therefore, clone 4 had a lower slope (−200.87, data not shown) and was less sensitive to water deficit than clones 276 (−437.63) or 372 (−383.08), which were the most sensitive clones to water deficit (Figure 8D). This was also supported by a higher berry δ13C (less negative) and transpiration use efficiency (A/E) (assimilation per unit water transpired) in low-vigor clones (Table 3). Consequently, it appears that the low–moderate vigor genotypes may improve transpiration use efficiency as well as the expected reduction in total transpiration due to the lower canopy size [71].
Interestingly, Monastrell clones also differed in their response to atmospheric VPD (Figure 7). Therefore, E became more responsive to VPD as the water stress intensified. This led to a progressive change in the response of E to VPD, from a greater increase of E at a high VPD in control plants (higher VPD drove E when stomata were open) to a lower increase in E at a high VPD in water stressed plants, mainly in clone 276, followed by 372 (the most drought-stress responsive clones) (Figure 7), as previously found in other grapevine varieties [72,73].

4.4. Low-Vigor/Productive Clones Enhance Berry and Wine Quality and Aromatic/Nutraceutical Potential Compared to High-Vigor/Productive Clones

It has been reported that, traditionally, high vine vigor and yields are associated with grapes and wines of low quality [74]. In this way, high-vigor and productive clones 4 and 94 gave the highest berry weight, but a poorer final berry technological and phenolic quality (lower QI scores), mineral content, and color intensity in the must and wine compared to other clones, and this may, in part, have been due to a greater dilution phenomenon (lower skin/pulp ratio and higher % juice and H2O in 2021). In addition, a higher acid malic concentration in the berries from high-vigor clones (specially in clone 4, Table 6) could be due to a higher leaf area development and lower cluster exposure to direct solar radiation and, as a consequence, lower berry temperature, decreasing malic acid degradation [75].
In contrast, the most water stressed clone was the least productive and vigorous one (clone 360) and showed the highest SM index, concentration of YAN, mineral content, and tannins, in addition to higher QIs (berry quality indices) in the must (Table 6, Table 7, Table 8, Table 9, Table 10 and Table 11) than the rest of clones. This was probably due to a greater concentration effect as a consequence of a significantly lower berry weight/size (higher skin/pulp ratio), lower must and H2O percentages, and modifications in grape microclimate [20] (Table 5, Table 6 and Table 10). Despite a greater WS, clone 360 had a higher concentration of YAN, above 180 mg L−1, which may be positive for aromatic precursor concentrations in must and in aromas in wines [69]. Nevertheless, a greater tannins concentration and SM index (that measures the contribution of seeds to the total amount of polyphenols, mainly tannins from seeds), as also observed in clone 360, would indicate a higher risk of a negative effect on the flavour of the wine (e.g., a greater sensation of astringency or bitterness) [30]. Under water deficit, an increase in proanthocyanidin (tannins) concentration has been observed in seeds and skins in different varieties [76,77,78,79]. Moreover, clone 360 had a greater pH and malic acid in the berries, which can also be harmful for wine quality [79].
Other clones that were more productive and presented a higher quality with a lower pH, malic acid, and tannins content, and a higher tartaric/malic ratio and MI were clones 276 and 372, which were also the most sensitive to water deficit and those that showed a greater control of water loss. Under water stress, these clones also enhanced mineral content in the must and wine. A higher mineral concentration in the must and wine (360, 276, and 372, Table 9 and Table S5) can also indicate a greater osmotic potential regulation as a consequence of a greater water stress [80]. The concentration of mineral elements in wines (Mg, K, Fe) was similar to that found in other wines from different Monastrell clones from this region [19]. Clones 276 and 372 also showed a higher glycerol content in wines (>10 g L−1, Table 12). Glycerol may have a positive contribution to wine quality and has been implicated in mouthfeel sensations by conferring sweetness and fullness to wine [30].
In addition, wines from a low/medium-vigor clone (372) and a high-vigor clone (188) also showed a darker color and a higher polyphenolic content compared to wines from other clones (Table 12). Similarly, [19] reported that Monastrell clone 188 provides wines with good color characteristics (high color density and b*, and low L*) and a high content of tartaric acid. Moreover, the concentrations of several individual derivatives of flavonols in the wines were the highest in wines from clone 372 (quercetin 3-galactoside) and clone 4, which showed the highest nutraceutical potential, being the lowest found in clone 94 (lower nutraceutical potential) (Table 12). These compounds are involved in the long-term color stability of red wines and in the improvement of organoleptic properties and associated health benefits [81].
There were also significant changes in volatile composition in wines from Monastrell clones and, as a consequence, in organoleptic characteristics, as previously reported [18]. Therefore, wines from clones 94 and 4 had the worse aromatic profile, with a higher concentration of alcohols (e.g., propanol, hexanol) compared to wines from other clones (Table 13). This can bring a pungent and strong odor to wine (grass and green, herbaceous, harsh, ripe fruit, woody nuances) [82,83,84,85]. Indeed, 372 wines had the highest concentrations of total aromatic compounds (mainly alcohol and esters), whereas 188 wines were the least aromatic wines. High-quality wines have volatile profiles without extreme concentrations [86]. In our study, wines from clone 372 had a higher 2-phenylethanol content (aromatic alcohol with a rose aroma) which could have a positive impact on the “floral” notes of grapes [79]. Moreover, wines from clone 188 showed some positive aromatic traits, such as a lower concentration of alcohols and a higher concentration of some esters (ethyl octanoate, ethyl dodecanoate), terpenes (linalool and citronellol), and β-damascenone (Table 13) [85,87]. Volatile aromatic compounds (including terpenes) are secondary metabolites and are believed to play critical roles in plant defence against abiotic and biotic stress [88].

4.5. Clone Classification According to Drought Tolerance, Vine Performance, and Oenological Potential

Drought tolerance is defined as the ability of plants to sustain a certain level of physiological activity through the regulation and fine tuning of thousands of genes and various metabolic pathways to minimize the resulting damage; it involves cell-to-cell to whole-plant level hydraulic or metabolic readjustment and hormone signalling able to control growth under water deficit [89]. However, when we look at crop plants, the features that confer drought tolerance are far from clear. Compared to the situation of plants growing in the wild, which can only rely on their repertoire of weapons and solutions to cope with stresses, crops in agriculture can be protected through human intervention (irrigation, fertilizer application, disease control, etc.). As a result, plants can take a competitive growth strategy, rather than a stress tolerant or ruderal strategy [90]. The main reason for this contrast is that the traits we associate with drought-tolerant species (xerophytes) typically concern survival during drought, whereas with crops we are concerned with production; insofar as the term “drought tolerance” has any useful meaning in an agricultural context, it must be defined in terms of yield in relation to a limiting water supply [91]. Thus, from the point of view of agriculture, drought tolerance must comprise not only the ability to cope with a stress factor, but also the capacity to maintain productivity (the achievement of a stable yield and good quality) within the current season and in the long-term, and equally the ability to avoid negative carry-over effects, and perhaps drought-induced mortality, across many seasons [54,55]. In addition, a more drought-tolerant plant would be able to maintain its stability and homeostasis better and longer under soil water deficit, and this will probably be acquired through different mechanisms [46]. As in winegrapes the main concern is not to reach a high productivity and water saving, but rather to achieve the highest quality of grapes for premium red wine production, maintaining an optimum yield and ensuring economic returns to the grower [50], in this study, we have classified Monastrell clones in accordance to three relevant aspects: (1) drought tolerance, (2) productive water use efficiency, and (3) berry and wine-quality potential, looking for an optimum balance among these three traits (Figure 10B).
In conclusion, taking into account the physiological and agronomical behavior of the clones under irrigated and water stress conditions, this study has revealed the following: (a) The most drought tolerant clone (i.e., clone 4) was not necessarily the most productive (8600 kg ha−1), the most water use efficient (average of 25 kg m−3), nor the one that presented a better grape and wine quality (Table 8, Figure 10). This clone had a different physiological behavior than the rest of the clones and did not show water conservation mechanisms under water stress conditions, being classified as a water spender (with an optimistic behavior); (b) The most productive and efficient clone (i.e., clone 94) (11,566 kg ha−1, average WUEyield of 30 kg m−3) was also a drought-tolerant clone, but presented the highest yield and berry weight and the worst berry and wine quality, with the lowest polyphenolic concentration and aromatic/nutraceutical potential. Moreover, under lower irrigation volume (2021), both clones (94 and 4) enhanced WUEyield by 41% and 97%, respectively (compared to the average WUEyield for 2018–2020), but did not improve QIs. Thus, they are not recommended for premium red wine production, but for producing a high production of grapes and wine with very little irrigation water and with medium to low berry/wine quality; (c) In contrast, the clone with the lowest vigor, 360, granted the highest berry quality, but at the expense of a greatly reduced vigor and yield (4000 kg ha−1), a lower WUEyield (average of 10 kg m−3), and certain negative berry quality attributes such as a high pH and a high content of tannins and malic acid; thus, it is not recommended in these semi-arid conditions; (d) Low/moderate vigor clones 372 and 276 were the most sensitive to drought conditions and put into play more water conservation mechanisms, such as a greater stomatal control of transpiration and a greater reduction of leaf area, in order to reduce vine water loss in conditions of soil water deficit and high VPD (Figure 10A). In addition, these clones reached an equilibrium between the three traits: they showed moderate yields (7400–7700 kg ha−1), a high WUE (average between 17–19 kg m−3 applied water), and a high-quality grape, with a greater oenological, nutraceutical, and aromatic potential. Moreover, under WS, these clones substantially enhanced QIoverall berry, and are therefore recommended for cultivation in these edaphoclimatic conditions; (e) High-vigor clone 188 also displayed several mechanisms of drought tolerance (a tight stomatal control of water loss), the maintenance of a higher yield (10,500 kg ha−1) and very high WUEyield (29 kg m−3), enhanced berry quality (similar to clones 372 and 276), and improved oenological/aromatic potential. In addition, under rainfed conditions (2021), yield was reduced only by 17% (compared to its control), and, under more restricted water volume (43 mm year−1, in 2021), WUEyield was increased by 35% in this clone (compared to the average WUEyield for 2018–2020). It can also be recommended for the application of low water volume RDI strategies under semi-arid conditions, looking for a balance between high yield, efficiency, and optimum berry and wine quality.

Supplementary Materials

The following supporting information can be downloaded at: https://www.mdpi.com/article/10.3390/agronomy13020433/s1; Table S1. Seasonal changes in leaf gas exchange parameters observed from pre-veraison to post-veraison periods for each clone, irrigation treatment and their interaction for the year 2020. Diurnal changes in leaf gas exchange parameters from early morning to midday for each clone, irrigation treatment and their interaction in 2020; Table S2. Seasonal changes in leaf gas exchange parameters observed from pre-veraison to post-veraison periods for each clone, irrigation treatment and their interaction for the year 2021. Diurnal changes in leaf gas exchange parameters from early morning to midday for each clone, irrigation treatment and their interaction in 2021; Table S3. Leaf nutrient concentrations of Monastrell grapevines at veraison for each clone, irrigation treatment, and the interaction (clones x irrigation treatment) during the year 2021. The N, P, K, Ca, and Mg are expressed as % in DW and Fe, Cu, Mn, Zn, and B as ppm; Table S4. Average annual values of mineral composition of must at harvest for each clone, irrigation treatment, and the interaction (clones x irrigation treatment) during the year 2021. Data are expressed as mg L−1; Table S5. Average values of the mineral composition of wines at the end of malolactic fermentation, for clones 372, 276, 188, 94 and 4 (under control conditions) and for a mix of wine made from control vines (Mix Control) and stress vines (Mix Stress) in 2021. Data are expressed in mg L−1; Figure S1. (A–G). Changes in leaf transpiration rate (E) between early morning (EM) and midday (MD) for each clone and irrigation treatment (Control (C) vs. Stress (S)) during post-veraison period in 2020. H. Diurnal increments in E between early morning and midday for each clone during postveraison 2020. Vertical bars represent the standard error. ns, not significant, * p < 0.05; ** p < 0.01. Separation was by Duncan’s multiple range test at the 95% confidence level.

Author Contributions

Conceptualization, P.R.; methodology, P.R., J.M.N., P.B., R.G.-M. and F.M.d.A.; formal analysis, P.R.; investigation, P.R.; writing—original draft preparation, P.R.; writing—review, P.R., P.B., J.M.N., R.G-M. and F.M.d.A.; editing, P.R.; funding acquisition, P.R. All authors have read and agreed to the published version of the manuscript.

Funding

This work has been financed by the AGL2017-83738-C3-2-R project of the Ministry of Science, Innovation, and Universities within the program “Challenges of Society” and by the FEDER 1420-24 project (operating program of the Region of Murcia 2014-2020), co-financed at 80% by the European Regional Development Fund.

Data Availability Statement

Not applicate.

Acknowledgments

This work has been financed by the AGL2017-83738-C3-2-R project of the Ministry of Science, Innovation, and Universities within the program “Challenges of Society” and by the FEDER 1420-24 project (operating program of the Region of Murcia 2014-2020), co-financed at 80% by the European Regional Development Fund. We want to thank Francisco Javier Martínez López, Ana Verónica Martínez-Izquierdo, Elisa Isabel Morote Molina, Ignacio Tortosa, Cyril Douthe, Mariano Saura Mendoza, Eva María Arques Pardo, Leandro Olivares Quilez, and Juan Antonio Palazón López, for their support in field and lab work. Additionally, we want to thank “Casa Pareja” winery for the elaboration of microvinifications in 2021.

Conflicts of Interest

The authors declare no conflict of interest.

References

  1. Fraga, H.; García de Cortazar, I.; Malheiro, A.C.; Santos, J.A. Modelling climate change impacts on viticultural yield, phenology and stress conditions in Europe. Glob. Change Biol. 2016, 22, 3774–3788. [Google Scholar] [CrossRef]
  2. Santillán, D.; Garrote, L.; Iglesias, A.; Sotés, V. Climate change risks and adaptations: New indicators for Mediterranean viticulture. Mitig. Adapt. Strateg. Glob. Change 2020, 25, 881–899. [Google Scholar] [CrossRef]
  3. Santos, J.A.; Fraga, H.; Malheiro, A.C.; Moutinho-Pereira, J.; Dinis, L.T.; Correia, C.; Moriondo, M.; Leolini, L.; Dibari, C.; Costafreda-Aumedes, S.; et al. A review of the potential climate change impacts and adaptation options for European viticulture. Appl. Sci. 2020, 10, 3092. [Google Scholar] [CrossRef]
  4. Wolkovich, E.M.; Garcia de Cortazar-Atauri, I.; Morales-Castilla, I.; Nicholas, K.A.; Lacombe, T. From Pinot to Xinomavro in the world’s future wine-growing regions. Nat. Clim. Change 2018, 8, 29–37. [Google Scholar] [CrossRef]
  5. IPCC. Climate Change 2022 Report. Impacts, Adaptation and Vulnerability. Summary for Policymakers. Working Group II Contribution to the Sixth Assessment Report of the Intergovernmental Panel on Climate Change; WMO: Geneva, Switzerland; UNEP: Nairobi, Kenya, 2022; p. 35.
  6. Van Leeuwen, C.; Destrac-Irvine, A.; Dubernet, M.; Duchêne, E.; Gowdy, M.; Marguerit, E.; Pieri, P.; Parker, A.; de Rességuier, L.; Ollat, N. An update on the impact of climate change in viticulture and potential adaptations. Agronomy 2019, 9, 514. [Google Scholar] [CrossRef] [Green Version]
  7. Iglesias, A.; Garrote, L. Adaptation strategies for agricultural water management under climate change in Europe. Agric. Water Manag. 2015, 155, 113–124. [Google Scholar] [CrossRef] [Green Version]
  8. Resco, P.; Iglesias, A.; Bardají, I.; Sotés, V. Exploring adaptation choices for grapevine regions in Spain. Reg. Environ. Change 2016, 16, 979–993. [Google Scholar] [CrossRef]
  9. Dos Santos Triches, W.; Pazzini Eckhardt, D.; Nunes da Silva, E.; Gabbardo, M.; Clasen Chaves, F.; Hoffmann, J.F.; Zandoná, G.P.; Valmor Rombaldi, C. Physico-chemical characterization of wines produced by different rootstock and Vitis vinifera cv. Tannat clones in vineyards of subtropical climate region. Aust. J. Crop Sci. 2020, 14, 1506–1518. [Google Scholar] [CrossRef]
  10. Hébert-Haché, A.; Inglis, D.; Kemp, B.; Willwerth, J.J. Clone and Rootstock Interactions Influence the Cold Hardiness of Vitis vinifera cvs. Riesling and Sauvignon blanc. Am. J. Enol. Vitic. 2021, 72, 126–136. [Google Scholar] [CrossRef]
  11. Tortosa, I.; Douthe, C.; Pou, A.; Balda, P.; Hernandez-Montes, E.; Toro, G.; Escalona, J.M.; Medrano, H. Variability in water use efficiency of grapevine Tempranillo clones and stability over years at field conditions. Agronomy 2019, 9, 701. [Google Scholar] [CrossRef] [Green Version]
  12. Tortosa, I.; Escalona, J.M.; Toro, G.; Douthe, C.; Medrano, H. Clonal behavior in response to soil water availability in Tempranillo grapevine cv.: From plant growth to water use efficiency. Agronomy 2020, 10, 862. [Google Scholar] [CrossRef]
  13. Buesa, I.; Escalona, J.M.; Tortosa, I.; Marín, D.; Loidi, M.; Santesteban, L.G.; Douthe, C.; Medrano, H. Intracultivar genetic diversity in grapevine: Water use efficiency variability within cv. Grenache. Physiol. Plant. 2021, 173, 2226–2237. [Google Scholar] [CrossRef]
  14. Mairata, A.; Tortosa, I.; Douthe, C.; Escalona, J.M.; Pou, A.; Medrano, H. Comparing Selection Criteria to Select Grapevine Clones by Water Use Efficiency. Agronomy 2022, 12, 1963. [Google Scholar] [CrossRef]
  15. Buesa, I.; Hernández-Montes, E.; Tortosa, I.; Baraldi, G.; Rosselló, M.; Medrano, H.; Escalona, J.M. Unraveling the Physiological Mechanisms Underlying the Intracultivar Variability of Water Use Efficiency in Vitis vinifera “Grenache”. Plants 2022, 11, 3008. [Google Scholar] [CrossRef] [PubMed]
  16. Pagay, V.; Furlan, T.S.; Kidman, C.M.; Nagahatenna, D. Long-term drought adaptation of unirrigated grapevines (Vitis vinifera L.). Theor. Exp. Plant Physiol. 2022, 34, 215–225. [Google Scholar] [CrossRef]
  17. Pagliarani, C.; Boccacci, P.; Chitarra, W.; Cosentino, E.; Sandri, M.; Perrone, I.; Mori, A.; Cuozzo, D.; Nerva, L.; Rossato, M.; et al. Distinct metabolic signals underlie clone by environment interplay in “Nebbiolo” grapes over ripening. Front. Plant Sci. 2019, 10, 1575. [Google Scholar] [CrossRef] [PubMed]
  18. Gómez-Plaza, E.; Gil-Muñoz, R.; Carreño-Espín, J.; Fernández-López, J.A.; Martínez-Cutillas, A. Investigation on the aroma of wines from seven clones of Monastrell grapes. Eur. Food Res. Technol. 1999, 209, 257–260. [Google Scholar] [CrossRef]
  19. Gómez-Plaza, E.; Gil-Muñoz, R.; Martínez-Cutillas, A. Multivariate classification of wines from seven clones of Monastrell grapes. J. Sci. Food Agric. 2000, 80, 497–501. [Google Scholar] [CrossRef]
  20. Romero, P.; Fernández-Fernández, J.I.; Martínez-Cutillas, A. Physiological thresholds for efficient regulated deficit-irrigation management in wine grapes grown under semiarid conditions. Am. J. Enol. Vitic. 2010, 61, 300–312. [Google Scholar] [CrossRef]
  21. Esteras, C.; López-Lluch, D.; Derdak, S.; Picó, B.; Ruiz, J.J. Genotyping by Sequencing (GBS) to evaluate the genetic diversity of Monastrell, an old grapevine variety in the province of Alicante (Spain). BIO Web Conf. 2017, 9, 1019. [Google Scholar] [CrossRef]
  22. Yuste, A.; Martínez-Gil, F.; García-Martínez, S.; Lluch, D.L.; Peiró, R.; Jiménez, C.; Ruiz, J.J.; Gisbert, C. Recovering ancient grapevine cultivars in the Spanish provinces of Alicante and Valencia. Acta Hortic. 2019, 1248, 43–46. [Google Scholar] [CrossRef]
  23. Tsuda, M.; Tyree, M.T. Plant hydraulic conductance measured by the high pressure flow meter in crops plants. J. Exp. Bot. 2000, 51, 823–828. [Google Scholar] [CrossRef] [PubMed]
  24. del Amor, F.M.; Cuadra-Crespo, P. Alleviation of salinity stress in broccoli using foliar urea or methyl-jasmonate: Analysis of growth, gas exchange, and isotope composition. Plant Growth Regul. 2011, 63, 55–62. [Google Scholar] [CrossRef]
  25. Farquhar, G.D.; Ehleringer, J.R.; Hubick, K.T. Carbon isotope discrimination and photosynthesis. Annu. Rev. Plant Physiol. Plant Mol. Biol. 1989, 40, 503–537. [Google Scholar] [CrossRef]
  26. Romero, P.; Botía, P.; Navarro, J.M. Selecting rootstocks to improve vine performance and vineyard sustainability in deficit irrigated Monastrell grapevines under semiarid conditions. Agric. Water Manag. 2018, 209, 73–93. [Google Scholar] [CrossRef]
  27. Larcher, W. Physiological plant ecology. In Ecophysiology and Stress Physiology of Functional Groups, 4th ed.; Springer: Berlin/Heidelberg, Germany, 2003; p. 511. [Google Scholar]
  28. Gump, B.H.; Zoecklein, B.W.; Fugelsang, K.C. Food Microbiology Protocols; Spencer, J.F.T., Ragout de Spencer, A.L., Eds.; Methods in Biotechnology; Humana Press: Totowa, NJ, USA, 2001; Volume 14. [Google Scholar]
  29. Saint-Cricq, N.; Vivas, N.; Glories, Y. Maturité phénolique: Définition et contrôle. Rev. Franç. d’Oenolog. 1998, 173, 22–25. [Google Scholar]
  30. Ribéreau-Gayon, P.; Glories, Y.; Maujean, A.; Dubourdied, D. Handbook of Enology Volume 2: The Chemistry of Wine and Stabilization and Treatments; John and Wiley and Sons: Chichester, UK, 2006. [Google Scholar]
  31. Romero, P.; Fernández-Fernández, J.I.; Botía Ordaz, P. Interannual climatic variability effects on yield, berry and wine quality indices in long-term deficit irrigated grapevines, determined by multivariate analysis. Int. J. Wine Res. 2016, 8, 3–17. [Google Scholar] [CrossRef] [Green Version]
  32. Glories, Y. La couleur des vins rouges. 2eme partie. Mesure, origine et interpretation. Connaiss. Vigne Vin 1984, 18, 253–271. [Google Scholar] [CrossRef]
  33. Cayla, L.; Cottereau, P.; Renard, R. Estimation de la maturite phenolique des raisins rouges par la methode I.T.V. standard. Rev. Française D’oenologie 2002, 193, 84–87. [Google Scholar]
  34. Boulton, R.B. The Copigmentation Assay for Red Wines. Department of Viticulture & Enology, University of California, Davis. 2013, p. 3. Available online: http://boulton.ucdavis.edu/copig.htm.
  35. Gómez-Alonso, S.; García-Romero, E.; Hermosín-Gutiérrez, I. HPLC analysis of diverse grape and wine phenolics using direct injection and multidetection by DAD and fluorescence. J. Food Compos. Anal. 2007, 20, 618–626. [Google Scholar] [CrossRef]
  36. Ribeiro de Lima, M.T.; Waffo-Teguo, P.; Teissedre, P.L.; Pujolas, A.; Vercauteren, J.; Cabanis, J.C.; Merillon, J.M. Determination of stilbenes (trans-astringin, cis and trans-piceid, and cis- and trans-resveratrol) in Portuguese wines. J. Agric. Food Chem. 1999, 47, 2666–2670. [Google Scholar] [CrossRef] [PubMed]
  37. Sarneckis, C.J.; Dambergs, R.G.; Jones, P.; Mercurio, M.; Herdewrich, M.J.; Smith, P.A. Quantification of condensed tannins by precipitation with methyl cellulose: Development and validation of an optimised tool for grape and wine analysis. Aust. J. Grape Wine Res. 2006, 12, 39–49. [Google Scholar] [CrossRef]
  38. Romero, P.; Gil Muñoz, R.; Fernández-Fernández, J.; del Amor, F.M.; Martínez-Cutillas, A.; García-García, J. Improvement of yield and grape and wine composition in field-grown Monastrell grapevines by partial root zone irrigation, in comparison with regulated deficit irrigation. Agric. Water Manag. 2015, 149, 55–73. [Google Scholar] [CrossRef]
  39. Gómez-Plaza, E.; Mestre-Ortuño, L.; Ruiz-García, Y.; Fernández-Fernández, J.I.; López-Roca, J.M. Effect of benzothiadiazole and methyl jasmonate on the volatile compound composition of Vitis vinifera L. Monastrell grapes and wines. Am. J. Enol. Vitic. 2012, 63, 394–401. [Google Scholar] [CrossRef]
  40. Canuti, V.; Puccioni, S.; Storchi, P.; Zanoni, B.; Picchi, M.; Bertuccioli, M. Enological eligibility of grape clones based on the Simca method: The case of the Sangiovese cultivar from Tuscany. Ital. J. Food Sci. 2018, 30, 184–199. [Google Scholar] [CrossRef]
  41. Portu, J.; Baroja Hernández, E.; Martínez Garcia, J.; Rivacoba, L.; García-Escudero, E. Preliminary evaluation of agronomic and enological properties of preselected grapevine clones of ‘Tempranillo’ and ‘Graciano’ in DOCa Rioja (Spain). In Proceedings of the 8th International Macrowine Conference on Macromolecules and Secondary Metabolites of Grapevine and Wine, Virtual, 23–30 June 2021. [Google Scholar]
  42. Chitarra, W.; Perrone, I.; Avanzato, C.G.; Minio, A.; Boccacci, P.; Santini, D.; Gilardi, G.; Siciliano, I.; Gullino, M.L.; Delledonne, M.; et al. Grapevine Grafting: Scion Transcript Profiling and Defense-Related Metabolites Induced by Rootstocks. Front. Plant Sci. 2017, 8, 654. [Google Scholar] [CrossRef]
  43. Marín, D.; Armengol, J.; Carbonell-Bejerano, P.; Escalona, J.M.; Gramaje, D.; Hernández-Montes, E.; Intrigliolo, D.S.; Martínez-Zapater, J.M.; Medrano, H.; Mirás-Avalos, J.M.; et al. Challenges of viticulture adaptation to global change: Tackling the issue from the roots. Aust. J. Grape Wine Res. 2021, 27, 8–25. [Google Scholar] [CrossRef]
  44. Cifre, J.; Bota, J.; Escalona, J.M.; Medrano, H.; Flexas, J. Physiological tools for irrigation scheduling in grapevine (Vitis vinifera L.): An open gate to improve water-use efficiency? Agric. Ecosyst. Environ. 2005, 106, 159–170. [Google Scholar] [CrossRef]
  45. van Leeuwen, C.; Trégoat, O.; Choné, X.; Bois, B.; Pernet, D.; Gaudillére, J.-P. Vine water status is a key factor in grape ripening and vintage quality for red Bordeaux wine. How can it be assessed for vineyard management purposes? J. Int. Sci. Vigne Vin 2009, 43, 121–134. [Google Scholar] [CrossRef]
  46. Romero, P.; Navarro, J.M.; Botía Ordaz, P. Towards a sustainable viticulture: The combination of deficit irrigation strategies and agroecological practices in Mediterranean vineyards. A review and update. Agric. Water Manag. 2022, 259, 107216. [Google Scholar] [CrossRef]
  47. Serrano, A.S.; Martínez-Gascueña, J.; Alonso, G.L.; Cebrián-Tarancón, C.; Carmona, M.D.; Mena, A.; Chacón-Vozmediano, J.L. Agronomic Response of 13 Spanish Red Grapevine (Vitis vinifera L.) Cultivars under Drought Conditions in a Semi-Arid Mediterranean Climate. Agronomy 2022, 12, 2399. [Google Scholar] [CrossRef]
  48. Flexas, J.; Galmés, J.; Gallé, A.; Gulías, J.; Pou, A.; Ribas-Carbo, M.; Tomás, M.; Medrano, H. Improving water use efficiency in grapevines: Potential physiological targets for biotechnological improvement. Aust. J. Grape Wine Res. 2010, 16, 106–121. [Google Scholar] [CrossRef]
  49. Medrano, H.; Tomás, M.; Martorell, S.; Flexas, J.; Hernández, E.; Rosselló, J.; Pou, A.; Escalona, J.-M.; Bota, J. From leaf to whole plant water use efficiency (WUE) in complex canopies: Limitations of leaf WUE as a selection target. Crop J. 2015, 3, 220–228. [Google Scholar] [CrossRef] [Green Version]
  50. Romero, P.; Fernández-Fernández, J.I.; Gil-Muñoz, R.; Botía, P. Vigour-yield-quality relationships in long-term deficit irrigated winegrapes grown under semiarid conditions. Theor. Exp. Plant Physiol. 2016, 28, 23–51. [Google Scholar] [CrossRef]
  51. Padgett-Johnson, M.; Williams, L.E.; Walker, M.A. Vine water relations, gas exchange, and vegetative growth of seventeen Vitis species grown under irrigated and non irrigated conditions in California. J. Am. Soc. Hortic. Sci. 2003, 128, 269–276. [Google Scholar] [CrossRef] [Green Version]
  52. Bota, J.; Tomás, M.; Flexas, J.; Medrano, H.; Escalona, J.M. Differences among grapevine cultivars in their stomatal behavior andwater use efficiency under progressive water stress. Agric. Water Manag. 2016, 164, 91–99. [Google Scholar] [CrossRef]
  53. Simonneau, T.; Lebon, E.; Coupel-Ledru, A.; Marguerit, E.; Rossdeutsch, L.; Ollat, N. Adapting plant material to face water stress in vineyards: Which physiological targets for an optimal control of plant water status? OENO One 2017, 51, 167–179. [Google Scholar] [CrossRef]
  54. Gambetta, G.A.; Herrera, J.C.; Silvina, D.; Feng, S.; Hochberg, Q.; Castellarin, S. The physiology of drought stress in grapevine: Towards an integrative definition of drought tolerance. J. Exp. Bot. 2020, 71, 4658–4676. [Google Scholar] [CrossRef] [PubMed]
  55. Bandurska, H. Drought Stress Responses: Coping Strategy and Resistance. Plants 2022, 11, 922. [Google Scholar] [CrossRef]
  56. Bianchi, D.; Caramanico, L.; Grossi, D.; Brancadoro, L.; Lorenzis, G.D. How Do novel M-Rootstock (Vitis spp.) genotypes cope with drought? Plants 2020, 9, 1385. [Google Scholar] [CrossRef]
  57. Tardieu, F.; Simonneau, T. Variability among species of stomatal control under fluctuating soil water status and evaporative demand: Modelling isohydric and anisohydric behaviours. J. Exp. Bot. 1998, 49, 419–432. [Google Scholar] [CrossRef] [Green Version]
  58. Lavoie-Lamoureux, A.; Sacco, D.; Risse, P.-A.; Lovisolo, C. Factors influencing stomatal conductance in response to water availability in grapevine: A meta-analysis. Physiol. Plant. 2017, 159, 468–482. [Google Scholar] [CrossRef] [PubMed]
  59. Schultz, H.R. Differences in hydraulic architecture account for near-isohydric and anisohydric behaviour of two field-grown Vitis vinifera L. cultivars during drought. Plant Cell Environ. 2003, 26, 1393–1405. [Google Scholar] [CrossRef]
  60. Dayer, S.; Herrera, J.C.; Dai, Z.; Burlett, R.; Lamarque, L.J.; Delzon, S.; Bortolami, G.; Cochard, H.; Gambetta, G.A. The sequence and thresholds of leaf hydraulic traits underlying grapevine varietal differences in drought tolerance. J. Exp. Bot. 2020, 71, 4333–4344. [Google Scholar] [CrossRef] [Green Version]
  61. Villalobos-Soublett, E.; Verdugo-Vásquez, N.; Díaz, I.; Zurita-Silva, A. Adapting Grapevine Productivity and Fitness to Water Deficit by Means of Naturalized Rootstocks. Front. Plant Sci. 2022, 13, 870438. [Google Scholar] [CrossRef]
  62. Hochberg, U.; Rockwell, F.E.; Holbrook, N.M.; Cochard, H. Iso/Anisohydry: A plant-environment interaction rather than a simple hydraulic trait. Trends Plant Sci. 2018, 23, 112–120. [Google Scholar] [CrossRef]
  63. Christmann, A.; Grill, E.; Huang, J. Hydraulic signals in long-distance signaling. Curr. Opin. Plant Biol. 2013, 16, 293–300. [Google Scholar] [CrossRef]
  64. Levin, A.D.; Williams, L.E.; Matthews, M.A. A continuum of stomatal responses to water deficits among 17 wine grape cultivars (Vitis vinifera). Funct. Plant Biol. 2019, 47, 11–25. [Google Scholar] [CrossRef]
  65. Cochetel, N.; Ghan, R.; Toups, H.S.; Degu, A.; Tillett, R.L.; Schlauch, K.A.; Cramer, G.R. Drought tolerance of the grapevine, Vitis champinii cv. Ramsey, is associatedwith higher photosynthesis and greater transcriptomic responsiveness of abscisic acid biosynthesis and signaling. BMC Plant Biol. 2020, 20, 55. [Google Scholar] [CrossRef] [Green Version]
  66. Prinsi, B.; Simeoni, F.; Galbiati, M.; Meggio, F.; Tonelli, C.; Scienza, A.; Espen, L. Grapevine Rootstocks Differently affect Physiological and Molecular Responses of the Scion under Water Deficit Condition. Agronomy 2021, 11, 289. [Google Scholar] [CrossRef]
  67. Flexas, J.; Medrano, H. Drought-inhibition of photosynthesis in C3 plants: Stomatal and non-stomatal limitations revisited. Ann. Bot. 2002, 89, 183–189. [Google Scholar] [CrossRef] [Green Version]
  68. Gago, J.; Douthe, C.; Florez-Sarasa, I.; Escalona, J.M.; Galmes, J.; Fernie, A.R.; Flexas, J.; Medrano, H. Opportunities for improving leaf water use eficiency under climate change conditions. Plant Sci. 2014, 226, 108–119. [Google Scholar] [CrossRef] [PubMed]
  69. Zufferey, V.; Verdenal, T.; Dienes, A.; Belcher, S.; Lorenzini, F.; Koestel, C.; Blackford, M.; Bourdin, G.; Gindro, K.; Spangenberg, J.E.; et al. The influence of vine water regime on the leaf gas exchange, berry composition and wine quality of Arvine grapes in Switzerland. OENO One 2020, 54, 553–568. [Google Scholar] [CrossRef]
  70. Davenport, J.R.; Horneck, D.A. Sampling Guide for Nutrient Assessment of Irrigated Vineyards in the Inland Pacific Northwest; Washington State University: Pullman, WA, USA, 2011; p. 6. [Google Scholar]
  71. Edwards, E.J.; Betts, A.; Clingeleffer, P.R.; Walker, R.R. Rootstock-conferred traits affect the water use efficiency of fruit production in Shiraz. Aust. J. Grape Wine Res. 2022, 28, 316–327. [Google Scholar] [CrossRef]
  72. Pou, A.; Flexas, J.; del Mar Alsina, M.; Bota, J.; Carambula, C.; de Herralde, F.; Galmés, J.; Lovisolo, C.; Jimenez, M.; Ribas-Carbó, M.; et al. Adjustments of water use efficiency by stomatal regulation during drought and recovery in the drought-adapted Vitis hybrid Richter-110 (V. berlandieri × V. rupestris). Physiol. Plant. 2008, 134, 313–323. [Google Scholar] [CrossRef] [PubMed]
  73. Romero, P.; Botía, P.; Keller, M. Hydraulics and gas exchange recover more rapidly from severe drought stress in small pot-grown grapevines than in field-grown plants. J. Plant Physiol. 2017, 216, 58–73. [Google Scholar] [CrossRef] [PubMed]
  74. Cortell, J.M.; Sivertsen, H.K.; Kennedy, J.A.; Heymann, H. Influence of vine vigor on Pinot noir fruit composition, wine chemical analysis and wine sensory attributes. Am. J. Enol. Vitic. 2008, 59, 1–10. [Google Scholar] [CrossRef]
  75. Ginestar, C.; Eastham, J.; Gray, S.; Iland, P. Use of sap-flow sensors to schedule vineyard irrigation. II. Effects of post-veraison water deficits on composition of Shiraz grapes. Am. J. Enol. Vitic. 1998, 49, 421–428. [Google Scholar] [CrossRef]
  76. Genebra, T.; Santos, R.R.; Francisco, R.; Pinto-Marijuan, M.; Brossa, R.; Serra, A.T.; Duarte, C.M.M.; Chaves, M.M.; Zarrouk, O. Proanthocyanidin accumulation and biosynthesis are modulated by the irrigation regime in Tempranillo seeds. Int. J. Mol. Sci. 2014, 15, 11862–11877. [Google Scholar] [CrossRef]
  77. Intrigliolo, D.S.; Lizama, V.; García-Esparza, M.J.; Abrisqueta, I.; Álvarez, I. Effects of post-veraison irrigation regime on Cabernet Sauvignon grapevines in Valencia, Spain: Yield and grape composition. Agric. Water Manag. 2016, 170, 110–119. [Google Scholar] [CrossRef]
  78. Cáceres-Mella, A.; Talaverano, M.I.; Villalobos-González, L.; Ribalta-Pizarro, C.; Pastenes, C. Controlled water deficit during ripening affects proanthocyanidin synthesis, concentration and composition in Cabernet Sauvignon grape skins. Plant Physiol. Biochem. 2017, 117, 34–41. [Google Scholar] [CrossRef] [PubMed]
  79. Lizama, V.; Pérez-Álvarez, E.P.; Intrigliolo, D.S.; Chirivella, C.; Álvarez, I.; García- Esparza, M.J. Effects of the irrigation regimes on grapevine cv. Bobal in a Mediterranean climate: II. Wine, skins, seeds, and grape aromatic composition. Agric. Water Manag. 2021, 256, 107078. [Google Scholar] [CrossRef]
  80. Martins, V.; Cunha, A.; Gerós, H.; Hanana, M.; Blumwald, E. Mineral compounds in the grape berry. In The Biochemistry of the Grape Berry; Geros, H., Chaves, M., Delrot, S., Eds.; Bentham Science Publishers Ltd.: Sharjah, United Arab Emirates, 2012; pp. 23–43. [Google Scholar]
  81. De Nisco, M.; Manfra, M.; Bolognese, A.; Sofo, A.; Scopa, A.; Tenore, G.C.; Pagano, F.; Milite, C.; Russo, M.T. Nutraceutical properties and polyphenolic profile of berry skin and wine of Vitis vinifera L. (cv. Aglianico). Food Chem. 2013, 140, 623–629. [Google Scholar] [CrossRef]
  82. Ouyang, X.; Yuan, G.; Ren, J.; Wang, L.; Wang, M.; Li, Y.; Zhang, B.; Zhu, B. Aromatic compounds and organoleptic features of fermented wolfberry wine: Effects of maceration time. Int. J. Food Prop. 2017, 20, 2234–2248. [Google Scholar] [CrossRef] [Green Version]
  83. Vilanova, M.; Campo, E.; Escudero, A.; Graña, M.; Masa, A.; Cacho, J. Volatile composition and sensory properties of Vitis vinifera red cultivars from North West Spain: Correlation between sensory and instrumental analysis. Anal. Chim. Acta 2012, 720, 104–111. [Google Scholar] [CrossRef]
  84. Cortés-Diéguez, S.; Rodriguez-Solana, R.; Domínguez, J.M.; Díaz, E. Impact odorants and sensory profile of young red wines from four Galician (NW of Spain) traditional cultivars. J. Inst. Brew. 2015, 121, 628–635. [Google Scholar] [CrossRef]
  85. Szikszai, A.R.; Issa Issa, H.; Cano-Lamadrid, M.; Carbonell-Barrachina, A.A. Characteristic volatile compounds of Monastrell wines. Rev. Dr. UMH 2018, 4, 3. [Google Scholar] [CrossRef]
  86. Hopfer, H.; Nelson, J.; Ebeler, S.E.; Heymann, H. Correlating wine quality indicators to chemical and sensory measurements. Molecules 2015, 20, 8453–8483. [Google Scholar] [CrossRef] [Green Version]
  87. Welke, J.E.; Zanus, M.; lazzarotto, M.; Alcaraz Zini, C. Quantitative analysis of headspace volatile compounds using comprehensive two-dimensional gas chromatography and their contribution to the aroma of Chardonnay wine. Food Res. Int. 2014, 59, 85–99. [Google Scholar] [CrossRef] [Green Version]
  88. Roba, K. The Role of Terpene (Secondary Metabolite). Nat. Prod. Chem. Res. 2021, 9, 411. [Google Scholar]
  89. Varshney, R.K.; Tuberosa, R.; Tardieu, F. Progress in understanding drought tolerance: From alleles to cropping systems. J. Exp. Bot. 2018, 69, 3175–3179. [Google Scholar] [CrossRef] [PubMed]
  90. Zhu, X.-G.; Hasanuzzaman, M.; Jajoo, A.; Lawson, T.; Lin, R.; Liu, C.-M.; Liu, L.-N.; Liu, Z.; Lu, C.; Moustakas, M.; et al. Improving photosynthesis through multidisciplinary efforts: The next frontier of photosynthesis research. Front. Plant Sci. 2022, 13, 967203. [Google Scholar] [CrossRef] [PubMed]
  91. Passioura, J.B. Drought and drought tolerance. In Drought Tolerance in Higher Plants: Genetical, Physiological and Molecular Biological Analysis; Belhassen, E., Ed.; Springer: Dordrecht, The Netherlands, 1996; pp. 1–5. [Google Scholar]
Figure 1. (A) Experimental vineyard showing Monastrell vines from clone 373 under control treatment in July 2020. (B) Monastrell vines from clone 360 under water stress in July 2020. (C) Monastrell vines from clone 4 under water stress in July 2020. (D) Monastrell vines from clone 372 under water stress in July 2020.
Agronomy 13 00433 g001
Figure 2. (A) Relationship between average A/gs measured from fruit set to harvest in the morning, and productive WUE in 2020. (B) Relationship between average A/gs measured from fruit set to veraison in the morning and midday, and yield at harvest in 2020. (C) Relationship between average A/gs measured in the morning at pre-veraison period, and productive WUE (WUEyield) in 2021. (D) Relationship between average A/gs measured in the morning at pre-veraison period, and yield in 2021. (E) Relationship between average A/gs measured during the whole season (pre- and post-veraison period, early morning and midday) and carbon isotopic δ13C in berries in 2020. (F) Relationship between yield at harvest and carbon isotopic δ13C in berries in 2020. (G) Relationship between WUEyield and carbon isotopic δ13C in berries in 2020. Each point represents the measurement in a single vine for the different clones and under control and stress conditions. *, indicate significant differences at the 0.1 levels of probability.
Agronomy 13 00433 g002
Figure 3. (A) Differences in midday stem water potential (Ψs) between control and stress treatments for each clone during post-veraison periods (average data from two years: 2020 and 2021). (B) Significant linear relationship between leaf transpiration rate (E) and ΔΨ (Ψls) measured at midday during post-veraison in 2020. * p < 0.05. In (B), points represent data from all of the clones. (C) Significant relationships between gradient of water potential in the leaves and leaf transpiration measured at midday for each clone, during post-veraison period in 2020 (20th August 2020). In (C), each single point is a single measurement made in the same leaf in a vine. Kleaf was calculated in August 2020 for each clone using the evaporative flux method (see Material and methods). ns, not significant, * p < 0.1, ** p < 0.05, *** p < 0.01.
Agronomy 13 00433 g003
Figure 4. Significant interactive effects of the clone and irrigation treatment on leaf gas exchange parameters measured at early morning and midday during the post-veraison in 2020. Different letters indicate significant differences according to Duncan´s multiple range test at the 95% confidence level.
Agronomy 13 00433 g004
Figure 5. Significant relationships between midday stem water potential (Ψs) and leaf gas exchange parameters measured at midday (12:15–13:45 p.m.) for high (4, 94, and 188) and low/moderate-vigour clones (276, 360, 372, and 373) (A,C,E,G) and for each clone (B,D,F,H) during the post-veraison period (August) in 2020. Each point represents a single measurement of Ψs and leaf gas exchange made in the same vine. ns, not significant; * p < 0.05.
Agronomy 13 00433 g005
Figure 6. Differences between mean values of leaf gas exchange rates measured at early morning and midday for each clone during the post-veraison in 2020. Vertical bars represent the standard errors. ns, not significant; * p < 0.1, ** p < 0.05, *** p < 0.01, **** p < 0.001. Separation was made by Duncan’s multiple range test at the 95% confidence level.
Agronomy 13 00433 g006
Figure 7. Relationships between atmospheric vapour pressure deficit (VPD) and leaf transpiration rate (E) for each irrigation treatment in the different clones. Data from daily measurements of VPD and E measured at the same time (from early morning to afternoon) during the growing season (from July to September) in 2020. * p < 0.05.
Agronomy 13 00433 g007
Figure 8. (A) Significant relationships between A and gs at early morning and midday during post-veraison in 2020. (B) Significant relationships between gs and A for each clone in the morning (including early morning and midday) during post-veraison in 2020. (C) Significant relationships between gs and A/gs at early morning and midday during post-veraison in 2020. (D) Significant relationships between gs and A for each clone in the morning (including early morning and midday) during post-veraison in 2020. (E,F) Significant relationships between stomatal conductance (gs) and intercellular CO2 concentration (Ci), for each clone at early morning (9:00–10:30 a.m.) and midday (12:30–14:00 p.m.), respectively. Each single point is the average of three measurements made in different dates in the leaves of the same vine under control and stress conditions during post-veraison in 2020. * p < 0.1; ** p < 0.05, *** p < 0.01; **** p < 0.001.
Agronomy 13 00433 g008
Figure 9. Significant interactive effects of clone and irrigation treatment in yield (yield, no. clusters per vine, no. berries per cluster and WUEyield), vigour parameters (total leaf area), and sink-source ratios (TLA/yield, TLA/pruning weight). Values are the average of three years: 2018–2020. Arrows indicate the percentage of reduction with regards to their controls. Different letters indicate significant differences according to Duncan’s multiple range test at the 95% confidence level. In A and E, we also did a unifactorial analysis (ANOVA) for each clone, looking for significant differences between control and stress treatment. ns, not significant. * p < 0.05; ** p < 0.01; ***, p < 0.001, according to Duncan’s multiple range test at the 95% confidence level.
Agronomy 13 00433 g009
Figure 10. (A) Graphics representing changes in control of transpired water (E, leaf transpiration rate; TLA, total leaf area) for each clone under control and stress conditions (A), WUEleaf (B), changes in yield, WUEyield, TLA (total leaf area) and QIoverall berry (C) and increments and decrements for each clone in yield, TLA, WUE and QI between control and stress treatments (irrigation treatments) (D) Data average from three years. (B) Diagram showing a classification of clones according to three criteria: tolerance to drought, productive water use efficiency, and quality of grapes and wines. Low-vigour clones (372, 276) and high-vigour clone 188 showed an equilibrium among moderate/high yield, drought tolerance, WUEyield, and high berry and wine quality.
Agronomy 13 00433 g010
Table 1. Mean values of several climatic parameters in different phenologial periods for every year of the experiment in the study area.
Phenological PeriodPeriod of the YearEto
(mm)
VPD
(kPa)
Rain-Fall
(mm)
Tamax
(°C)
Tamed
(°C)
Tamin
(°C)
Solar Rad.
(W m−2)
Year 2018
Budburst-fruit set15 April–14 June2650.987823.716.78.8268
Fruit set-veraison15 June–31 July2912.000.132.824.614.4328
Veraison-harvest1 August–20 September2191.395731.023.7616.43229
Postharvest21 September–31 October970.7726.823.816.59.93165
Dormancy period1 November–14 April2890.52126.317.038.30.60147
Total/annual average 11611.13288.225.6719.9710.03227
Year 2019
Budburst-fruit set15 April–14 June2801.0611924.216.98.6280
Fruit set-veraison15 June–31 July2802.041.432.924.514.2313
Veraison-harvest1 August–20 September2191.4317030.523.315.7234
Postharvest21 September–31 October950.793925.016.99.3180
Dormancy period1 November–14 April2610.4528916.79.342.75133
Total/annual average 11351.1561825.918.210.10228
Year 2020
Budburst-fruit set15 April–14 June2551.062725.117.79.3264
Fruit set-veraison15 June–31 July2661.92633.224.614.4316
Veraison-harvest1 August–20 September2311.71632.223.513.8258
Postharvest21 September–31 October990.99924.515.25.8181
Dormancy period1 November–14 April2610.4523316.69.02.2135
Total/annual average 11121.2328126.318.09.10231
Year 2021
Budburst-fruit set15 April–14 June2530.9411324.317.19.2259
Fruit set-veraison15 June–31 July2471.755332.123.813.8306
Veraison-harvest1 August–20 September2061.63332.324.115.5234
Postharvest21 September–31 October940.791624.817.210.05162
Dormancy period1 November–21 March1730.4820116.28.060.80120
Total/annual average 9731.1238625.9418.059.87216
Table 2. Water volume applied for each treatment (control and stress) in each phenological period and total for every year of the experiment (2018–2021). Treatments: C: control; S: stress.
Period 2018–2020Year 2021
CloneAll Clones (avg.)494188276360372373
TreatmentCSCSCSCSCSCSCSCS
Budburst-fruit set25.923.311.7011.7011.7020.924.336.231.322.823.820.923.5
Fruit set-veraison27.3015.2015.1015.2027.0046.9029.5027.00
Veraison-harvest20.6012.2012.1012.2021.7037.7023.7021.70
Post-harvest10.504.104.104.107.3012.607.907.30
Total (mm)84.323.343.2042.9043.2076.824.3133.431.383.823.876.823.5
Table 3. Average values of Ψs, midday stem water potential (MPa), Ψl, leaf water potential (MPa), early morning leaf gas exchange parameters measured during pre- and post-veraison periods for each clone, irrigation treatment and their interaction (clone × irrigation treatment) for years 2020 and 2021. Mean values of 13C isotope discrimination (δC13; ‰) measured at harvest in berries from different combinations of clones-irrigation treatment in 2019 and 2020. Photosynthetic nitrogen use efficiency (NUEph) measured for each clone and irrigation treatment in 2020.
Year 2020
Pre-veraison period (June-July)Post-veraison period (August-September)(2019)(2020)(2020)
CloneΨsAgsCiEA/gsA/EΨlΨsΔΨAgsCiEA/gsA/EδC13
(berry)
δC13
(berry)
NUEph
4−0.92c17.1b0.185b182b4.35105a5.04−1.41−0.99d0.50b14.84c0.236d249c5.14d65a2.94a−27.1a−27.0a10.51c
94−0.99bc17.9b0.181b179b4.22106a5.06−1.55−1.15bcd0.36a13.62c0.181c230b4.28c78b3.31b−26.4ab−25.9b9.18bc
188−1.01b16.8ab0.158ab165ab3.79116ab5.37−1.62−1.11cd0.53b14.33c0.185c228b4.41c79b3.31b−25.9b−25.7b9.02bc
276−1.05b16.7ab0.148ab157ab3.58121ab5.29−1.58−1.28abc0.29a11.04b0.121b204a3.18ab98cd3.62bc−25.7bc−24.1c8.21ab
360−1.18a14.2a0.116a137a3.11137b5.49−1.57−1.35a0.29a8.84a0.087a197a2.50a105d3.67c−24.7d−24.7c6.45a
372−1.07b15.6ab0.129a143a3.38132b5.54−1.59−1.30ab0.28a10.50ab0.117b202a3.12ab100cd3.61bc−24.9cd−24.2c7.87ab
373−1.03b15.9ab0.143ab160ab3.70120ab5.16−1.41−1.08d0.31a11.41b0.129b209a3.44b94c3.54bc−25.8bc−25.0bc7.84ab
Treatment
Control−1.0216.920.1621683.951145.16−1.52−1.160.3712.730.1592193.90873.43−25.9−25.58.72
Stress−1.0515.680.1411533.511255.40−1.55−1.200.3711.430.1432153.55903.42−25.7−24.98.16
ANOVA
Clone***********ns**nsns********************************************
Treatmentns****ns**nsnsnsns****ns*nsnsns**ns
Interactionnsnsnsnsnsnsnsnsnsns************nsnsnsns
Year 2021
Pre-veraison period (June-July)Post-veraison period (August-September)
CloneΨs (June)Ψs (July)AgsCiEA/gsA/EΨsAgsCiEA/gsA/E
4−0.59a−0.9820.2b0.33c241b7.83c61a2.61−0.96b14.24d0.142c1903.47c103a4.16
94−0.67ab−1.0018.3ab0.25ab224a6.69b74b2.80−1.05ab10.45bc0.090b1572.43b129b4.62
188−0.71b−1.0318.7ab0.27b230ab6.95bc69ab2.73−1.01ab11.20c0.096b1702.61b120ab4.40
276−0.74b−1.1117.0a0.23ab219a6.06ab79b2.85−1.10a7.04a0.055a1431.59a142b4.78
360−0.76b−0.9916.3a0.21a219a5.59a80b3.06−0.98b8.56ab0.081ab1752.19ab120ab4.25
372−0.72b−1.0617.1a0.23ab217a5.98ab80b2.91−1.03ab9.26abc0.075ab1532.08ab133b4.57
373−0.69b−1.0418.0ab0.25ab224a6.29ab75b2.91−1.00b9.63bc0.081ab1682.21ab123ab4.47
Treatment
Control−0.68−0.9418.10.262276.65722.80−0.9610.220.0921712.451214.36
Stress−0.72−1.1217.80.252226.32762.88−1.089.890.0851592.291284.56
ANOVA
Clone**ns***************ns**********ns******ns
Treatmentns****nsnsnsnsnsns****nsnsnsnsnsns
Interactionnsnsnsns**ns*ns*****nsnsnsnsns
Abbreviations and units: A, leaf net photosynthesis rate (μmol m−2 s−1); gs, stomatal conductance (mol m−2 s−1); E, leaf transpiration rate (mmol m−2 s−1); Ci, intercellular CO2 concentration (mmol mol−1); A/gs, intrinsic leaf water use efficiency (μmol mol−1); A/E, instantaneous leaf water use efficiency (μmol mmol−1); nitrogen use efficiency (NUEph, μmol m−2 s−1/mol N kg−1 DW). “ns” not significant; *, **, ***, and **** indicate significant differences at the 0.1, 0.05, 0.01, and 0.001 levels of probability, respectively. In each column and for each factor or interaction, different letters indicate significant differences according to Duncan’s multiple range test at the 95% confidence level.
Table 4. Leaf nutrient concentrations of Monastrell grapevines at veraison for each clone, irrigation treatment, and the interaction (clones × irrigation treatment) during the 3-year period 2018–2020. N, P, K, Ca, and Mg are expressed as % in DW, and Fe, Cu, Mn, Zn, and B as ppm.
3-Year Period (2018–2020)
CloneNPKCaMgBFeCuMnZn
42.310.1070.62a2.030.31b56.0c71.1a11.4a103.9ab21.3
942.300.1110.65a2.060.34b44.8b82.9ab8.9a94.5abc20.7
1882.350.1120.63a2.120.34b41.8ab87.1ab8.5a86.2a20.8
2762.140.1140.73b1.930.28a44.1ab98.9b8.5a100.6abc23.3
3602.190.1120.60a2.090.38c51.9c79.2ab19.4b111.5bcd24.9
3722.190.1070.62a1.990.33b37.1a73.9a10.8a126.6d24.5
3732.180.1060.63a1.970.32b39.9ab69.2a8.0a117.0cd21.1
Treat.
Control2.260.1110.642.030.3343.281.510.9103.522.0
Stress2.210.1090.632.020.3347.079.110.6108.022.7
Clone × Treat.
4Control2.30b0.1060.61abc1.860.30b48.364.811.4102.820.1
Stress2.31b0.1080.63abcd2.190.32bc63.777.411.3105.122.5
94Control2.25b0.1060.62abc2.110.32bc44.589.29.3105.320.3
Stress2.36b0.1160.67bcd2.020.36cde45.276.78.683.721.0
188Control2.35b0.1130.69cd2.020.32bc39.395.47.888.223.2
Stress2.34b0.1120.57ab2.220.36cde44.378.99.284.218.4
276Control2.35b0.1190.74d1.950.33bc44.390.49.087.622.0
Stress1.93a0.1090.72cd1.900.24a43.9107.47.9113.724.6
360Control2.22b0.1160.53a2.190.39e50.582.919.6114.724.6
Stress2.16ab0.1080.67bcd1.990.38de53.475.519.2108.325.1
372Control2.20ab0.1090.63abc2.140.31bc35.875.410.6116.822.6
Stress2.18ab0.1040.61abc1.850.35bcde38.472.310.9136.326.4
373Control2.19ab0.1070.69cd1.970.32bc39.772.78.8109.021.1
Stress2.18ab0.1050.57ab1.960.33bcd40.165.87.2125.021.1
ANOVA
Clonensns**ns*****************ns
Treatmentnsnsnsnsns**nsnsnsns
Interaction*ns***ns***nsnsnsnsns
“ns” not significant; *, **, ***, and **** indicate significant differences at the 0.1, 0.05, 0.01, and 0.001 levels of probability, respectively. In each column and for each factor or interaction, different letters indicate significant differences according to Duncan’s multiple range test at the 95% confidence level.
Table 5. Average annual values of yield components at harvest for each clone, irrigation treatment, and the interaction (clone × irrigation treatment) during the experimental period (2018–2021): WUEyield (productive water use efficiency, kg m−3). Average values of vegetative development parameters (main shoot length, total leaf area –TLA- and pruning weight) for each clone, irrigation treatment, and the interaction (clone × irrigation treatment) during the experimental period (2018–2021).
3-Year Period (2018–2020)
CloneYield
(kg vine−1)
Number of clustersCluster weight
(g)
Number of berries per clusterBerry weight (g)WUEyield
(kg m−3)
Main shoot length
(cm)
TLA
(m2 vine−1)
Pruning weight
(kg vine−1)
Ravaz index
(kg kg−1)
TLA/yield
(m2 kg−1)
TLA/Pruning weight
(m2 kg−1)
42.59bc13.50bc168bc1211.71cd25.31c87c2.34bc0.25bc13.051.02ab9.45ab
943.47d14.92bc216d1281.79d29.99c83c2.23bc0.31c12.270.78a8.70a
1883.15cd15.40c199cd1321.78d28.78c85c2.47c0.29c13.700.81a9.39ab
2762.22b12.51bc156ab1121.60bc17.16b74b2.14bc0.26bc10.121.44b8.99a
3601.17a8.38a125a1121.19a10.02a56a1.02a0.10a13.541.21ab9.54ab
3722.32b12.84bc165bc1211.48b19.15b73b1.87b0.19b14.180.96ab12.12b
3732.23b12.21b165bc1091.60bc16.66b67b1.37a0.22bc11.611.21ab11.9b
Treat.
Control2.8313.711851241.6911.80802.180.2813.190.929.08
Stress2.0811.931561141.5030.22701.650.1912.091.2010.94
ANOVA
Clone************ns********************ns****
Treat.*********ns********************ns****
Interact.ns**ns************ nsnsns*******
Year 2021
CloneYield
(kg vine−1)
Number of clustersCluster weight
(g)
Number of berries per clusterBerry
Weight
(g)
WUEyield
(kg m−3)
Main shoot length
(cm)
TLA
(m2 vine−1)
TLA/yield
(m2 kg−1)
42.04bc12.64b145cd100bcd1.57b21.53b72b1.57c 0.78a
942.62c14.41b171d123d1.53b24.59b56ab1.25bc 0.54a
1882.28bc13.75b150cd112cd1.46b20.72b60ab1.16abc 0.75a
2761.61abc13.44b95ab65a1.53b10.14a52a1.12abc 1.61b
3600.59a7.34a79a76ab1.09a3.31a46a0.34a 0.73a
3721.40ab10.30ab129bc81ab1.43b9.46a50a0.64ab 0.49a
3731.58abc11.46ab126bc89abc1.57b11.59a60ab1.39bc 0.95a
Treat.
Control2.2313.92142991.5313.00631.49 0.76
Stress1.239.90114861.3915.95500.65 0.91
ANOVA
Clone*********************** ***
Treat.********ns**ns******* ns
Interact.nsnsns*nsnsnsns ***
“ns” not significant; *, **, ***, and **** indicate significant differences at the 0.1, 0.05, 0.01, and 0.001 levels of probability, respectively. In each column and for each factor or interaction, different letters indicate significant differences according to Duncan’s multiple range test at the 95% confidence level.
Table 6. Average annual values of berry technological quality at harvest for each clone, irrigation treatment, and the interaction (clones × irrigation treatment) during the 3-year period 2018–2020. TSS (total soluble solids, °Brix), titratable acidity (g tartaric acid L−1), IM (maturity index, °Brix/Titratable acidity), tartaric acid (g L−1), and malic acid (g L−1).
3-Year Period (2018–2020)
CloneBerry WeightTSSpHTotal AcidityIMTartaric AcidMalic AcidTartaric/Malic% Juice% H2O
41.71cd22.9ab4.04abc3.99b5.82a3.34a1.81c1.88a67.5bc76.3
941.79d22.5a3.96a3.74ab6.08ab3.46a1.53b2.33b69.5c75.6
1881.74d23.3ab4.00ab3.77ab6.23abc3.46a1.43b2.68b67.3bc74.7
2761.54b23.1ab4.07bc3.73a6.44bc3.50a1.15a3.27cd66.7b74.8
3601.19a23.8b4.19d3.82ab6.12abc4.06b1.41b3.09c55.2a73.8
3721.48b23.1ab4.00ab3.55a6.58c3.47a1.10a3.18cd66.0b74.9
3731.60bc23.1ab4.11cd3.60a6.46bc3.56a1.10a3.44d65.0b75.4
Treat.
Control1.6622.94.083.736.183.451.472.5366.775.1
Stress1.4923.34.033.756.323.651.253.1563.975.0
Clone × Treat.
4Control1.66bc23.04.05cd3.915.923.291.79d1.80a68.777.2
Stress1.77bc22.94.03bcd4.075.733.391.83d1.96ab66.375.5
94Control1.84c22.64.02bc3.676.233.521.58bcd2.26abc70.875.2
Stress1.74bc22.43.91ab3.805.943.411.49bc2.41bcd68.276.0
188Control1.83c23.44.13cde3.836.083.361.73cd2.04ab67.774.5
Stress1.64bc23.13.88a3.716.383.551.13a3.32ef67.074.8
276Control1.78bc22.94.05ce3.706.433.321.31ab2.69cd69.574.4
Stress1.31a23.44.10cde3.766.453.680.99a3.84f64.075.2
360Control1.28a23.34.16de3.735.883.801.57cd2.75cd57.274.5
Stress1.10a24.34.23e3.916.354.321.26ab3.44ef53.173.0
372Control1.65bc22.84.01abc3.626.423.351.21a2.89de67.775.1
Stress1.30a23.33.99abc3.486.753.591.00a3.47ef64.374.7
373Control1.61b22.64.13cde3.676.303.481.12a3.30ef65.575.0
Stress1.59b23.64.09cde3.546.623.641.08a3.59f64.475.8
ANOVA
Clone******************************ns
Treatment****ns**nsns*************ns
Interaction****ns**nsnsns*****nsns
“ns” not significant; *, **, ***, and **** indicate significant differences at the 0.1, 0.05, 0.01, and 0.001 levels of probability, respectively. In each column and for each factor or interaction, different letters indicate significant differences according to Duncan’s multiple range test at the 95% confidence level.
Table 7. Average annual values of berry phenolic quality at harvest for each clone, irrigation treatment, and the interaction (clones × irrigation treatment) during the 3-year period 2018–2020. Total anthocyanins (mg L−1), extractable anthocyanins (mg L−1), polyphenols content (mg L−1), TPI (total phenol index), AE index (anthocyanin extractability index, %), and SM index (seed maturity index, %).
3-Year Period (2018–2020)
CloneColour IntensityToneTotal AnthocyaninsExtractable AnthocyaninsPolyphenols ContentTPIAE Index SM IndexTannins
(mg L−1)
45.0a0.9474034139.6ab19.952.965.4ab3.39ab
945.4ab0.9770434036.8a18.151.362.7a3.51ab
1885.3ab0.9576133545.3b21.456.168.4bc4.34b
2766.7d0.9768228838.2ab17.756.964.2ab3.55ab
3606.2cd1.0667132142.2ab21.053.472.0c7.39c
3725.8bc0.9460734334.0a19.855.367.0abc3.58ab
3736.9d0.9560634738.6ab20.655.067.9abc2.72a
Treat.
Control5.70.9962130738.119.254.266.93.98
Stress6.00.9474535540.420.354.666.74.16
Clone × Treat.
4Control4.70.94680abc35143.8bcd19.051.465.43.66
Stress5.20.95799bc33035.4abc20.854.365.53.12
94Control5.71.01535ab27734.2ab19.050.166.93.24
Stress5.00.93872c40439.4abcd17.252.658.63.78
188Control5.30.99714bc33544.6cd21.054.867.64.55
Stress5.20.91808bc33546.0cd21.857.469.24.13
276Control5.81.01733bc26135.2abc15.758.062.63.61
Stress7.50.93631abc31541.3abcd19.755.865.73.50
360Control6.01.00594abc27434.4abc22.852.873.26.85
Stress6.51.12767bc36850.0d19.254.170.77.93
372Control5.60.99405a30637.7abcd19.252.765.82.99
Stress6.00.88809bc37930.4a20.557.868.14.17
373Control6.81.01683abc34336.9abcd18.159.866.92.98
Stress7.00.89528ab35140.3abcd23.150.268.92.46
ANOVA
Clone****nsnsns**nsns*******
Treatmentnsns***nsnsnsnsns
Interactionnsns**ns**nsnsnsns
“ns” not significant; *, **, ***, and **** indicate significant differences at the 0.1, 0.05, 0.01, and 0.001 levels of probability, respectively. In each column and for each factor or interaction, different letters indicate significant differences according to Duncan’s multiple range test at the 95% confidence level.
Table 8. Average annual values of berry technological quality index (QI technological berry), berry phenolic quality index (QI phenolic berry), and overall berry quality index (QI overall berry) calculated for Monastrell grapes at harvest for each clone, irrigation treatment, and the interaction (clones × irrigation treatment) during the 3-year period 2018–2020 and in year 2021.
3-Year Period (2018–2020)Year 2021
CloneQItechnological berryQIphenolic berryQIoverall berryQItechnological berryQIphenolic berryQIoverall berry
46.25.211.55.34.8abc10.1ab
946.15.211.33.64.1ab7.8a
1886.75.412.13.83.7a7.5a
2766.75.512.25.36.2bc11.5b
3606.57.113.64.47.1c11.5b
3726.85.612.44.64.7abc9.3ab
3736.76.012.74.25.1abc9.3ab
Treat.
Control5.95.111.14.24.38.5
Stress7.16.313.44.75.910.5
Clone × Treat.
4Control5.95.010.96.20b4.410.6bcde
Stress6.55.512.04.40ab5.29.6abcde
94Control5.74.510.33.75ab3.37.2abc
Stress6.45.912.33.50ab4.88.3abcde
188Control5.85.211.04.40ab4.08.4abcde
Stress7.55.613.23.20a3.36.6a
276Control5.94.310.23.60ab4.48.0abcd
Stress7.56.714.27.00b8.015.0e
360Control5.86.412.24.75ab7.011.8de
Stress7.37.815.14.00ab7.311.3cde
372Control6.34.711.03.60ab3.06.6a
Stress7.36.413.75.60b6.412.0e
373Control6.15.811.92.80a4.06.8ab
Stress7.36.113.45.50b6.311.8de
ANOVA
Clonensnsnsns***
Treatment**********ns*****
Interactionnsnsns**ns***
“ns” not significant; *, **, ***, and **** indicate significant differences at the 0.1, 0.05, 0.01, and 0.001 levels of probability, respectively. In each column and for each factor or interaction, different letters indicate significant differences according to Duncan’s multiple range test at the 95% confidence level.
Table 9. Average annual values of mineral composition of must at harvest for each clone, irrigation treatment, and the interaction (clones × irrigation treatment) during the 3-year period 2018–2020. Data are expressed as mg L−1.
3-Year Period (2018–2020)
CloneKCaMgPBCuMnZn
41951c69.4b90.9bc83.1ab10.6a0.2860.84b0.212ab
941604a58.6a85.7ab75.7a10.0a0.2570.77ab0.193a
1881744ab66.3ab87.6ab80.3ab10.3a0.2640.65a0.177a
2761791bc64.9ab83.4a111.4c10.3a0.2780.86b0.222ab
3602325d83.1c96.4c112.6c13.8b0.3181.17c0.246c
3721744ab64.1ab87.3ab92.0b10.5a0.2561.09c0.211ab
3731823bc62.8ab84.3a93.9b10.4a0.2430.83b0.182a
Treat.
Control188965.788.488.29.90.2890.890.197
Stress182168.487.597.311.80.2550.890.216
Clone × Treat.
4Control1938de71.8de93.2cd76.1ab8.7a0.277bc0.97de0.217bc
Stress1965e66.9cd88.5abc90.0bcd12.5d0.295bc0.72abc0.208abc
94Control1707abcde62.7abcd90.2abc87.5bc9.7ab0.268bc0.87bcde0.182ab
Stress1500a54.4a81.3a64.0a10.2bc0.247abc0.67ab0.204abc
188Control1922de64.3abcd86.6abc83.9bc9.5ab0.291bc0.73abc0.184ab
Stress1566ab68.4cd88.6abc76.7ab11.1bcd0.237ab0.58a0.170ab
276Control1687abcd55.3ab84.1ab80.7abc9.8ab0.262abc0.68ab0.143a
Stress1895cde74.5def82.7ab142.0f10.7abcd0.294bc1.03def0.300d
360Control2329f85.3f99.5d111.0e12.1cd0.330c1.26f0.256cd
Stress2321f80.9ef93.3bcd114.2e15.5e0.305bc1.09ef0.236bcd
372Control1823bcde62.1abcd81.0a98.0cde9.0ab0.332c0.92cde0.223bc
Stress1665abc66.0bcd93.5cd86.0bc12.0cd0.179a1.27f0.200abc
373Control1815bcde58.3abc84.0ab79.9abc10.2abc0.261abc0.78abcd0.172ab
Stress1832bcde67.4cd84.7abc108.0de10.6abcd0.225ab0.88bcde0.192abc
ANOVA
Clone********************ns******
Treatmentnsnsns*********nsns
Interaction***********************
“ns” not significant; **, ***, and **** indicate significant differences at the 0.1, 0.05, 0.01, and 0.001 levels of probability, respectively. In each column and for each factor or interaction. Different letters indicate significant differences according to Duncan’s multiple range test at the 95% confidence level.
Table 10. Average annual values of berry technological quality at harvest for each clone, irrigation treatment, and the interaction (clone × irrigation treatment) during year 2021. TSS (total soluble solids, °Brix), titratable acidity (g tartaric acid L−1), IM (maturity index, °Brix/ Titratable acidity), tartaric acid (g L−1), and malic acid (g L−1), YAN (yeast available nitrogen).
Year 2021
CloneBerry WeightTSSpHTotal AcidityIMTartaric AcidMalic AcidTartaric/Malic% Juice% H2OYAN
(mg L−1)
41.57b22.4cd3.953.366.52.77ab2.18abc1.22a55.570.6bc112a
941.53b20.8a4.163.306.42.66a1.96abc1.39ab58.970.9c115a
1881.46b21.2ab4.073.216.53.12b2.22bc1.35ab55.370.2bc135a
2761.53b22.6d4.013.057.42.68a1.96abc1.41ab54.068.1a90a
3601.09a22.1cd4.193.266.93.63c2.36c1.61b52.467.8a196b
3721.43b22.0abc4.093.237.02.95ab1.78a1.58b56.969.4abc110a
3731.57b22.2cd4.133.266.92.99ab1.82ab1.59b57.269.0ab120a
Treat.
Control1.5321.74.093.286.62.952.091.4257.170.0123
Stress1.3922.14.083.207.03.001.981.4854.368.8128
Clone × Treat.
4Control1.6223.13.913.296.72.912.35cd1.2656.8ab70.2cde110
Stress1.5221.74.003.436.42.632.00abcd1.1854.2ab71.0de114
94Control1.6320.84.203.396.22.732.07abcd1.2958.7ab70.7de107
Stress1.4420.74.123.216.62.581.84abc1.4959.0b71.2e122
188Control1.5221.44.103.416.03.022.28bcd1.2553.3ab70.4cde114
Stress1.4021.04.033.027.13.222.17abcd1.4457.2ab70.0bcde154
276Control1.5521.44.123.046.92.752.06abcd1.4260.8b70.8de105
Stress1.5123.83.913.057.82.601.86abcd1.4047.2a65.4a75
360Control1.2622.84.113.237.23.491.97abcd1.8055.3ab67.4ab196
Stress0.9321.54.273.306.53.772.75d1.4249.5a68.1abc196
372Control1.6021.24.103.286.62.672.00abcd1.4659.0ab71.0e108
Stress1.2722.84.093.177.33.241.56a1.7054.8ab67.7ab113
373Control1.5021.44.103.316.53.061.92abcd1.4655.9ab69.7bcde118
Stress1.6423.04.153.217.32.931.71ab1.7258.5ab68.3abcd122
ANOVA
Clone******nsnsns********ns*****
Treatment**nsnsnsnsnsnsns*****ns
Interactionnsnsnsnsnsns**ns****ns
“ns” not significant; **, ***, and **** indicate significant differences at the 0.1, 0.05, 0.01, and 0.001 levels of probability, respectively. In each column and for each factor or interaction. Different letters indicate significant differences according to Duncan’s multiple range test at the 95% confidence level.
Table 11. Average annual values of berry phenolic quality at harvest for each clone, irrigation treatment, and the interaction (clone × irrigation treatment) during year 2021. Total anthocyanins (mg L−1), extractable anthocyanins (mg L−1), polyphenols content (mg L−1), TPI (total phenol index), AE index (anthocyanin extractability index, %), and SM index (seed maturity index, %).
Year 2021
CloneColour IntensityToneTotal AnthocyaninsExtractable AnthocyaninsPolyphenols ContentTPIAE IndexSM IndexTannins
(mg L−1)
44.721.18ab699a45943.8ab16.1a37.857.3a4.77ab
945.091.31c647a35339.8a14.7a44.263.1ab3.31a
1884.181.21abc652a36446.1ab16.3a44.466.6bc5.30ab
2765.861.10a1090b49554.6b18.8a52.961.9ab5.10ab
3605.051.15ab756a51267.7c22.9b44.570.0c7.59c
3725.211.13a724a43044.2ab16.0a39.364.7bc5.53b
3735.821.26bc748a48649.1ab17.7a41.760.9ab4.32ab
Treat.
Control5.101.2667239944.216.042.963.44.30
DI5.161.1384648654.519.044.263.65.96
Clone × Treat.
4Control4.811.17bcd693ab48745.816.833.557.12.98
stress4.631.15abc704ab43141.815.342.157.46.56
94Control5.191.31d578a32040.214.743.665.63.09
stress4.991.27bcd715ab38639.414.744.860.63.52
188Control4.381.29cd687ab34844.615.549.567.04.88
stress3.991.13ab618a38047.617.039.366.25.71
276Control5.021.29cd703ab34940.315.349.061.03.27
stress6.690.91a1477c64269.022.256.862.86.92
360Control5.781.15abc784ab50758.820.841.966.15.65
stress4.331.15abc727ab51876.725.047.273.99.54
372Control4.941.21bcd642ab32733.112.446.064.05.33
stress5.471.06a806ab53255.319.732.565.55.72
373Control5.601.29cd619ab45646.516.436.862.84.87
stress6.041.22bcd876b51651.819.046.658.93.77
ANOVA
Clonens******ns******ns******
Treatmentns**************nsns***
Interactionns*****nsnsnsnsnsns
“ns” not significant; **, ***, and **** indicate significant differences at the 0.1, 0.05, 0.01, and 0.001 levels of probability, respectively. In each column and for each factor or interaction, different letters indicate significant differences according to Duncan’s multiple range test at the 95% confidence level.
Table 12. Average values of chemical parameters, chromatic characteristics, and phenolic and aminoacidic composition of wines at the end of the malolactic fermentation for clones 372, 276, 188, 94, and 4 (under control conditions) in 2021.
Parameter494188276372ANOVA
Technological parameters
Alcohol degree (°)12.45c10.9a11.25ab11.2ab11.55b***
pH3.32a3.44b3.57d3.56d3.48c****
Glycerol (mg L−1)9079963087911101510615ns
Chromatic characteristics
Colour intensity3.66a3.99c4.02c3.8b4.16d****
L*50.5d49.1b48.8a49.3c48.7a****
a*31.85ab31.62a31.76ab31.78ab32.41bns
b*7.84c5.68a6.42b9.53d7.94c****
C*32.832.1332.4033.1833.05ns
h13.83c10.51a11.42b16.69d13.90c****
Polyphenol content494188276372ANOVA
Total phenol index (TPI)26.7024.9025.8125.9529.48ns
Total Anthocyanins (mg L−1)55.7a58.3abc62.5c56.5ab61.4bc**
Antioxidant activity
(mM trolox)
13.7513.2014.4916.3614.63ns
Total tannins
(mg catequin L−1)
970a1007ab1101bc1092b1190c***
Anth./tan. ratio0.058b0.058b0.057b0.052a0.052a***
Quercetin 3-galactoside
(mg L−1)
0.22b0.19a0.24b0.29c0.36d****
Miricetin 3-glucoside+ Miricetin 3-glucuronide
(mg L−1)
2.73c2.0a2.17a2.43b2.53b****
Quercetin 3-glucuronide+ Quercetin 3-glucoside
(mg L−1)
2.7d1.7a2.03b2.5cd2.43c****
Resveratrol
(mg L−1)
<0.10<0.10<0.10<0.10<0.10-
Amino acid profile
(μmol ml−1)
494188276372ANOVA
His28.131.528.224.825.2ns
Ser5.31b5.32b4.67b1.77a4.14b***
Arg1.642.652.271.421.44ns
Gly39.137.854.436.668.6ns
Asp1.711.762.061.271.72ns
Glu61.958.059.649.455.5ns
Thr28.926.227.922.825.9ns
Ala9.913.311.79.612.9ns
Pro79.979.282.864.275.2ns
Cys6.327.47.622.08.4ns
Lys42.637.443.135.342.1ns
Tyr2.61a14.93c11.48b3.05a4.23a****
Met5.08a8.43b5.16a4.42a4.06a**
Val0.50a2.50b1.83b0.33a0.83a****
Ile0a1.67c1.00b0a0.33a****
Leu0.33a1.67b1.33b0.33a0.33a***
Phe0a1.33c1.0b0a0a****
Total314351346277331ns
“ns” not significant; **, ***, **** indicate significant differences at the 0.1, 0.05, 0.01, and 0.001 levels of probability, respectively. In each row and for each factor, different letters indicate significant differences according to Duncan’s multiple range test at the 95% confidence level.
Table 13. Average values of aromatic compounds (concentration and composition) of wines at the end of malolactic fermentation, for clones 372, 276, 188, 94, and 4 (under control conditions) in 2021.
Aromatic Compounds (mg L−1)494188276372ANOVA
Ethyl acetate103a102a117b119b139c****
1-Propanol52d38a42b37a47c****
2-Methyl 1-propanol103b106b88a126c138d****
3-Methyl 1-Butanol acetate0.66a0.88b0.63a0.61a0.81b****
3-Methyl 1-butanol160c162c119a136b156c****
Ethyl hexanoate2.492.422.482.402.37ns
1-Hexanol3.99d3.28b2.57a3.90d3.59c****
Ethyl octanoate1.19d0.54b1.14c0.58b0.44a****
Linalool0.013b0.014b0.014b0.011a0.013b****
3-Methyl tio 1-propanol3.49d2.84b2.85b2.51a3.18c****
β-Damascenone0a2.18c2.42d2.09b2.04b****
Citronellol0.019a0.023b0.025b0.019a0.023b****
Ethyl dodecanoate0.085c0.063b0.096d0.059ab0.054a****
Hexanoic acid9.09c8.41a9.25d8.70b8.46a****
2-Phenyl ethanol53b44a45a46a52b****
Ethyl tetradecanoate0.0190.0170.0190.0170.015ns
Nerolidol0.075c0.041a0.059b0.062b0.058b****
Octanoic acid1.90c0.88a1.46b0.83a0.97a****
Ethyl hexadecanoate8.29c5.28a8.45c5.87b5.61ab****
Decanoic acid0.14b0.099a0.13b0.10a0.11a****
9-Decenoic acid4.01d4.00cd3.99b0a3.99bc****
ΣTotal (mg L−1)499c479b438a486bc560d****
“ns” not significant; **** indicate significant differences at the 0.1, 0.05, 0.01, and 0.001 levels of probability, respectively. In each column and for each factor or interaction, different letters indicate significant differences according to Duncan’s multiple range test at the 95% confidence level.
Disclaimer/Publisher’s Note: The statements, opinions and data contained in all publications are solely those of the individual author(s) and contributor(s) and not of MDPI and/or the editor(s). MDPI and/or the editor(s) disclaim responsibility for any injury to people or property resulting from any ideas, methods, instructions or products referred to in the content.

