Article

Effect of Fomesafen on the Nutritional Quality and Amino Acids of Vigna angularis Based on Metabonomics

1
College of Food Science, Heilongjiang Bayi Agricultural University, Daqing 163319, China
2
Chinese National Engineering Research Center, Daqing 163319, China
*
Author to whom correspondence should be addressed.
These authors contributed equally to this work.
Agronomy 2023, 13(2), 452; https://doi.org/10.3390/agronomy13020452
Submission received: 27 December 2022 / Revised: 9 January 2023 / Accepted: 10 January 2023 / Published: 2 February 2023
(This article belongs to the Section Crop Breeding and Genetics)

Abstract

:
At present, fomesafen is widely used to control weeds in Vigna angularis fields. To explore the effect of fomesafen (FSA) on the nutritional value and amino acids of Vigna angularis, the protein, fat, water, ash, sand yield, and hundred-grain weight of Vigna angularis were measured using Vigna angularis sprayed with or without FSA. A non-targeted metabonomics and a high-throughput targeted amino acid analysis of Vigna angularis were performed using the metabonomics technology of liquid chromatography–mass spectrometry (LC-MS). The results showed that the protein (23.39 ± 0.16%) and fat (0.49 ± 0.05%) in sprayed Vigna angularis (Z-2-GS-2) were significantly different from the protein (19.88 ± 0.05%) and fat (0.71 ± 0.06%) in non-sprayed Vigna angularis (GS), indicating that a certain amount of FSA could promote the synthesis of protein in Vigna angularis and inhibit the formation of fat. A total of 63 metabolites with significant differences were screened from the non-targeted metabonomic analysis, including isoprene lipids, carboxylic acids, organic oxygen compounds, and carboxylic acid derivatives. Seventeen metabolic pathways were enriched. Five metabolic pathways with significant differences were screened according to p < 0.05, including alanine, aspartic acid, glutamic acid metabolism, tryptophan metabolism, and arginine biosynthesis, indicating that FSA had a significant effect on amino acid metabolism in Vigna angularis. Through targeted amino acid analysis, 21 different amino acids in Vigna angularis were accurately determined qualitatively and quantitatively. Among them, the contents of Asp and Glu increased under the influence of FSA, while the contents of Phe, His, and Ile decreased, which proved that FSA would cause the sweet taste of Vigna angularis to increase, reducing the flavor. Use of FSA will lead to the increase in protein content, ash content, and sand yield of Vigna angularis, while also leading to the decrease of fat content, water content, and hundred-grain weight. The use of FSA will also have a particular impact on the nutritional value, health care efficacy, and taste of Vigna angularis. The results of this study provide new ideas for follow-up research on the rational use of FSA in the field of Vigna angularis and the development of Vigna angularis health food.

1. Introduction

Vigna angularis is also known as the red bean. Its economic value ranks first among all cereals [1]. It is rich in protein, fat, carbohydrates, and other nutrients, as well as eight essential amino acids [2], saponin, folic acid, and other active substances [3]. It performs the health functions of nourishing blood, supplementing qi, and providing anti-aging benefits, and is a natural antioxidant food. In addition, Li Shizhen’s Compendium of Materia Medica recorded in detail that Vigna angularis has a high medicinal value and is an Important food derived from medicine and food in China [4,5]. It is also an agricultural product for export [6,7]. The planting process of the Vigna angularis is often accompanied by the invasion of various weeds, which is not conducive to the absorption of nutrients by Vigna angularis.
With the development of science and technology, large-scale agricultural production is becoming more common. The original method of manual weeding is time-consuming, laborious, and inefficient, far from meeting the requirements of high-quality production. Chemical weeding not only has a high weeding efficiency and saves time; it can also achieve a good weeding effect. Various herbicides are widely used in farmland to control weeds in the field, among which FSA is a relatively common herbicide used to control broadleaf weeds. However, whether using herbicides is reasonable directly affects the quality of crops. FSA has a good penetration effect on cells [8]. FSA has a good control effect on monocotyledon weeds and dicotyledon weeds after seeding [9] and is also a good choice for increasing yield [10]. The principle of FSA weed control is to inhibit weeds’ photosynthesis, block carbon metabolism, and ensure that the energy supply required for plant growth is insufficient until the energy is completely consumed. At the same time, it also affects the growth metabolism and nutrient biosynthesis of Vigna angularis, thus affecting its quality formation. Some scholars found that the control rate of quinoa, Amaranthus retroflexus L., Xanthium sibiricum Patrin ex Widder, and Solanum nigrum L. in Vigna angularis fields using FSA reached 100% [11]. When the spraying an amount of 25% FSA (1500 mL/hm2), Vigna angularis increased production by 10%–17% [12]. The research on the use of FSA in Vigna angularis fields is primarily concerned with the control effect of FSA on weeds, but the research on the impact of FSA on Vigna angularis quality has not been reported.
Therefore, this study measured the protein, fat, water, ash content, sand yield, and hundred-grain weight of Vigna angularis after FSA stress, using liquid chromatography–mass spectrometry (LC-MS) technology to conduct non-targeted metabonomics and a high-throughput targeted amino acid metabonomics analysis of Vigna angularis, exploring the impact of FSA on the quality of Vigna angularis and 21 kinds of amino acids. The aim of this paper is to provide a theoretical basis for the rational use of FSA in Vigna angularis fields and the development of Vigna angularis health products (Vigna angularis products that prevent constipation, eliminate edema, and strengthen the spleen and stomach).

2. Materials and Methods

2.1. Main Reagents and Equipment

Grain Vigna angularis was purchased from Heilongjiang Anda Farm; fomesafen (250 g/L), Heilongjiang Jiuzhou Pesticide Co. Ltd., Jiamusi, China; twenty-one amino acid standards at 20 µmol/mL (Ala, Arg, Asn, Asp, Gin, Glu, Gly, His, iIe, L-Cys, Leu, L-Hyd, L-Trp, Lys, Met, Phe, Pro, Ser, Thr, Tyr, and Val); methanol, acetonitrile (chromatographic grade), Fisher Chemical Reagent Co. Ltd., Loughborough, UK; petroleum ether (boiling range: 30 °C–60 °C), formic acid (chromatographic grade), Shanghai CNW Reagent Co. Ltd., Shanghai, China; copper sulfate, potassium sulfate, sulfuric acid, boric acid, methyl red indicator, bromocresol green indicator, methylene blue indicator, sodium hydroxide, isopropanol (chromatographic grade), Merck Reagent Co. Ltd., Darmstadt, Germany; 2-Chloro-L-phenylalanine (purity ≥98%), Shanghai Adamas-beta Reagent Co. Ltd., Shanghai, China.
Centrifuge 5430 R freeze, centrifuge Eppendorf Company; a LNG-T88 fast centrifugal concentration dryer, Taicang Huamei Biochemical Instrument Factory, Suzhou, China; jXDC-20 Nitrogen Sweeper, Shanghai Jingxin Industrial Development Co., Ltd., Shanghai, China; vanquish Horizon UHPLC liquid chromatography system; Q-Exactive HF-X mass spectrometer, Thermo Scientific Company, Waltham, MA, USA; trap 6500 + AB SCIEX company, Framingham, MA, USA; Haining K9860 Automatic Kjeldahl Nitrogen Tester, Shanghai Haineng Future Technology Group Co. Ltd., Shanghai, China; MB25ZH Moisture Tester, Shanghai Ohus (Changzhou) Co., Ltd., Changzhou, China.

2.2. Vigna angularis Planting Experiment under Fomesafen Stress

Plump Vigna angularis beans with a uniform grain size were rinsed with deionized water four times and then disinfected with a 30% hydrogen peroxide solution for 5 min. The beans were then washed with deionized water 4–6 times until the foam completely disappeared. They were then dried. The FSA stress experiment was carried out using Vigna angularis pots for treatment. Three replicate experiments were set up with six pots of Vigna angularis each. When the Vigna angularis seedlings grew between two and three leaves, they were treated with the herbicide FSA (0.3 mL/m2). The control group was treated with the same volume of water. Two sprays were given at an interval of 14 d, and the Vigna angularis samples were collected when they reached maturity.

2.3. Sample Pretreatment

The collected Vigna angularis samples were placed in the sun to dry for 3 d. They were then placed in an ultra-low-temperature refrigerator to fully pre-freeze for 6 h. Following this, they were freeze-dried for 48 h using a freeze-dryer. The freeze-dried samples were ground with a tissue grinder and passed through a 60-mesh sieve (0.3 mm). Finally, they were placed in a plastic bag and stored in a refrigerator at −20 °C for later use.

2.4. Determination of Quality Indexes of Vigna angularis under FSA Stress

The protein, fat, water, and ash contents in Vigna angularis according to GB 5009.5-2016, GB 5009.6-2016, GB 5009.3-2016, and GB 5009.4-2016 were determined. The sand yield rate was determined according to Tang Siyu [13]. Each treatment group randomly selected 100 Vigna angularis samples for weighing. Weighing was repeated three times. The average value obtained was the final weight of the 100 Vigna angularis samples.

2.5. Untargeted Metabolomic Assays

2.5.1. Untargeted Metabolomics Sample Processing

The 50 mg sample was accurately weighed and placed in a 2 mL centrifuge tube. A 6 mm grinding bead was added, followed by 400 µL of extraction solution (methanol: water = 4:1 (v:v)) containing 0.02 mg/mL of internal standard (L-2-chlorophenyl alanine). The frozen tissue was ground for 6 min (−10 °C, 50 Hz), and a low-temperature ultrasonic extraction was carried out for 30 min (5 °C, 40 kHz). The sample was placed at −20 °C for 30 min and centrifuged for 15 min (13,000× g, 4 °C). The supernatant was pipetted into a sample vial with an inner cannula for computer analysis. Finally, 20 µL of the supernatant was pipetted and mixed. A control sample was used to detect the stability state of the instrument during the sample collection process.

2.5.2. Untargeted Metabolomics LC-MS Detection

Chromatography was carried out under the conditions of Lin et al. [14]. Mass spectrometry was carried out under the conditions as per Wang [15] with slight modifications. The capillary temperature was 325 °C, the heating temperature was 425 °C, and the resolution of MS2 was 7500.

2.6. Targeted Amino Acid Metabolomic Detection

2.6.1. Extraction of Amino Acid Metabolites

The 20 mg sample was accurately weighed, and 500 μL was added to the sample-extraction solution (acetonitrile: water = 1:1). The sample was then ground with a freezer mill for 6 min (−10 °C, 50 Hz), sonicated for 30 min (5 °C, 40 kHz), and centrifuged at 13,000× g for 5 min at 4 °C. A total of 40 μL of supernatant was added to 160 μL of extract to dilute it. This was then vortexed, mixed, and centrifuged at 13,000× g for 5 min at 4 °C. The supernatant was then run on the machine for detection.

2.6.2. LC-MS Detection

Chromatographic conditions: ExionLC AD system; Waters BEH Amide (100×2.1 mm, 1.7 μm); liquid chromatography column, column temperature 35 °C; injection volume, 2 μL. Mobile phase A (0.4% formic acid in 20 mM ammonium formate-95% acetonitrile) and mobile phase B (0.4% formic acid in 20 mM ammonium formate-5% acetonitrile in water).
Mass spectrometry conditions: AB SCIEX QTRAP 6500+; positive mode detection; Curtain Gas (CUR) 35; Collision Gas (CAD) Medium; IonSpray Voltage (IS) 5500; Temperature (TEM) 350; Ion Source Gas1 (GS1) 70; and Ion Source Gas2 (GS2) 70.

2.6.3. Preparation of Amino Acid Standard Solution

Twenty-one types of amino acids were accurately weighed to a standard 10 mg each. Next, 0.1 mol/L of HCl was added to dissolve the amino acids, followed by vortex mixing to produce 20 μmol/mL of standard stock solution. Acetonitrile 90%, diluted to 1 mL, was added to 25 μL of the standard stock solution. The standard solution was mixed and then gradually diluted according to the concentration gradient calibration of standard solution in a 1.5 mL EP tube for LC-MS detection.

2.6.4. Calibration Curve Equation

Table 1 shows the standard curves of 21 amino acids. The ratio of peak areas of the target compound to the corresponding internal standard is represented by y, and x represents the concentration of the target compound (μmol/L). The linearity R2 of all indicators is more significant than 0.99, indicating good linearity.

2.7. Data Processing

All quality index data were preprocessed using SPSS 25, and the data matrix was imported into Origin 2018 for drawing. Non-targeted metabonomics offline data were preprocessed with Progenesis QI (USA) software for peak extraction, etc., and the extracted characteristic peaks were searched and identified using the public metabolome databases KEGG and HMDB. The matched metabolic sets were used in the ropes (R) software for multivariate statistical analysis, combined with a p < 0.05 Student’s t-test and a VIP > 1 in an orthogonal partial least-squares discriminant analysis (OPLS-DA) to screen out differential metabolites. Next, a KEGG pathway enrichment analysis was conducted. Target amino acid metabonomics offline data were automatically identified and integrated with default parameters in AB Science quantitative software OS. They assisted in a manual inspection and a PCA analysis of principal components, and a hierarchical cluster analysis was performed on the detected amino acids. Finally, differential amino acids were screened according to the Student’s t-test, p < 0.05.

3. Results

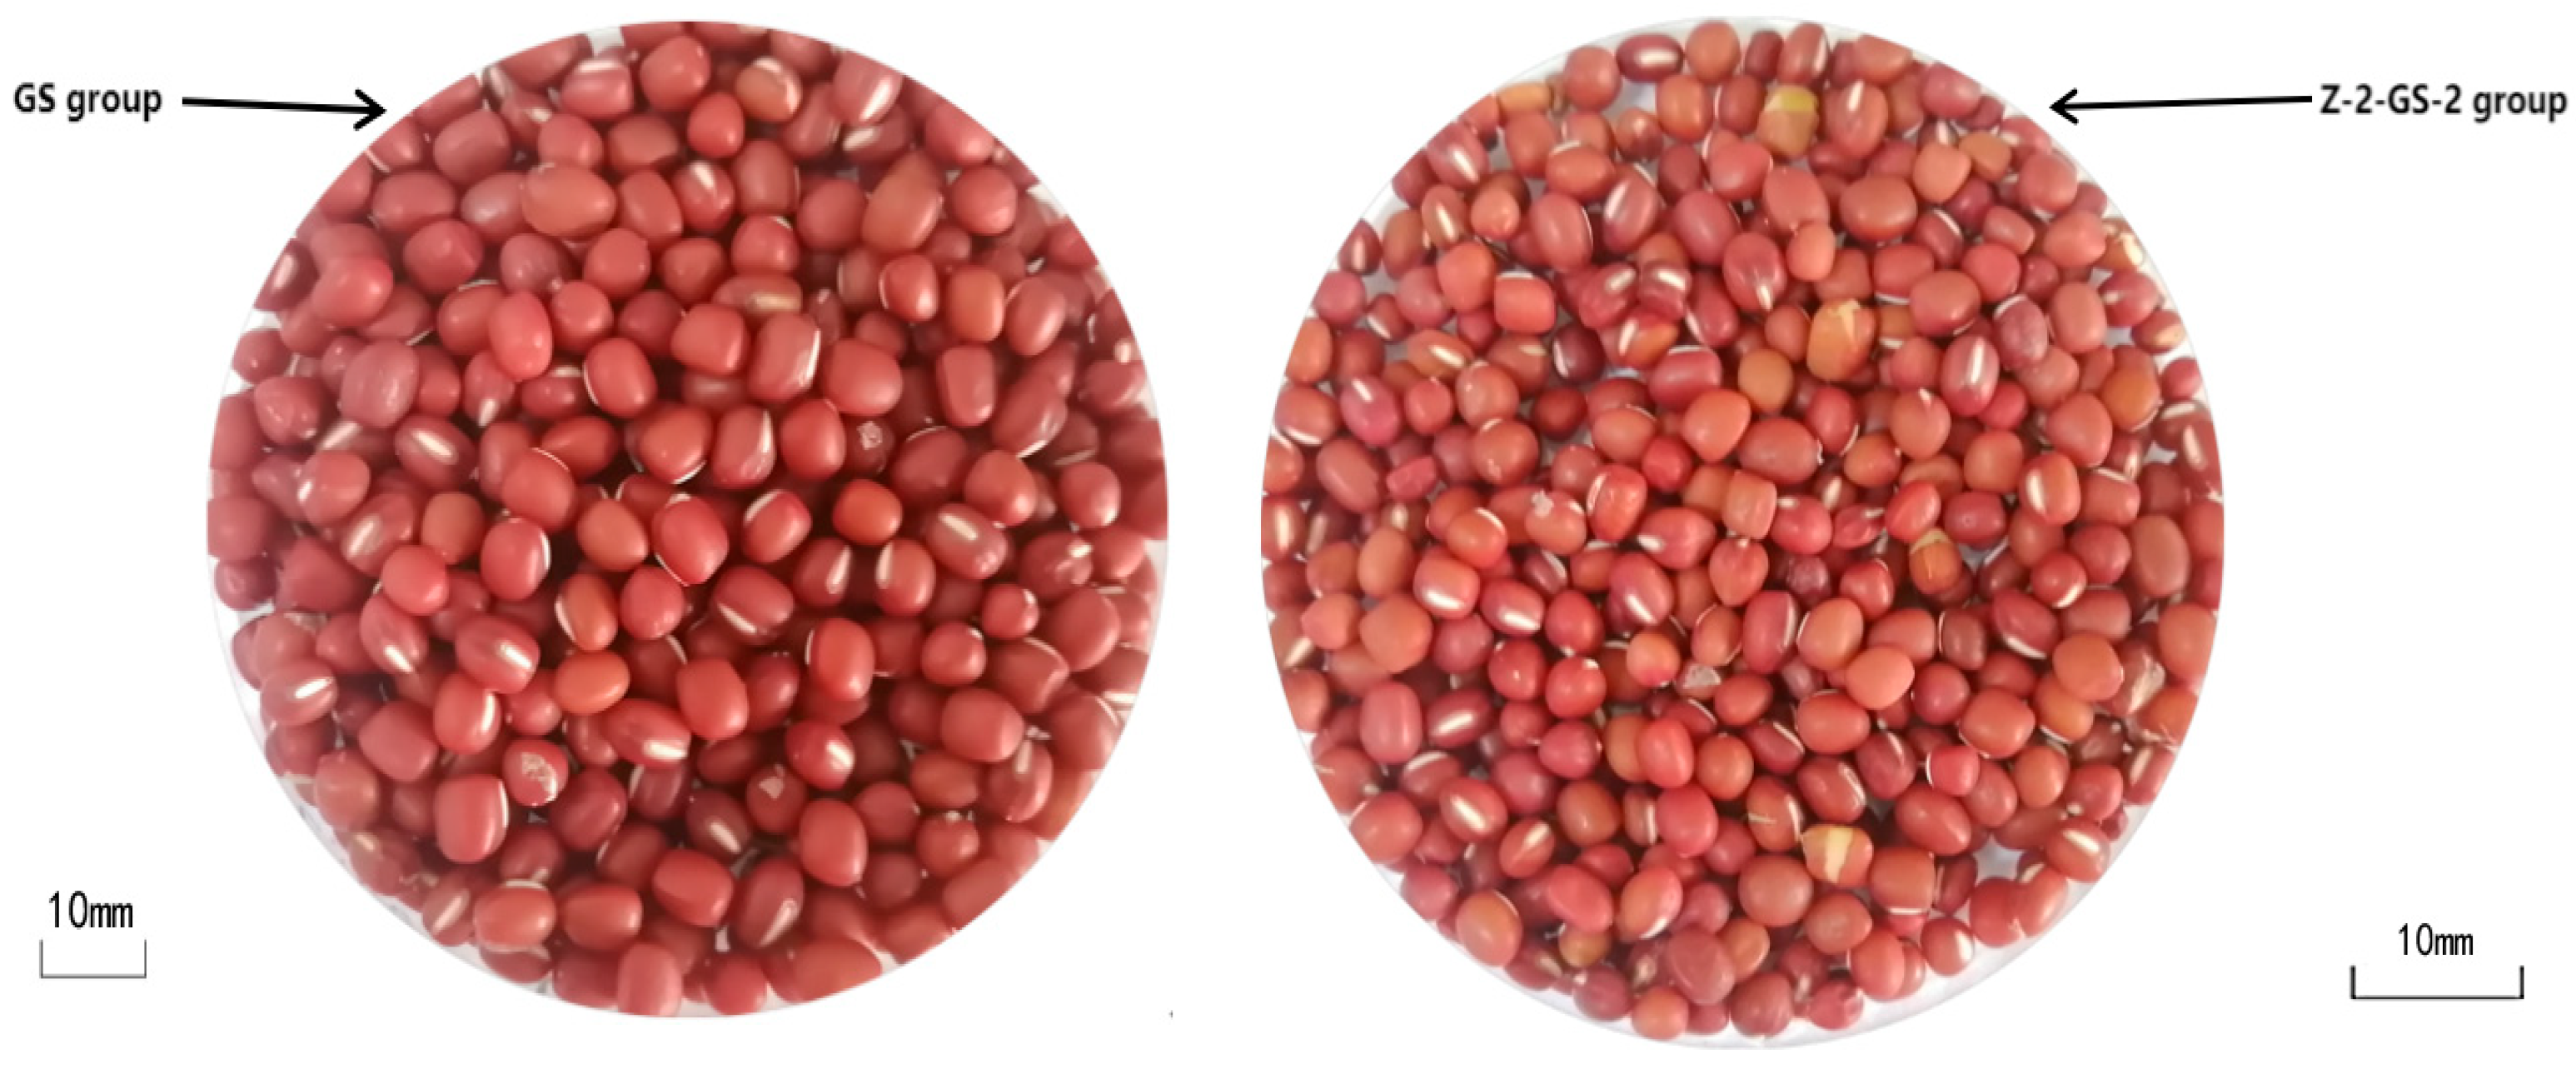
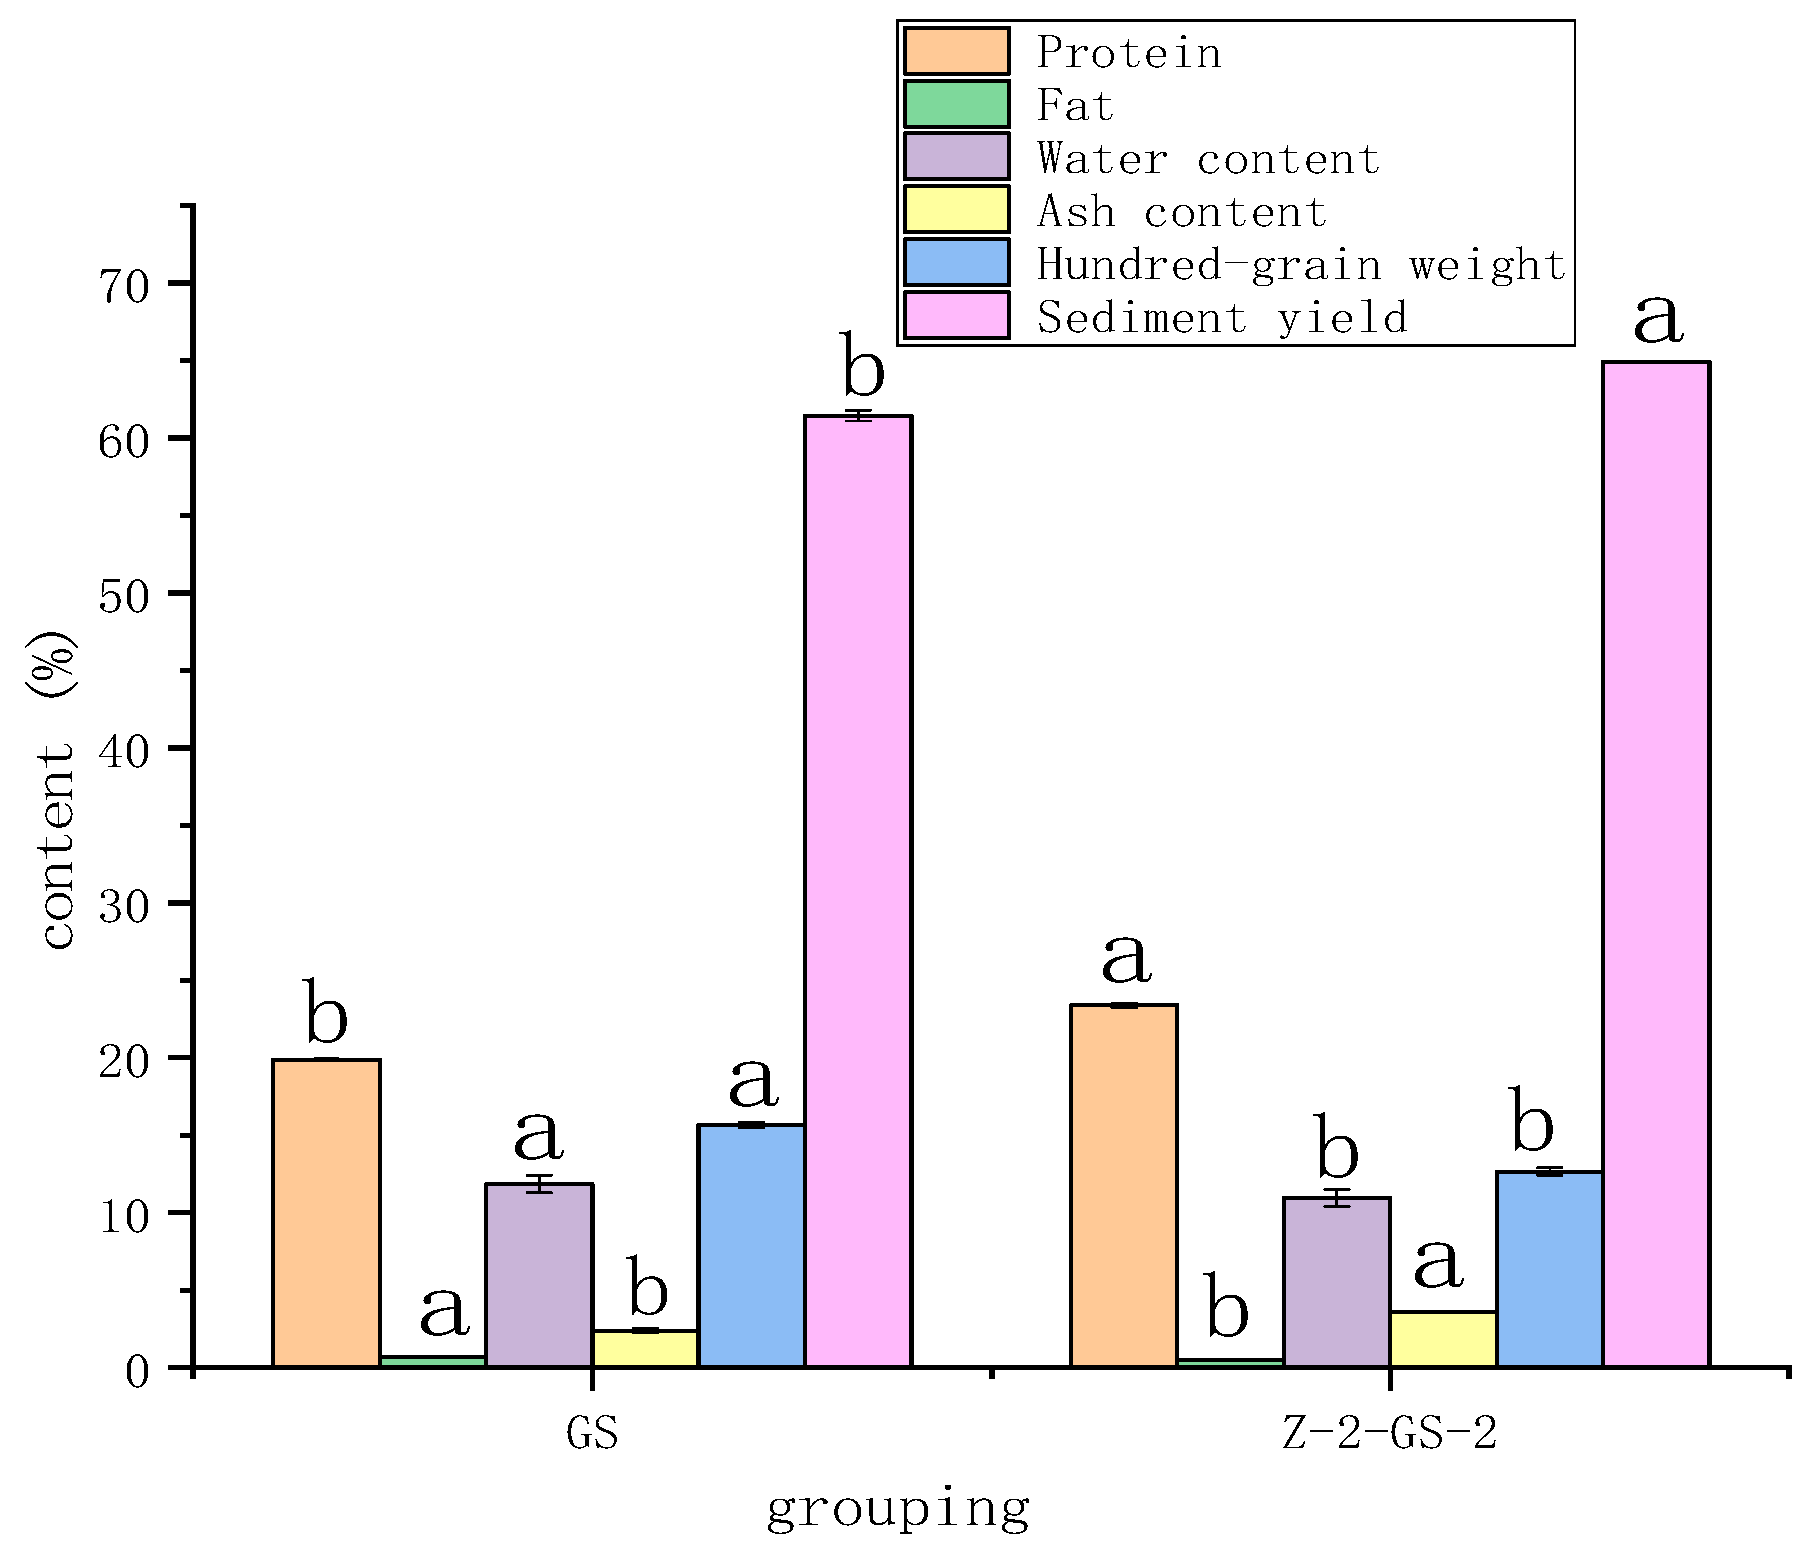
3.1. Effect of FSA Stress on Appearance and Quality of Vigna angularis

Spraying the herbicide FSA in a Vigna angularis field will cause a short period of yellowing and weak damage to the Vigna angularis seedlings, effects which disappear in about a week. As time goes on, the Vigna angularis seedlings will resume a series of growth processes such as flowering, podding, and ripening. When compared to the control group, FSA treatment resulted in the poor growth of the Vigna angularis seedlings and a lower pod setting, thus affecting the appearance of the Vigna angularis plants. After the podding of seedlings not treated with FSA, the Vigna angularis are a dark red–brown, uniform in color, even and full in grain, and free of diseased and wormhole grains. However, after the podding of seedlings treated with FSA, the Vigna angularis are mostly light yellow and uneven in color, small and not full in grain, and demonstrate variegated, broken, and wormhole grains. A comparison is shown in Figure 1.
Figure 2 shows the effect of FSA stress on the quality indexes of Vigna angularis such as protein, fat, water, ash content, hundred-grain weight, and sand yield. When compared with the GS group, the Z-2-GS-2 group sprayed with Vigna angularis (Z-2-GS-2) contains protein (23.39 ± 0.16%), fat (0.49 ± 0.05%), water (10.98 ± 0.54%), and ash content (3.62 ± 0.02%) The sand yield rate (64.90 ± 0.02%) and 100-grain weight (12.66 ± 0.24 g/100 grains) were significantly different from those of non-sprayed Vigna angularis (GS) in terms of protein (19.88 ± 0.05%), fat (0.71 ± 0.06%), water (11.86 ± 0.56%), ash (2.40 ± 0.15%), sand yield rate (61.43 ± 0.33%), and 100-grain weight (15.66 ± 0.18 g/100 grains). The use of FSA in the Vigna angularis field led to an increase in protein content, ash content, and the sand yield of Vigna angularis, while the fat content, water content, and hundred-grain weight decreased.

3.2. Non-Targeted Metabolomic Analysis of Vigna angularis under FSA Stress

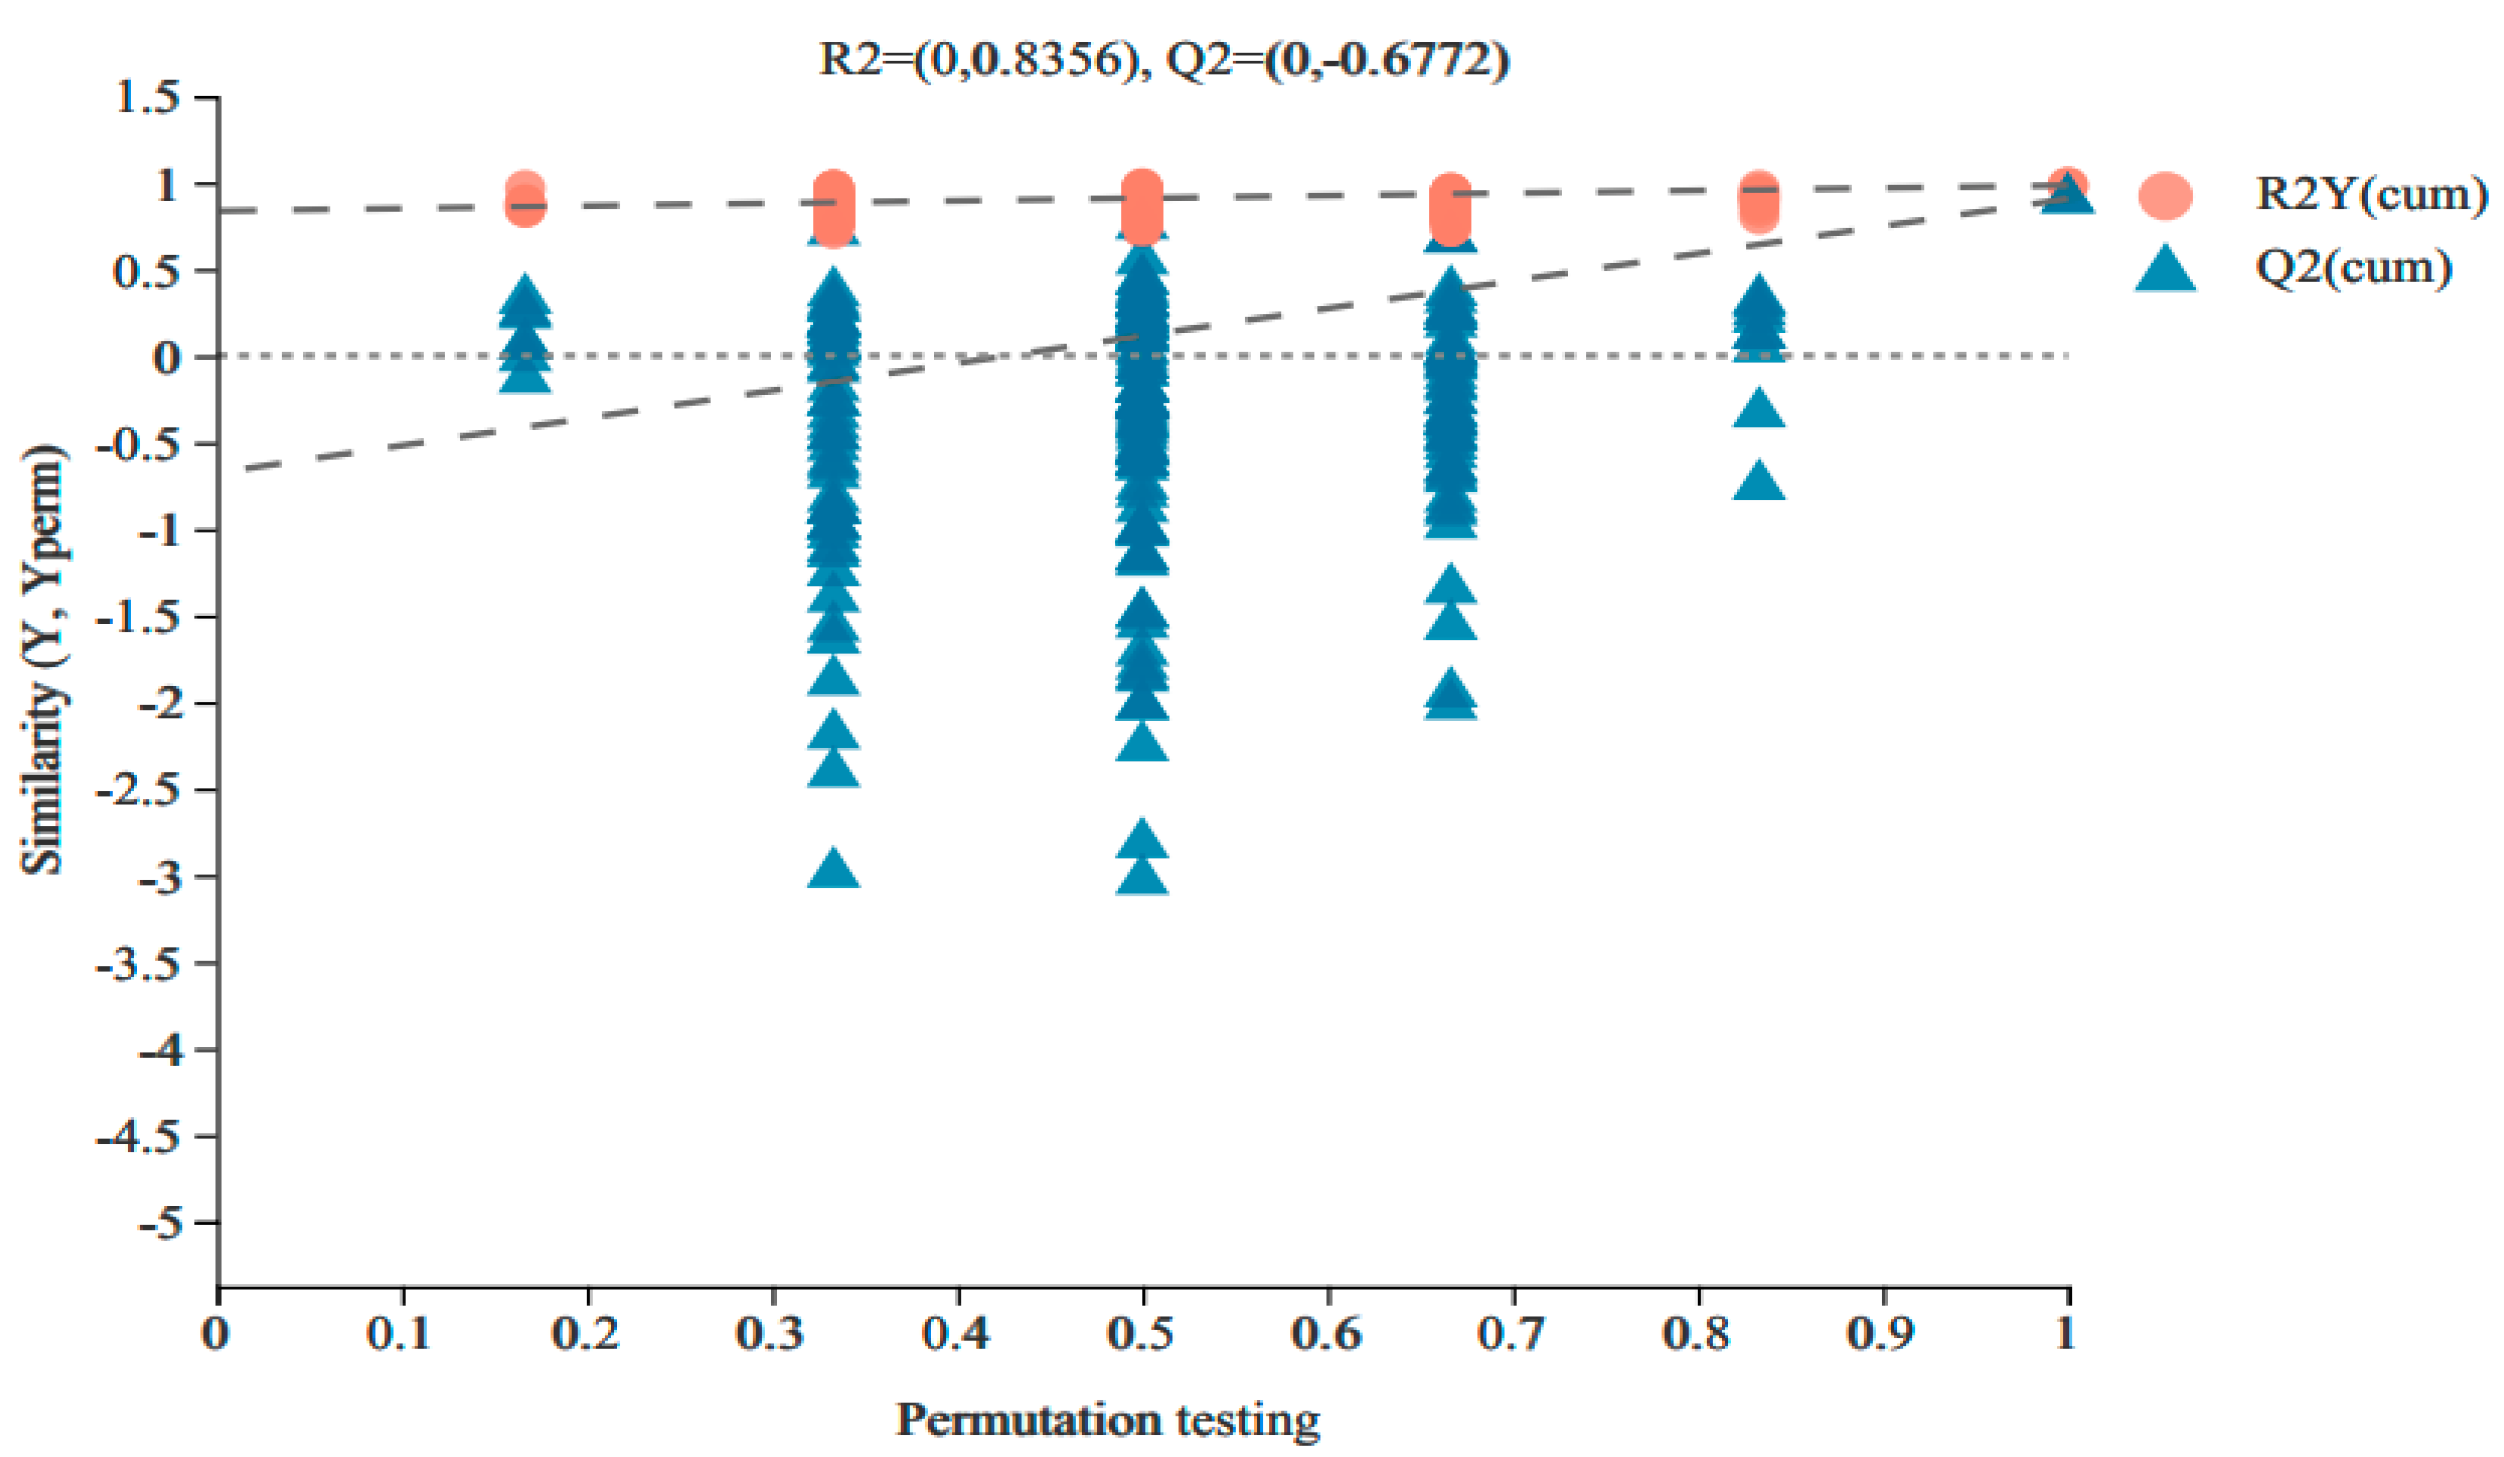
3.2.1. Non-Targeted Metabolomic OPLS-DA Analysis of Vigna angularis under FSA Stress

An OPLS-DA analysis can eliminate variables irrelevant to the grouping variables to better distinguish the sample differences between the Vigna angularis GS and Z-2-GS-2 groups and improve the model’s efficiency. Figure 3 shows the results of the OPLS-DA permutation test for the Vigna angularis GS and Z-2-GS-2 groups; R2X = 0.787, R2Y = 0.983, and Q2 = 0.906. The model shows good stability and reliability [16], indicating that the model fully reflects the real situation of sample metabolites, and a Q2 > 0.5 indicates that the model has a better predictive ability. In addition, the Q2 value is similar to the R2Y value, indicating that the sample size is sufficient and the error is small [17]. After 200 permutation tests, Q2 = −0.6772, showing that the predictive ability of the model Q2 regression line intersects the y-axis, which further proves that the model does not overfit and the metabolites can be screened according to the VIP value.

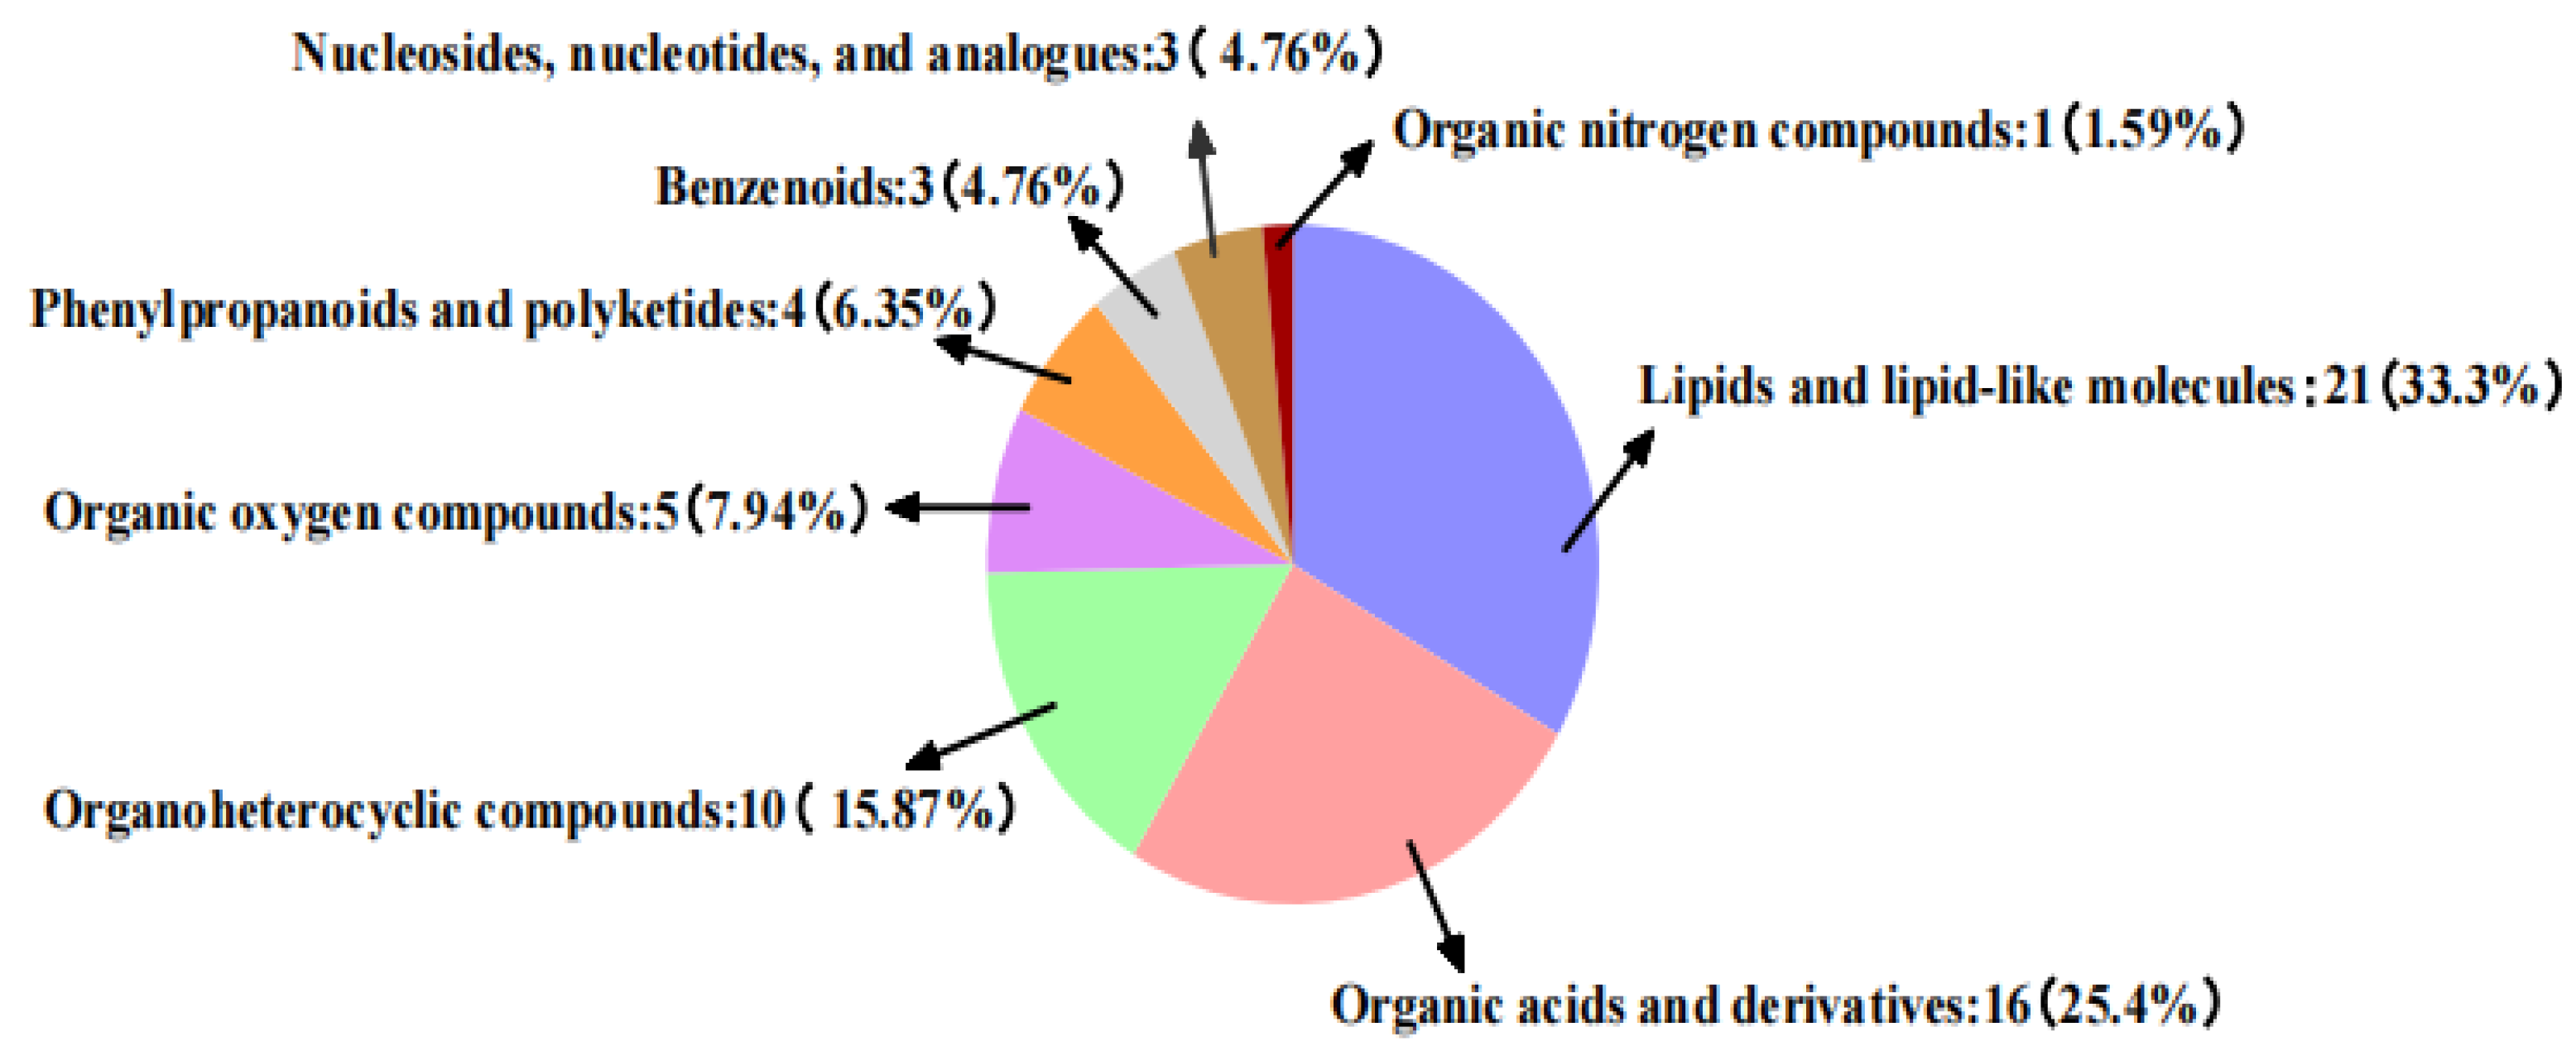
3.2.2. Difference Statistics and Volcano Plots of Non-Targeted Metabolites in Vigna angularis under FSA Stress

Figure 4 shows a volcano map of different metabolites between the Z-2-GS-2 and the GS groups. The points on the left, right, and upper sides of the graph represent the more significant differences. The metabolites of the Vigna angularis GS and Z-2-GS-2 groups were screened according to p < 0.05 in the Student’s t-test, VIP > 1 in the OPLS-DA test, and FC > 1. A total of 63 differential metabolites were screened out in Table 2. An HMDB classification and statistics of the differential metabolites were carried out. As is shown in Figure 5, a total of 26 metabolites were upregulated. These mainly included the seven isoprene lipids (cyrebaudioside A, isobornyl 2-methylbutyrate, Steviolin B, (+)-abscisic acid, soybean saponin V, Momordica charantia, and nitrosoglycol), carboxylic acid and its derivatives (glutamic acid-valine, N(G)-monomethyl) yl-L-arginine, N-acetylornithine, γ-glutamylproline, L-glutamine, and L-asparagine), three kinds of organic oxygen compounds (kinetin-7-N-Glucoside, kynurenine, and fructan) and two fatty acyl groups (rhamnitol and phlegm). Thirty-seven metabolites were downregulated. These mainly included ten kinds of carboxylic acids and their derivatives (captopril-cysteine Acid disulfide, indoleacryloylglycine, 5-hydroxyindoleacetylglycine, arginylserine, γ-glutamyl-S-(1-propenyl)cysteine sulfoxide, p-coumaroyl-3-hydroxytyrosine, indoflavin, valyl-hydroxyproline, glutathione glyceryl, and ascorbic acid), four kinds of glycerophospholipids (1-lysine-2-arachidonoyl phosphatide), 2-lysolecithin, 1-(4Z, 7Z, 10Z, 13Z, 16Z, 19Z-docosahexaenoyl)-glycero-3-phosphate, and 1-linoleoyl glycerophosphocholine), isopentyl diene lipids 4 ((7b,10a)-3-hydroxy-1,3,5-cyano-9-one, dehydroabietic acid, erythropoietin C2, and (E)-crocin) and two kinds of oxygen compounds (tetramethyl 1,1,2,3-propanetetracarboxylate and 4-hydroxy-5-(phenyl)-pentanoic acid-O-glucuronide). The downregulated metabolites accounted for most of the differential metabolites, which may be because FSA stress could regulate the synthesis and accumulation of compounds in Vigna angularis.

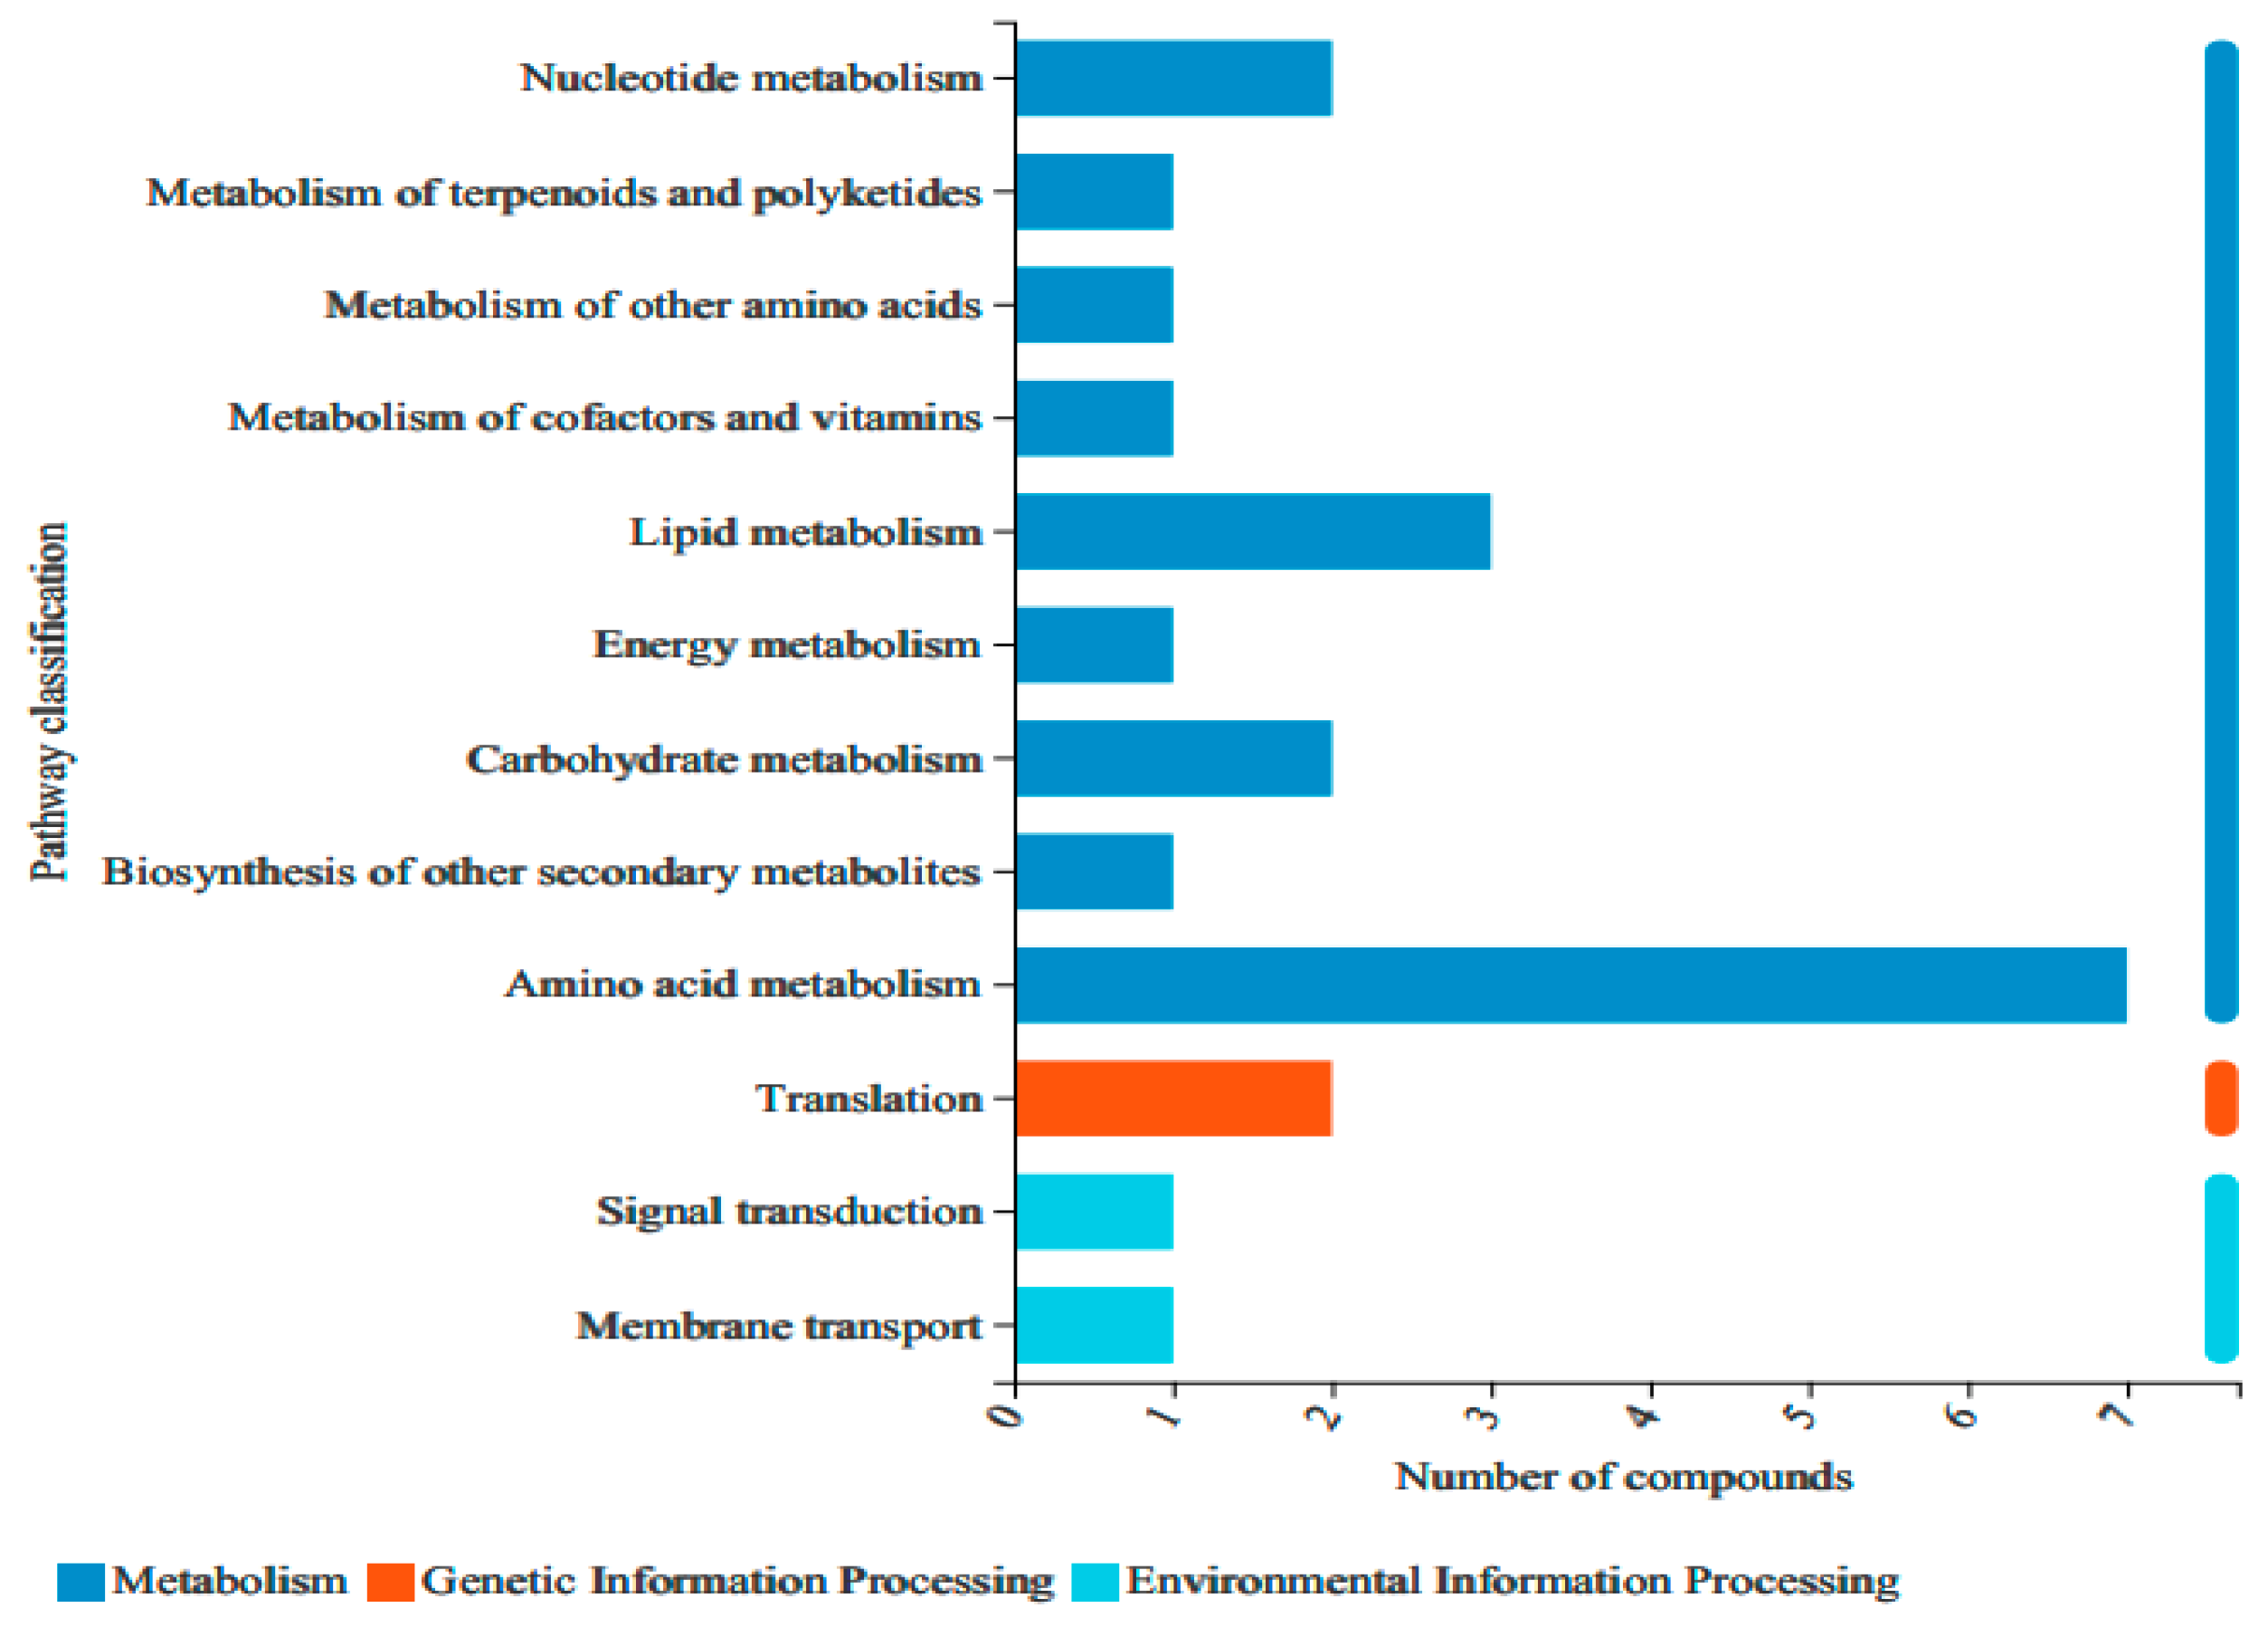
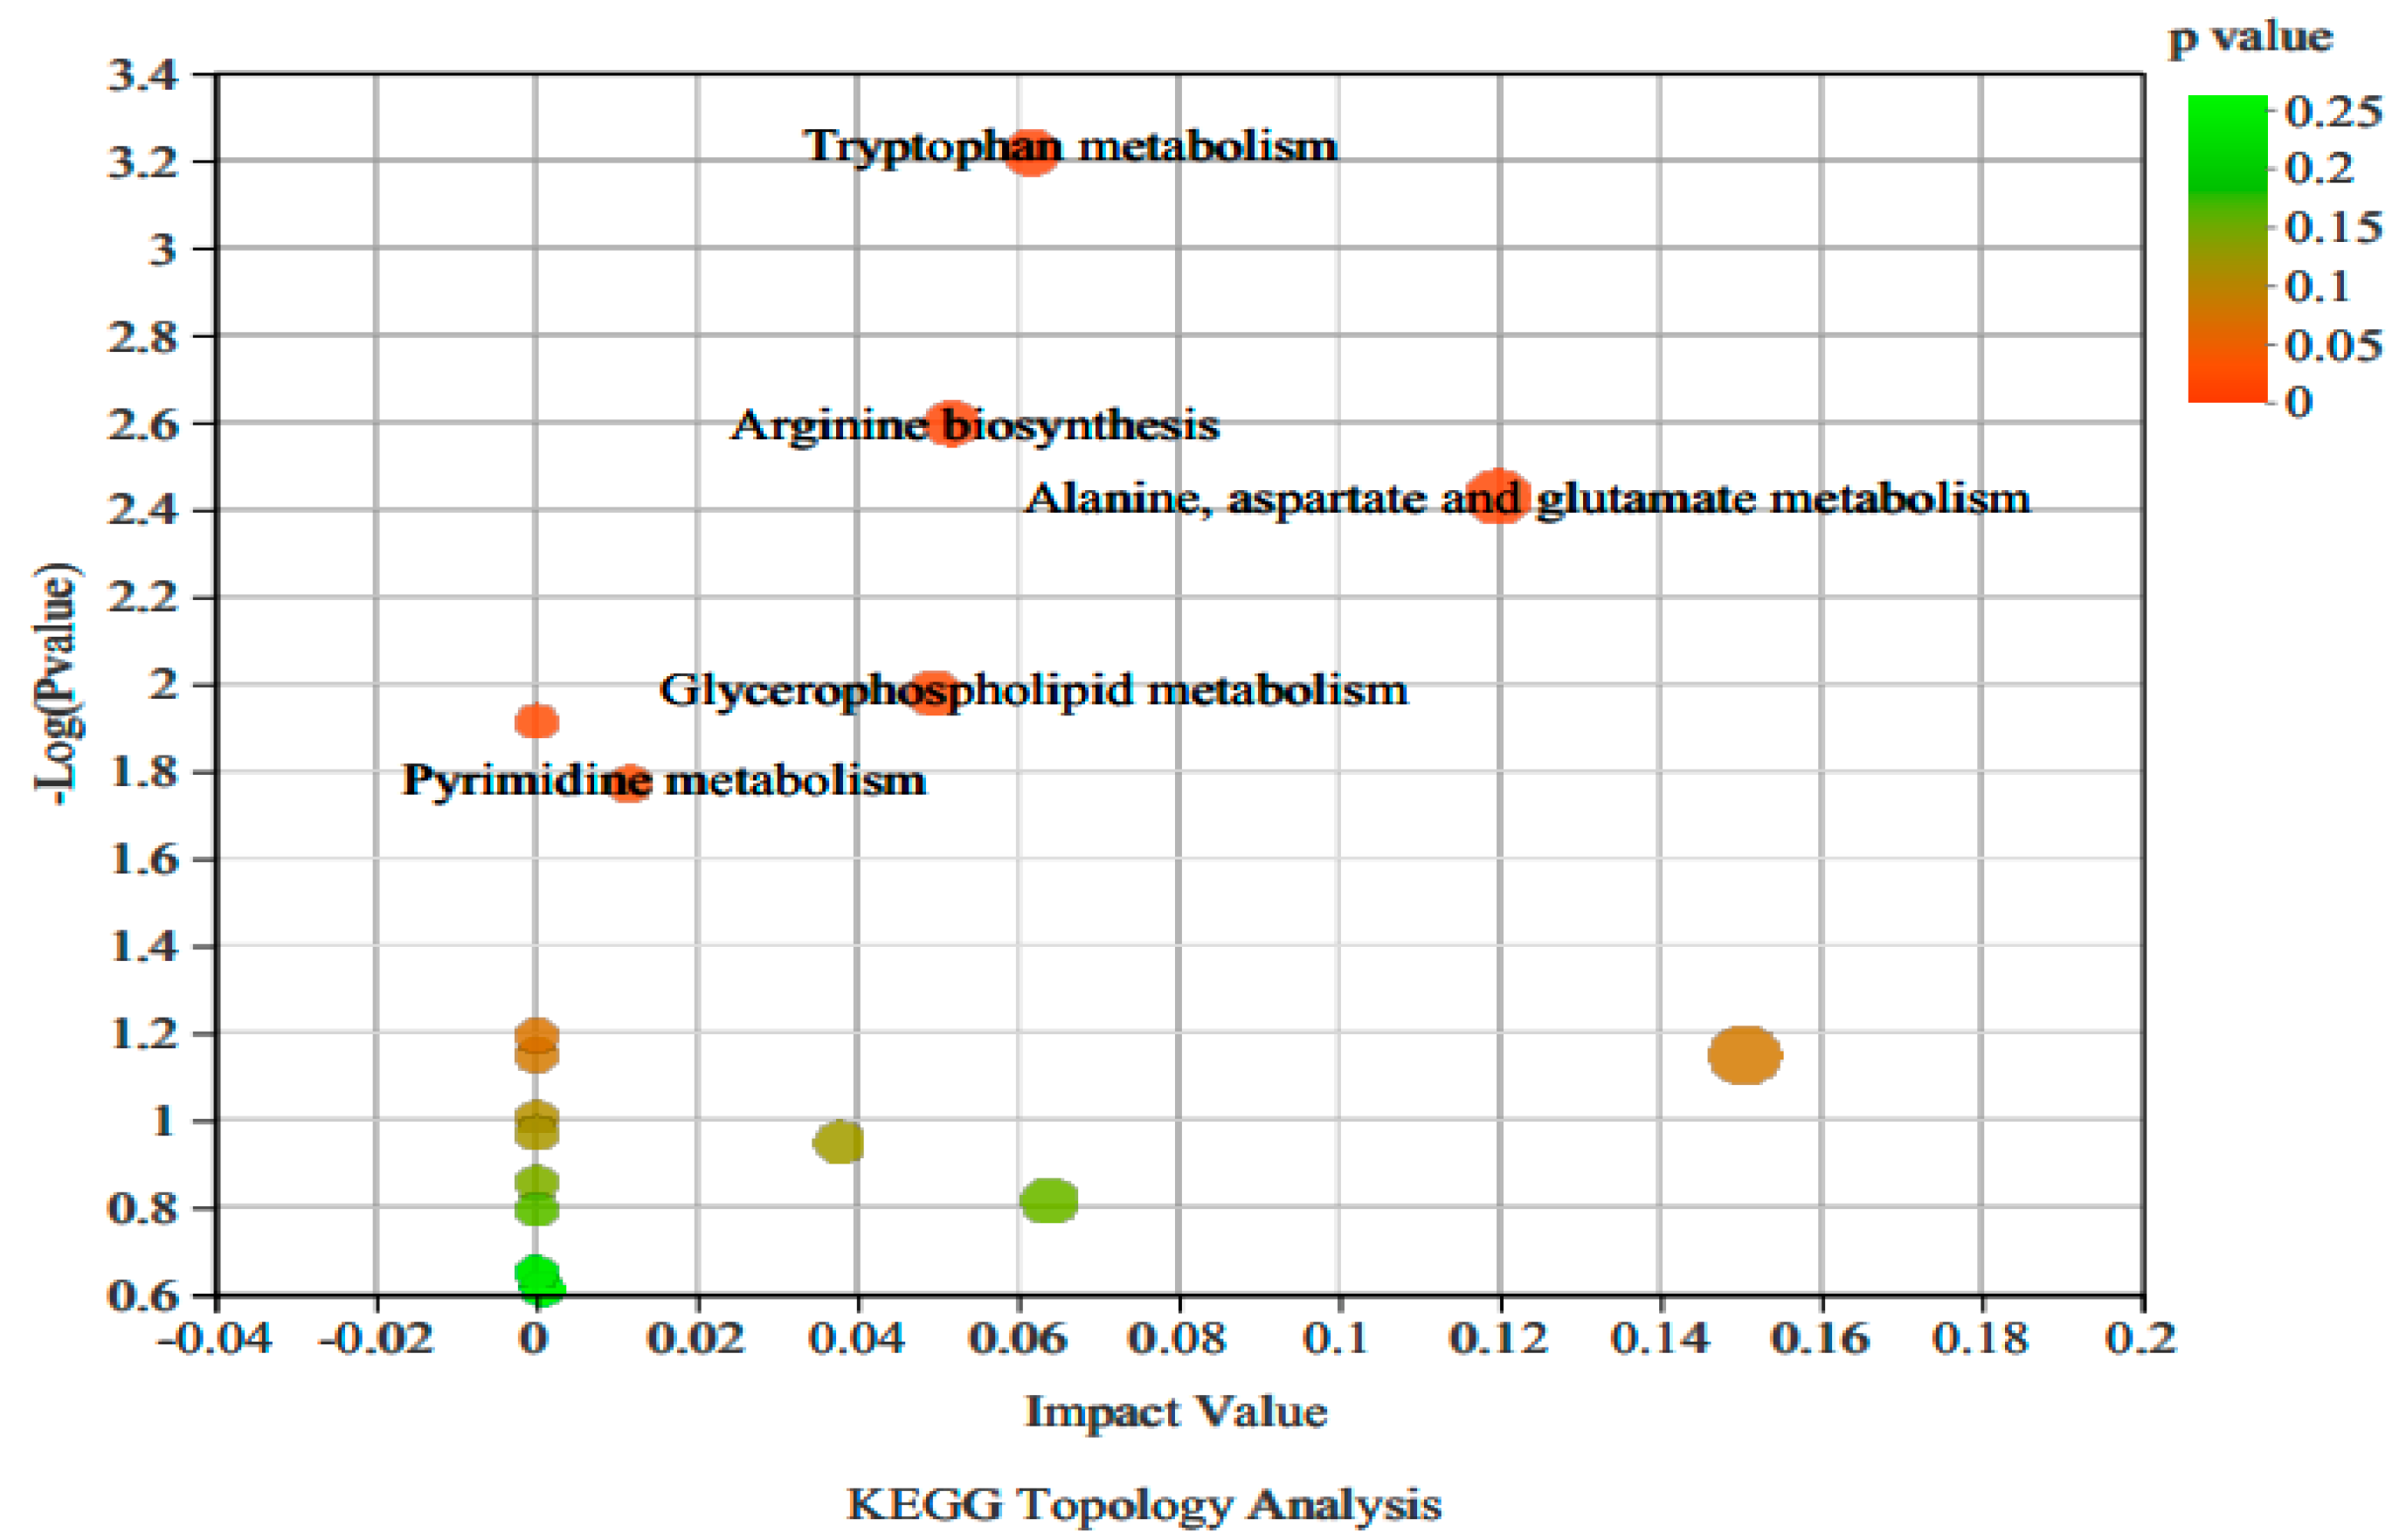
3.2.3. Analysis of Non-Targeted Metabolic Pathways in Vigna angularis under FSA Stress

The metabolites were mapped to the KEGG functional pathway database, and the KEGG functional pathway statistics of the Vigna angularis GS and Z-2-GS-2 groups are shown in Figure 6. The numbers in the figure represent the differential metabolisms detected in this pathway. Among the differential metabolites, 23 differential metabolites were involved in 12 functional pathways, which were divided into three categories, namely metabolic pathways (nine, accounting for 75.0%), genetic information processing (one, accounting for 8.3%), and environmental information processing (two, accounting for 16.7%). Metabolic pathways include amino acid metabolism, carbohydrate metabolism, and energy metabolism, among others. Genetic information processing is translation, whereas environmental information processing includes membrane transport and signal transduction. Among them, the number of differential metabolites detected in amino acid metabolism was the largest with seven types, among which the relative contents of L-glutamine, L-asparagine, kynurenine, and N-acetylornithine showed an upward trend and the relative contents of 5-hydroxyindole acetylglycine, 5-methoxyindole acetate, and indole showed a downward trend, indicating that FSA spraying in the Vigna angularis field had a greater impact on the amino acid metabolism in Vigna angularis.
A KEGG pathway enrichment topology analysis was performed on 63 differential metabolites that were significantly different in the Vigna angularis GS and Z-2-GS-2 groups. As is shown in Figure 7, the Z-2-GS-2 group was similar to the GS group; a total of 17 metabolic pathways were enriched, and the significance analysis of the enriched 17 metabolic pathways was carried out according to p < 0.05, Impact ≥ 0.001. Five metabolic pathways with significant differences were screened out. From the perspective of bubble size, the bubbles metabolized by alanine, aspartic acid, and glutamic acid were the largest, followed by tryptophan metabolism, arginine biosynthesis, and glycerophospholipid metabolism. the smallest was pyrimidine metabolism, indicating that the effects of spraying FSA on tryptophan metabolism, arginine biosynthesis, and glycerophospholipid metabolism in Vigna angularis were the same. As is shown in Table 3, alanine, aspartate, and glutamate metabolism, tryptophan metabolism, arginine biosynthesis, glycerophospholipid metabolism, and pyrimidine metabolism—five metabolic pathways with significant differences—mapped a total of nine differential metabolites, which had the most significant effect on alanine, aspartate, and glutamate metabolism, followed by tryptophan metabolism, arginine biosynthesis, glycerophospholipid metabolism, and pyrimidine metabolism. Most of the differential metabolic pathways belonged to amino acid metabolism, indicating that spraying FSA in the Vigna angularis field had a significant effect on the amino acid metabolism pathway of Vigna angularis, which was consistent with the results of the functional pathway analysis.

3.3. Metabolomic Analysis of Targeted Amino Acids in Vigna angularis under FSA Stress

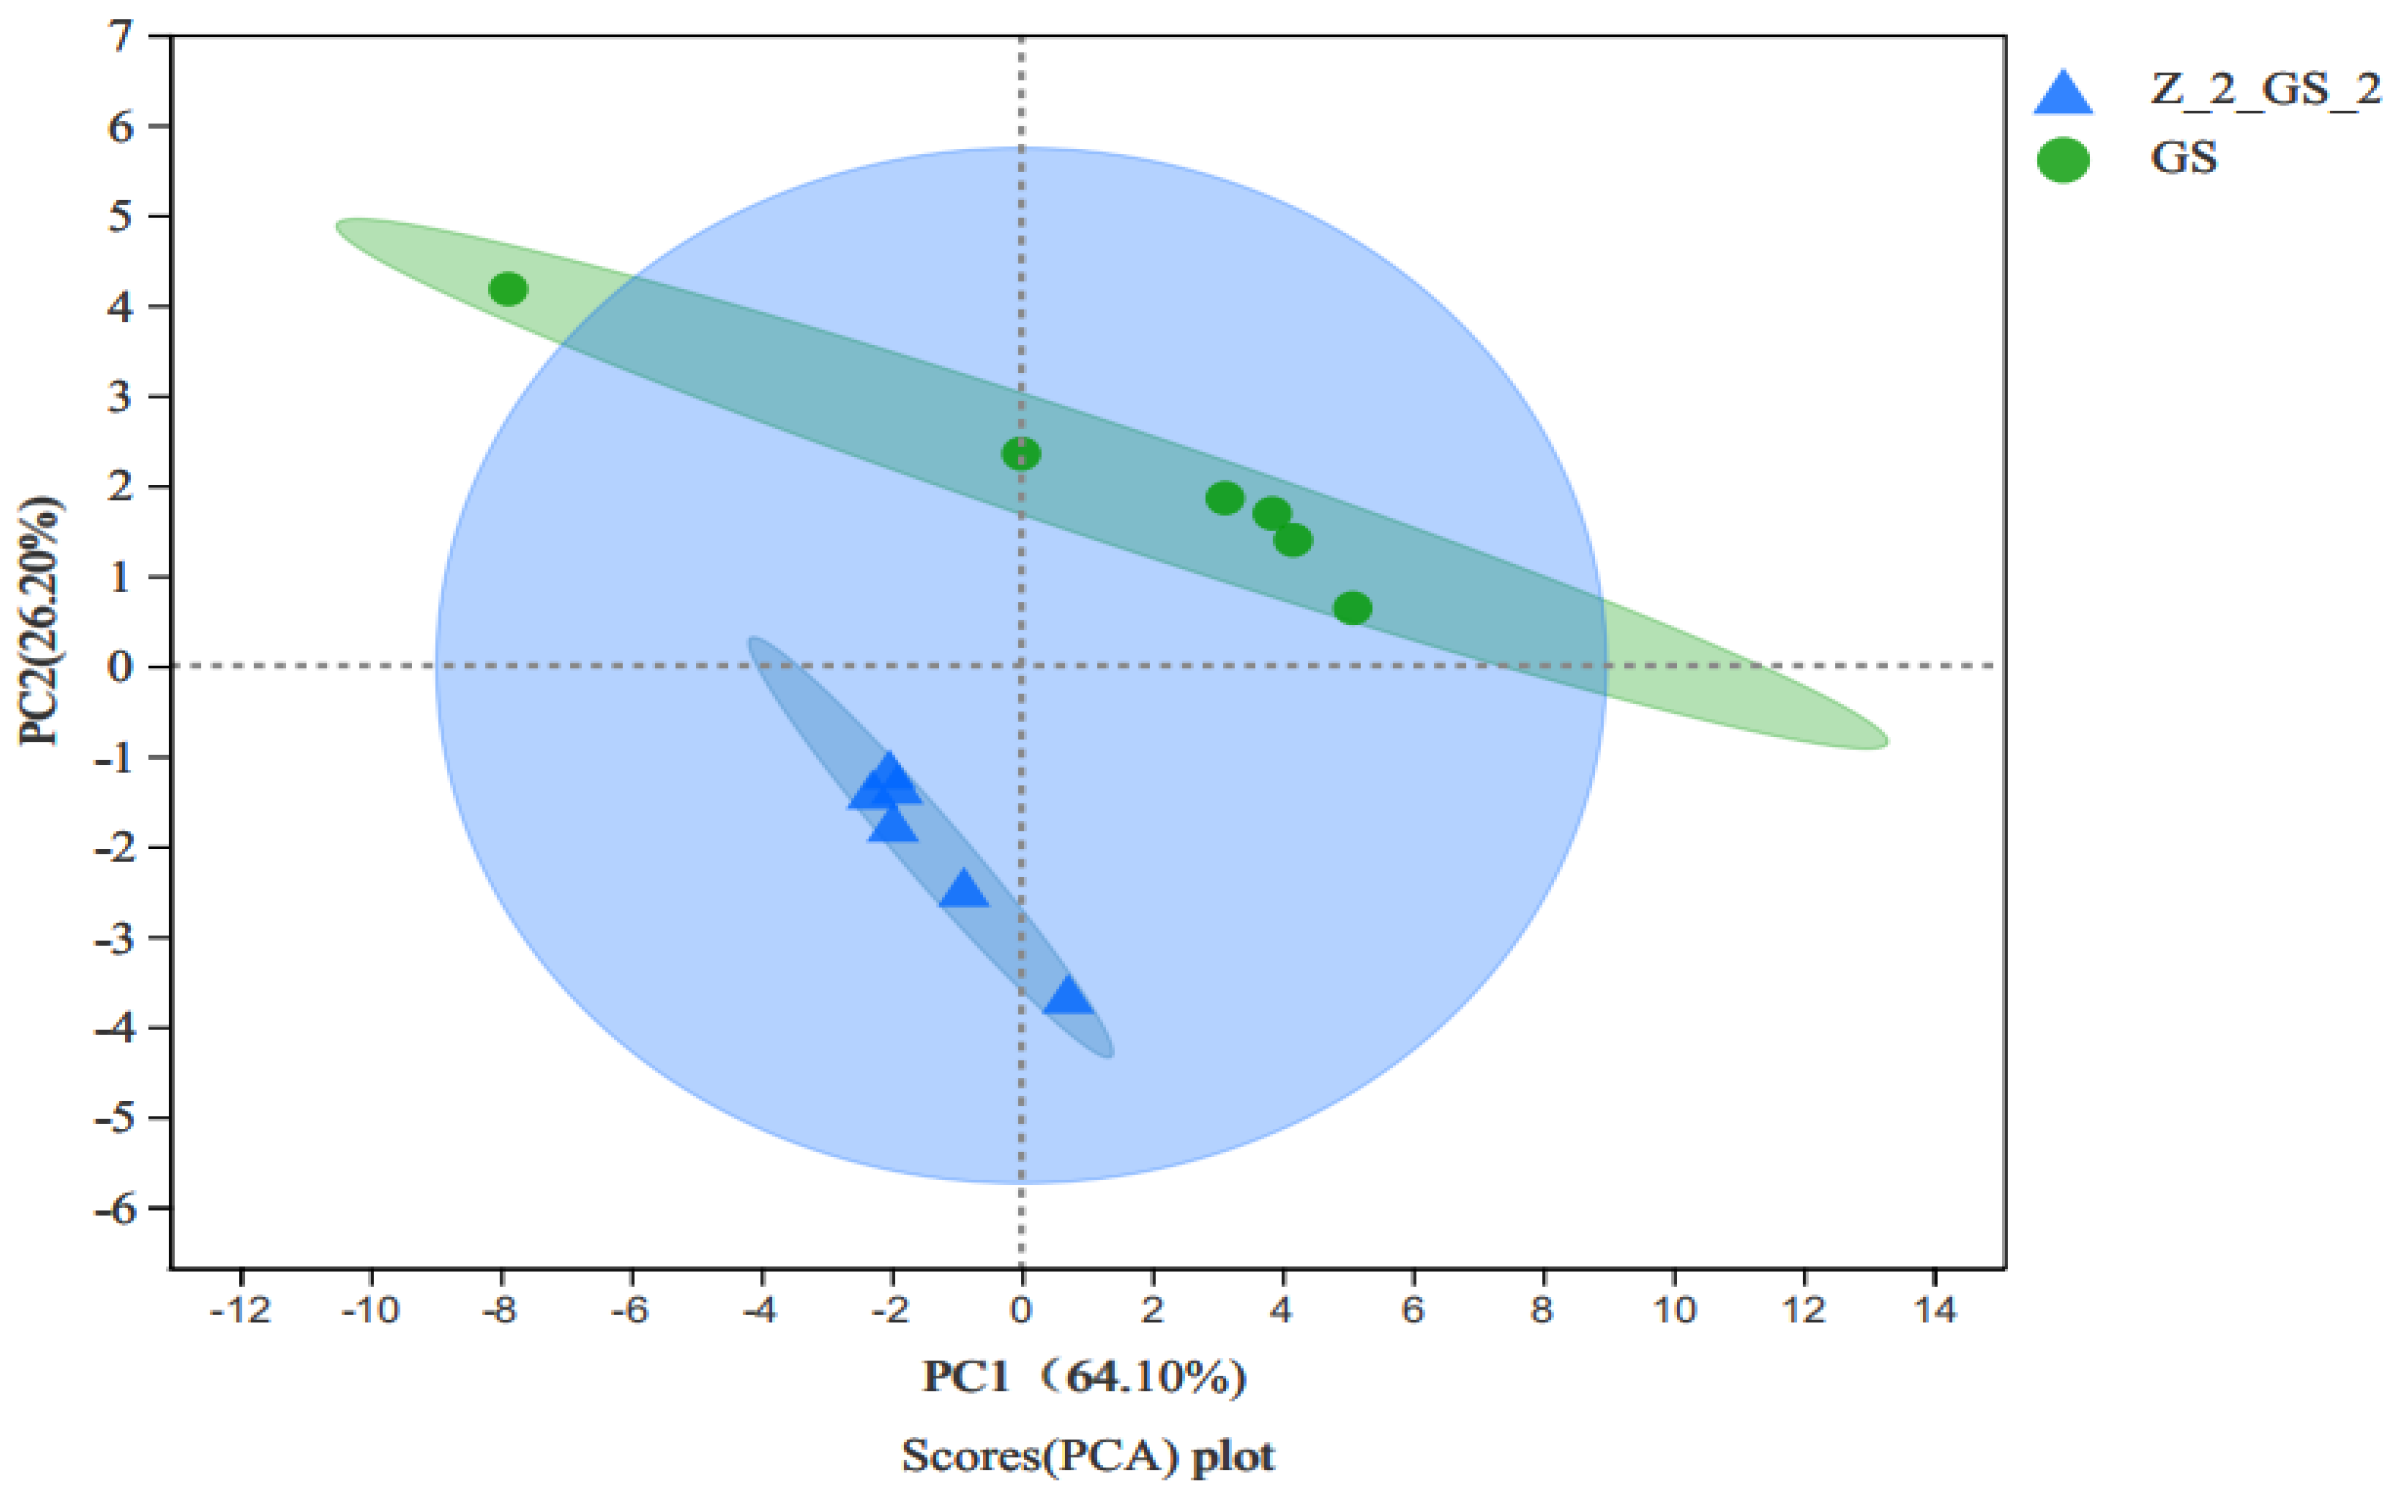
3.3.1. PCA Analysis of Targeted Amino Acids in Vigna angularis under FSA Stress

After the samples of the GS and Z-2-GS-2 Vigna angularis were analyzed by dimensionality reduction, the cumulative difference explanatory parameter of the model is R2X(cum) = 0.903. This is close to 1, indicating that the model is stable and reliable. It can be seen from Figure 8 that the contribution rate of the principal component PC1 is 64.10%. Except for a few samples in the group, the other samples are evenly distributed within the 95% confidence circle, indicating that the sample reproducibility is good and the sample distance between groups is relatively far, indicating that the differences between groups are large and there is no overlap. The two groups of samples can be distinguished in a dimensionality reduction analysis.

3.3.2. Univariate Statistical Analysis of Amino Acid Metabolites in Vigna angularis under FSA Stress

The univariate statistical analysis method is a commonly used statistical analysis method for the analysis of differences between groups. When compared with the GS group, a total of 21 differential amino acid metabolites was targeted and analyzed in the Z-2-GS-2 group. As can be seen from Table 4, they were: Ala, Arg, Asn, Asp, Gin, Glu, Gly, His, IIe, L-Cys, Leu, L-Hyd, L-Trp, Lys, Met, Phe, Pro, Ser, Thr, Tyr and Val. When compared to Vigna angularis without FSA stress, the contents of six amino acids were upregulated. These were L-aspartic acid, L-glutamic acid, L-cysteine, L-tryptophan, L-Phenylalanine, and L-(−)-tyrosine; the other 15 amino acids showed a downward trend.
Amino acids are important nutrients for the growth of Vigna angularis. As well as being the constituents of proteins, the amino acids also the precursors of important secondary metabolites [18]. Cells provide energy [19]. The twenty-one types of amino acids included 11 free amino acids: Ala, Asp, Glu, L-Cys, Leu, Lys, Met, Phe, Ser, Thr, and Tyr. There were 19 hydrolyzed amino acids: Ala, Arg, Asp, Gln, Glu, Gly, His, IIe, L-Cys, Leu, L-Try, Lys, Met, Phe, Pro, Ser, Thr, Tyr, and Val. There were also 9 kinds of sweet amino acids: Ala, Asp, Glu, L-Hyd, Lys, Met, Pro, Ser, and Thr. Additionally, there were 6 kinds of bitter amino acids: His, IIe, Leu, L-Try, Phe, and Tyr [20]. Eight essential amino acids for the human body were identified: IIe, Leu, L-Try, Lys, Met, Phe, Thr, and Val. Finally, 11 medicinal amino acids were identified: Arg, Asp, Asn, Gln, Glu, Gly, Leu, Lys, Met, Phe, and Tyr [21,22].

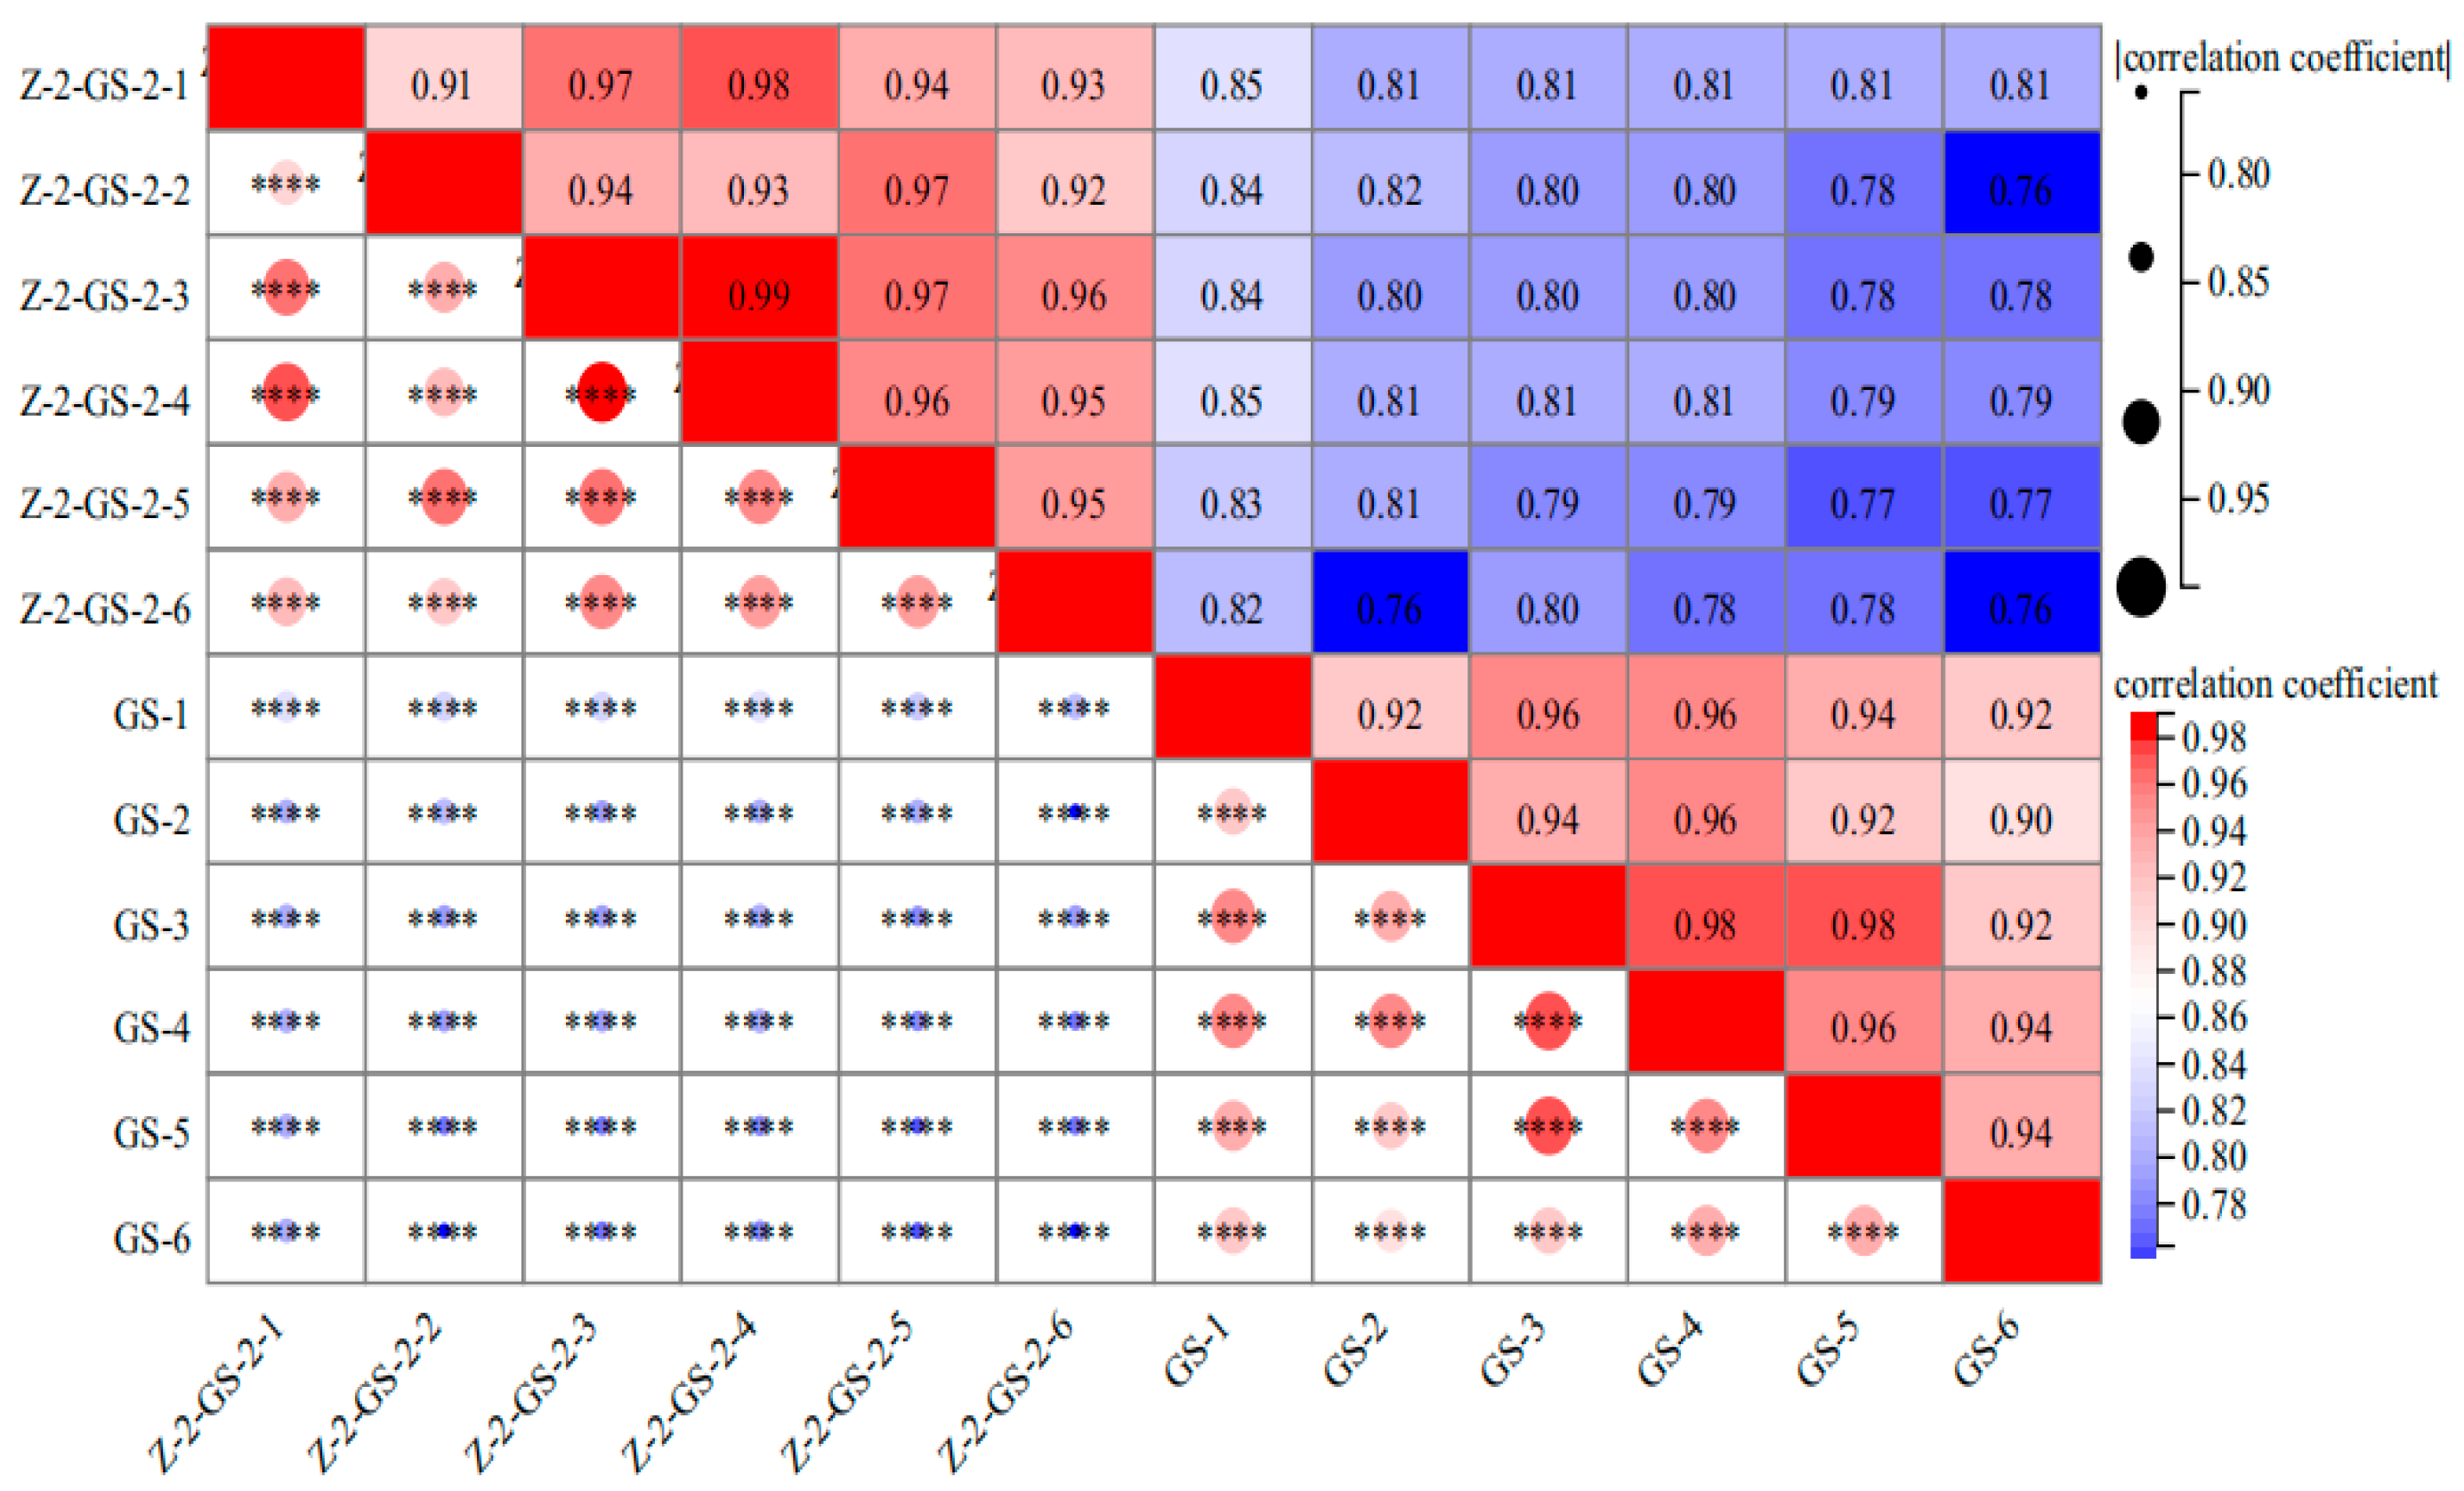
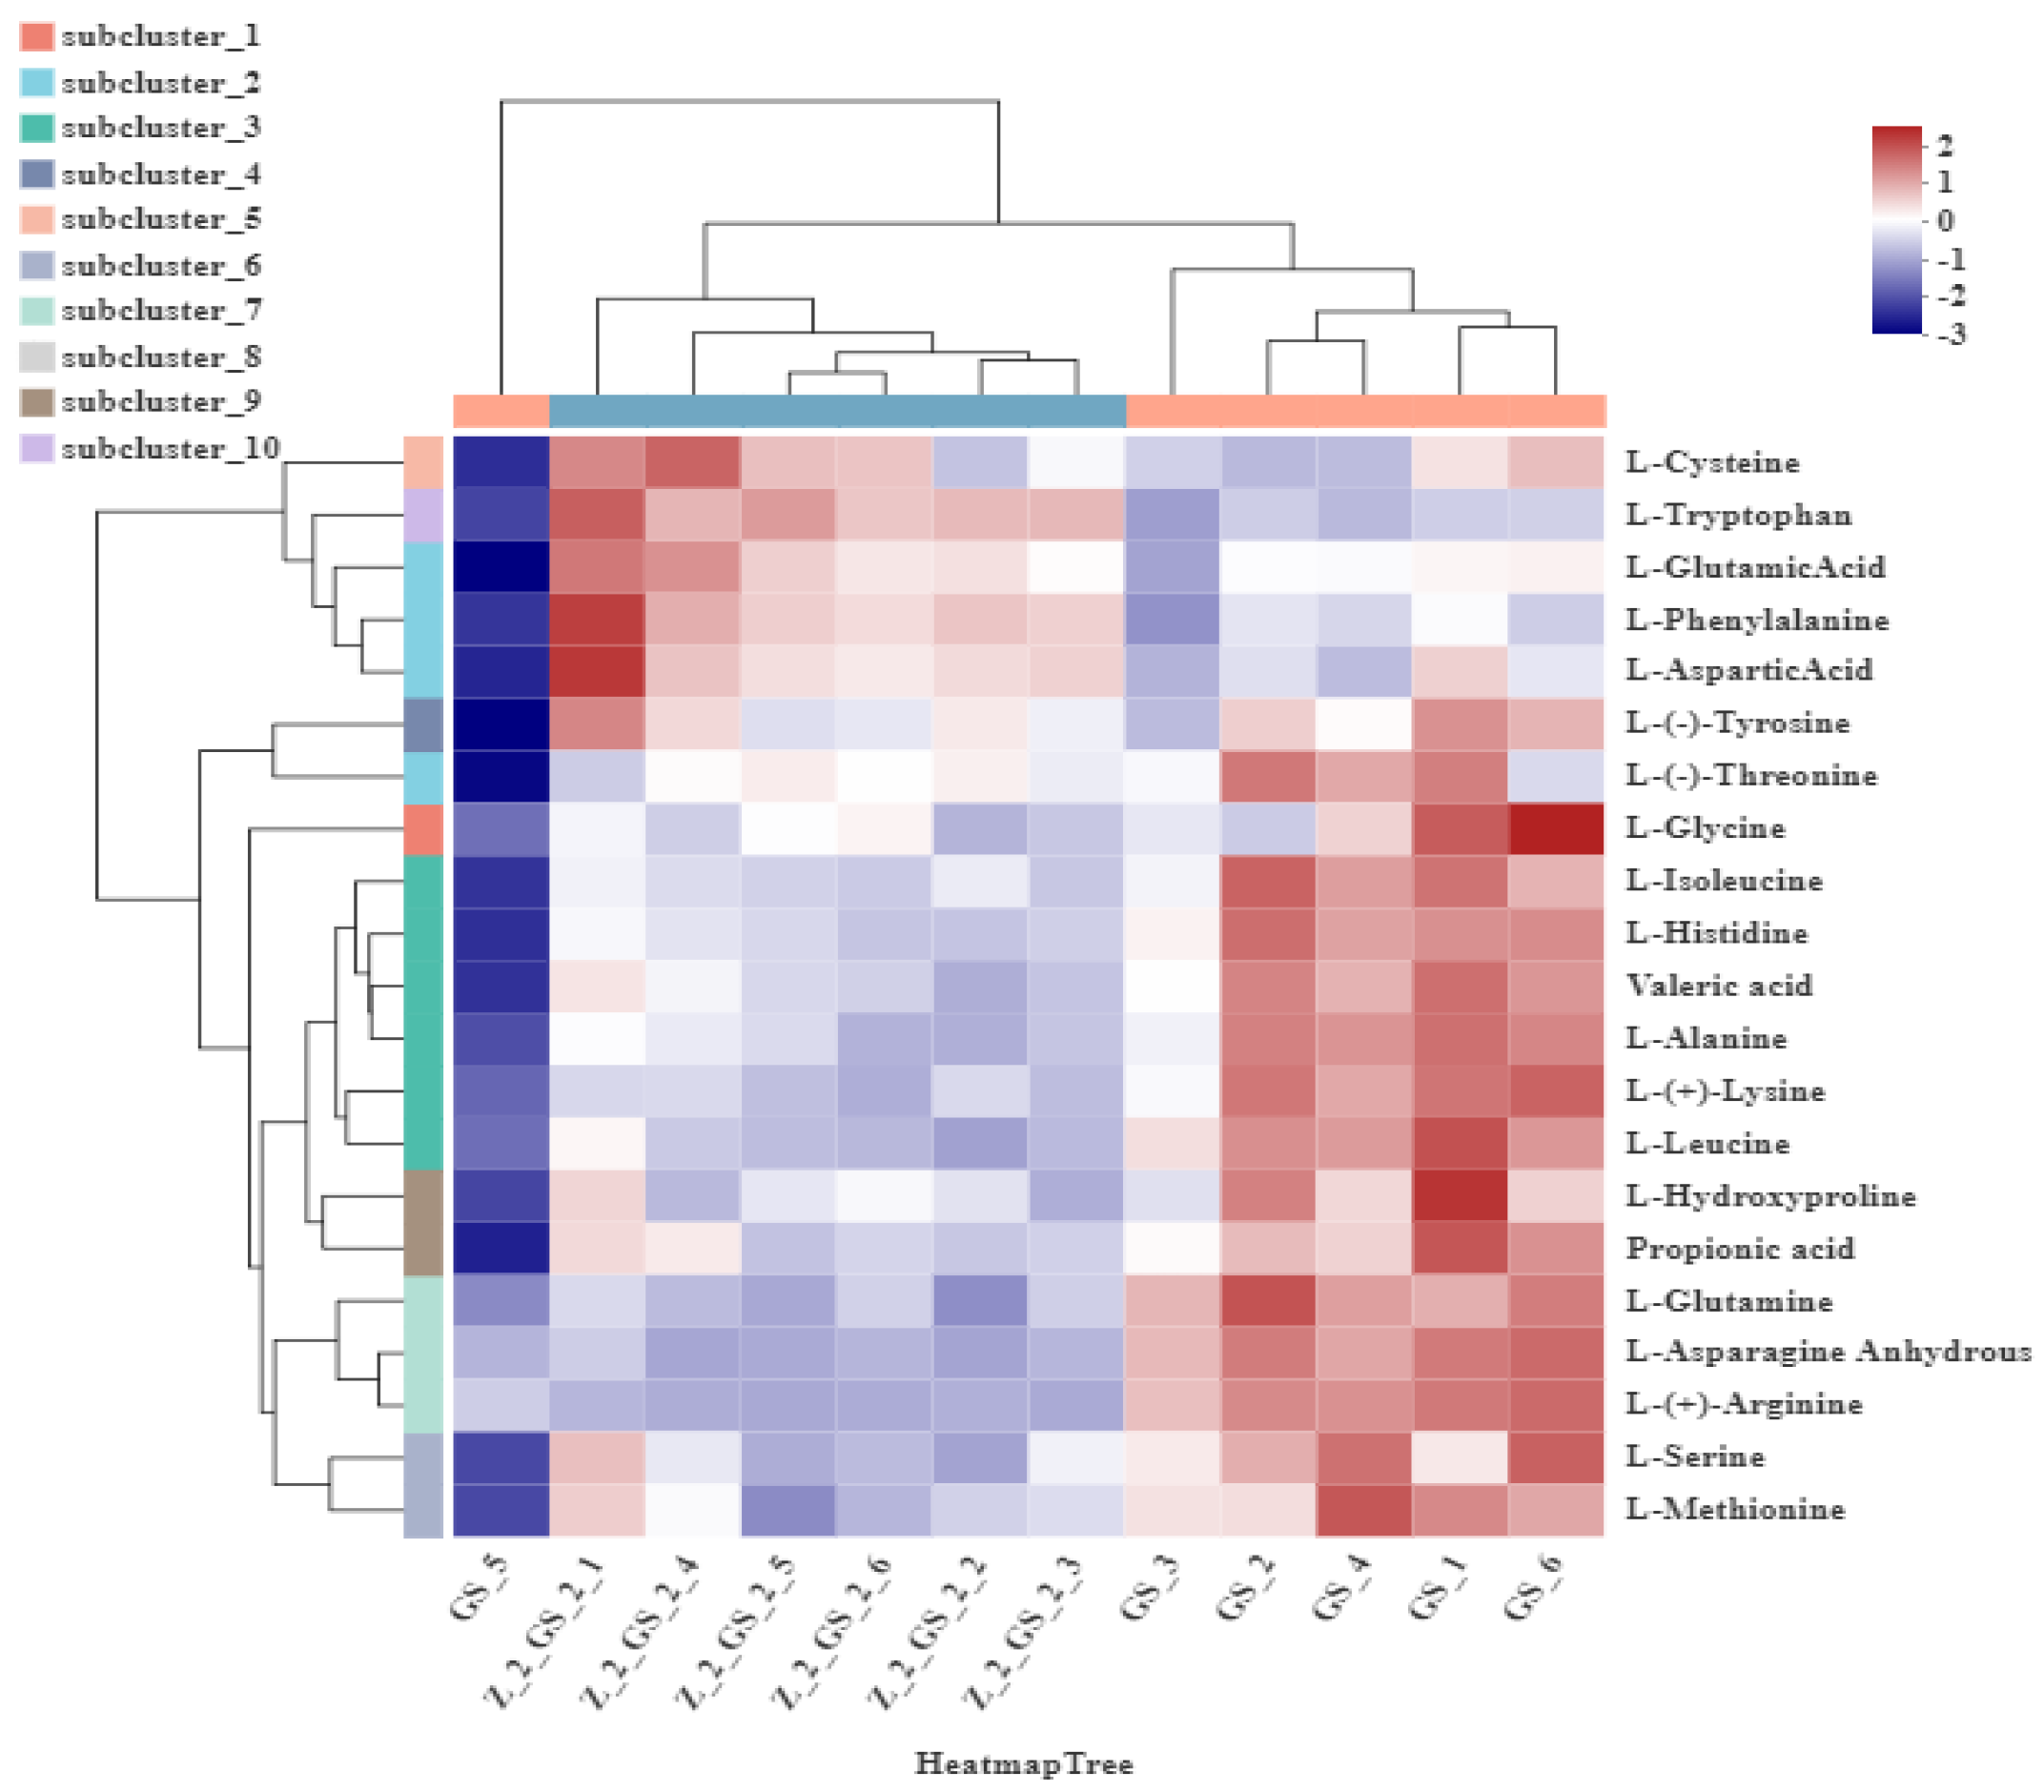
3.3.3. Hierarchical Clustering and Correlation Analysis of Amino Acid Metabolites in Vigna angularis under FSA Stress

A visual correlation analysis was performed on 21 amino acids to further understand the coregulation relationship between amino acids, as shown in Figure 9. The FSA-treated Vigna angularis (Z-2-GS-2) showed a strong correlation with the non-FSA treated a Vigna angularis (GS), and the correlation was very significant (p < 0.01).
Figure 10 shows the hierarchical clustering heat map of targeted amino acid metabolites in the GS and the Z-2-GS-2 groups. The color in the figure indicates the level of metabolite expression: red is the high-expression area and blue is the low-expression area. The distinction between red and blue is obvious, indicating that the clustering effect is significant. The first five amino acids in the Z-2-GS-2 group on the heat map were significantly higher than those in the GS group; these five amino acids were Cys, Try, Glu, Phe, and Asp. It can be seen from the heat map that the expression of 16 amino acids in the Vigna angularis Z-2-GS-2 group under FSA stress was lower than in the Vigna angularis GS group without FSA stress. The 16 amino acids were Tyr, Thr, Gly, IIe, His, Val, Ala, Lys, Leu, Hyd, Pro, Gln, Asn, Arg, Ser, and Met, indicating that FSA stress reduced the activity of amino acids in Vigna angularis. Among the amino acids, there are seven kinds of sweet amino acids, namely Ala, L-Hyd, Lys, Met, Pro, Ser, and Thr, and four kinds of bitter amino acids, namely His, IIe, Leu, and Tyr. Additionally, eight kinds of medicinal amino acids, namely Arg, Asn, Gln, Gly, Leu, Lys, Met, and Tyr, were identified. Sweet amino acids and bitter amino acids belong to flavor amino acids, indicating that FSA stress will affect the nutritional value, medicinal value, and flavor of Vigna angularis.

4. Discussion

Exploring the impact of herbicides on the nutritional value and amino acids of Vigna angularis is conducive to screening herbicides with a high weed-control efficiency in the field which have little impact on crops and can even improve crop yield and promote the nutritional and economic value of crops. After being affected by FSA, the photosynthesis of the Vigna angularis is blocked, which directly affects the carbon metabolism and nitrogen metabolism of the Vigna angularis plant. This is not conducive to the normal division and growth of the Vigna angularis plant cells., as they cannot synthesize sufficient organic substances to provide energy for their growth and development. This is not conducive to the formation of appearance quality of Vigna angularis and the synthesis and accumulation of fat. As an important abiotic factor limiting plant growth and development, water plays an important role in various metabolic processes of Vigna angularis. FSA stress reduces the water content of Vigna angularis and affects the accumulation of organic matter in Vigna angularis, similar to the research results of Luo Haijing [23].
Various metabolic pathways are connected to others. They cooperate and transport each other at the level of materials and energy, providing a guarantee for the growth and development of Vigna angularis and the accumulation of organic matter [24]. A difference in chemical composition directly affects the quality and quality of Vigna angularis. Previous studies have shown that isoprene lipids, fatty acyl groups, and glycerol phospholipids belong to lipids [25]. Through non-targeted metabonomic analysis, it is found that FSA can significantly reduce the content of lipid substances in Vigna angularis. Plant lipids are not only responsible for energy storage and signal transduction but also play an important role in the response of Vigna angularis to FSA-induced stress [26,27]. Fat is the most common lipid. Therefore, the fat content of Vigna angularis in the Z-2-GS-2 group is relatively low. Organic acids are widely found in all parts of crops. Carboxylic acids are the most common organic acids. As the precursor of free radicals, they provide energy for the growth and development of Vigna angularis. The carboxylic acids and their derivatives detected in Vigna angularis are mainly amino acids. Amino acids are the precursor of protein synthesis. Under stress from FSA, Vigna angularis synthesizes a large number of organic acids to resist the abiotic stress of FSA. It further promoted the protein synthesis in the Z-2-GS-2 group of Vigna angularis, which proved that FSA had a significant effect on increasing the protein content in Vigna angularis, thereby affecting the quality of Vigna angularis.
Amino acids in Vigna angularis not only reflect the medicinal value of Vigna angularis but also play an important role in the formation of the flavor of Vigna angularis. Amino acids are essential for the biosynthesis of proteins, enzymes, and nitrogen-containing molecules, which are essential for plant development and defense against external biological and abiotic threats [28]. Cys can be converted into thioproline with antioxidant and anti-cancer activities with active carbonyl in vivo, which can make cells resist the toxicity induced by oxidative stress [29]. Tyr is not only an important component of protein synthesis but also an essential amino acid for the human condition and ketogenic and glycogenic amino acids. As a growth factor, Tyr provides energy for the growth of Vigna angularis. Glu is a medicinal amino acid, which can synthesize Gln with blood amines, and has a certain detoxification effect [30,31,32]. Phe is an important metabolic node, which closely links the primary metabolism and secondary metabolism of plants and is crucial in the defense against abiotic and biological stresses [33]. Asp in plants can be transformed into Arg [34]. Asp is also a precursor for the synthesis of polyamines, which have a good effect on relieving fatigue and improving immunity. After the Vigna angularis was stressed by FSA, the expression of the medicinal amino acids Cys, Glu, Phe, and Asp increased, which proved that FSA stress effectively improved the healthcare effect of Vigna angularis. Flavor amino acids are divided into sweet amino acids and bitter amino acids. Phenylalanine belongs to an aromatic amino acid, which is synthesized from the carbon source provided by glucose in plants and microorganisms [35]. The glucose in plants is produced through photosynthesis. The mechanism of FSA is to block the photosynthesis of plants. As a result, the glucose synthesis rate of Vigna angularis decreases and cannot continuously provide a carbon source for the synthesis of Phe. Therefore, the metabolic decomposition of Phe into Tyr is inhibited, and the bitterness of Vigna angularis decreases. Arg is synthesized by taking Glu as the precursor, catalyzed by various enzymes [36], and stores nutrients for the growth of Vigna angularis [37]. Under FSA stress, the biosynthesis of Arg in Vigna angularis is accelerated to prevent FSA stress. Arg is decomposed into Glu, Pro, and polyamines under the action of the Arg enzyme, and the sweetness of Vigna angularis is increased.

5. Conclusions

In summary, when compared with the GS group, FSA had a significant effect on the content of protein, fat, water, ash, 100-grain weight, and the sand yield of the Vigna angularis Z-2-GS-2 group. LC-MS technology was used to analyze non-targeted metabonomics and the high-throughput targeted amino acid metabonomics of Vigna angularis from the GS group and Z-2-GS-2 group. The research results show that 63 kinds of small molecule metabolites with significant differences were analyzed by non-targeted metabonomics, mainly including lipids and lipid molecules, organic acids, and their derivatives. The KEGG pathway enrichment analysis was conducted for 63 different metabolites, and 17 metabolic pathways were enriched. Under the condition of p < 0.05, Impact ≥ 0.001, a total of five significantly different metabolic pathways were analyzed, including alanine, aspartic acid, glutamic acid metabolism, tryptophan metabolism, arginine biosynthesis, glycerophospholipid metabolism, and pyridine-pyrimidine metabolism. Three of the five metabolic pathways with significant differences were related to amino acid metabolism. High-throughput targeted amino acid analysis is accurate in qualitative and quantitative research of 21 kinds of amino acids: Ala, Arg, Asn, Asp, Gin, Glu, Gly, His, IIe, L-Cys, Leu, L-Hyd, L-Trp, Lys, Met, Phe, Pro, Ser, Thr, Tyr, and Val, including medicinal amino acids, sweet amino acids and bitter amino acids. It can be noted that the use of FSA is not conducive to the formation of the appearance of Vigna angularis and will lead to the increase in protein content, ash content, and sand yield of Vigna angularis and the decrease in fat content, water content, and 100-grain weight. It is also proven that use of FSA will have a particular impact on the nutritional value, health care efficacy, and flavor of Vigna angularis.

Author Contributions

H.T. designed the experimental scheme and was financially supported. D.C. directed the experiments and reviewed the manuscript. J.Y. completed the experiments and drafted the manuscript. All authors have read and agreed to the published version of the manuscript.

Funding

This work was supported by the National Key R&D Program (2018YFE0206300), the Grain and Product Safety Risk Assessment and Standard System Construction Project (2018YFE0206300-10), the Heilongjiang Provincial Advantage and Characteristic Discipline Funding Project (Heijiaolian [2018] No. 4), and the soybeans, miscellaneous grains, etc. Variety Promotion and Processing Technology Transformation (ZY16C07).

Informed Consent Statement

Not applicable.

Data Availability Statement

Not applicable.

Conflicts of Interest

The authors declare no conflict of interest.

References

  1. Shen, X.H. Common rust and root rot control methods of red bean in Heilongjiang Province. Heilongjiang Agric. Sci. 2017, 7, 132–133. [Google Scholar]
  2. Liu, J.X.; Liu, H.X.; Wen, R.Y.; Liu, Z.P. Detection and analysis of nutritional components in adzuki bean germplasm resources. J. Shanxi Datong Univ. (Nat. Sci. Ed.) 2017, 33, 54–57+76. [Google Scholar]
  3. Li, J. High value for both food and medicine. Benefits of eating adzuki beans in spring. Chin. Food 2022, 7, 157–158. [Google Scholar]
  4. Zhang, B.; Xue, W.T. Research progress on functional characteristics of adzuki bean. Food Sci. 2012, 33, 264–266. [Google Scholar]
  5. Zhang, H.J.; Jia, D.Y.; Yao, K. Research progress on nutrition and health function of mung bean. Food Ferment. Technol. 2012, 48, 7–10. [Google Scholar]
  6. Ma, R.P.; Ren, S.C. Health function, processing, and utilization of adzuki bean. Grain Sci. Technol. Econ. 2012, 37, 36–37. [Google Scholar]
  7. Hori, Y.; Sato, S.; Hatai, A. Antibacterial activity of plant extracts from adzuki beans (Vigna angularis) in vitro. Phytother. Res. 2010, 20, 5–9. [Google Scholar]
  8. Zhou, S.X.; Wei, C.J.; Hu, H.Y.; Gao, B.J.; Li, Z.J. Effects of fomesafen on microorganism and enzyme activity in soybean rhizosphere soil and its degradation in the rhizosphere. J. Plant Nutr. Fert. 2018, 24, 203–211. [Google Scholar]
  9. Patel, R.; Patidar, J.; Jain, K.K. Effect of different doses of fomesafen + fenoxaprop + chlorimuron-ethyl (ready-mix) against weeds in soybean. Indian J. Weed Sci. 2021, 53, 5–7. [Google Scholar] [CrossRef]
  10. Pritam, G.; Kalipada, P. Efficacy of fomesafen against broadleaved weeds and productivity improvement in soybean. Plant Cell Biotechnol. Mol. Biol. 2020, 21, 53–60. [Google Scholar]
  11. Huang, C.Y.; Wang, Y.; Huang, Y.J.; Park, D.W. The efficacy of eight herbicides in controlling weeds in adzuki bean fields and their safety in adzuki bean fields. Weed Sci. 2014, 32, 101–106. [Google Scholar]
  12. Bao, Q.; Liu, C.Q.; Duan, X.M.; Liu, S.H.; Wang, P.; Song, X.Q. Weeding effect of fomesafen on adzuki bean in different application periods. Mod. Agric. 2008, 6, 44–45. [Google Scholar]
  13. Tang, S.Y.; Zhang, L.; Tang, J.; Xiang, J.; Chu, N.M.; Yang, J.Y. Study on physicochemical properties and starch properties of several adzuki beans. China Agric. Bull. 2018, 34, 143–148. [Google Scholar]
  14. Lin, L.M.; Wang, Q.f.; Yu, H.; Xu, H.; Zhang, Z.W. Analysis of freezing characteristics and metabolites of edible cassava root tubers. Sci. Technol. Food Ind. 2022, 43, 1–12. [Google Scholar]
  15. Wang, Q.Q. Studies on the Fungi of the Genus Bursangium in Black Tea and Their Effects on Tea Quality. Master’s Thesis, Guizhou Normal University, Guiyang, China, 2021. [Google Scholar] [CrossRef]
  16. A, J.Y.; He, J.; Sun, R.B. Ten key points of metabonomics data processing principal component analysis. J. Pharm. 2018, 53, 929–937. [Google Scholar]
  17. Luo, S.; Zhang, Q.L.; Yang, F.; Lu, J.J.; Pu, X.X.; Zhang, J.; Wang, L. Analysis of functional components of antibacterial black koji in Maotai flavor Daqu based on non-targeted metabonomics. Food Ferment. Ind. 2022, 48, 16–23. [Google Scholar]
  18. Kasia, D.; Shelton, B.; Guillaume, P. Update on amino acid transporter functions and possible amino acid sensing mechanisms in plants. Semin. Cell Dev. Biol. 2018, 74, 105–113. [Google Scholar]
  19. Ananieva, E.A.; Wilkinson, A.C. Branched-chain amino acid metabolism in cancer. Curr. Opin. Clin. Nutr. Metab. Care. 2018, 21, 64–70. [Google Scholar] [CrossRef]
  20. Lin, R.R.; Yuan, H.F.; Zhong, X.Q.; Tang, S.C.; Wu, J.J.; Guo, Z.B. Effects of Different Boiling Processes on Nutrients and Flavor Substances of “Fotiaoqiang”. Food Sci. 2022, 1–12. Available online: http://kns.cnki.net/kcms/detail/11.2206.TS.20220613.1545.159.html (accessed on 26 December 2022).
  21. Hou, N.; Zhao, L.L.; Wei, A.Z.; Yang, T.X. Amino acid composition and nutritional value evaluation of different germplasm Zanthoxylum bungeanum. Food Sci. 2017, 38, 113–118. [Google Scholar]
  22. Jiang, Y.G.; Xu, Q.S. Research progress on the role and mechanism of conditionally essential amino acids in wound healing. Amino Acid Biol. Resour. 2002, 3, 59–62. [Google Scholar]
  23. Luo, H.J. Physiological and Ecological Responses of Different Varieties of Adzuki Bean to Water Stress and Rehydration. Master’s Thesis, Shanxi Normal University, Taiyuan, China, 2015. Available online: https://kns.cnki.net/kcms/detail/detail.aspx?FileName=1015606671.nh&DbName=CMFD2015 (accessed on 26 December 2022).
  24. Wang, J.Y. Study on the Metabonomic Response of Rice Seedlings under High Concentrations of CO2 and Lead Stress. Master’s Thesis, Shenyang Normal University, Shenyang, China, 2020. Available online: https://kns.cnki.net/kcms/detail/detail.aspx?FileName=1020741446.nh&DbName=CMFD2020 (accessed on 26 December 2022).
  25. Yan, F.; Wen, Z.S.; Wang, R.; Luo, W.L.; Du, Y.F.; Wang, W.J.; Chen, X.Y. Identification of the lipid biomarkers from plasma in idiopathic pulmonary fibrosis by Lipidomics. BMC Pulm. Med. 2017, 17, 173–174. [Google Scholar] [CrossRef] [PubMed]
  26. Liu, J.Y.; Yang, F.; Mao, S.; Li, S.X.; Lin, H.J.; Yan, X.F.; Lin, J.X. Research progress on physiological functions of plant lipids in response to stress. J. Biol. Eng. 2021, 37, 2658–2667. [Google Scholar]
  27. Li, Y.J.; Ma, P.J.; Long, Z.F.; Shu, J.H.; Chen, Y.; Wang, X.L. Metabonomic analysis of Pulsatilla Chinensis under low phosphorus and drought stress. J. Gra. Sci. 2022, 30, 329–338. [Google Scholar]
  28. Atteya, A.K.; El-Serafy, R.S.; El-Zabalawy, K.M.; Elhakem, A.; Genaidy, E.A. Exogenously Supplemented Proline and Phenylalanine Improve Growth, Productivity, and Oil Composition of Salted Moringa by Up-Regulating Osmoprotectants and Stimulating Antioxidant Machinery. Plants 2022, 11, 23–27. [Google Scholar] [CrossRef] [PubMed]
  29. Ham, Y.-H.; Jason Chan, K.K.; Chan, W. Thioproline Serves as an Efficient Antioxidant, Protecting Human Cells from Oxidative Stress and Improves Cell Viability. Chem. Res. Toxicol. 2020, 33, 37–39. [Google Scholar] [CrossRef]
  30. Liang, X.; He, J.; Zhang, N.; Muhammad, A.; Lu, X.; Shao, Y. Probiotic potentials of the silkworm gut symbiont Enterococcus casseliflavus ECB140, a promising L-tryptophan producer is living inside the host. J. Appl. Microbiol. 2022, 133, 47–51. [Google Scholar] [CrossRef]
  31. Cauli, O.; Rodrigo, R.; Llansola, M.; Montoliu, C.; Monfort, P.; Piedrafita, B.; Felipo, V. Glutamatergic and gabaergic neurotransmission and neuronal circuits in hepatic encephalopathy. Metab. Brain Dis. 2009, 24, 69–80. [Google Scholar] [CrossRef]
  32. Tong, B.C.; Barbul, A. Cellular and physiological effects of arginine. Mini-Rev. Med. Chem. 2004, 4, 823–832. [Google Scholar] [CrossRef]
  33. Pascual, M.B.; El-Azaz, J.; de la Torre, F.N.; Cañas, R.A.; Avila, C.; Cánovas, F.M.l. Biosynthesis and Metabolic Fate of Phenylalanine in Conifers. Front. Recent Dev. Plant Sci. 2016, 7, 1030–1042. [Google Scholar]
  34. Mckee, T.; Mckee, J.R. Biochemistry, 2nd ed.; Mc Graw-Hill Education: Boston, MA, USA, 1998; pp. 370–375. [Google Scholar]
  35. Zhang, X.M.; Guo, C.J.; Li, J.X.; Xu, Q.S. Research progress on the application of genetic engineering in L-tryptophan production. J. Acad. Mil. Med. Sci. 2005, 4, 379–382. [Google Scholar]
  36. Cheng, G.; Xu, J.Z.; Zhang, W.G. Research progress on the biosynthesis mechanism of L-arginine and its metabolic engineering breeding. Bul. Mikrobiyol. 2016, 43, 1379–1387. [Google Scholar]
  37. Liu, J.X.; Wang, J.C.; Liu, X.L. Response of arginine metabolism of oat seedlings to exogenous NO under lanthanum stress. J. Chin. Soc. Rare Earths. 2018, 36, 236–246. [Google Scholar]
Figure 1. Vigna angularis sample diagram. Note: the GS group shows Vigna angularis without FSA spraying; the Z-2-GS-2 group shows Vigna angularis under FSA stress.
Agronomy 13 00452 g001
Figure 2. FSA’s effect on protein, fat, water content, ash Content, hundred-grain weight, and sand yield of Vigna angularis in GS and Z-2-GS-2 Groups. Note: the GS group represents Vigna angularis without the spraying of FSA; the Z-2-GS-2 group represents Vigna angularis under FSA stress. Bars (mean ± SE; n = 3) followed by different alphabets significantly differ (p ≤ 0.05) among the treatments as per SPSS.
Agronomy 13 00452 g002
Figure 3. OPLS-DA permutation test diagram of Z-2-GS-2 and GS groups. Note: The abscissa represents the replacement retention of the replacement test (the proportion consistent with the Y variable order of the original model, and the point with the replacement retention of 1 is the R2 and Q2 values of the original model), the ordinate represents the values of R2 (orange dot) and Q2 (blue triangle) replacement tests, and the two dotted lines represent the regression lines of R2 and Q2, respectively.
Agronomy 13 00452 g003
Figure 4. Metabolite volcano map of the Z-2-GS-2 group vs. The GS group. Note: the GS group represents Vigna angularis without the spraying of FSA; the Z-2-GS-2 group is Vigna angularis under FSA stress. The abscissa is the fold change value of the metabolite expression difference between the two groups that is, log2FC, and the ordinate is the statistical test value of the metabolite expression difference, that is, the −log10 (p-value) value. The higher the value, the more significant the expression difference. Each point in the figure represents a specific metabolite, and the size of the point represents the VIP value. The point on the left represents the metabolite with a downregulated expression difference, and the point on the right represents the metabolite with an upregulated expression difference. The significant the expression difference is between the left and right sides and the upper point.
Agronomy 13 00452 g004
Figure 5. Classification of HMDB compounds with differential metabolites in the Z-2-GS-2 vs. GS groups.
Agronomy 13 00452 g005
Figure 6. Statistical Diagram of KEGG Functional Pathway in Z-2-GS-2 vs. GS groups of Vigna angularis. Note: The ordinate is the second classification of the KEGG metabolic pathway, and the abscissa is the number of metabolites annotated to this pathway.
Agronomy 13 00452 g006
Figure 7. Bubble Chart of Z-2-GS-2 vs. GS group path topology analysis. Note: Each bubble in the figure represents a KEGG pathway; the horizontal axis represents the relative importance of the metabolites in the pathway, the impact value; the vertical axis represents the enrichment significance of metabolites involved in the pathway-log10 (p-value), and the size of the bubble represents the impact value.
Agronomy 13 00452 g007
Figure 8. Targeted amino acid PCA score of GS and Z-2-GS-2 groups. Note: the GS group represents Vigna angularis without the spraying of FSA; the Z-2-GS-2 group represents Vigna angularis under FSA stress.
Agronomy 13 00452 g008
Figure 9. Correlation analysis matrix of GS and Z-2-GS-2 group-targeted amino acid metabolites. Note: the GS group represents Vigna angularis without the spraying of FSA and the Z-2-GS-2 group represents Vigna angularis under FSA stress; **** Indicates the level of significance.
Agronomy 13 00452 g009
Figure 10. Hierarchical clustering heat map of targeted amino acid metabolites in the GS and Z-2-GS-2 groups. Note: the GS group represents Vigna angularis without the spraying of FSA and the Z-2-GS-2 group represents Vigna angularis under FSA stress.
Agronomy 13 00452 g010
Table 1. Standard curve equation of 21 types of amino acids.
Amino AcidCurvilinear EquationR2Stability RSD
L-Alaniney = 3.62534 × 10⁴x + 2745.219040.996.71
L-(+)-Argininey = 3.34990 × 10⁵x + 22,361.209420.992.26
L-Asparagine Anhydrousy = 11,190.20535x + 362.175580.991.41
L-Aspartic Acidy = 14,381.55174x + 2544.176911.000.59
L-Glutaminey = 8.80826 × 10⁴x − 2141.005560.999.28
L-Glutamic Acidy = 6.18543 × 10⁴x − 5738.945820.993.14
Glyciney = 1283.62469x + 387.787251.007.21
L-Histidiney = 5.99474 × 10⁵x + 20,541.527190.994.27
L-Isoleuciney = 4.26940 × 10⁵x + 4177.436840.995.68
L-Cysteiney = 11603.86832x + 114.702510.996.41
L-Leuciney = 5.91002 × 10⁵x + 10,046.236620.992.02
L-Hydroxyproliney = 3.53570 × 10⁵x − 381.018681.004.30
L-Tryptophany = 3.04138 × 10⁵x − 3702.869270.991.94
L-(+)-Lysiney = 1.32331 × 10⁵x + 4482.195540.992.43
L-Methioniney = 1.65349 × 10⁵x − 916.811090.992.81
L-Phenylalaniney = 9.77658 × 10⁵x − 451.912070.991.65
Propionic acidy = 2.65314 × 10⁶x + 4.11763 × 1040.992.50
L-Seriney = 15,677.23525x + 3640.877770.993.12
L-(−)-Threoniney = 6.81196 × 10⁴x + 2645.975600.990.42
L-(−)-Tyrosiney = 1.79224 × 10⁵x + 9042.084871.002.20
Valeric acidy = 6.85992 × 10⁴x + 482.119900.992.41
Note: R2 is the determination coefficient of the calibration curve.
Table 2. Statistical Table of differential metabolites of the Vigna angularis Z-2-GS-2 vs. GS groups.
NumbersMetaboliteVIPFCp_ValueFDRRetention TimeM/ZContent Change
13,4,5-trihydroxy-6-[(3-methylbut-2-enoyl)oxy]oxane-2-carboxylic acid1.560.900.040.181.28318.00
2Cytarabine1.910.900.000.030.76244.00
3Cynaroside A2.901.170.000.002.71462.00+
4(7b,10a)-3-Hydroxy-1,3,5-cadinatrien-9-one1.320.950.010.094.29503.00
5Isobornyl 2-methylbutyrate1.381.050.000.025.41221.00+
619-Oxotestosterone1.210.970.010.084.28285.00
73-Hydroxyadipic acid 3,6-lactone1.821.070.000.031.33162.00+
8P-cresol1.011.020.000.041.8491.00+
92’-O-Methyladenosine1.230.960.010.092.14282.00
104-Hydroxy-5-(phenyl)-valeric acid-O-glucuronide1.860.920.010.094.77388.00
11Sterebin B1.441.040.000.016.05743.00+
121-Lyso-2-arachidonoyl-phosphatidate1.950.910.010.088.37476.00
13Muricatenol2.141.140.000.066.57631.00+
14Squamotacin1.881.100.010.116.55645.00+
156alpha-Hydroxyphaseollin2.221.190.020.135.98321.00+
16Porric acid B1.240.960.020.143.42289.00
17(+)-Abscisic Acid2.161.090.000.002.86265.00+
18Glu-Val1.421.070.040.182.18247.00+
19Molybdopterin precursor Z1.451.080.010.090.50310.00+
20L-NMMA1.691.080.010.090.59189.00+
21Niacinamide1.510.940.020.121.19123.00
223-Methyl-3-butenyl apiosyl-(1->6)-glucoside2.100.850.010.092.39381.00
23Captopril-cysteine disulfide1.590.930.020.123.76319.00
24Salsoline-1-carboxylate2.960.710.030.165.56260.00
25Dehydroabietic acid1.330.960.010.105.94301.00
26Soyasaponin V1.571.040.000.016.04923.00+
27Momordin Ia1.581.040.000.016.19743.00+
28LysoPC(18:1(11Z))1.340.960.020.136.46522.00
291-(4Z,7Z,10Z,13Z,16Z,19Z-docosahexaenoyl)-glycero-3-phosphate2.120.870.000.077.61500.00
301-Linoleoylglycerophosphocholine1.070.980.020.136.22520.00
31Sphinganine1.121.030.020.126.13302.00+
32Arnidenediol1.121.020.000.046.05407.00+
33Eremopetasitenin C22.690.840.000.025.82443.00
34(all-E)-Crocetin1.620.950.000.025.74329.00
35Physalin I1.330.920.020.155.02559.00
36Dihydrogenistein1.630.930.010.074.72273.00
37Indolylacryloylglycine1.860.900.010.094.59227.00
38Luteoloside1.740.920.010.114.30449.00
39(3E)-4-phenylbuta-1,3-dien-2-ol1.280.950.020.144.28129.00
405-Hydroxyindoleacetylglycine1.750.900.030.174.17231.00
41Arginyl-Serine2.190.830.020.144.04561.00
425-Methoxyindoleacetate1.270.950.040.193.87206.00
43Gamma-Glutamyl-S-(1-propenyl)cysteine sulfoxide2.260.860.010.083.22271.00
44Norharman1.251.050.000.043.15169.00+
45P-Coumaroyl 3-hydroxytyrosine2.780.790.000.023.08361.00
46Benzaldehyde1.140.960.030.162.75107.00
47(+/−)-Taxifolin2.030.920.000.042.60305.00
48Kinetin-7-N-glucoside2.051.140.020.122.43360.00+
49Succinoadenosine1.670.940.000.042.31384.00
50Indicaxanthin2.780.790.000.032.14372.00
51Valyl-Hydroxyproline2.300.850.000.061.95231.00
52Gamma-L-Glutamyl-gamma-L-glutamyl-L-methionine2.890.800.000.011.79440.00
53N-Acetylornithine3.801.420.000.010.76157.00+
54Ascorbalamic acid1.460.960.000.030.74264.00
55Cytosine1.770.900.010.070.69112.00
56Gamma-Glutamylproline1.041.020.000.030.63286.00+
57Choline Glycerophosphate1.061.020.000.040.63258.00+
58L-Glutamine2.471.180.000.060.62147.00+
59L-Asparagine2.021.090.000.040.60133.00+
602-Pyrrolidinone1.531.060.000.010.5986.00+
61Indole1.300.970.000.052.49118.00
62Kynurenine2.951.200.000.002.06209.00+
63Levan1.501.050.000.010.87527.00+
Note: the GS group represents Vigna angularis without the spraying of FSA; Z-2-GS-2 group is Vigna angularis under FSA stress. VIP represents the VIP value of the metabolite in the OPLS-DA model between the two groups; FC represents the fold change of the metabolite between the two groups; p-value represents the difference significance test result of the metabolite between the two samples; FDR represents the corrected p-value; and M/Z refers to the ratio of the mass of charged ions to the charge; “+” indicates an increase in content; “−” indicates a decrease in content.
Table 3. Pathway enrichment identification results of Z-2-GS-2-VS-GS group.
NumberPathway
Description
Pathway
ID
TotalHitsImpact
_Value
p_
Value
MetaboliteKEGG Compound ID
1Alanine, aspartate and glutamate metabolismmap002502820.120.00L-Glutamine; L-GlutamineC00064; C00152
2Tryptophan metabolismmap003805630.060.005-Methoxyindoleacetate; Indole; KynurenineC05660; C00463; C00328
3Arginine biosynthesismap002202320.050.00N-Acetylornithine; L-GlutamineC00437; C00064
4Glycerophospholipid metabolismmap005644820.050.01L-Glutamine; Choline GlycerophosphateC04230; C00670
5Pyrimidine metabolismmap002406220.010.02Cytosine; L-GlutamineC00380; C00064
Note: Total represents the number of metabolites in the metabolic pathway; Hits represents the number of differential metabolites hitting the pathway; Impact represents the impact value of the metabolic pathway topology analysis; and p-value indicates the enrichment significance of metabolites involved in the pathway.
Table 4. Statistical analysis results of targeted amino acid metabolites in Z-2-GS-2 vs. GS.
NumberMetaboliteVIPRetention Timep_ValueFDRFCContent Change
1L-Alanine0.392.830.100.200.82
2L-(+)-Arginine3.503.950.000.000.41
3L-Asparagine Anhydrous1.573.440.000.010.57
4L-Aspartic Acid1.083.700.020.061.45+
5L-Glutamine0.423.430.010.040.71
6L-Glutamic Acid1.883.390.040.111.24+
7L-Glycine0.183.170.300.370.88
8L-Histidine0.354.000.160.280.86
9L-Isoleucine0.111.930.190.290.88
10L-Cysteine0.172.930.070.141.25+
11L-Leucine0.242.020.030.100.77
12L-Hydroxyproline0.042.880.330.380.89
13L-Tryptophan0.781.910.000.001.55+
14L-(+)-Lysine0.364.010.050.110.76
15L-Methionine0.062.200.190.290.87
16L-Phenylalanine0.431.900.000.021.40+
17Propionic acid0.142.290.400.440.91
18L-Serine0.143.430.210.290.86
19L-(−)-Threonine0.053.100.850.850.98
20L-(−)-Tyrosine0.072.360.590.611.05+
21Valeric acid0.202.240.220.290.87
Note: VIP represents the VIP value of the metabolite in the OPLS-DA model between the two groups; FC represents the fold change of the metabolite between the two groups; p-value represents the difference significance test result of the metabolite between the two samples; FDR represents the corrected p-value; + indicates an increase in content; − indicates a decrease in content.
Disclaimer/Publisher’s Note: The statements, opinions and data contained in all publications are solely those of the individual author(s) and contributor(s) and not of MDPI and/or the editor(s). MDPI and/or the editor(s) disclaim responsibility for any injury to people or property resulting from any ideas, methods, instructions or products referred to in the content.

