Article

Integrating Agrivoltaic Systems into Local Industries: A Case Study and Economic Analysis of Rural Japan

Graduate School of Energy Science, Kyoto University, Yoshida Honmachi, Sakyo-ku, Kyoto 606-8501, Japan
*
Author to whom correspondence should be addressed.
Agronomy 2023, 13(2), 513; https://doi.org/10.3390/agronomy13020513
Submission received: 17 December 2022 / Revised: 31 January 2023 / Accepted: 8 February 2023 / Published: 10 February 2023
(This article belongs to the Special Issue Agrivoltaic: Challenge and Progress)

Abstract

:
The growing number of photovoltaic installations has created competition in land use between the need for electricity and food. Agrivoltaic systems (AVSs) can help solve this problem by increasing land use efficiency through the co-production of electricity and food. However, in Japan, where more than 2000 AVSs have been installed, some undesirable AVS cases have led to new problems. In this study, we developed an AVS installation model that is compatible with a regional society and limits the scale of AVS installation to a low-risk level. AVS projects have also entered local industrial clusters and stimulated the local economy. In this study, we used public information and geographic information systems to ensure quantifiability and applicability. The results revealed that the rural area targeted in this study had an AVS generation potential of 215% (equal to 17.8 GWh) of the region’s annual electricity consumption and an economic ripple effect of 108.9% (EUR 47.8 million) of the region’s gross regional product. Furthermore, the levelized cost of electricity was estimated to be 14.94–25.54 Euro cents/kWh under secure settings. This study provides solutions to food, economic, and energy problems in rural areas by promoting the installation of AVSs.

1. Introduction

Expanding renewable energy sources is a key approach to combating climate change. The Japanese government has set an aggressive goal of increasing the country’s share of renewable energy in the electricity sector to 36%–38% by 2030 (it increased by 19.8% in FY2020) in its sixth basic energy plan. To achieve this goal, photovoltaic (PV) power (also known as solar power), which is already cost-competitive with fossil fuel sources and can be installed within a short period, will play a major role [1].
Land constraints are a serious obstacle to promoting PV energy in Japan, and farmland has attracted attention for future installations because of its low site preparation costs and excellent sunlight hours [1,2]. The COVID-19 pandemic and the Russia–Ukraine war have disrupted energy and food supplies globally [3], and energy and food security are pressing issues that should not be overlooked. A particular type of solar PV installation that can help address both of these issues is an agrivoltaic system (AVS), which combines solar PV and agriculture. It was first proposed in 1982 by Goetzberger and Zastrow, from the Fraunhofer Institute for Solare Energy Systems ISE, Germany [4]. AVS provides benefits such as increasing the land equivalent ratio, improving agricultural profitability, increasing water use efficiency, and reducing high temperature disruptions [5,6]. The attention paid to AVSs has increased rapidly, which has been driven in part by the widespread use of PV power generation systems [7].
In Japan, an AVS support program was initiated in 2013, and as of 2021, a cumulative total of 3474 AVSs had been approved for establishment. Examples of AVS crops are mioga ginger, Japanese cleyera, wood ear mushrooms, tea plants, rice, soybeans, and komatsuna (Table 1) [8]. The potential for AVS adoption is higher in rural areas because AVSs are installed on agricultural land. For Japan, where the formation of a regional circular and ecological sphere (R-CES) is a guiding principle of its comprehensive environmental policy, renewable energy generation projects implemented in rural areas are of great significance [9]. Thus, AVSs can not only improve farmers’ income but can also provide an opportunity to revitalize the declining population and economic activity in rural areas.
Many benefits of AVS have been reported. However, in Japan, where many commercial cases are distributed, there are socially problematic cases and critical remarks can been made. In addition, there is a lack of accumulated scientific knowledge about these negative aspects. In our study, the problems associated with AVSs can be sorted into three categories—(i) a lack of safety, (ii) an imbalance between agriculture and energy production, and (iii) non-contribution to the local economy.
(i) Cases of solar panels flying off or frames collapsing during disasters have been reported [10,11]. In particular, AVSs that are constructed mainly by farmers (non-professionals in construction) using tubular pipes to reduce capital expenditure (CAPEX) have a relatively high risk during a disaster. (ii) Japan’s AVS support program allows AVSs to be installed on prime agricultural land (where power generation facilities cannot normally be installed) on an exceptional basis because AVSs will not interfere with the stable supply of food. However, in reality, there are cases where pseudo-agriculture is implemented and AVS designs are adopted to unilaterally maximize power generation. In most of these cases, previously grown crops are abandoned and farmers change to more shade-tolerant crops, such as ornamentals and spices, which contribute less to the food supply (Table 1). When such AVSs are introduced in large quantities on prime farmland, the assumption that they will not disrupt a stable food supply is undermined. (iii) AVS projects that build strong relationships with the local communities in which they are located bring significant economic benefits to those communities [12]. However, through interview surveys, we found that there are AVSs in which project inputs and outputs are extremely dependent on areas outside the region and the benefits are not distributed to the region. Therefore, in this study, we examines an AVS installation model that could avoid these issues and contribute to regional decarbonization.
This study’s two main objectives were as follows:
  • To determine the scale of AVS installations that would not negatively impact food security in a specific rural area of Japan (Ine town, Kyoto Prefecture); and
  • To quantitatively measure the impact of the AVS outputs on the regional economic cycle by incorporating the outputs into the local industry (i.e., the fisheries industry).

2. Theories and Methods

2.1. Conditions for Sustainable AVSs

The following three conditions were used to constrain the design of the AVS installation model in this study: (i) safety issues, (ii) land use, and (iii) economic management. We sought to avoid potential conflicts by addressing these issues.

2.1.1. Safety Retention Conditions

The first constraint was that the model had to comply with safety requirements: AVS structures must adhere to regulations such as the Electricity Business Act and feed-in tariffs (FITs), standards such as the Japanese Industrial Standards (JIS), and design guidelines from Japan’s New Energy and Industrial Technology Development Organization (NEDO) and the Japan Photovoltaic Energy Association [13]. Safety measures based on these regulations were considered in the model.

2.1.2. Land Use Conditions

The second constraint addressed land use conditions. In Japan, AVSs are increasingly being installed with a high (≥60%) land area occupation ratio (LAOR) in order to increase power producers’ revenue from electricity sales [14]. The LAOR is “the ratio between the area of the modules and the area of land that they occupy” [15]. AVSs with a high LAOR strongly limit the types of crops that can be grown in the fields underneath them; only shade-tolerant plants are suitable for areas with a high LAOR, and these are often ornamental plants and mushrooms. However, an AVS with a high shading rate can create significant problems, as affected farms contribute less to the food supply, cause disruptions in small-scale markets, and have fewer options for crop rotation and crop conversion, which can also lead to a decline in food self-sufficiency in the region [16]. Therefore, as a land use condition, the project was required to meet one of the following criteria: (1) the AVS should have a minor impact on crop production (less than a 20% decrease in production) or (2) the AVS should increase crop production in the target area through effective land use.

2.1.3. Economic Management Conditions

The third constraint pertained to economic management. While the land use conditions were based on crop production, the economic management conditions were based on the way in which the introduction of the AVS contributes to agricultural management and the local economy. Specifically, economic management conditions could be met by satisfying one of the following: (1) introducing AVS to improve agricultural profits, maintain employment, and improve the sustainability of farm businesses, such as through the sixth industrialization of agriculture and introducing IoT to farming, or (2) introducing AVS to improve the regional economic cycle in the target region. The term “improvement of the regional economic cycle” refers to the possibility that AVS can improve a region’s economic cycle in terms of its processes of production, distribution, and consumption, thereby reducing the outflow of wealth (added value) from the region’s economy [9].

2.2. Model for the Installation of Agrivoltaics in Accordance with the Regional Society

2.2.1. Concept of a Regionally Harmonized AVS Installation Model

Here, we propose and verify a collaboration model that satisfies the three conditions described in Section 2.1.
  • The installation of AVSs should be carried out in abandoned farmlands with a low disaster risk.
  • The AVS installed should be a rattan-shelf open-field-type AVSs, and the LAOR must be limited to a maximum of 35%.
  • Crops that contribute to food production (including fodder crops) must be grown on the farmland underneath the PV modules and be fed to local industries.
Concerning the first point, to meet the safety retention and land use conditions, the target area was limited to abandoned farmland with low disaster risk. The definition of abandoned farmland in this study was “cropland that is not currently used for cultivation and is not expected to be used for cultivation”. Recycling abandoned farmland improves the local environment and thus can reduce the cost of consensus-building in support of AVSs. Furthermore, Japan’s Ministry of Agriculture, Forestry and Fisheries (MAFF) relaxed a condition of their AVS support scheme in 2021 so that the allowable yield loss for farmland underneath an AVS, which was previously limited to no more than 20%, does not apply when the AVS is installed on abandoned land [17,18]. This is expected to shorten the administrative approval process.
Regarding the second point, safety retention and land use conditions were achieved by introducing open-field rattan-shelf AVSs. As there were many commercial cases of this type of AVS in Japan, it was relatively easy to design a robust power generation system and a business plan. In addition, an LAOR of 35% is low enough that most crops grown in Japan could continue to be grown without difficulty.
The third point is related to land use and economic management conditions. In Japan, the crops listed in Table 1 are grown underneath AVSs. From a food security perspective, some of these crops, such as ornamentals and spices, which contribute little to a stable food supply (e.g., kleela, kikurage, and myoga ginger), were excluded from the study model. In addition, it has been reported that strengthening regional industrial linkages improves the regional economic cycle [9]. Therefore, in this model, common vegetables or grains that were also grown in conventional agricultural areas and which could be used in the core industries of a region were grown directly underneath the AVS. The harvested AVS products were thus fed to the local industry, increasing its economic contribution to the installation area through increased local self-sufficiency.

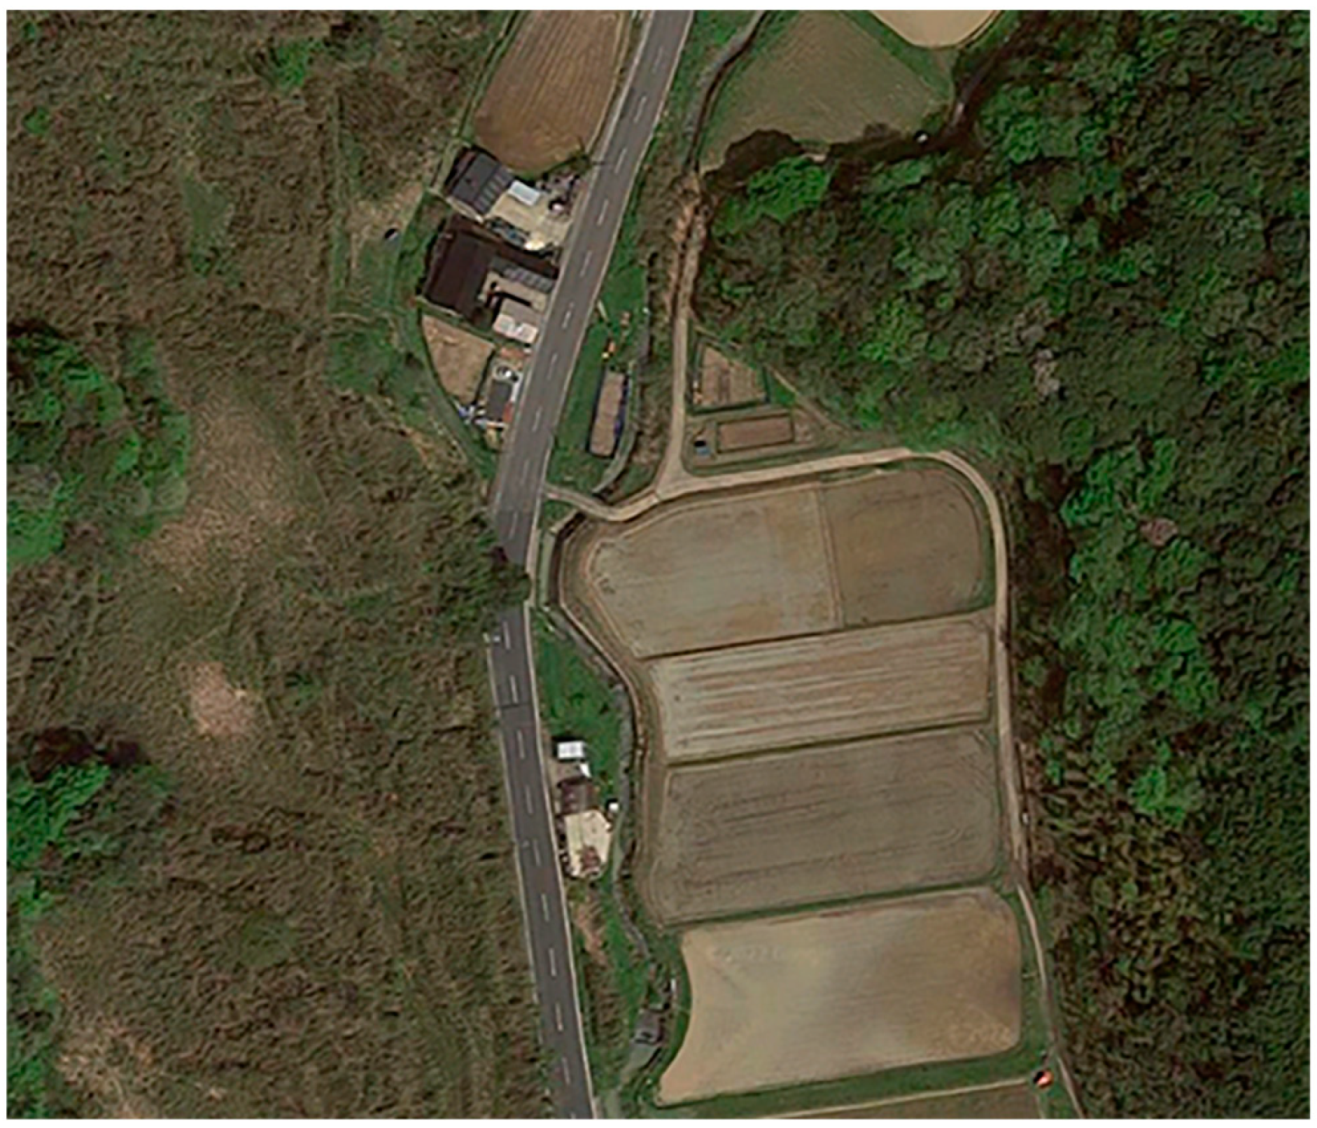
2.2.2. Case Study in Rural Japan

We selected Ine town, Kyoto Prefecture, as our study area. Ine town, a rural area in Kyoto Prefecture, has a population of 2030 and a total area of 61.95 km2. The traditional architecture that surrounds a bay in the southeastern part of the town has been designated as an important preservation district of historic buildings and is a tourist area that attracts approximately 300,000 visitors annually [19]. The average level of solar radiation on a horizontal surface in Ine is 12.3–12.8 MJ/m2 per day [20]. Ine’s solar energy potential is average [21]. The potential for installing ground-mounted PV power is low because 82% (50.77 km2) of the town is forest, and the southern part of the town, which has the highest level of solar radiation, is under a landscape protection ordinance [22]. In addition, the amount of abandoned farmland is increasing due to serious damage by wild animals, but there is a lack of research on the specific area and the distribution of the abandoned farmland.
Section 2.2.1 presents a model for supplying AVS crops to key industries in the region. In Ine town, the key industry is fisheries. Therefore, in this case study, we chose soybean as a crop that can be fed to fisheries and which has a proven track record of being grown under AVSs. This is because soy protein is a promising raw material for low-fishmeal compound feeds for aquaculture. Currently, the Japanese aquaculture industry relies on imported fishmeal (the supply of which is unstable) for the majority of its compound feed ingredients. Thus, to improve and stabilize the local economy, there should be a stable supply of AVS soybeans to the fisheries in the study area.

2.3. Simulating the Potential for Installing AVSs

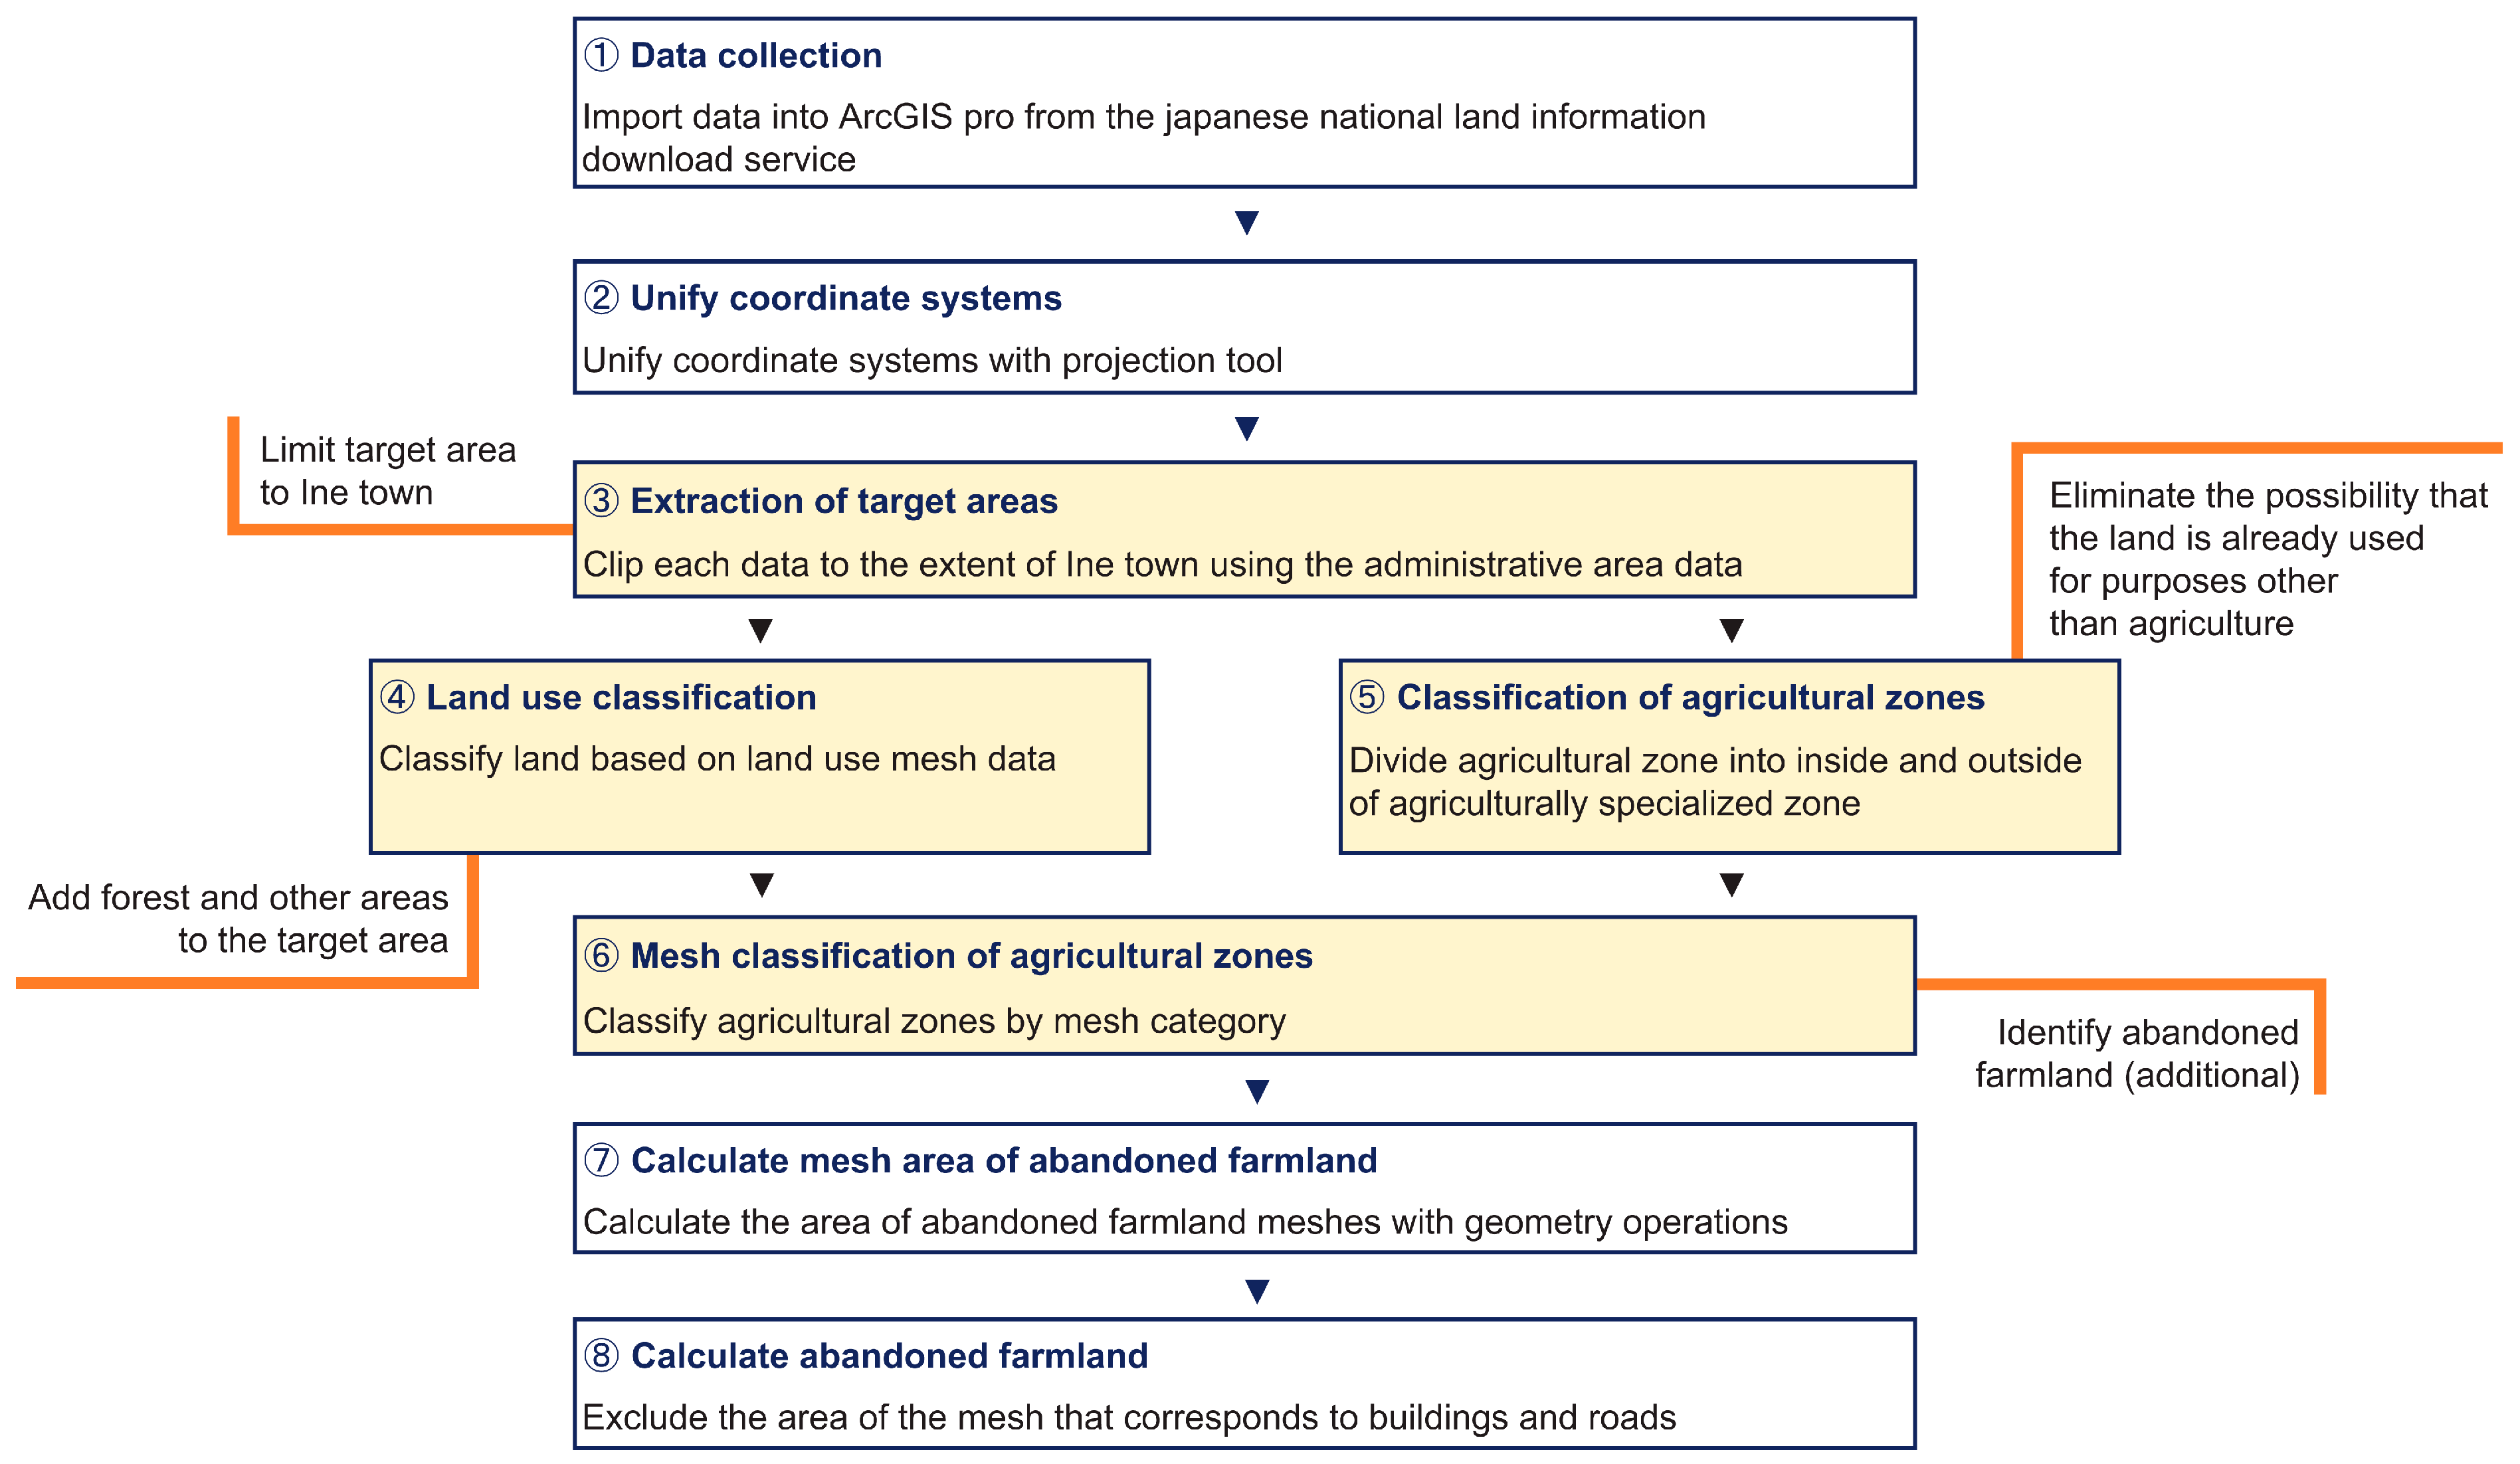
2.3.1. Distribution of Abandoned Farmland

The distribution of abandoned farmland in Ine town was surveyed for the AVS installation area. A quantitative survey using a geographic information system (GIS) was adopted as the survey method, and literature, interview, and field surveys were conducted as preliminary research approaches.
(i) Literature Survey
Table 2 summarizes the results of public surveys conducted in Japan that examined the distribution of idle farmland and their results and limitations. They all concluded that the area of idle farmland within the study area was 1 ha or less. However, the results of the interviews and field surveys presented below indicated that the official survey results underestimated the area of fallow farmland.
It should be noted that the results of Survey No. 3, which was conducted by Japan’s Ministry of Environment (MOE), were published after summing up the results for each prefecture, and we could not refer to the results of the target area only. Therefore, in this study, we attempted to estimate the distribution of abandoned farmland in Ine town using the publicly available method used in the 2020 GIS survey. The MOE estimated the distribution of abandoned farmland using “land use mesh data” and “farmland area data” distributed by Japan’s Ministry of Land, Infrastructure, Transport and Tourism [23]. The land-use mesh data were based on satellite images, and one of 12 categories (see Table 3) was assigned to each mesh of approximately 100 m square. The agriculture area data included agricultural zones (areas where agricultural land use was desirable) designated by prefectures and agricultural specialized zones (areas where, in principle, no use other than agriculture was permitted) designated by municipalities as part of an agricultural zone based on the Agriculture Promotion Act. In the survey conducted by the MOE, abandoned farmland was categorized as wasteland in the land use mesh data and as an agricultural area in the agricultural area data. Therefore, the area of abandoned land in Ine town was estimated to be 0.14 ha. Hereafter, abandoned farmland detected by the MOE survey method is referred to as “abandoned farmland (existing)”.
Table 2. Japanese public surveys of abandoned farmland.
No.Public SurveysConductorsMethodsArea of Abandoned FarmlandsLimitations
1Census of Agriculture and Forestry [24]MAFFQuestionnaire survey0.969 haIn the latest survey, the question about abandoned farmland was deleted, so the current distribution of abandoned farmland is unknown.
2Survey of Agricultural Land Use [25]MAFF and Board of AgricultureField survey0.0 haA large amount of idle farmland was not counted
(inconsistent definitions).
3Renewable Energy Potential Study [23]MOEGIS survey0.14 ha
(Reproduction results of our procedure)
A large amount of idle farmland was not counted
(mesh data lack accuracy).
(ii) Interview Survey
To confirm that these results were consistent with the current land use in Ine, we interviewed town officials on 25 March 2021. During the interview, we presented the results of our literature review. We confirmed that no study on the introduction of AVSs has been conducted by Ine town. We also found that many abandoned farmlands were not detected in the literature survey.
(iii) Field Survey
The interview survey revealed that the existing survey did not accurately reflect the current situation. A field survey was conducted to determine the difference between the survey and the actual conditions. The goal was to improve the accuracy of the quantitative evaluation by identifying the characteristics of the additional abandoned farmland that was not included as abandoned farmland in the existing survey.
Figure 1 presents a picture of additional abandoned farmland identified in Ine town. The area was used as a paddy field until a few years ago but is now covered with weeds. Figure 1 also depicts the land use mesh data and agriculture area data superimposed on the location where the picture was taken (indicated by the camera icon in Figure 1b) in the GIS. The area was not included as abandoned farmland in the MOE survey because it was categorized as a “Miscellaneous site” in the mesh data.
(iv) Quantitative Evaluation Using GIS
Based on the results of the field survey, we estimated the distribution of abandoned farmland in Ine town using GIS. Figure 2 depicts a flowchart of the process used for the detection of abandoned farmlands in this study. The parts depicted in white indicate the processes used in the MOE survey process. The areas in yellow are the processes added in this study. This process was used to detect abandoned farmlands during our field survey that had not been discovered during the public survey.
The areas considered for AVS in this study were “abandoned farmland (existing)” and “abandoned farmland (additional)” that met the land use conditions. However, the area of existing farmland and the amount of electricity generated when AVSs were implemented were also calculated as reference values.
The datasets used in the analysis (Table 4) were downloaded from the website of Japan’s Ministry of Land, Infrastructure, Transport, and Tourism. The administrative zone (dataset) was used to clip other data within Ine town. In the land use mesh data, Ine town was classified into agricultural land, wasteland, forest and other, as well as water areas, as presented in the first column of Table 3. Wasteland was included in the category of “abandoned farmland (existing),” whereas forests and other land types were included in the category of “abandoned farmland (additional).” Therefore, these distributions did not overlap. The agricultural land dataset was used to determine the distribution of agricultural zones and agricultural specialized zones. Furthermore, three datasets—traditional building preservation zones, sediment disaster alert areas, and flood disaster alert areas—were used to exclude areas with high risks of landslides and other natural disasters from the installation area.
As depicted in Figure 3, it was not possible to install AVS on all mesh areas because the mesh areas of abandoned farmland included roads, rivers, and buildings. A study conducted by the MOE assumed that 30% of the mesh area was abandoned farmland where power generation facilities could be installed [23]. Following the approach of the MOE, we also assumed that 30% of the mesh area was abandoned farmland.

2.3.2. Annual Electricity Generation

In this section of the study, we calculated the amount of electricity generated by installing AVS on the identified abandoned farmlands. To maintain a balance between power generation and agricultural production, power generation was not maximized. We used Equation (1) from the JIS [27]:
E P y = K · P A S · H A m / G S
where EPy (kWh/year) is the system’s annual electric power generation, K is the monthly total design factor, and PAS (kW) is the quasi-solar array output. HAm (kWh/m2/month) is the monthly integrated sloping surface solar radiation and GS (kW/m2) is the solar radiation intensity. K, HAm, and GS were obtained from the MONSOLA-20 solar radiation database published by NEDO [20]. Using Equation (2), we calculated PAS based on the area of abandoned farmland:
P A S = S A f · D S p R S
where SAf (m2) is the area of farmland subject to AVS, DSp (kWac/m2) is the installed power generation equipment density, and RS represents LAOR. We assumed that as LAOR increased, the amount of electricity generated would increase linearly. Using this assumption, we calculated the amount of electricity generated when LAOR ranged from 0% (no AVS installed) to 100% (fully shaded). Here, based on REPOS and our interview survey data, DSp = 0.095 (kWac/m2), which was set for RS = 1 (fully shaded LAOR = 100%).
We also calculated reductions in greenhouse gas (GHG) emissions. We adopted a value of 387.5 g-CO2/kWh for GHG reductions achieved using PV energy to generate electricity. In this, we assumed that the power source was switched from commercial grid power to crystalline silicon solar cells [28].

2.3.3. Annual Agricultural Production

Next, we estimated the annual agricultural production based on the area of abandoned farmland. Our model assumed that soybeans were grown on agricultural land under the AVS. Based on agricultural production data from Kyoto Prefecture [29] and the results of interviews with businesses implementing AVS projects, the per-area yield of soybeans (dried seedlings) was set at 850 kg/ha/year. This setting was within the standard range for soybean yields in Japan. The difference between this value and the international standard (1.5–2.5 t/ha) was due to differences in weather, soil, variety, etc. [30,31].
In this case study, we assumed that soybeans were processed to produce soybean oil and soybean oil cake. According to data from MAFF, 200 kg of soybean oil is produced per 1000 kg of raw soybeans [32]. Soybean protein is obtained from soybean oil cake through a refining process. Researchers have investigated whether it can be used as an aquaculture feed ingredient to replace fishmeal, which suffers from instability in its supply [33]. The amount of soybean protein that could be extracted depended on the soybean variety and the level of refining. In our model, soybean protein production was assumed to be 33.8% of the soybean harvest, which was the soybean protein ratio for Japanese yellow soybeans (dry seed). Based on previous studies [34,35], the proportion of soybean protein in low-fishmeal diets was assumed to be 40% of the total feed production.

2.3.4. Annual Aquaculture Production

Based on soybean production, we estimated the increase in annual aquaculture production. Yellowtail accounted for 54.8% (2020, weight basis) of total fish landings in Japan and 31.8% (2019, weight basis) of total landings in Ine town [36]. The feed conversion ratio (FCR) represents the weight of feed required to produce 1 kg of fish meat. The FCR for yellowtail was set at 2.8 [37].

2.4. Evaluation of Account Balances for Agrivoltaic Projects

2.4.1. Sales

Sales of electricity, soybeans, soybean oil, soybean oil cake, aquaculture feed, and farmed fish (yellowtail) were defined as sales generated by AVS projects. The unit price of electricity was set at JPY 11.1 (including tax) based on the FIT price for electricity in 2022 (10–50 kWac scale) [38]. The unit price of soybeans was assumed to be JPY 11,295/60 kg, which was the average bid price for Japanese soybeans in 2020 [39]. The unit price of soybean oil was set at JPY 6900/16.5 kg based on the price of refined soybean oil in September 2022 [40]. The unit price of soybean oil cake was set at JPY 103.9/kg based on the price of defatted (extracted) soybean for feed meal in September 2022 [41]. The unit price of aquaculture feed was assumed to be the price of formula feed in February 2021, which was set at JPY 192,475/t [42]. The unit price of cultured fish was assumed to be the wholesale price of JPY 372/kg obtained at the Miyazu fishing port in FY2020, which was the closest fishing port to Ine town [43].

2.4.2. Capital and Operating Costs

Table 5 presents the CAPEX assumptions used in this study. We defined three scenarios for CAPEX in order to reflect the differences that arise depending on the level of devastation in the target area and the number of AVS modules used. The three scenarios were the standard scenario (CAPEX: JPY 320,000/kWac), the low-cost scenario (CAPEX: JPY 200,000/kWac), and the high-cost scenario (CAPEX: JPY 430,000/kWac). The size (power output) of each agrivoltaic project was assumed to be 50 kWac. Dismantling costs were assumed to be offset by the residual value of the entire AVS after its useful lifetime and were therefore excluded from the calculation. The standard scenario was based on the average of the collection of examples published by MAFF; similarly, the low-cost scenario was based on the lower limit of the case studies and the high-cost scenario was based on the upper limit [44]. Breakdown assumptions were based on previous studies [45,46,47] and interviews.
Table 6 presents the operating costs (OPEX) assumed in the model. The management entity was assumed to consist of the power producer (investor), who oversees the AVS operators, and the farmer (= the landowner), who is in charge of the farming process. “land costs/farming compensation” compensated for reduced agricultural income due to cultivable land loss and microclimate change. The enterprise tax was proportional to the electricity sales revenue. A fixed-asset tax was levied in proportion to CAPEX. In Japan, the number of statutory durable years for PV systems for tax purposes is 17 years, but the Japanese government and the International Renewable Energy Agency use a lifetime of 25 years in their power generation cost calculations [48,49]. In this study, the lifetime was set at 25 years, in accordance with common practice in power generation cost calculations.

2.4.3. Levelized Cost of Electricity

The levelized cost of electricity (LCOE) is a measure of the cost of electricity per unit of electricity generated. In this study, LCOE was calculated using the following formula:
L C O E = I 0 + t = 1 n A t · 1 + i t t = 1 n M t ,   e l · 1 + i t
where I0 is CAPEX, At is OPEX in year t, Mt,el is electrical energy produced in year t, and i is the interest rate used to determine the present value of future costs. Although Mt,el was not a monetary value, because electricity sales revenue was a function of Mt,el, we assumed that Mt,el could be discounted to the base date of the project using i [45]. In this calculation, i was set at 0.03 based on the model plant settings in the Japanese government’s power generation cost review [48]. In this study, agricultural costs and incomes were not used in the LCOE calculations, because the agricultural sector was separated from the power generation sector. Mt,el was calculated using the following formula:
M t ,   e l = t = 1 n E P y ,   t   · 1 d t
where EPy,t is the system’s annual electric power generation, and d is the annual performance loss of photovoltaic systems. In this calculation, d was set at 0.005 based on previous studies [50,51]. As a reference, the calculated LCOE was compared with the average unit price of electricity [52].

2.5. Estimation of Ripple Effects

We also calculated the ripple effects of increased soybean and fish production. Table 7 presents the induced production values for the study area, i.e., the increase in output value for each industry in the region given a one-unit increase in consumption or investment in that industry. Therefore, these values were equal to the column sums of the inverse matrix coefficients in an input–output table. These values were obtained from the Regional Economy Society Analyzing System (RESAS), a database developed by the Headquarters for Overcoming Population Decline and Revitalizing the Local Economy in Japan. The purpose of this database is to visualize regional economic data to assist local governments in making policy decisions [53].

3. Results

3.1. Potential for Installation of AVSs

A flowchart of the classification process for abandoned farmland mesh areas is presented in Figure 4. The farmland distribution is depicted on a map in Figure 5. The total abandoned farmland mesh area was 176.5 ha, and the area where AVSs could be installed (30% of the mesh area) was estimated to be 52.9 ha. We classified 99.9% of the detected abandoned farmland as “additional”.
Figure 6 illustrates the projected annual electricity production from AVS installations on the estimated areas of abandoned farmland in Ine town. Assuming that the installation area was limited to abandoned farmland and that the LAOR was limited to 35%, we confirmed that 17.6 MW and 17.8 GWh/year of electricity could be produced. The annual energy consumption of Ine town (in 2018) was 23 GWh, and the annual electricity consumption (in 2019) was 8279.6 MWh/year [53,54]. Therefore, this annual electricity generation represented 92% of the annual energy consumption and 215% of the annual electricity consumption of the study area.
In addition, assuming the use of crystalline silicon solar cells, the annual GHG emissions could be reduced by 6898 t CO2 compared with the use of grid commercial power [28]. The reduction corresponded to 69.4% of the annual GHG emissions of Ine town (9938 t-CO2) [54].
In addition, the annual soybean production was estimated to reach 44,999 kg, whereas that of soybean oil was 9000 kg, that of soy protein was 15,210 kg, and that of low-fishmeal feed was 38,024 kg. The annual production of yellowtail farmed using the low-fishmeal feed was estimated to be 13,580 kg.

3.2. Economic Benefits for Agrivoltaic Projects

The results of the revenue calculations based on production volumes and unit costs are presented in Figure 7. The total direct effect of selling electricity was JPY 206.1 million.
The estimates of LCOE values under the three scenarios are presented in Table 8, and Figure 8 compares these LCOE estimates with the trends of electricity prices in Japan.

3.3. Ripple Effects

Table 9 presents the results obtained from the model. The total ripple effect of installing AVSs on abandoned farmland was estimated to be JPY 6205.3 million in the first year. Tying aquaculture to AVSs would provide an additional economic benefit of approximately JPY 23 million per year.

4. Discussions

4.1. Economics

The purpose of this study was to develp an economic model for AVS installation that would not hinder food security and that would improve regional economic cycles in rural areas. This model revealed that installing AVSs would generate JPY 224 million (EUR 1.7 million; for the exchange reference rate we used the annual average for 2021 [55]) in annual revenue in the target area. Out of this, JPY 18 million (EUR 0.14 million) came from the coupling of the AVS and fisheries sectors (Figure 7). The ripple effect under the standard scenario for the first year was JPY 6209.3 million (EUR 47.8 million) (Table 5, Table 6 and Table 9), including CAPEX and operating costs. This ripple effect is equivalent to 108.9% of the 2018 gross regional product (GRP) of the region studied [53].
In addition, the model showed an improvement in the region’s economic cycle structure. The clustering of local industries, i.e., increasing intra-regional sourcing, has been correlated with higher regional labor productivity [9]. Including electricity and feedstock production within a region can increase labor productivity. In addition, JPY 26.4 million/year (EUR 0.20 million) would be paid to local farmers for land costs/farming compensation under this model. As the outflow of income to areas outside of the region decreases, the regional economic cycle structure will improve. Therefore, this model satisfied the conditions for improving economic management.
Regarding the LCOE, the standard scenario resulted in a fairly high price of JPY 26.58/kWh (20.47 Euro cents), as presented in Table 8. The high LCOE was a result of the low amount of electricity generated and high installation costs. The low level of power generation was due to the ordinal solar energy potential in the target area [21] and development restrictions placed on areas with higher levels of solar radiation [22]. In addition, the price of trestles, the small scale of AVS projects, and the use of a segregated business model increased costs. The high cost of trestles may have been due to pricing based on a model in which relatively expensive trestles were used. In practice, there are cases where farmers in Japan can construct AVS themselves using inexpensive agricultural materials to reduce costs.
In this study, installation costs were determined based on a model that ensured safety and performance, as well as the satisfaction of safety requirements. Regarding the limited scale of the AVSs used, there are many small-scale AVSs in Japan. The area of cultivated land under management for agriculture areas in the Kinki region, which includes the target area, has been reported ot be only 1.4 ha [56]. Furthermore, in a survey of AVS owners in Japan, most respondents answered that their installed capacity was less than 1000 kWp [14]. This suggests that many small AVS farms would be established, which would increase costs due to the lack of economies of scale. Finally, regarding the business model, we assumed that power investors and farmers (landowners) were independent. Poonia et al. assumed that AVS investors and farmers were the same when calculating the LCOE and subtracted the profit generated from the sale of crops from the cost of power generation [46]. However, in our study, as in the work of Schindele et al., the AVS investors and farmers were treated as separate entities. This means that agricultural profits were not subtracted from operating costs; conversely, costs were increased by adding farming compensation. Although this increased the LCOE, it also increased the model’s appeal to financial institutions and improved the feasibility of the project in relation to securing external financing. Therefore, although the separation of these categories increased the LCOE, it also increased the feasibility of the AVS projects described in the model. In addition, the Russia–Ukraine war has brought the risk of energy dependence to the forefront [3] and is pushing electricity prices higher (Figure 8). Given the preference for policies that increase renewable energy sources and subsidies for rehabilitating abandoned farmland, it is likely that the high LCOE calculated in this study would be economically feasible.

4.2. Decarbonization

Figure 6 shows that the study area could generate 17.8 GWh/year even under a conservative scenario (target area: abandoned farmland only; LAOR: 35%) that would not adversely affect the existing area used for agriculture. This amount of electricity generated is equivalent to 92% of the total annual energy consumption of the study area. Furthermore, it would also reduce GHG emissions in the study area by 69.4%, thus contributing significantly to the decarbonization of the region.

4.3. Agriculture

In this study, the scope of AVS installations was limited to abandoned farmland (Figure 5), thus eliminating the risk that AVS installations would interfere with agricultural production on existing farmland. Moreover, land use requirements to increase agricultural production and employment were met, and the LAOR was set at a sufficiently low level (35%). A sufficiently low LAOR reduces electricity production but broadens the range of crops that can be produced, which reduces the risks incurred by agricultural operations. If a fixed AVS with a high LAOR were installed, the crops that could be grown would be limited to shade-tolerant plants. In some agrivoltaic projects in Japan, certain types of mushrooms and ornamental plants (with strong shade tolerance and high profitability) have been cultivated; however, the domestic market for such crops is small and unstable [16]. In contrast, agrivoltaic projects with sufficiently low LAORs can grow different crops if market conditions change.
Furthermore, regenerative agricultural practices often call for crop rotation (in which farmers rotate crops to maintain healthy soils and restore biodiversity) [57]. Thus, with their low LAOR values and their wide range of adaptation, AVSs are compatible with regenerative agriculture.

4.4. Land Use

Previous studies have reported that installing AVSs increases land use efficiency [5,6,7]. In addition, the decline in farmland is a serious problem in Japan. The reasons that farmers abandon the cultivation of land include a lack of labor, crop damage by wild animals, and deteriorating profitability [58]. Introducing AVSs would improve profitability for farmers, which in turn would attract support from agricultural corporations. Furthermore, AVSs are highly compatible with agritech, which uses IoT devices and other technologies to improve labor productivity. Abandoned farmland can also serve as a pathway and hiding place for wildlife, so restoring abandoned farmland could help to prevent wildlife invasions. Hence, if the abandoned farmland depicted in Figure 5 was restored to productive farmland through AVS installation, this would represent a solution for the abovementioned problems in rural areas.
During our interviews, one developer stated that the acceptance of AVSs on abandoned farmlands is relatively high because of the growing problems associated with abandoned farmland in the region. Thus, it is possible that a segment of the population is reluctant to accept AVSs but would be willing to do so if this process restored abandoned land to productive use.

4.5. Limitations and Future Prospects

The limitations of this study include assumptions about the AVS installation area, estimates of power generation, and the measurement of economic benefits. First, regarding the installation area, there is a zoning issue. In this study, disaster hazard areas and traditional building preservation zones were excluded from the detected abandoned farmlands. As the remaining areas were designated as agricultural areas, it is unlikely that they contained steep slopes or areas of low sunlight that would be difficult to develop. However, detailed data on these areas’ topography and distance from power lines and residences could be used to refine the cost estimates for installing AVSs. In areas where conditions are relatively poor and business feasibility is low, land uses other than AVSs may need to be considered.
Second, there was room for greater accuracy in estimating power generation using high-level simulations. In this study, as Equations (1) and (2) indicate, for the variable related to the design of fixed AVSs, we used the LAOR. However, this indicator is not suitable for estimating power generation for dynamic or vertical bifacial AVSs. Therefore, more advanced power generation simulations should be performed when introducing these types of AVSs.
Finally, regarding the measurement of economic benefits, there are still issues concerning the accuracy and completeness of the data. The RESAS database uses a large number of statistical estimates that have limited accuracy [53]. Furthermore, although we examined the income and installation costs associated with AVSs, there were still unexamined costs, including soybean processing costs and the costs of producing and distributing farmed fish. The portion of increased farming costs that are incurred when installing AVSs was considered in the form of farming compensation. However, land costs and farming compensation vary by location and crop. Further research is needed on the zoning issues mentioned above. As the cost of electricity is higher than the FIT sales price, economic benefits can be increased if the electricity produced is consumed within the region it is produced. However, in addition to matching the costs of electricity supply and demand, costs associated with the electrification for vehicles, ships, heating demands, etc. are also encountered. Furthermore, although a collaboration between AVSs and the fishing industry was considered in this study, collaborations involving other industries would be required in order to expand this project to other regions. Therefore, future studies should expand the dataset and diversify the sector coupling model.

5. Conclusions

AVSs are of great importance as a renewable energy resource that does not compete with agricultural production. In this study, we developed an AVS installation model that achieved crop production and promoted economic growth in a rural area of Japan. Corresponding to the two objectives presented in Section 1, the following conclusions were derived.
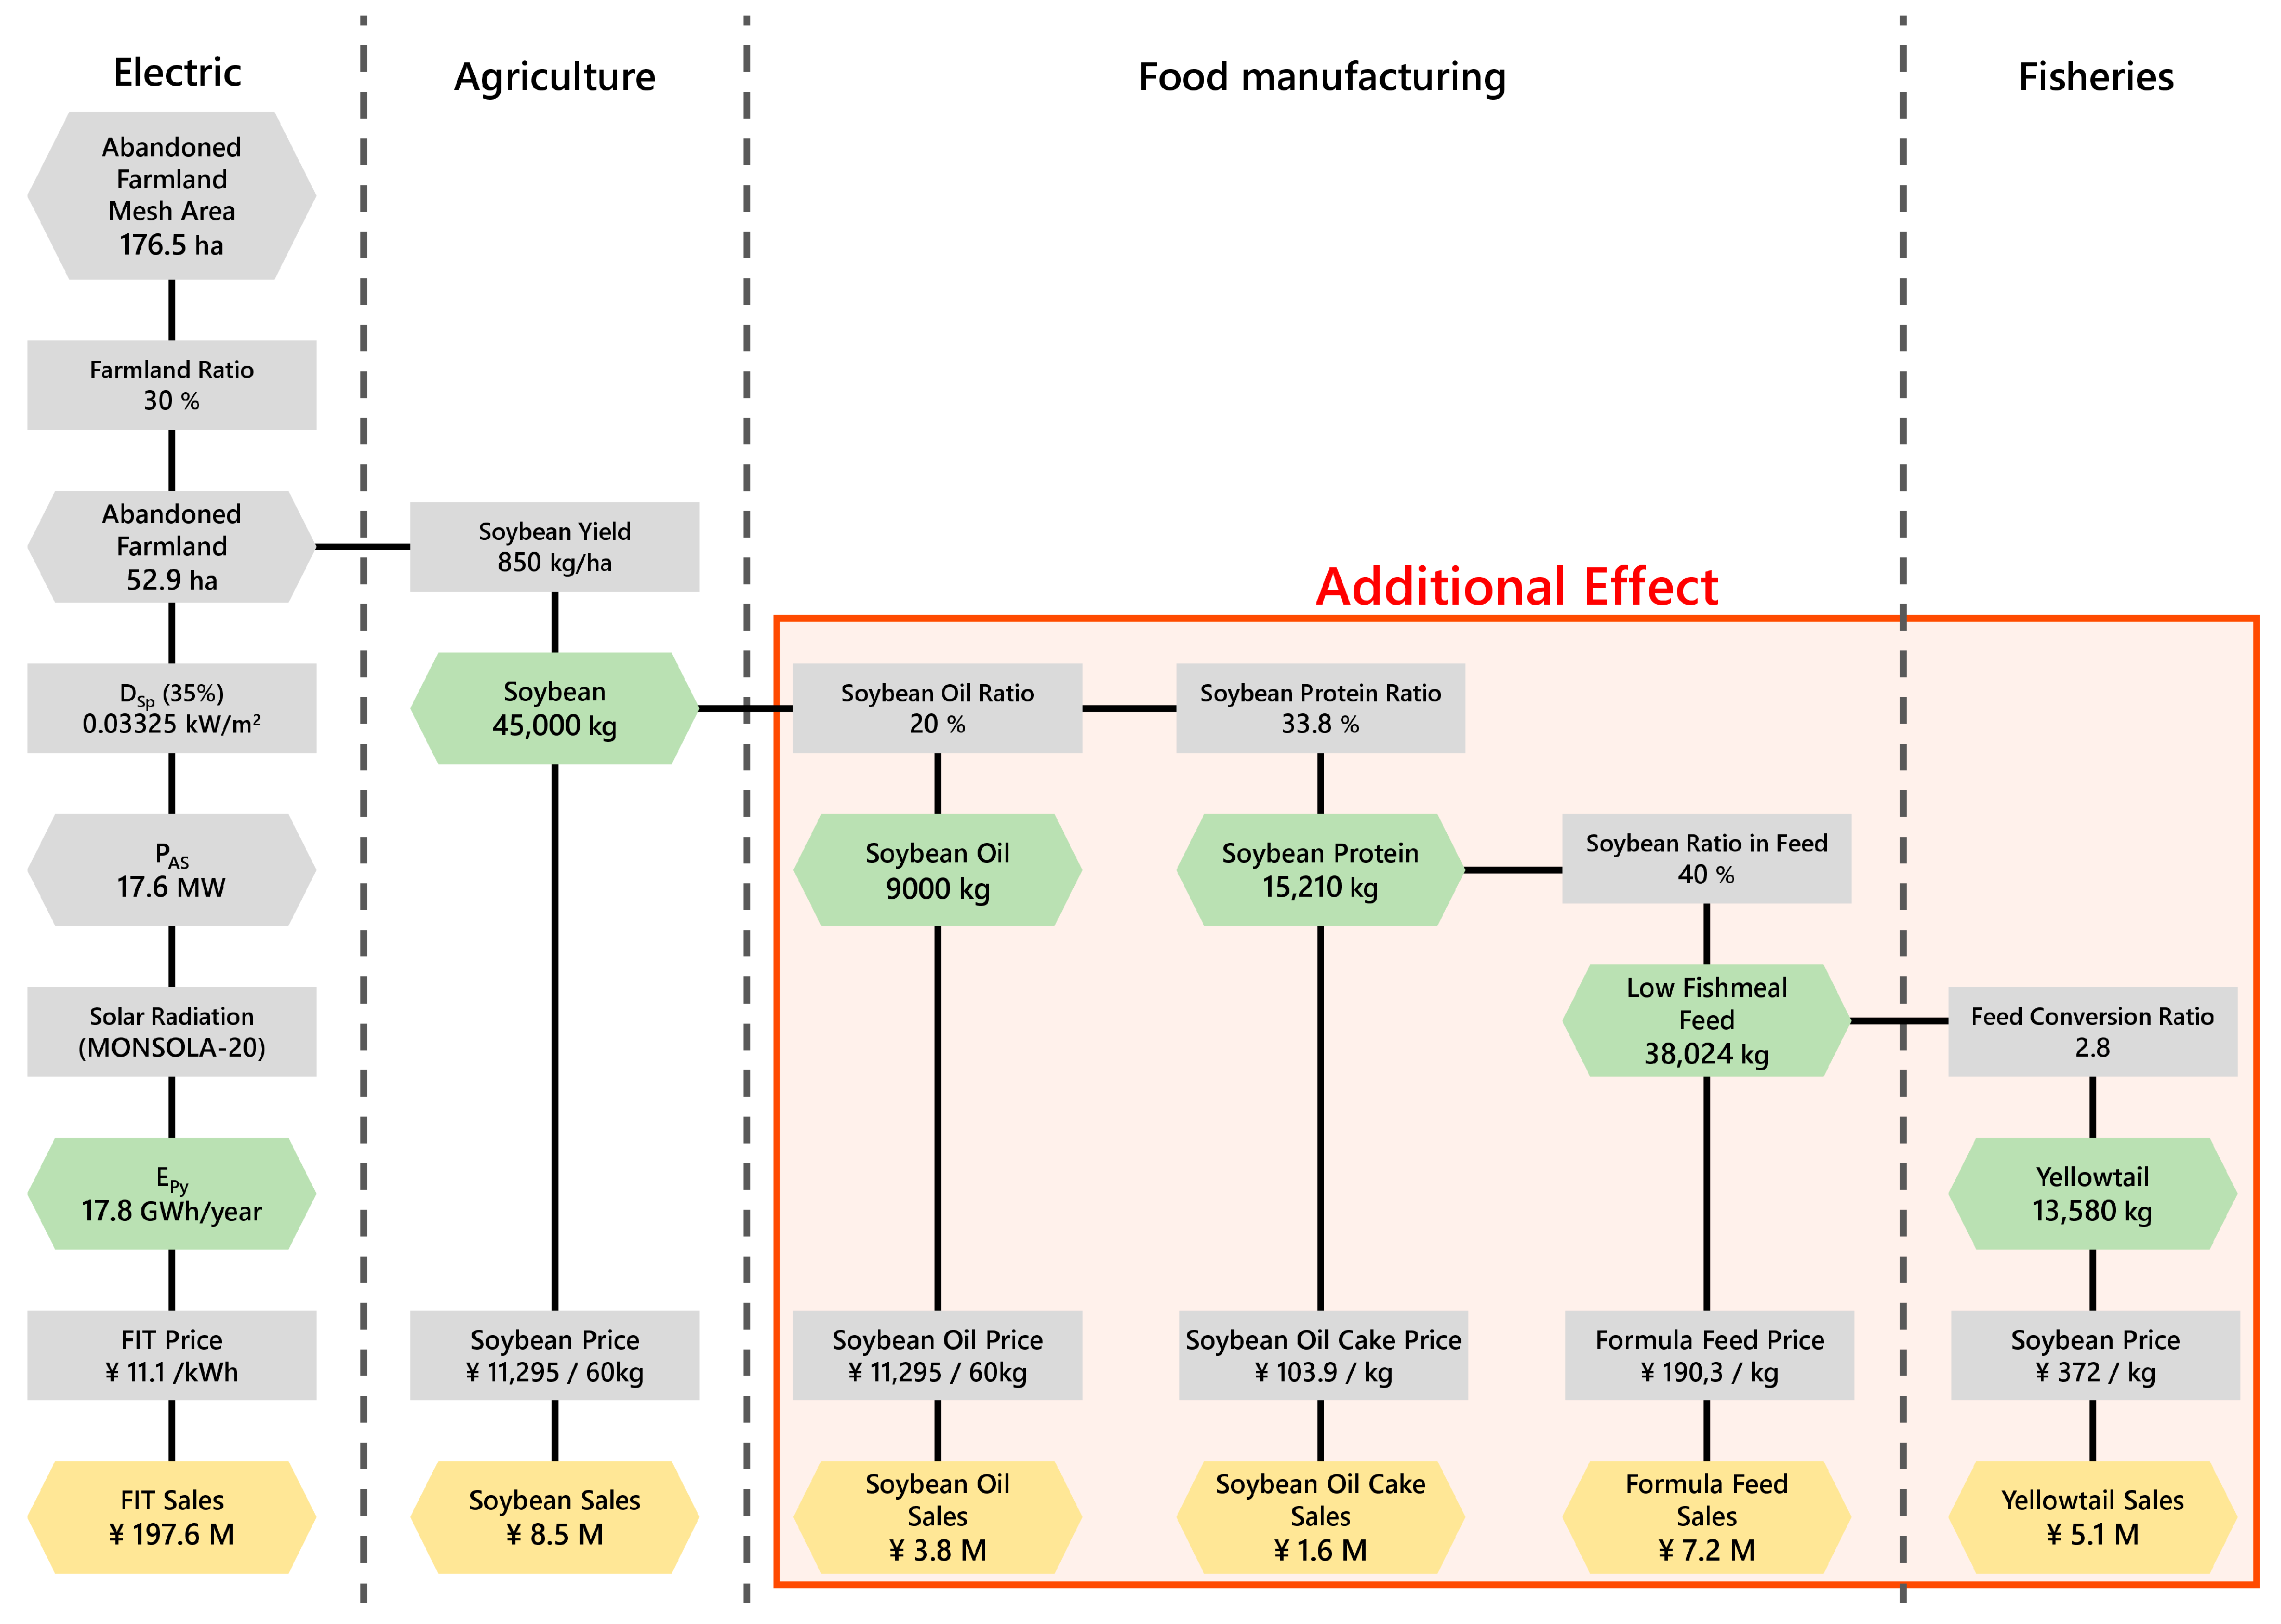
  • In the original methodology of this study, we suggested that there was more abandoned farmland (52.9 ha) in the study area than what was identified in the public survey. Even using only this farmland as the AVS installation area, the AVSs were demonstrated to produce enough electricity (17.8 GWh per year) to meet the region’s electricity needs. In obtaining this estimate, the imposition of restrictions on the installation area and LAOR limited its negative impact on food production.
  • AVS installation was projected to generate EUR 47.8 million (in the first year) in ripple effects under the standard scenario. This was equivalent to 108.9% of the GRP of the target area; EUR 0.14 million of this economic impact was generated through collaboration between AVSs and fisheries. This study represents an example of the potential for improving regional economic cycles when AVS projects are integrated into regional industrial clusters.

Author Contributions

H.N.: conceptualization; data curation; formal analysis; funding acquisition; investigation; methodology; visualization; writing—original draft. S.O.: funding acquisition; investigation; supervision; writing—review and editing. All authors have read and agreed to the published version of the manuscript.

Funding

This research was funded by JST SPRING Grant Number JPMJSP2110, MEXT/JSPS KAKENHI Grant Number 19K12444, and SPIRITS 2022 of Kyoto University.

Data Availability Statement

The data presented in this study are available on request from the corresponding author.

Acknowledgments

The authors are grateful to the reviewers and the editor for helpful comments to improve the paper.

Conflicts of Interest

The authors declare no conflict of interest.

References

  1. Agency for Natural Resources and Energy. Available online: https://www.enecho.meti.go.jp/category/others/basic_plan/pdf/20211022_01.pdf (accessed on 3 February 2022).
  2. Dinesh, H.; Pearce, J.M. The potential of agrivoltaic systems. Renew. Sustain. Energy Rev. 2016, 54, 299–308. [Google Scholar] [CrossRef]
  3. Kim, H.J.; Yu, J.J.; Yoo, S.H. Does combined heat and power play the role of a bridge in energy transition? Evidence from a cross-country analysis. Sustainability 2019, 11, 1035. [Google Scholar] [CrossRef]
  4. Goetzberger, A.; Zastrow, A. On the coexistence of solar-energy conversion and plant cultivation. Int. J. Sol. Energy 1981, 1, 55–69. [Google Scholar] [CrossRef]
  5. Dupraz, C.; Marrou, H.; Talbot, G.; Dufour, L.; Nogier, A.; Ferard, Y. Combining solar photovoltaic panels and food crops for optimising land use: Towards new agrivoltaic schemes. Renew. Energy 2011, 36, 2725–2732. [Google Scholar] [CrossRef]
  6. Trommsdorff, M.; Kang, J.; Reise, C.; Schindele, S.; Bopp, G.; Ehmann, A.; Weselek, A.; Högy, P.; Obergfell, T. Combining food and energy production: Design of an agrivoltaic system applied in arable and vegetable farming in Germany. Renew. Sustain. Energy Rev. 2021, 140, 110694. [Google Scholar] [CrossRef]
  7. Mamun, M.A.A.; Dargusch, P.; Wadley, D.; Zulkarnain, N.A.; Aziz, A.A. A review of research on agrivoltaic systems. Renew. Sustain. Energy Rev. 2022, 161, 112351. [Google Scholar] [CrossRef]
  8. MAFF. Available online: https://www.maff.go.jp/j/nousin/noukei/totiriyo/attach/pdf/einogata-2.pdf (accessed on 3 September 2022).
  9. Yamazaki, K. Approach for regional economic cycle structure and regional economic policy. In Methods and Practices of Regional Economic Cycle Analysis: New Regional Economic Policies Derived from the Three Aspects of Production, Distribution, and Expenditure, 1st ed.; Udhigawa, Y., Komamiya, A., Eds.; DIAMOND, Inc.: Tokyo, Japan, 2019; Chapter 2; Section 1–4; pp. 40–81. [Google Scholar]
  10. Smart Japan. Available online: https://www.itmedia.co.jp/smartjapan/articles/2008/20/news026.html (accessed on 11 November 2022).
  11. MAFF. Available online: https://www.maff.go.jp/committee/council/basic_policy_subcommittee/mitoshi/cost_wgj/study/einougata_taiyoukou.html/attach/pdf/cost_wg_20210908_02einou_kaigi-66.pdf (accessed on 28 August 2022).
  12. Ono, T.; Nakamura, H. Agrivoltaic (solar sharing) as a community-based power source: Quantitative evaluation of its contribution to regional economy by an input-output analysis. J. Public Aff. 2020, 16, 315–337. [Google Scholar] [CrossRef]
  13. New Energy and Industrial Technology Development Organization (NEDO). Available online: https://www.nedo.go.jp/content/100939011.pdf (accessed on 19 April 2022).
  14. Kurasaka, H. From the Japan agrivoltaic survey results report. J. Public Aff. 2019, 15, 280–297. [Google Scholar] [CrossRef]
  15. Scognamiglio, A. “Photovoltaic landscapes”: Design and assessment. A critical review for a new transdisciplinary design vision. Renew. Sustain. Energy Rev. 2016, 55, 629–661. [Google Scholar] [CrossRef]
  16. Tajima, M.; Iida, T. Evolution of agrivoltaic farms in Japan. AIP Conf. Proc. 2021, 2361, 030002. [Google Scholar] [CrossRef]
  17. MAFF. Available online: https://www.maff.go.jp/j/nousin/noukei/totiriyo/attach/pdf/einogata-43.pdf (accessed on 11 September 2021).
  18. MAFF. Available online: https://www.maff.go.jp/j/nousin/noukei/totiriyo/attach/pdf/einogata-1.pdf (accessed on 11 September 2021).
  19. Ine Town. Available online: http://www.town.ine.kyoto.jp/ikkrwebBrowse/material/files/group/4/sokushinkeikaku.pdf (accessed on 22 October 2021).
  20. NEDO. Available online: https://appww2.infoc.nedo.go.jp/appww/monsola_map.html (accessed on 22 October 2021).
  21. Japan Meteorological Agency. Available online: https://www.data.jma.go.jp/obd/stats/etrn/view/atlas.html (accessed on 1 November 2022).
  22. Ine Town. Available online: http://www.town.ine.kyoto.jp/soshiki/kikakukanko/kikaku/kikaku/1585102211236.html (accessed on 22 October 2021).
  23. Ministry of Environment (MOE). Available online: https://www.renewable-energy-potential.env.go.jp/RenewableEnergy/29.html (accessed on 30 June 2022).
  24. MAFF. Available online: https://www.maff.go.jp/j/tokei/census/shuraku_data/2015/sa/sa_2015.html (accessed on 11 May 2021).
  25. Ine Town. Available online: http://www.town.ine.kyoto.jp/soshiki/chiikiseibi/norin/nougyouiinkai/1460964675197.html (accessed on 7 June 2022).
  26. Ministry of Land, Infrastructure, Transport and Tourism. Available online: https://nlftp.mlit.go.jp/ksj/index.html (accessed on 1 February 2022).
  27. C 8907:2005; Estimation Method of Generating Electric Energy by PV Power System. Japanese Standards Association: Tokyo, Japan, 2005.
  28. Japan Photovoltaic Energy Association (JPEA). Available online: https://www.jpea.gr.jp/wp-content/uploads/20220701jpea_guideline.pdf (accessed on 11 July 2022).
  29. MAFF. Available online: https://www.maff.go.jp/kinki/seisaku/seisan/nousan/daizu/attach/pdf/kinki-daizu-6.pdf (accessed on 22 October 2021).
  30. Food and Agriculture Organization of the United Nations. Available online: https://www.fao.org/land-water/databases-and-software/crop-information/soybean/en/ (accessed on 22 October 2021).
  31. Kawasaki, Y.; Yamazaki, R.; Katayama, K. Effects of late sowing on soybean yields and yield components in southwestern Japan. Plant Prod. Sci. 2018, 21, 339–348. [Google Scholar] [CrossRef]
  32. MAFF. Available online: https://www.e-stat.go.jp/stat-search/files?lid=000001290299 (accessed on 3 February 2022).
  33. Ministry of Agriculture, Forestry and Fisheries (MAFF). Development of the aquaculture industry to date. In Fisheries Trends 2020, 1st ed.; Japan Agricultural Statistics Association: Tokyo, Japan, 2021; Chapter 1; Section 2; pp. 89–90. [Google Scholar]
  34. Satoh, S. Studies on the development of sustainable feed for aquaculture. Nippon Suisan Gakkaishi 2018, 84, 603–609. [Google Scholar] [CrossRef]
  35. Akimoto, A. Types and characteristics of compound feeds for fish farming. In Fish Feed and Low Fishmeal 2016, 1st ed.; Midori Shobo Co., Ltd.: Tokyo, Japan, 2021; Chapter 1; Section 2; pp. 10–18. [Google Scholar]
  36. MAFF. Available online: https://www.maff.go.jp/j/tokei/kekka_gaiyou/gyogyou_seisan/gyogyou_yousyoku/r2/index.html (accessed on 1 October 2022).
  37. Ministry of Agriculture, Forestry and Fisheries. Development of the aquaculture industry to date. In Fisheries Trends 2013, 1st ed.; Japan Agricultural Statistics Association: Tokyo, Japan, 2014; Chapter 1; Section 1; pp. 4–7. [Google Scholar]
  38. METI. Available online: https://www.meti.go.jp/press/2020/03/20210324004/20210324004.html (accessed on 1 February 2022).
  39. MAFF. Available online: https://www.maff.go.jp/j/seisan/ryutu/daizu/attach/pdf/index-4.pdf (accessed on 29 October 2022).
  40. Nihon Keizai Shimbun. Major Quotes. Nihon Keizai Shimbun Online, September 29. Available online: https://telecom.nikkei.co.jp/ (accessed on 30 September 2022).
  41. Nihon Keizai Shimbun. Available online: https://telecom.nikkei.co.jp/ (accessed on 30 September 2022).
  42. MAFF. Available online: https://www.jfa.maff.go.jp/j/kikaku/wpaper/R3/220603.html (accessed on 29 October 2022).
  43. Fisheries Agency. Available online: https://www.market.jafic.or.jp/file/sanchi/2020/05_gyokouhinmoku_2020.htm (accessed on 18 October 2022).
  44. MAFF. Available online: https://www.maff.go.jp/j/shokusan/renewable/energy/attach/pdf/einou-1.pdf (accessed on 3 September 2022).
  45. Schindele, S.; Trommsdorff, M.; Schlaak, A.; Obergfell, T.; Bopp, G.; Reise, C.; Braun, C.; Weselek, A.; Bauerle, A.; Högy, P.; et al. Implementation of agrophotovoltaics: Techno-economic analysis of the price-performance ratio and its policy implications. Appl. Energy 2020, 265, 114737. [Google Scholar] [CrossRef]
  46. Poonia, S.; Jat, N.K.; Santra, P.; Singh, A.K.; Jain, D.; Meena, H.M. Techno-economic evaluation of different agri-voltaic designs for the hot arid ecosystem India. Renew. Energy 2022, 184, 149–163. [Google Scholar] [CrossRef]
  47. METI Agency for Natural Resources and Energy. Available online: https://www.meti.go.jp/shingikai/santeii/pdf/073_01_00.pdf (accessed on 17 October 2022).
  48. METI Agency for Natural Resources and Energy. Available online: https://www.enecho.meti.go.jp/committee/council/basic_policy_subcommittee/mitoshi/cost_wg/pdf/cost_wg_20210908_02.pdf (accessed on 17 October 2022).
  49. International Renewable Energy Agency (IRENA). Available online: https://www.irena.org/publications/2022/Jul/Renewable-Power-Generation-Costs-in-2021 (accessed on 29 August 2022).
  50. International Energy Agency (IEA). Available online: https://iea-pvps.org/trends_reports/trends-in-pv-applications-2020/ (accessed on 28 August 2022).
  51. U.S. Department of Energy, Office of Scientific and Technical Information. Available online: https://www.osti.gov/servlets/purl/1225346 (accessed on 29 October 2022).
  52. METI Agency for Natural Resources and Energy. Available online: https://www.meti.go.jp/shingikai/enecho/denryoku_gas/denryoku_gas/pdf/051_04_02.pdf (accessed on 17 October 2022).
  53. Cabinet Secretariat and Ministry of Economy, Trade and Industry (METI). Available online: https://resas.go.jp/regioncycle/ (accessed on 4 February 2022).
  54. MOE. Available online: https://www.env.go.jp/policy/local_keikaku/tools/karte.html (accessed on 31 October 2022).
  55. European Central Bank. Available online: https://www.ecb.europa.eu/stats/policy_and_exchange_rates/euro_reference_exchange_rates/html/eurofxref-graph-jpy.en.html (accessed on 11 December 2022).
  56. MAFF. Available online: https://www.maff.go.jp/j/tokei/kouhyou/noukou/index.html (accessed on 1 November 2022).
  57. Giller, K.E.; Hijbeek, R.; Andersson, J.A.; Sumberg, J. Regenerative agriculture: An agronomic perspective. Outlook Agric. 2021, 50, 13–25. [Google Scholar] [CrossRef]
  58. MAFF. Available online: https://www.maff.go.jp/j/nousin/tikei/houkiti/attach/pdf/index-20.pdf (accessed on 3 January 2022).
Figure 1. (a) Example of abandoned farmland; (b) depiction of the photo area, based on land use mesh data. Although the area was within an agricultural specialized zone, it was categorized as a “Miscellaneous site” (not “wasteland”) in the mesh data.
Agronomy 13 00513 g001
Figure 2. Flowchart of the process used for the detection of abandoned land in this study.
Agronomy 13 00513 g002
Figure 3. An example of an abandoned farmland mesh area, including buildings and roads (Google map 35.69419° N. and 135.27751° E.).
Agronomy 13 00513 g003
Figure 4. Flowchart of land use classification.
Agronomy 13 00513 g004
Figure 5. Distribution of abandoned farmland in Ine town.
Agronomy 13 00513 g005
Figure 6. Estimated annual power generation from AVSs installed on abandoned agricultural land in Ine.
Agronomy 13 00513 g006
Figure 7. Annual AVS-related production and revenues.
Agronomy 13 00513 g007
Figure 8. LCOE and electricity price trends.
Agronomy 13 00513 g008
Table 1. Japanese public surveys of abandoned farmland [8].
ClassificationMajor CropsNumber of CasesRatio
(%)
Number of Crop Change CasesCrop Conversion Rate
(%)
Extensive cropsRice (Oryza sativa), wheat (Triticum aestivum), soybean (Glycine max), buckwheat (Fagopyrum esculentum Moench)29994816.1
VegetablesVegetables: komatsuna (Brassica rapa var. perviridis), Chinese cabbage (Brassica rapa ssp. pekinensis), welsh onion (Allium fistulosum), squash (Cucurbita maxima), etc.; tuberous and corm vegetables116335.177666.7
Including AVS-specific cropsMyoga ginger (Zingiber mioga Rosc.), fuki (Petasites japonicus), udo (Aralia cordata), ashitaba (Angelica keiskei), bracken fern (Pteridium aquilinum), Chinese lizard tail (Houttuynia cordata), red clover (Trifolium pratense)56016.943577.7
Including myoga gingerMyoga ginger (Zingiber mioga Rosc.)3269.822970.2
Fruit treesCitrus fruits, blueberries (Vaccinium spp.), oriental persimmon (Diospyros kaki), grapes (Vitis vinifera L.)46113.922849.5
FlowersLilies (Lilium spp.), pansies (Viola X wittrockiana)130.4861.5
Ornamental plantsJapanese cleyera (Cleyera japonica), Japanese star anise (Illicium religiosum Siebold & Zucc.), senryo (Sarcandra glabra), dwarf mondo grass (Ophiopogon japonicus “Tamaryu”), etc.9943075976.4
Others-38311.617846.5
Including pasturesTalian ryegrass (Lolium multiflorum), sorghum (Sorghum bicolor), Chinese milk vetch (Colocasia gigantea)1043.12221.2
Including mushroomsShiitake mushroom (Lentinula edodes), wood ear mushroom (Auricularia auricula-judae)1554.710970.3
Including tea plantsTea plants (Camellia sinensis (L.) O. Kuntze)1113.43733.3
Total 33131001997-
Table 3. Categories of land use mesh data [26].
Categories Used in This StudyCategories Used in the Land Use Mesh Data
CategoriesDefinitions
Agricultural landPaddy fieldPaddy field
Other fieldsFarmland for growing grain, vegetables, fruits, turf, etc.
WastelandWastelandDevastated land, wetlands, mineral springs, cliffs, etc.
Forest and otherForestArea with intensive perennial plant growth
Building siteArea where buildings are densely packed
Miscellaneous siteStadium, airport, racetrack, vacant lot, etc.
Water areaRiver and LakeLake, pond, river, and riverbed
CoastSand or rocky areas adjacent to the shore
OceanOcean, tidal flat, and sea berth
OtherRoadsRoads distributed in a plane
(No distribution in Ine)RailroadsRailroads and yards distributed in a plane
Golf CourseGolf course concentration areas
Table 4. Vector dataset used to detect abandoned farmland [26].
DataYearDefinition
Administrative zone2021Polygon data with names and ID codes for administrative districts
Fine mesh for land use2016Polygon data on land use in Japan recorded in 100 m mesh units using machine learning to classify satellite images (SPOT, RapidEye)
Agricultural land2015Polygon data on agricultural land designated in a land use master plan
Traditional building preservation zone2018Polygon data on traditional building preservation zones, designated based on the Act concerning the the protection of cultural properties
Sediment disaster alert areas2021Polygon and line data, including areas at high risk of landslides and other types of disasters designated by prefectures
Flood disaster alert areas2012Polygon data processed based on flood depth from the map of flood disaster alert areas created by river administrators
Table 5. CAPEX of each cost factor in JPY/kWac for AVSs.
Type of CostCost (JPY/kWac)
StandardLow CostHigh Cost
PV modules110,00080,000130,000
Inverter30,00025,00035,000
Mounting structures and miscellaneous hardware60,00025,00090,000
Site preparation and installation90,00045,000135,000
Grid connection30,00025,00040,000
Total CAPEX320,000200,000430,000
Table 6. OPEX of each cost factor in JPY/kWac year for AVSs.
Type of CostCost (JPY/kWac·Year)
Land costs/Farming compensation1500
Maintenance1500
Surveillance500
Insurance1250
Repair services750
Enterprise tax (First year)220
Fixed-asset tax (Standard)4192
Total OPEX (First year, Standard)9912
Table 7. Induced production values of Ine town.
IndustrialInduced Production Values
Agriculture1.25
Fisheries1.07
Food products1.38
Metal products1.04
Electrical machinery1.00
Construction1.05
Electricity1.05
Finance and insurance1.10
Other real estates1.15
Other services1.05
Table 8. Mesh areas of abandoned farmland detected in this study.
ScenarioTotal CAPEX (JPY/kWac)LCOE (JPY/kWh)
Standard320,00026.58
Low Cost200,00019.40
High Cost430,00033.16
Table 9. Economic ripple effects of installing AVSs.
IndustrialDirect Effect (Unit: JPY1M)Ripple Effect (Unit: JPY1M)
Agriculture8.510.6
Fisheries5.15.4
Food products12.617.4
Metal products1056.21097.3
Electrical machinery2464.42464.4
Construction1584.21665.0
Electricity725.7762.0
Finance and insurance22.024.2
Other real estates26.430.3
Other services126.1132.6
Total6031.06209.3
Disclaimer/Publisher’s Note: The statements, opinions and data contained in all publications are solely those of the individual author(s) and contributor(s) and not of MDPI and/or the editor(s). MDPI and/or the editor(s) disclaim responsibility for any injury to people or property resulting from any ideas, methods, instructions or products referred to in the content.

