Abstract
Nitrogen (N) effect on crop yield depends on several factors such as soil type, climatic characteristics and orchard management, including plant density and N fertilization. These variables can be used to develop yield prediction models, which are scarce in the horticulture sector. This study aimed to evaluate the effect of nitrogen fertilization, orchards and cultivars and to predict the yields of ‘Royal Gala’ and ‘Fuji Suprema’ apples cultivated in a subtropical climate under different soil N availabilities. During the four seasons, nitrogen fertilization was applied a rates of 0, 25, 50, 100 and 150 kg N ha−1 year−1 for ‘Royal Gala’ and ‘Fuji Suprema’ apples located in southern Brazil. Yield, average fruit weight and leaf and fruit pulp N concentration were evaluated. Yield prediction models were developed based on the following variables: concentration of N in leaves and fruits, air temperature, chilling units, relative humidity and rainfall. “Cultivar” was the variable responsible for the greatest variation of yield, followed by “years/season”, and then the “orchard management. The N rates applied in the four seasons did not predict crop yield. In the model, “orchard” was the greatest determinant for leaf N concentration, and “season” was the main determinant for fruit-pulp N concentration. Mathematical model (3), based on leaf and fruit pulp N concentration, and certain climatic variables (minimum air temperature, annual rainfall and chilling hours < 7.2 °C) had the greatest potential for predicting yield in orchards of ‘Royal Gala’ and ‘Fuji Suprema’.
1. Introduction
The responses of apple trees (Malus domestica Borkh) to nitrogen (N) fertilization depend on the interaction of factors such as soil, climate, cultivar, rootstock and cultivation practices. Soils with medium or high organic matter (OM) concentration, potentially have adequate native mineral N concentration, such as the nitrate (NO3−) and/or ammonium (NH4+) forms. However, part of soil mineral N can be lost from the soil–plant system through volatilization, leaching or denitrification [1,2,3,4]. The magnitude of losses depends on soil type and climatic variables. The apple cultivars with high yields can export large amounts of N in fruits [5,6,7,8]. The demand for N can vary among cultivars. The ‘Royal Gala’ and ‘Fuji Suprema’ apple trees have different vigor and yields [6] and, consequently, have different demands for N. Furthermore, cultivars and rootstocks may have different morphological variables of the root systems which can determine the amount of nutrients absorbed [9]. Also, cultivars and rootstocks may have different values of kinetic parameters (maximum absorption rate –Vmax, ion affinity with the carrier—Km, and minimum concentration required to start nutrient absorption by plants—Cmin) related to nutrient absorption, which determine the absorption efficiency [10]. Thus, the demand for N can be different for ‘Royal Gala’ and ‘Fuji Suprema’, justifying the need for carrying out medium- and long-term calibration experiments under the field conditions. Soil texture is also important since high clay concentration allows a greater physical protection of OM and, consequently, a lower rate of organic N mineralization [11,12]. Soils with a high clay concentration may also have a greater capacity to adsorb mineral N, as NH4+ [13], reducing the N losses and increasing the availability of N to fruit trees including apple trees [3,14].
Climatic variables such as air and soil temperature, chilling unit exposure, humidity, solar radiation and rainfall can also affect the nutritional status and crop yield of apple trees [15,16]. The vegetative and reproductive development (flowering and effective fruiting) of temperate plants is mainly favored by the accumulation of chilling units during winter. Thus, in years with favorable climatic conditions, greater demand of nutrients, including N, is expected to sustain growth, development and high yield [7,8,17].
The availability of nutrients and their impact on yield are also affected by rainfall and soil water content. Adequate soil moisture associated with high air temperature favors the mineralization rate of OM and, consequently, the availability of mineral N in the rhizosphere [18,19]. Excessive rainfall favors the loss of N by leaching [4], especially in light-textured soils, decreasing the plant N uptake and even negatively affecting the crop yield [8,14]. On the other hand, water deficit can reduce the availability of soluble soil nutrients and the ability of roots to access nutrients from the soil solution [20]. Frequent rainfall can also potentiate foliar and fruit fungal diseases, decreasing yield and/or fruit quality [21].
Thus, it is reasonable to associate climatic variables and nutrient concentration, such as N, in apple-yield prediction models. For the development of these models, robust machine-learning methods such as Cubist can be employed to fit regressions between the variables of interest (e.g., yield) in relation to the predictor variables. The Cubist is a nonparametric method based on the construction of regression trees [22]. However, models can show different performances in the accuracy of prediction, according to the number and type of predictor variables used in the calibration process [23,24]. Thus, our hypothesis was that calibrated models with the input of covariates related to N concentration in leaves and pulp, added to climatic variables, result in greater accuracy in apple-yield predictions. The aim of this study was to evaluate the effect of nitrogen fertilization, orchards and cultivars and to predict the yield of ‘Royal Gala’ and ‘Fuji Suprema’ cultivated in a subtropical climate under different soil N concentrations.
2. Materials and Methods
2.1. Location of Experimental Areas
The study was carried out in two commercial orchards (Orchard A and Orchard B) and four consecutive growth seasons, in the city of Fraiburgo, state of Santa Catarina (SC), southern Brazil. The regional climate is classified as humid subtropical (Cfb) [25], characterized by mild temperatures and rainfall with variation throughout the year. Climatic data during the experimental period are presented in Figure 1. The soil is classified as Typic Hapludalf [26] in both A and B orchards. The soil in the inter-row spacing was covered with spontaneous vegetation composed of Trifolium repens L., Lolium multiflorum L. and Paspalum notatum L.
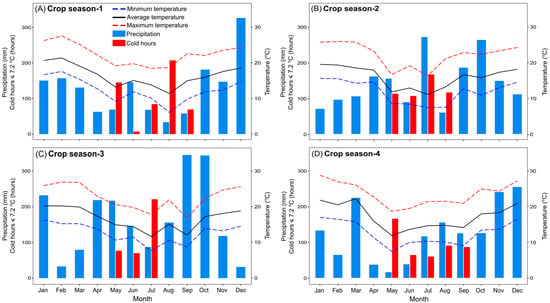
Figure 1.
Minimum, average and maximum temperatures (°C), number of chilling hours ≤7.2 °C, and monthly accumulated precipitation (mm) during the growing seasons 1 (A), 2 (B), 3 (C) and 4 (D).
2.2. Experiment Set-Up
Two experiments were arranged in 2002 in Orchard A (experiment 1) and Orchard B (experiment 2). Each orchard included two apple varieties, ‘Royal Gala’ and ‘Fuji Suprema’, both grafted onto M9 rootstock. Orchard A was established in 2000 with a planting density of 2857 plants ha−1 for both cultivars. In Orchard B, ‘Royal Gala’ was planted in 1997 with a density of 3570 plants ha−1 and ‘Fuji Suprema’ in 2000 with a density of 2500 plants ha−1. All the trees were trained as a central leader (tall spindle). These two cultivars (‘Royal Gala’ and ‘Fuji Suprema’) and high plant densities (between 2500 and 3500 plants ha−1) currently represent around 40 and 90%, respectively, of commercial orchards in southern Brazil.
To differentiate soil fertility, trees were fertilized in a randomized blocks design, with four replications, with the following N rates: 0, 25, 50, 100 and 150 kg N ha−1 year−1, with each replication consisting of 10 apple trees. The N source used was ammonium nitrate (33% N). Nitrogen was surface-applied, in the projection of the tree canopy and without incorporation, for four consecutive growth seasons (2003–2006). Half of the N was applied at bud swelling and the second half in post-harvest. Annually, 83 kg K ha−1 as KCl, (52% K) was also applied. The mode and place of KCl application were the same as that detailed for ammonium nitrate. No other nutrients were applied throughout the experimental period. Pest and disease control was managed according to the regional recommendation for the apple tree [27].
2.3. Sampling of Leaves and Fruits and Trunk-Diameter Measurement
In the second half of January of the four seasons (corresponding to July in the Northern Hemisphere), 50 fully expanded and healthy leaves per plot were collected [28] in the four quadrants of the plants, in the middle third of the current-year growing shoot. The leaves were dried in an oven with forced air at 65 °C, until constant mass. The leaves were then ground in a Wiley mill, sieved < 0.05 mm, and stored in a paper bag.
Each season, crop yield was recorded when the starch index of fruits reached between 4 and 6 (1–9 scale), corresponding to 140 ± 3 days after full bloom (DAFB). Twenty, mid-sized (130–150 g) fruits were sampled for mineral determination. Annual trunk diameter was also measured at harvest in all experimental trees, at 0.3 m above the graft union.
2.4. Leaf and Fruit Pulp Mineral Analyses
Macronutrient (N, P, K, Ca and Mg) leaf concentration was determined after sulfuric digestion, while micronutrient (Zn, Fe, Cu, Mn and B) concentration was determined after nitro-perchloric digestion [29]. Boron (B) concentration was determined by colorimetric method using the azomethine H reagent, after incineration in a muffle. Readings were performed in a UV-visible spectrophotometer (Bell Photonics, 1105, Brazil), at 420 nm [30]. Total N was determined in a micro-Kjeldhal system (Tecnal, TE-0363, Brazil), according to Epagri [31]. Phosphorus (P) concentration was determined in a UV-visible spectrophotometer (Bell Photonics, 1105, Brazil), at 882 nm [32]. On the other hand, K, Ca, Mg, Zn, Fe, Cu and Mn readings were taken in an atomic absorption spectrophotometer (PerkinElmer—Analyst 200).
A longitudinal wedge of each fruit (approximately 1cm thick in the peel) was taken for mineral analysis of the pulp. Carpel tissues were removed from the wedge. Subsequently, N, P, Ca and Mg concentrations were determined in the fruit pulp based on the same methodology as that used for leaf concentration. N/Ca, K/Ca and K+ Mg/Ca ratios were estimated after determination of nutrient concentration in the pulp. To estimate the exported N in apple fruits, the following equation was used: N (t ha−1) = (concentration of N in the fruit (g kg−1) × productivity of apple trees (t ha−1))/1000.
2.5. Climate Variables
Meteorological data for the period under evaluation were obtained from the meteorological station of the Agricultural Research and Rural Extension Company of Santa Catarina [33], located in the city of Fraiburgo (SC). The fllowing characteristics were compiled for each evaluated season: minimum, average and maximum air temperature (°C), annual rainfall (mm), relative air humidity (%), chilling hours (below 7.2 °C) and chilling units as the number of hours accumulated, according to the modified North Carolina model [34] in the winter period, from June to September.
2.6. Statistical Analysis
The results of yield and N concentration in leaves and pulp were submitted to a regression tree (conditional inference method) to highlight the factors (year, cultivar and orchard) that influence differences between these variables. Subsequently, the response variables (productivity and N concentration in leaves and pulp) were subjected to analysis of variance (ANOVA) considering the factors ‘year’, ‘cultivar’, ‘orchard’ and ‘applied N doses’ as well as the interaction between these factors (fixed effects) and the effects of nested blocks in seasons (random effect). The normality of the residues was tested using the Shapiro–Wilk test to verify if any transformation would be necessary. Whenever the null hypothesis (equal means) was rejected (alpha ≥ 0.05), the means were compared by
Tukey’s honest significant difference (HSD) test (p < 0.05) in R [35]. This statistical procedure was performed using the VCA package of the R statistical environment [35]. Subsequently, the reported variables along with climatic data were subjected to principal component analysis (PCA) to explore variance and verify similarity or dissimilarity between seasons, cultivars and orchards. The contribution of each variable in explaining the variance of the principal component (PC) data was also quantified. The PCA was performed using the FactoMineR and factoextra packages from the R statistical environment [35].
Finally, six apple-yield prediction models were developed. The models, including predictor variables, were generated in order to answer our hypothesis: Model 1—concentration of N in leaves; Model 2—N concentration in fruit pulp; Model 3—climatic variables; Model 4—N concentration in leaves + climatic variables; Model 5—N concentration in the pulp + climatic variables and Model 6—concentration of N in the leaf + N in fruit pulp + climatic variables. The climatic variables included in the model were: minimum, average and maximum air temperature, annual rainfall, relative air humidity, chilling hours and chilling units. The models were developed using the Cubist machine-learning nonparametric analysis method (caret package by R [36]), a nonparametric method based on the construction of regression trees [22]. First, a tree was built by the definition of rules, which splits the data into reasonably homogeneous groups for the variable of interest (productivity) in relation to the predictor variables. The models were calibrated and validated through 10-fold cross-validation using random division. The performance of predictions was evaluated using coefficient of determination (R2) (Equation (1)), bias (Equation (2)) and mean square root of the prediction error (RMSE) (Equation (3)):
where ŷ = predicted value, ȳ = mean value observed, y = observed values, and N = number of samples with i = 1, 2,…, n.
To assess the importance of each explanatory variable in the models, the variable importance (VARIMP) metric was calculated, which shows the importance of the variables in the modeling. VARIMP was implemented using the caret package in the R software [36].
3. Results
3.1. Fruit Yield and Yield Components
The variation of monthly average air temperature was similar in the four seasons (Figure 1). The distribution of rainfall throughout the season varied among the years. It was highest in December in year 1, in June and October in year 2, in September and October in year 3, and in March, November and December in year 4. The lowest amount of rainfall was observed in the months of April, May, June, August and September in season 1, February and December in season 3, and February, April, May and June in season 4. Total amount of rainfall was maximum in year 3 (2012 mm) and minimum in year 4 (1511 mm). Maximum temperatures in December and January in the 4th year were higher than in the 2nd year. The number of hours with a temperature below or equal to 7.2 °C was minimal in growing season 3.
The result of the conditional inference tree analysis is shown in Figure 2. This analysis uses a regression approach, in which, through a binary recursive data partitioning algorithm, it identifies the variables with the greatest influence on the response variables. “Cultivar” was the variable with the greatest contribution in explaining the variation in apple yield in the period evaluated, followed by “crop season” and “orchard” (Figure 2A). On the other hand, the variable “orchard” had the greatest contribution to explaining the variation in the concentration of N in leaves, followed by “cultivar” and “crop season” (Figure 2B). The “crop season” contributed the most to explaining the variation of N concentration in the fruits, followed by “cultivar” and “orchard” (Figure 2C). The ANOVA components confirmed that the triple interaction between the variable “cultivar” ∗ “crop season” ∗ “orchard” had a high contribution to the variance of apple yield, N concentration in leaves and fruits (Figure 3).
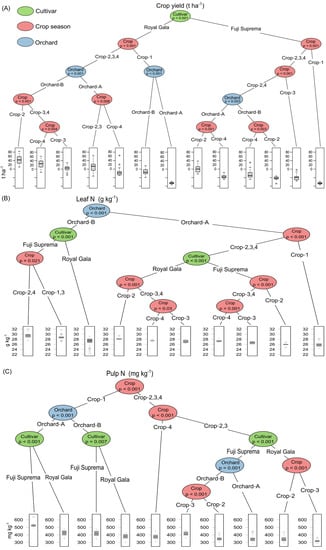
Figure 2.
Conditional inference tree showing the effect of the variables “cultivar”, “crop season” and “orchard” on apple yield (A), concentration of N in leaves (B) and N in fruit pulp (C).
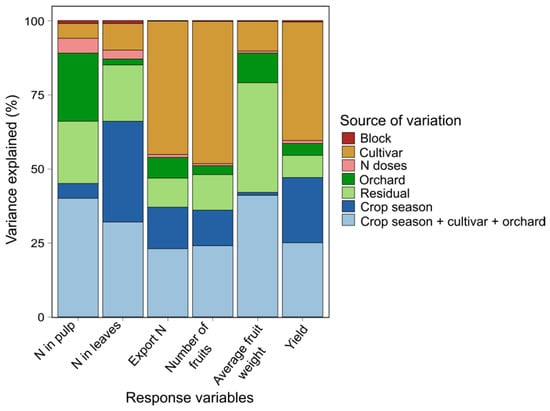
Figure 3.
Proportion of variance of each variable explained by each source of variation. The colors represent the source of variation (N doses, crop season, cultivar, orchard, block, residual and the interaction: crop season ∗ cultivar ∗ orchard).
Principal component analysis (multivariate) was used to identify similarity/dissimilarity between the factors “cultivar”, “orchard” and “crop season”, in addition to the relationship between the nutritional variables of plant and climate. Principal components 1 and 2 (PC1 and PC2) explained approximately 55% of the data variance. The analysis showed substantial differences between growing seasons (Figure 4A), small differences between cultivars (Figure 4B), and small differences among orchards (Figure 4C). Among the variables to explain the variation of productivity are climate, including air temperature (minimum, average and maximum), chilling units, rainfall and relative humidity (Figure 4A).
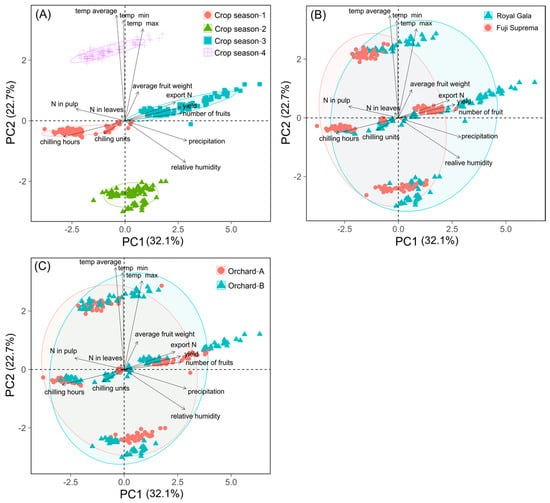
Figure 4.
Relationship between the principal component 1 (PC1) and the principal component 2 (PC2) for yield and N concentrations in leaves and fruit pulp, in relation with crop season (A), apple cultivar (B) and orchard type (C).
3.2. Yield and N Concentration in the Leaves and Fruits Response
Yield was not affected by N application rate; however it was higher in years 2, 3 and 4 compared with year 1 (Figure 5A). Yield was higher in ‘Royal Gala’ than ‘Fuji Supreme’ (Figure 5B), despite the lack of response to N rate, and significantly lower in Orchard A compared with Orchard B for the mean effect of years and cultivars (Figure 5C).
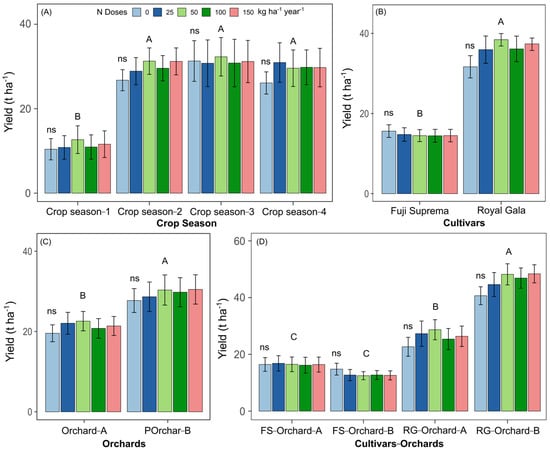
Figure 5.
Yield of apple trees subjected to different N rates and its relationship to the “crop season” (A), “cultivar” (B), “orchard” (C) and the “cultivar ∗ orchard” interaction (D). Uppercase letters compare the effects of N application rate for each factor (crop season, cultivar, orchard and cultivar—orchard) using Tukey’s test. Differences were considered significant when p value < 0.05; ns: non-significant at p ≥ 0.05.
Leaf N concentration did not differ significantly in relation to the N rates applied considering the factors of the “crop season” and “orchard” (Figure 6A,C). In the same way, the other macronutrients (P, K, Ca and Mg) and the micronutrients (Fe, Mn, Zn and B) were also not affected by treatments (Table S2). Nitrogen concentration in ‘Royal Gala’ leaves was lower after the application of 25 and 50 kg N ha−1 (Figure 6B). Leaf N concentration did not differ significantly in relation to the N rates applied for the cultivar ‘Fuji Suprema’ (Figure 6B). Nitrogen concentration in ‘Royal Gala’ leaves was higher compared to ‘Fuji Suprema’ leaves (Figure 6B). In the orchard—cultivar interaction, the highest concentration of foliar N was observed in Orchard B in ‘Fuji Suprema’ in the treatments with N application compared to the control (Figure 6D). No significant difference was observed in the foliar N concentration in relation to the N rates in FS-Orchard-A (Figure 6D).
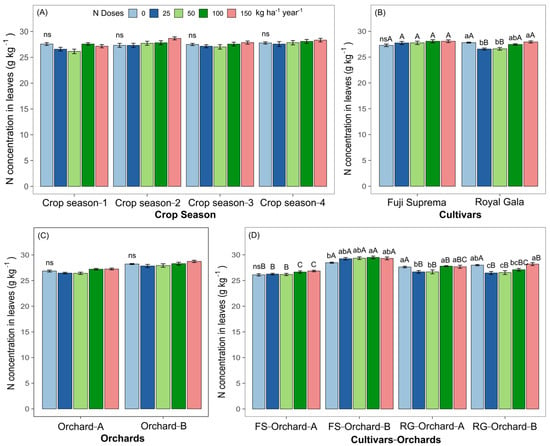
Figure 6.
N concentration in apple leaves subjected to different N rates and their relationship with the factors “crop season” (A), “cultivar” (B), “orchard” (C), and the “cultivar * orchard” interaction (D). Lowercase letters compare the means of N doses within the same factor (crop season, cultivar, orchard and cultivar—orchard) and uppercase letters between factors using Tukey’s test. Differences were considered significant when p value < 0.05; ns: non-significant at p ≥ 0.05.
In year 2, only the addition of 100 and 150 kg N ha−1 increased the fruit N concentration compared to the other crop seasons (Figure 7A). No significant effects of N rates were observed in the cultivar, orchard or cultivar—orchard (Figure 7B–D, respectively).
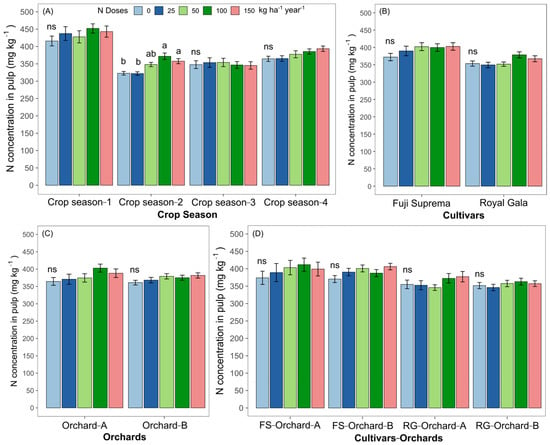
Figure 7.
N concentrations in apple fruits (pulp) of two apple cultivars (A–D), grown in two orchards for different seasons and subjected to different N rates. Lowercase letters compare the means of N doses within the same factor (crop season, cultivar, orchard and cultivar—orchard) by Tukey’s test. Differences were considered significant when p value < 0.05; ns: non-significant at p ≥ 0.05.
3.3. Apple-Yield Prediction Models
Six apple-yield prediction models were generated using the variables “N concentration in leaves and fruits” and “climatic characteristics”. The model with the highest accuracy (R2 = 0.98, p < 0.001) was the one based on all variables, while the model with the lowest accuracy (R2 = 0.30, p < 0.001) was the one based only on the climatic variables (Table 1). The most important climatic variables were minimum air temperature, chilling hours < 7.2 °C, and annual rainfall which supported the best models (Table 2). The concentration of N in the leaves had the greatest accuracy, even greater than the concentration of N in fruits, following the same pattern of response in combination with climatic variables (Table 1).

Table 1.
Accuracy of apple-yield prediction models for ‘Fuji Suprema’ and ‘Royal Gala’ in two locations and for four crop seasons.

Table 2.
Relative importance of predictor variables included in the calibration of yield prediction models of ‘Fuji Suprema’ and ‘Royal Gala’ apple trees subjected to nitrogen fertilization.
4. Discussion
The “cultivar” factor showed a greater effect on yield than the “crop season” and “orchard” characteristics (Figure 2A). Late cultivars (e.g., ‘Fuji’, ‘Pink Lady’, ‘Granny Smith’) accumulate less minerals and carbohydrates in the buds and phloem of branches than early cultivars (e.g., ‘Royal Gala’), which can be explained by the shorter period between fruit harvest and leaf senescence [37]. Furthermore, in our study, the effect of “cultivar” on yield may be partly explained the lower plant density of 2500 plants ha−1 of ‘Fuji Suprema’, and because evaluations started two years after the establishment of the orchard. Meanwhile, in one of the ‘Royal Gala’ orchards, the plant density was 3570 plants ha−1 and evaluations started five years after installation. The higher productivity with densification of apple plants is evidenced in other studies [37,38,39,40]. Tree density can cause lower plant vigor, productivity, and lower number and size of fruits per plant even though, in the present study, the trunk diameter of both cultivars and orchards had no difference and was approximately 16 cm (see Table S3).
The interaction of the variables crop season + cultivar + orchard had a greater contribution in explaining the variance in the N concentration in the pulp (Figure 3); however, crop season explained more than other variables the increase of N concentration in the fruit pulp (Figure 2 and Figure 7). This can be partly attributed to climatic variations such as the accumulation of chilling units, which affect bud sprouting and the tree crop load [41,42,43]. Low crop load favors fruit growth causing lower concentration of minerals, including N, because of the dilution effect [6]. Furthermore, climatic conditions that favor the vegetative growth (vigor) can reduce the N concentration in fruit by competition [7,8,17].
The multivariate analysis clearly showed that there was variation between seasons, which is explained by the variation of climatic variables (Figure 4A). These variations influenced the production and concentration of N in the leaves and pulp of the apple tree. There was an inverse relationship between the accumulation of chilling units and productivity and a positive one with N concentration in the leaves and pulp of the apple tree, although temperature directly affects plant growth and development, and particularly the bud development and fruit set due to its effects on the rate and speed of physiological processes (e.g., respiration and cell division). For example, low temperatures in winter favor the development and overcoming of dormancy of flower buds, and productivity, while low temperatures in spring reduce cell division and fruit size [44] and high temperatures associated with high humidity in spring and summer can negatively affect yield by favoring the development of plant diseases [21]. High night temperatures in autumn and winter disfavor the accumulation of carbohydrate reserves and the development of flower buds and young fruits [17]. On the other hand, soil temperature affect differently the availability of N in the soil, and soil temperatures above 25 °C influence the growth and renewal of the root system and increase nutrients uptake. In periods of low soil water availability and transpiration rate, the development of the root system is low, affecting the translocation of nutrients from roots to shoots and from storage organs to fruits [9]. Furthermore, air temperature and relative humidity affect the rate of transpiration and the translocation of minerals to leaves [45].
In the present study, the lack of responses of apple trees to N application rate in increasing productivity can be explained by the high concentration of soil organic matter greater than 40 g kg−1 (see Table S1), providing a sufficient amount of native soil N (NO3− and NH4+) to apple trees [46], with the productive capacity being limited by the climatic conditions of this region. Furthermore, possible N losses due to high rainfall (>1700 mm in seasons 2 and 3) may also explain an eventual low N utilization and the lack of response in plant production. We also highlight that the export of N by the apple tree was low, i.e., 0.75 kg of N per ton of harvested fruit, considering a concentration of 5 g kg DW−1 N in the fruit. The maximum yield obtained by ‘Royal Gala’ in Orchard B in season 2 was about 40 t ha−1 and an export of only 30 kg N ha−1 was observed, although the extraction varied from 60 to 75 kg N ha−1 yr−1, less than studies that show that half of the N absorbed by the roots is translocated to the fruits [47].
The lowest N concentration in leaves was observed at 25 and 50 kg N ha−1 for ‘Royal Gala’ (see Figure 6B), probably due to the greater availability of mineral N derived from internal reserves, associated with the physiological efficiency of N use by the plant [48]. The highest concentrations of N in the apple pulp were found in trees subjected to doses of 100 and 150 kg N ha−1, in season 2. Despite the increase of N concentration in these fruit pulps, the values were below the adequate range (<500 mg kg−1) in order to avoid the incidence of physiological disturbances in fruits [49].
Model 6, including the climatic variables (minimum, average and maximum air temperature, annual rainfall, relative air humidity, chilling hours and chilling unit exposure) and N concentration in leaves and fruit pulp had the best performance in predicting crop yield. This is quite useful in predicting apple productivity as a function of climate conditions, in particular the subtropical climate, where modelling is scarce [23,24]. Yield prediction models can also be useful in considering climate change scenarios, which are already occurring in southern Brazil [50,51] and can affect the nutritional status and productivity of apple trees [15,16]. A poor performance was observed with model 3 calibrated only with climatic variables. Based on these results, it is worth noting that if climate change is intensified, the climatic variables between seasons will be different, which may impact yield [16]. We highlight that the simpler model 1with only the leaf N concentration performed well in predicting apple yield. This is desirable, because leaf sampling is normally carried out on apple trees annually, in the southern region of Brazil between January and February (about 105 to 135 days after full flowering, which corresponds to the final stage of fruit growth), to contribute to the estimation of the nutritional status of the plants. In addition, predicting yield through the concentration of N will facilitate planning for harvesting, storing fruits and even defining better marketing strategies. On the other hand, model 2, with only the concentration of N in the pulp, showed an intermediate performance compared to the above two models, showing that the use of this variable alone is not an adequate strategy for predicting productivity. However, the use of the variable N in the pulp, together with the climatic variables, allows us to obtain a more accurate model (model 5) for predicting productivity.
In this scenario, we highlight the importance of increasing N in the form of organic fertilization, which is possible with the implementation of agroecological production systems. Added to this, there is a strong effect of climatic variables on apple productivity, as already discussed, as well as the effect on N availability and translocation in the plant. This must be considered in climate change scenarios, in which simulation models of future scenarios can contribute to explaining the effect of climate variables on N utilization by the plant and, consequently, on apple tree productivity.
5. Conclusions
“Cultivar” was the variable with the greatest contribution in explaining the variation in apple yield, followed by “season” and “orchard”. The orchard management was the factor contributing mostly to leaf N concentration probably by plant density and the growth season affecting the fruit pulp N concentration most.
Model (6), that considered the N in leaves and pulps and the climatic variables, showed the greatest potential for predicting productivity in orchards with ‘Royal Gala’ and ‘Fuji Suprema’ in southern Brazil. The simpler model 1 for leaf N concentration was also important in predicting plant productivity.
Supplementary Materials
The following supporting information can be downloaded at: https://www.mdpi.com/article/10.3390/agronomy13020514/s1, Table S1: Chemical attributes in the 0–0.20 and 0.20–0.40 m layers in the soils in orchard A and orchard B, before the installation of the experiments; Table S2: Nutrient concentration in leaves and pulp of ‘Fuji Suprema’ and ‘Royal Gala’ apple trees cultivated in two orchards and subjected to nitrogen fertilization for four years; Table S3: Trunk circumference of ‘Fuji Suprema’ and ‘Royal Gala’ apple trees cultivated in two orchards and submitted to nitrogen fertilization for four seasons.
Author Contributions
Conceptualization, G.B., J.M.M.-B. and L.H.; methodology, J.M.M.-B., L.C.A. and C.B.; software, J.M.M.-B.; validation, J.M.M.-B.; formal analysis, L.H., C.B., L.C.A. and M.R.; investigation, L.H., C.B. and M.R.; resources, G.B. and L.H.; data curation, L.H., C.B., L.C.A. and J.M.M.-B.; writing—original draft preparation, G.B., L.H., J.M.M.-B.; writing—review and editing, G.B., J.M.M.-B., M.T., C.C. and I.S.H.; supervision, G.B. and L.H.; project administration, L.H. and C.B.; funding acquisition, C.B. and L.H. All authors have read and agreed to the published version of the manuscript.
Funding
This work was supported by the Associação Brasileira de Produtores de Maçã—ABPM (Brazilian Association of Apple Producers).
Data Availability Statement
The data presented in this study are available on request from the corresponding author. The data are not publicly available due to privacy.
Acknowledgments
We thank all staff and students responsible for the maintenance and data collection from this field trial. This study was supported in part by the Coordenação de Aperfeiçoamento de Pessoal de Nível Superior—Brazil (CAPES) and the National Council for Scientific and Technological Development (CNPq) by the Research Productivity Grant offered to Professor Gustavo Brunetto. We also would like to thank the Foundation for Support of Research and Innovation, Santa Catarina—Brazil (FAPESC—process 2021TR001138) and Rio Grande do Sul—Brazil (FAPERGS—process 21/2551-0001920-4), for financial support.
Conflicts of Interest
The authors declare no conflict of interest.
References
- Van Cleemput, O. Subsoils: Chemo-and biological denitrification, N2O and N2 emissions. Nutr. Cycl. Agroecosyst. 1998, 52, 187–194. [Google Scholar] [CrossRef]
- Carranca, C. Principais Processos do Ciclo do Azoto numa Agricultura Sustentável. Avaliação Através do Marcador 15N; INIA/Fundo Social Europeu de Orientação e Garantia Agrícola, EAN: Oeiras, Portugal, 2000; p. 118. [Google Scholar]
- Behera, S.N.; Sharma, M.; Aneja, V.P.; Balasubramanian, R. Ammonia in the atmosphere: A review on emission sources, atmospheric chemistry and deposition on terrestrial bodies. Environ. Sci. Pollut. Res. 2013, 20, 8092–8131. [Google Scholar] [CrossRef]
- Wang, Y.; Ying, H.; Yin, Y.; Zheng, H.; Cui, Z. Estimating soil nitrate leaching of nitrogen fertilizer from global meta-analysis. Sci. Total Environ. 2019, 657, 96–102. [Google Scholar] [CrossRef]
- Drake, S.R.; Raese, J.T.; Smith, T.J. Time of nitrogen application and its influence on ‘golden delicious’ apple yield and fruit quality. J. Plant Nutr. 2002, 25, 143–157. [Google Scholar] [CrossRef]
- Nava, G.; Dechen, A.R. Long-term annual fertilization with nitrogen and potassium affect yield and mineral composition of ‘fuji’ apple. Sci. Agric. 2009, 66, 377–385. [Google Scholar] [CrossRef]
- Carranca, C.; Brunetto, G.; Tagliavini, M. Nitrogen nutrition of fruit trees to reconcile productivity and environmental concerns. Plants 2018, 7, 4. [Google Scholar] [CrossRef] [PubMed]
- Kalcsits, L.; Lotze, E.; Tagliavini, M.; Hannam, K.D.; Mimmo, T.; Neilsen, D.; Neilsen, G.; Atkinson, D.; Biasuz, E.C.; Borruso, L.; et al. Recent achievements and new research opportunities for optimizing macronutrient availability, acquisition, and distribution for perennial fruit crops. Agronomy 2020, 10, 1738. [Google Scholar] [CrossRef]
- Hu, Y.; Burucs, Z.; Von Tucher, S.; Schmidhalter, U. Short-term effects of drought and salinity on mineral nutrient distribution along growing leaves of maize seedlings. Environ. Exp. Bot. 2007, 60, 268–275. [Google Scholar] [CrossRef]
- Paula, B.V.D.; Rozane, D.E.; Melo, G.W.B.D.; Natale, W.; Marques, A.C.R.; Brunetto, G. Kinetic parameters estimation for increasing the efficiency of nutrient absorption in fruit trees. Rev. Bras. Frutic. 2021, 43, e-743. [Google Scholar] [CrossRef]
- Hassink, J.; Bouwman, L.A.; Zwart, K.B.; Bloem, J.; Brussaard, L. Relationships between soil texture, physical protection of organic matter, soil biota, and c and n mineralization in grassland soils. Geoderma 1993, 57, 105–128. [Google Scholar] [CrossRef]
- Singh, M.; Sarkar, B.; Sarkar, S.; Churchman, J.; Bolan, N.; Mandal, S.; Menon, M.; Purakayastha, T.J.; Beerling, D.J. Stabilization of soil organic carbon as influenced by clay mineralogy. Adv. Agron. 2018, 148, 33–84. [Google Scholar] [CrossRef]
- Alshameri, A.; He, H.; Zhu, J.; Xi, Y.; Zhu, R.; Ma, L.; Tao, Q. Adsorption of ammonium by different natural clay minerals: Characterization, kinetics and adsorption isotherms. Appl. Clay Sci. 2018, 159, 83–93. [Google Scholar] [CrossRef]
- Neilsen, D.; Neilsen, G.H.; Gregory, D.; Forge, T.; Zebarth, B. Drainage losses of water, N and P from micro-irrigation systems in a young high-density apple planting. Acta Hortic. 2008, 792, 483–490. [Google Scholar] [CrossRef]
- Sugiura, T.; Ogawa, H.; Fukuda, N.; Moriguchi, T. Changes in the taste and textural attributes of apples in response to climate change. Sci. Rep. 2013, 3, 113. [Google Scholar] [CrossRef] [PubMed]
- Zhang, Q.; Zhou, B.; Li, M.; Wei, Q.; Han, Z. Multivariate analysis between meteorological factor and fruit quality. J. Integr. Agric. 2018, 17, 1338–1347. [Google Scholar] [CrossRef]
- Lawrence, B.T.; Melgar, J.C. Variable fall climate influences nutrient resorption and reserve storage in young peach trees. Front. Plant Sci. 2018, 9, 1819. [Google Scholar] [CrossRef]
- Guntiñas, M.E.; Leirós, M.C.; Trasar-Cepeda, C.; Gil-Sotres, F. Effects of moisture and temperature on net soil nitrogen mineralization: A laboratory study. Eur. J. Soil Biol. 2012, 48, 73–80. [Google Scholar] [CrossRef]
- Benbi, D.K.; Boparai, A.K.; Brar, K. Decomposition of particulate organic matter is more sensitive to temperature than the mineral associated organic matter. Soil Biol. Biochem. 2014, 70, 183–192. [Google Scholar] [CrossRef]
- Oyewole, O.A.; Inselsbacher, E.; Nasholm, T. Direct estimation of mass flow and diffusion of nitrogen compounds in solution and soil. New Phytol. 2014, 201, 1056–1064. [Google Scholar] [CrossRef]
- Hamada, N.A.; Moreira, R.R.; Nesi, C.N.; De Mio, L.L.M. Pathogen dispersal and Glomerella leaf spot progress within apple canopy in Brazil. Plant Dis. 2019, 103, 3209–3217. [Google Scholar] [CrossRef]
- Quinlan, J. Learning with Continuous Classes. In Proceedings AI’92, 5th Australian Conference on Artificial Intelligence; Adams, A., Sterling, L., Eds.; World Scientific: Singapore, 1992; pp. 343–348. [Google Scholar]
- Aggelopoulou, A.D.; Bochtis, D.; Fountas, S.; Swain, K.C.; Gemtos, T.A.; Nanos, G.D. Yield prediction in apple orchards based on image processing. Precis. Agric. 2011, 12, 448–456. [Google Scholar] [CrossRef]
- Bai, X.; Li, Z.; Li, W.; Zhao, Y.; Li, M.; Chen, H.; Zhu, X. Comparison of Machine-Learning and CASA Models for Predicting Apple Fruit Yields from Time-Series Planet Imageries. Remote Sens. 2021, 13, 3073. [Google Scholar] [CrossRef]
- Alvares, C.A.; Stape, J.L.; Sentelhas, P.C.; Gonçalves, J.L.M.; Sparovek, G. Köppen’s climate classification map for Brazil. Meteorol. Z. 2013, 22, 711–728. [Google Scholar] [CrossRef]
- Soil Survey Staff. Keys to Soil Taxonomy, 12th ed.; USDA-NRCS: Washington, DC, USA, 2014. [Google Scholar]
- Epagri-Empresa de Pesquisa Agropecuária e Extensão Rural de Santa Catarina. A Cultura da Macieira; Epagri-Empresa de Pesquisa Agropecuária e Extensão Rural de Santa Catarina: Florianópolis, SC, Brazil, 2022. [Google Scholar]
- CQFS-RS/SC-Comissão de Química e Fertilidade do Solo-RS/SC. Manual de Adubação Para os Estados do Rio Grande do Sul e de Santa Catarina; Sociedade Brasileira de Ciência do Solo: Porto Alegre, RS, Brazil, 2016. [Google Scholar]
- Embrapa-Empresa Brasileira de Pesquisa Agropecuária. Manual de Análises Químicas de Solos, Plantas e Fertilizantes, 2nd ed.; Rev. Ampl. Embrapa: Brasília, Brazil, 2009. [Google Scholar]
- Bataglia, O.C.; Furlani, A.M.C.; Teixeira, J.P.F.; Furlani, P.R.; Galo, J.R. Métodos de Análise Química de Plantas; Instituto Agronômico: Campinas, SP, Brazil, 1983. [Google Scholar]
- Tedesco, M.J. Análise de Solo, Plantas e Outros Materiais, 2nd ed.; Universidade Federal do Rio Grande do Sul: Porto Alegre, RS, Brazil, 1995. [Google Scholar]
- Murphy, J.; Riley, J.P. A modified single solution methods for the determination of phosphate in natural waters. Anal. Chim. Acta 1962, 27, 31–36. [Google Scholar] [CrossRef]
- Epagri-Empresa de Pesquisa Agropecuária e Extensão Rural de Santa Catarina. Banco de Dados de Variáveis Ambientais de Santa Catarina; Documentes 310; Epagri-Empresa de Pesquisa Agropecuária e Extensão Rural de Santa Catarina: Florianópolis, SC, Brazil, 2020. [Google Scholar]
- Ebert, A.; Petri, J.L.; Bender, R.J.; Braga, H.J. First experiences with chill-unit models in Southern Brazil. Acta Hortic. 1986, 184, 79–86. [Google Scholar] [CrossRef]
- R Core Team. R: A Language and Environment for Statistical Computing; R Foundation for Statistical Computing: Vienna, Austria, 2022; Available online: https://www.R-project.org/ (accessed on 5 June 2022).
- Kuhn, M. Caret: Classification and Regression Training. R package version 6.0-73; Astrophysics Source Code Library, p. ascl: 1505.003. 2015. Available online: https://CRAN.R-project.org/package=caret (accessed on 5 June 2022).
- Tartachnyk, I.I.; Blanke, M.M. Effect of delayed fruit harvest on photosynthesis, transpiration and nutrient remobilization of apple leaves. New Phytol. 2004, 164, 441–450. [Google Scholar] [CrossRef]
- Pereira, A.J.; Pasa, M.S. Desempenho produtivo de macieiras ‘Royal Gala’ e ‘Fuji’ submetidas a diferentes densidades de plantio e porta-enxertos. Pesq. Agropec. Bras. 2016, 51, 348–356. [Google Scholar] [CrossRef]
- Reig, G.; Lordan, J.; Sazoc, M.M.; Hoying, S.; Fargione, M.; Reginato, G.; Donahue, D.J.; Francescatto, P.; Faziob, G.; Robinson, T. Long-term performance of ‘Gala’, Fuji’ and ‘Honeycrisp’ apple trees grafted on Geneva rootstocks and trained to four production systems under New York State climatic conditions. Sci. Hortic. 2019, 244, 277–293. [Google Scholar] [CrossRef]
- Toselli, M.; Zavalloni, C.; Marangoni, B.; Flore, J.A. Nitrogen partitioning in apple trees as affected by application time. HortTechnology 2000, 10, 136–141. [Google Scholar] [CrossRef]
- Zanotelli, D.; Rechenmacher, M.; Guerra, W.; Cassar, A.; Tagliavini, M. Seasonal uptake rate dynamics and partitioning of mineral nutrients by bourse shoots of field-grown apple trees. Eur. J. Hortic. Sci. 2014, 4, 203–211. [Google Scholar]
- Hawerroth, F.J.; Herter, F.G.; Petri, J.L.; Marafon, A.C.; Leonetti, J.F. Evaluation of winter temperatures on apple budbreak using grafted twigs. Rev. Bras. Frut. 2013, 35, 713–721. [Google Scholar] [CrossRef]
- Pertille, R.H.; Citadin, I.; Patto, L.S.; Oldoni, T.L.C.; Scariotto, S.; Grigolo, C.R.; Lauri, P.-É. High-chilling requirement apple cultivar has more accentuated acrotony than low-chilling one in mild winter region. Trees 2021, 35, 1135–1150. [Google Scholar] [CrossRef]
- Palmer, J.W.; Privé, J.P.; Tustin, D.S. Temperature. In Apples: Botany, Production and Uses; Ferree, D.C., Warrington, I.J., Eds.; CABI Publishing: Wallingford, UK, 2003; pp. 217–236. [Google Scholar]
- Taiz, L.; Zeiger, E.; Møller, I.M.; Murphy, A. Fundamentals of Plant Physiology; Sinauer Associates, Oxford University Press: Sunderland, MA, USA, 2018. [Google Scholar]
- Neilsen, G.; Forge, T.; Angers, D.; Neilsen, D.; Hogue, E. Suitable orchard floor management strategies in organic apple orchards that augment soil organic matter and maintain tree performance. Plant Soil 2014, 378, 325–335. [Google Scholar] [CrossRef]
- Tagliavini, M.; Scandellari, F. Methodologies and concepts in the study of nutrient uptake requirements and partitioning in fruit trees. Acta Hortic. 2013, 984, 47–56. [Google Scholar] [CrossRef]
- Carranca, C. Nitrogen Use Efficiency by Annual and Perennial Crops. In Farming for Food and Water Security. Series: Sustainable Agriculture Reviews; Lichtfouse, E., Ed.; Springer Science+Business Media Dordrecht: Berlin, Germany, 2012; Volume 10, pp. 57–82. [Google Scholar] [CrossRef]
- Grab, S.; Craparo, A. Advance of apple and pear tree full bloom dates in response to climate change in the southwestern Cape, South Africa: 1973–2009. Agric. For. Meteorol. 2011, 151, 406–413. [Google Scholar] [CrossRef]
- Back, A.J.; Gonçalves, F.N.; Fan, F.M. Spatial, seasonal, and temporal variations in rainfall aggressiveness in the south of Brazil. Eng. Agric. 2019, 39, 466–475. [Google Scholar] [CrossRef]
- Denski, A.P.N.; Back, A.J. Tendência climatológica nos elementos meteorológicos e na evapotranspiração de referência de Urussanga-SC. Rev. Bras. Clim. 2015, 17, 262–274. [Google Scholar] [CrossRef]
Disclaimer/Publisher’s Note: The statements, opinions and data contained in all publications are solely those of the individual author(s) and contributor(s) and not of MDPI and/or the editor(s). MDPI and/or the editor(s) disclaim responsibility for any injury to people or property resulting from any ideas, methods, instructions or products referred to in the content. |
© 2023 by the authors. Licensee MDPI, Basel, Switzerland. This article is an open access article distributed under the terms and conditions of the Creative Commons Attribution (CC BY) license (https://creativecommons.org/licenses/by/4.0/).