Article

Apple–Soybean Mixed Stand Increased Fine Root Distribution and Soil Water Content with Reduced Soil Nitrate Nitrogen

1
College of Agriculture, Shihezi University, Shihezi 832003, China
2
College of Horticulture and Forestry Sciences, Huazhong Agricultural University, Wuhan 430070, China
3
College of Pharmacy, Shihezi University, Shihezi 832003, China
*
Authors to whom correspondence should be addressed.
Agronomy 2023, 13(2), 548; https://doi.org/10.3390/agronomy13020548
Submission received: 11 January 2023 / Revised: 7 February 2023 / Accepted: 10 February 2023 / Published: 14 February 2023

Abstract

:
In dryland agroecosystems, intercropping fruit trees with legumes is often an important option for maintaining and improving soil N quality and fertility. The relationships of fine root length density (FRLD), soil water content (SWC), and soil NO3-N content (SNC) in agroforestry systems is essential for optimal orchard management. Our objective was to understand the temporal and spatial dynamics of FRLD, SWC, and SNC in an apple–soybean intercropping system and competition between species for ecological niches. We established an orchard with soybean and apple, including monoculture apple (MA), monoculture soybean (MS), and apple–soybean intercrop (AS) treatments. We collected data on the distribution of FRLD, SWC, SNC, and productivity under the MA, AS, and MS from 2020 to 2021. This study showed that AS had more FRLD compared to MA, and intercropping apple (IA) FRLD increased at 20–60 cm soil depth at 50 and 100 cm from the tree and decreased at 0–40 cm soil depth at 150 and 200 cm from the tree. Intercropping increased the SWC of the system and decreased the SNC, and the effect of intercropping was concentrated in the soybean cover area. The competition between apple and soybean reached its maximum at soybean seed filling stage, with competition occurring mainly at 100 cm from the tree and at 0–20 cm soil depth. Intercropping affected soybean growth and also reduced soybean yield with a land equivalent ratio = 1.45. By understanding the dynamics of subsoil resources in the apple–soybean intercropping system and interspecific competition, we can provide a theoretical basis for exploring the potential of sustainable intensification of agroforestry systems.

1. Introduction

The large–scale monocultures of crops are important in agricultural production. However, this agricultural practice has led to many environmental problems, such as soil erosion and degradation, chemical contamination, and biodiversity loss [1]. Modern orchards usually adopt cultivation and management practices to reduce the competition for water and nutrients by eradicating weeds [2]. Soil is susceptible to erosion and the loss of soil moisture and nutrients, thereby reducing soil quality and productivity [3,4]. Therefore, it is necessary to design a soil management system that supports the sustainable development of orchards, such as mixed cropping. Agroforestry, or the combination of crops and woody components in the same field, can achieve both good productivity and sustainable land use [5]. Agroforestry systems are a very popular agricultural practice worldwide, including in China, France, America, Iran, and Canada [6,7,8,9,10].
Agroforestry not only improves land use efficiency [11] and nutrient use efficiency [12], but also enhances crop yields and profits [13,14]. There are two interaction interfaces in agroforestry systems: the above-ground interface, where species compete for light and heat, and the below-ground interface, where interspecific roots compete for soil, water, and nutrients [15,16]. However, competition between species is unavoidable in agroforestry systems, and the degree of competition is influenced by factors such as planting density, composition, and reproductive period, and in agroforestry systems, interspecific competition occurs predominately below ground [17]. If competition is intense, root distribution will be modified [18]. The spatial distribution of roots and their density in the soil determine the ability of a crop to acquire the nutrients and water necessary to sustain plant growth [19]. This acquisition function is mainly performed by fine roots (diameter < 2 mm) [20]. The vertical stratification of the root system, where the roots of trees are distributed in the soil below the roots of crops, is an advantage of agroforestry [7]. In response to below–ground competition for soil moisture and nutrients, the fine roots of trees are limited to deeper soil [15], while the fine roots of crop species are found in shallower soil [17]. In this case, it is particularly important to study the effect of the spatial distribution of the fine roots of each component of an agroforestry system on the overall system [17]. Vegetation cover can reduce soil evaporation and erosion and facilitate soil water infiltration [21,22]. Different species assemblages in agroforestry systems can have different effects on soil water balance at different times, and such effects may be negative, positive, or neutral [7,15,23,24]. Moreover, agroforestry systems can alleviate both point and non-point agricultural pollution because they are able to reduce leaching to groundwater aquifers and absorb pollutants from both unsaturated and saturated low-depth zones through their tree roots [25]. Leguminous crops are used as ground cover in agroforestry systems. Their main benefits include the biological fixation of atmospheric nitrogen through symbiosis with soil bacteria, which increases the soil nitrogen content [26]. Moreover, an agroforestry system with leguminous crops as the intercropping material can not only improve water utilization but also improve nitrogen uptake [27]. Legume-based cropping systems significantly improve the amount of NH4+, NO3, available P, and SOC in the soil compared to continuous maize monocropping [28], and legume-based intercropping systems can also promote rhizobia diversity and soil health by enhancing symbiotic and non-symbiotic beneficial bacterial flora [29]. Intercropping with legumes has also been suggested to increase overall productivity and biomass production of cereals [30]. Root systems from two species cross over in the soil, resulting in changes in the distribution of soil nutrients or soil moisture [31], and the spatial distribution of roots responds differently to differences in soil nutrients and soil moisture. In agroforestry systems, the distribution of soil water and nutrients is complex due to the diversity of species and the existence of interspecific root systems. Therefore, it is important to explore the relationships among soil moisture, nutrients, and roots in agroforestry systems.
At present, most of the research on agroforestry root systems, soil water, and soil nutrient distribution in China has focused on rainfed agriculture; the fine root distribution of the two species and their relationships with soil moisture and nutrients in agroforestry systems remain unclear, and few studies have been conducted on irrigated agroforestry systems [15,17,19,23]. Xinjiang is the birthplace of wild apples in China, and apple-based intercropping systems constitute one of the most widely applied agroforestry systems in China [32]. In recent years, China’s soybean market has become less competitive due to imports and Chinese soybean production has begun to decline, with the country’s soybean self-sufficiency rate on a slow downward trend. Coupled with the finite amount of arable land available, this has led to slow growth in China’s total soybean production and the increase in soybean production capacity has reached a bottleneck, posing a potential threat to food security.
Here, we attempted to evaluate the effects of apple-based intercropping on fine root, water, and nitrate nitrogen distribution in the understory of apple and soybean. We designed a two-year field trial, and the objectives of this study were to (a) quantify the effects of fine root, water, and nitrate nitrogen distributions within the intercropping system at different reproductive periods; (b) understand the patterns of ecological niche competition between apple and soybean understories; and (c) determine the effects of intercropping on apple and soybean yields.

2. Materials and Methods

2.1. Experimental Materials

The tested soybean (Glycine max (Linn.) Merr.) variety was Suinong 30, and the apple variety tested was Malus niedzwetzkyana (Dieck) (Malus pumila var. niedzwetzkyana).

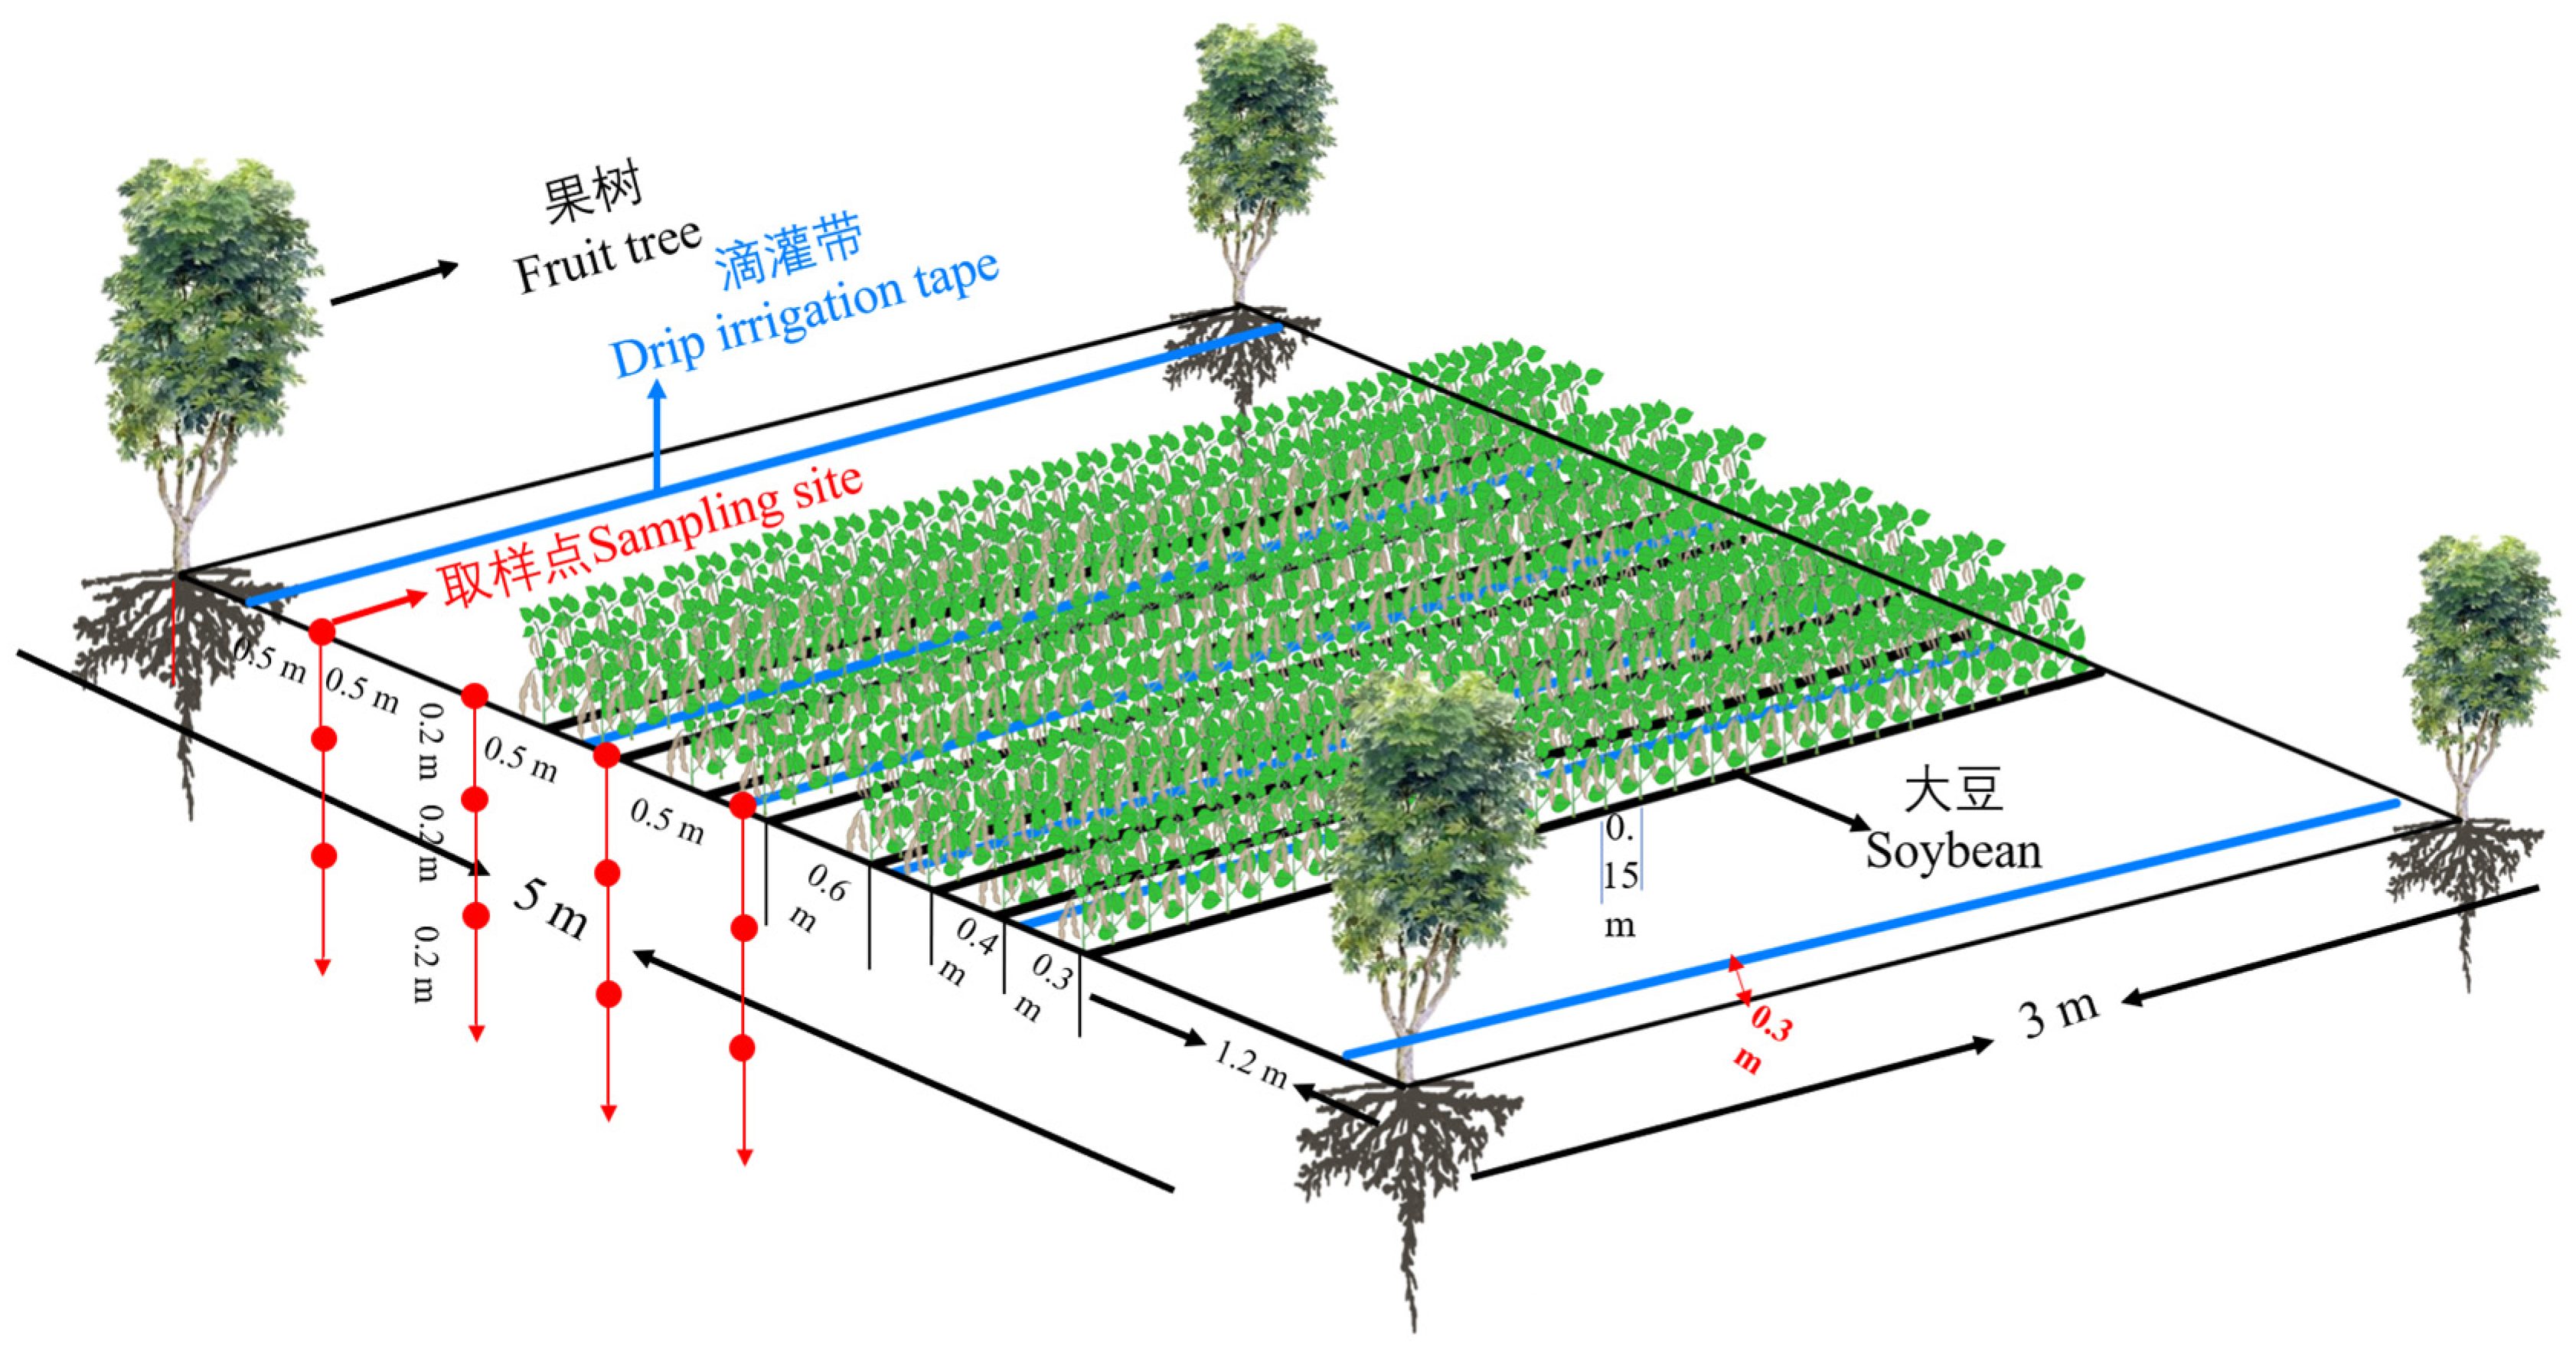
2.2. Study Site and Experimental Design

The study was conducted in Yining County, Yili Kazak Autonomous Prefecture, Xinjiang Uygur Autonomous Region, China (81°51′ E, 43°45′ N) (Figure 1). The study site was 903 m above sea level and the climate was a temperate continental climate with a mean annual temperature of 9.3 °C. The total rainfall amounts from June to October during the study periods in 2020 and 2021 were 170.92 mm and 196.44 mm, respectively. Over the past five years, the annual rainfall was 525.41 mm. The orchard covers an area of 4.67 ha, and the land is flat and slope-free. The soil is cultivated to a depth of 60 cm and has a relatively homogeneous texture. The average field water holding capacity of the 0–60 cm soil layer in the test orchard was 22.14%, and the average bulk density was 1.38 g·cm−3; the basic fertility of the 0–60 cm soil layer was 9.47 g·kg−1 organic matter, 0.62 g·kg−1 total nitrogen, 0.62 mg·kg−1 ammonium nitrogen, 5.91 mg·kg−1 nitrate nitrogen, 4.53 mg·kg−1 available phosphorus, and 77.86 mg·kg−1 available potassium.
The experiment was conducted in 2020–2021, and the experiment had 3 treatments: apple–soybean intercropping, apple monocrop, and soybean monocrop, with 3 replications of each treatment. The apples of monocropping apple (MA) and intercropping apple (IA) were planted at a spacing of 3 m between plants and 5 m between rows, and there was a drip irrigation belt 30 cm from the tree on each side of the apple tree row. In apple–soybean intercropping (AS), the row spacing between apple and soybean was 1.2 m, with a 60 cm open space in the middle of the tree row. The planting of intercropping soybean (IS) was divided into wide and narrow rows; the row spacing of wide rows was 40 cm, and the row spacing of narrow rows was 30 cm; a drip irrigation tape was laid in the middle of narrow rows, and soybean plant spacing was 10 cm. The monocropping soybean (MS) had a drip irrigation belt to manage four rows, with a row spacing of 30 cm and a plant spacing of 10 cm and no difference between wide and narrow lines (Figure 2). We planted one-year-old apple trees after the maize harvest in October 2019, and soybeans were sown on 8 May 2020 and 10 May 2021. Apple trees had an average height of 2.05 m, a diameter at breast height of 2.3 cm, and a crown spread of 1.47 m from north to south and 1.62 m from east to west. Fertilization and irrigation methods for trees and soybeans were based on common local practices, and both apple trees and soybeans were irrigated with drip irrigation. Base fertilizer was applied 4–5 days before sowing each year. The fertilization was as follows: 300 kg·ha−1 DAP (n ≥ 18%, p ≥ 46%) and 105 kg·ha−1 potassium chloride (K2O ≥ 57%). When fertilizing, attention should be paid to 1 m from the apple tree row. All trees (MA and IA) were watered 5 times a year, and irrigation was carried out once from flowering to the young fruit stage, twice from the young fruit stage to the fruit expansion stage, and twice from the fruit expansion stage to harvest. The amount of water to be irrigated was 750 m3·ha−1 at a time, with 100 m3 of water irrigated per hour for 35 h. Plants were topdressed twice, and water-soluble fertilizer (N: P: K = 17%: 8%: 44%) was applied each time in amounts of 225 kg·ha−1. The MS and IS were irrigated six times throughout the reproductive period, on average once every 17 days. The area planted with MS was 0.13 ha, and the amount of water for MS to be irrigated was 600 m3·ha−1 at a time, with 100 m3 of water irrigated per hour for 47 min. Plants were topdressed twice with 150 kg·ha−1 of urea and 120 kg·ha−1 of water-soluble fertilizer each time. The area planted with IS was 4 ha, and the amount of water for IS to be irrigated was 400 m3·ha−1 at a time, with 100 m3 of water irrigated per hour for 16 h. Plants were topdressed twice, each time with 100 kg·ha−1 of urea and 60 kg·ha−1 of water-soluble fertilizer.

2.3. Collection of Root and Soil Samples

Samplings were collected three times in 2020 and 2021, respectively, first in mid-June when the soybean was at the branching stage (BS), second in late–July when the soybean was at the flowering-podding stage (FS), and third in late–August when the soybean was at the seed filling stage (SS); this collection was performed 3 days before irrigation in all cases. Soil samples were taken with a cylindrical steel soil corer with an internal diameter of 4.5 cm (volume 141 cm3) driven into the soil by a sledgehammer. A total of 162 soil samples were taken for each sampling, and fruit trees were randomly selected for sampling each time, excluding the fruit trees that had already been sampled, with the location of each sampling being on the east side of the fruit trees. There were four sampling locations per treatment, 50 cm (T50), 100 cm (T100), 150 cm (T100), and 200 cm (T200) from the tree row on the east side of the fruit tree. At each sampling position, cores were collected at depths of 0–20, 20–40, and 40–60 cm (Figure 2). Due to the different planting patterns of soybean in the monocropping and intercropping, the temporal and spatial distribution of root and soil water and nitrogen cannot be effectively compared, so monocropping soybean was not studied.

2.4. Determination of soybean Agronomic Characters

Ten consecutive soybean plants with uniform growth were selected, and the plant height, stem thickness, and leaf area of the soybean were measured at the BS, FS, and the SS, respectively. The area of the soybean leaves is measured by the punching and weighing method, selecting the middle of a healthy leaf and perforating it sequentially from the petiole, avoiding the vein portion of the leaf and 2 cm from the tip. The formula is:
  L e a f   a r e a = W 1 +   W 2 × N × 3.14 × r 2 × 10 2 W 1
In the formula, W1 is the total drying weight of the rounded leaves, W2 is the total drying weight of the remaining leaves after punching, N is the number of holes, and r is the radius of the holes.

2.5. Fine root Analysis

The soil samples were placed in 200-mesh nylon gauze and sieved under running water, and then the living fine roots (brighter color and not completely dehydrated) were separated from the washed soil samples by forceps. The fine roots (diameter ≤ 2 mm and length ≥ 0.5 cm) of the apple are found to be reddish brown and those of soybean were grayish white in the monocropping fruit trees and MS. The color characteristics of the fine roots were used to establish the criteria for differentiating the fine roots of different species. Fine roots were then scanned using a flatbed scanner (STD4800; Regent Instruments Inc., Canada) at 600 dpi. From these images, the fine root lengths from each core sample were measured using WinRhizo (Reg. 2020; Regent Instruments, Canada). These data were used to calculate the fine root length density (FRLD; cm·cm−3).
F R L D = F R L V  
In the formula, FRL is the fine root length and V is the volume of the core (141 cm3). Although this method is the most accurate way to determine root length density, some of the roots will fall off during the process of washing the root system [33].

2.6. Competitive Ability

The index of competitive ability of soybean and fruit trees was calculated using the formula for overlapping ecological niches proposed by Levins (1968) [34].
L a s = B s j = 1 r P s j P a j
L s a = B s j = 1 r P s j P a j
B s = 1 r j = 1 r P s j 2
where r is the number of resource sites (number of samples) and r ≤ 3, Lsa is the competition index of soybean plants against fruit trees, Las is the competition index of fruit trees against soybean plants, and B is the ecological site width index (Bs and Bt have the threshold [1/r, 1], and Las and Lsa have the threshold [0, 1]). Psj and Paj are the proportion of the jth site’s FRLD values used by soybean plants or fruit trees to the site’s total FRLD used, respectively. The formula was calculated using data on root length density. The formula is sensitive to the number of individuals in each population and to the quantitative characteristics of each particular plant population. It reflects the overlap in resource use between the two groups and, to some extent, the interspecific competition that arises from the overlapping ecological niches.

2.7. Soil Analysis

For each soil sample, the nitrate nitrogen content in soil was determined by colorimetry. Five grams of soil sample were added to 50 mL of 2 mol·L−1 KCl solution and shaken for 1 h before the suspension was filtered for 3–5 min. Then, the absorbance A220 and A275 of the extract was measured at 220 nm and 275 nm, respectively. The corrected absorbance was calculated according to the following formula:
A =   A 220   2 A 275          
The following procedure was used for nitrate standard curve formulation. First, 0.7220 g of KNO3 was weighed, dried, and cooled in a 105 °C oven in a small beaker. Then distilled water was added to dissolve it. The mixture was quantitatively transferred into a 1000 mL volumetric flask and shaken well, that is, the 100 mg/mL nitrate nitrogen standard solution. We pipetted 10.00 mL of this solution into a 100 mL volumetric flask, diluted it to volume, and shook it well, that is, the 10 ug/mL nitrate nitrogen standard solution. We took 0, 1, 2, 3, 4, 5, 6, and 7 mL of 10 ug/mL nitrate nitrogen standard solution in a 50 mL volumetric flask, added secondary redistilled water, and shook to volume. Absorbance was measured at 220 nm and 275 nm with a 1 cm cuvette. We used formula (2) to find the corrected absorbance. From this, we obtained the standard curve equation.
By establishing the correlation curve between A and the concentration of nitrate nitrogen, the concentration of nitrate nitrogen in the leaching solution can be calculated. Nitrate nitrogen is calculated as follows:
N i t r a t e   n i t r o g e n   c o n t e n t = C × V × D m  
In the above formula, C is the NO3–N content obtained from the standard curve; V is the total volume of the colorimetric assay solution (mL); D is the fractionation multiple; and m is the fresh soil sample mass (g) [35].
The SWC was determined using the drying method. The soil samples were placed in an aluminum box and then dried in an oven. Then, the SWC was calculated by comparing the soil weights before and after drying. The formula was as follows:
S o i l   m o i s t u r e   c o n t e n t =   m 1 m m 2 m
where m is the weight of the aluminum box (g); m1 is the weight of the fresh soil sample and the aluminum box (g); and m2 is the weight of the dry soil sample and aluminum box (g).

2.8. Yield and Land Equivalent Ratio (LER)

At maturity, three 1.0 m × 1.0 m harvest plots were randomly selected in each plot to investigate the yield of each plot and to calculate the theoretical yield of each plot.
Apple trees were not productive in 2020. In 2021, five fruit trees were randomly selected from each plot and all fruit was picked and weighed to calculate the theoretical yield.
Using the land equivalent ratio as an indicator to measure the yield advantage of intercropping, the calculation formula is:
L E R   =   Y I S Y M S + Y I F Y M F
where YIS is the yield of IS, YMS is the yield of MS, YIF is the yield of intercropping fruit trees, and YMF is the yield of monocropping fruit trees. If LER > 1, it indicates that the fruit tree–soybean mixed stand has yield advantage; if LER < 1, it indicates that the fruit tree–soybean mixed stand has no yield advantage.

2.9. Statistical Analyses

Microsoft Excel 2010 and SPSS 19.0 (SPSS, Chicago, IL, USA) for were used for data processing and one-way analysis of variance (ANOVA), respectively, and significant differences between processing methods were tested at the 5% probability level by Duncan’s multiple range test. Different letters in the same period indicate significant differences. Bars represent standard deviation (n = 3).
In order to understand the relationship between different variables (FRLD, SWC, SNC, soil depth (SD), horizontal distance (HD), and sampling time (ST)), we used SPSS to do correlation analysis between variables, and through the results of correlation analysis, we selected suitable variables for multiple linear regression analysis and obtained the impact of independent variables (SWC, SNC, HD and ST) on target variables (FRLD) and influence level.

3. Results

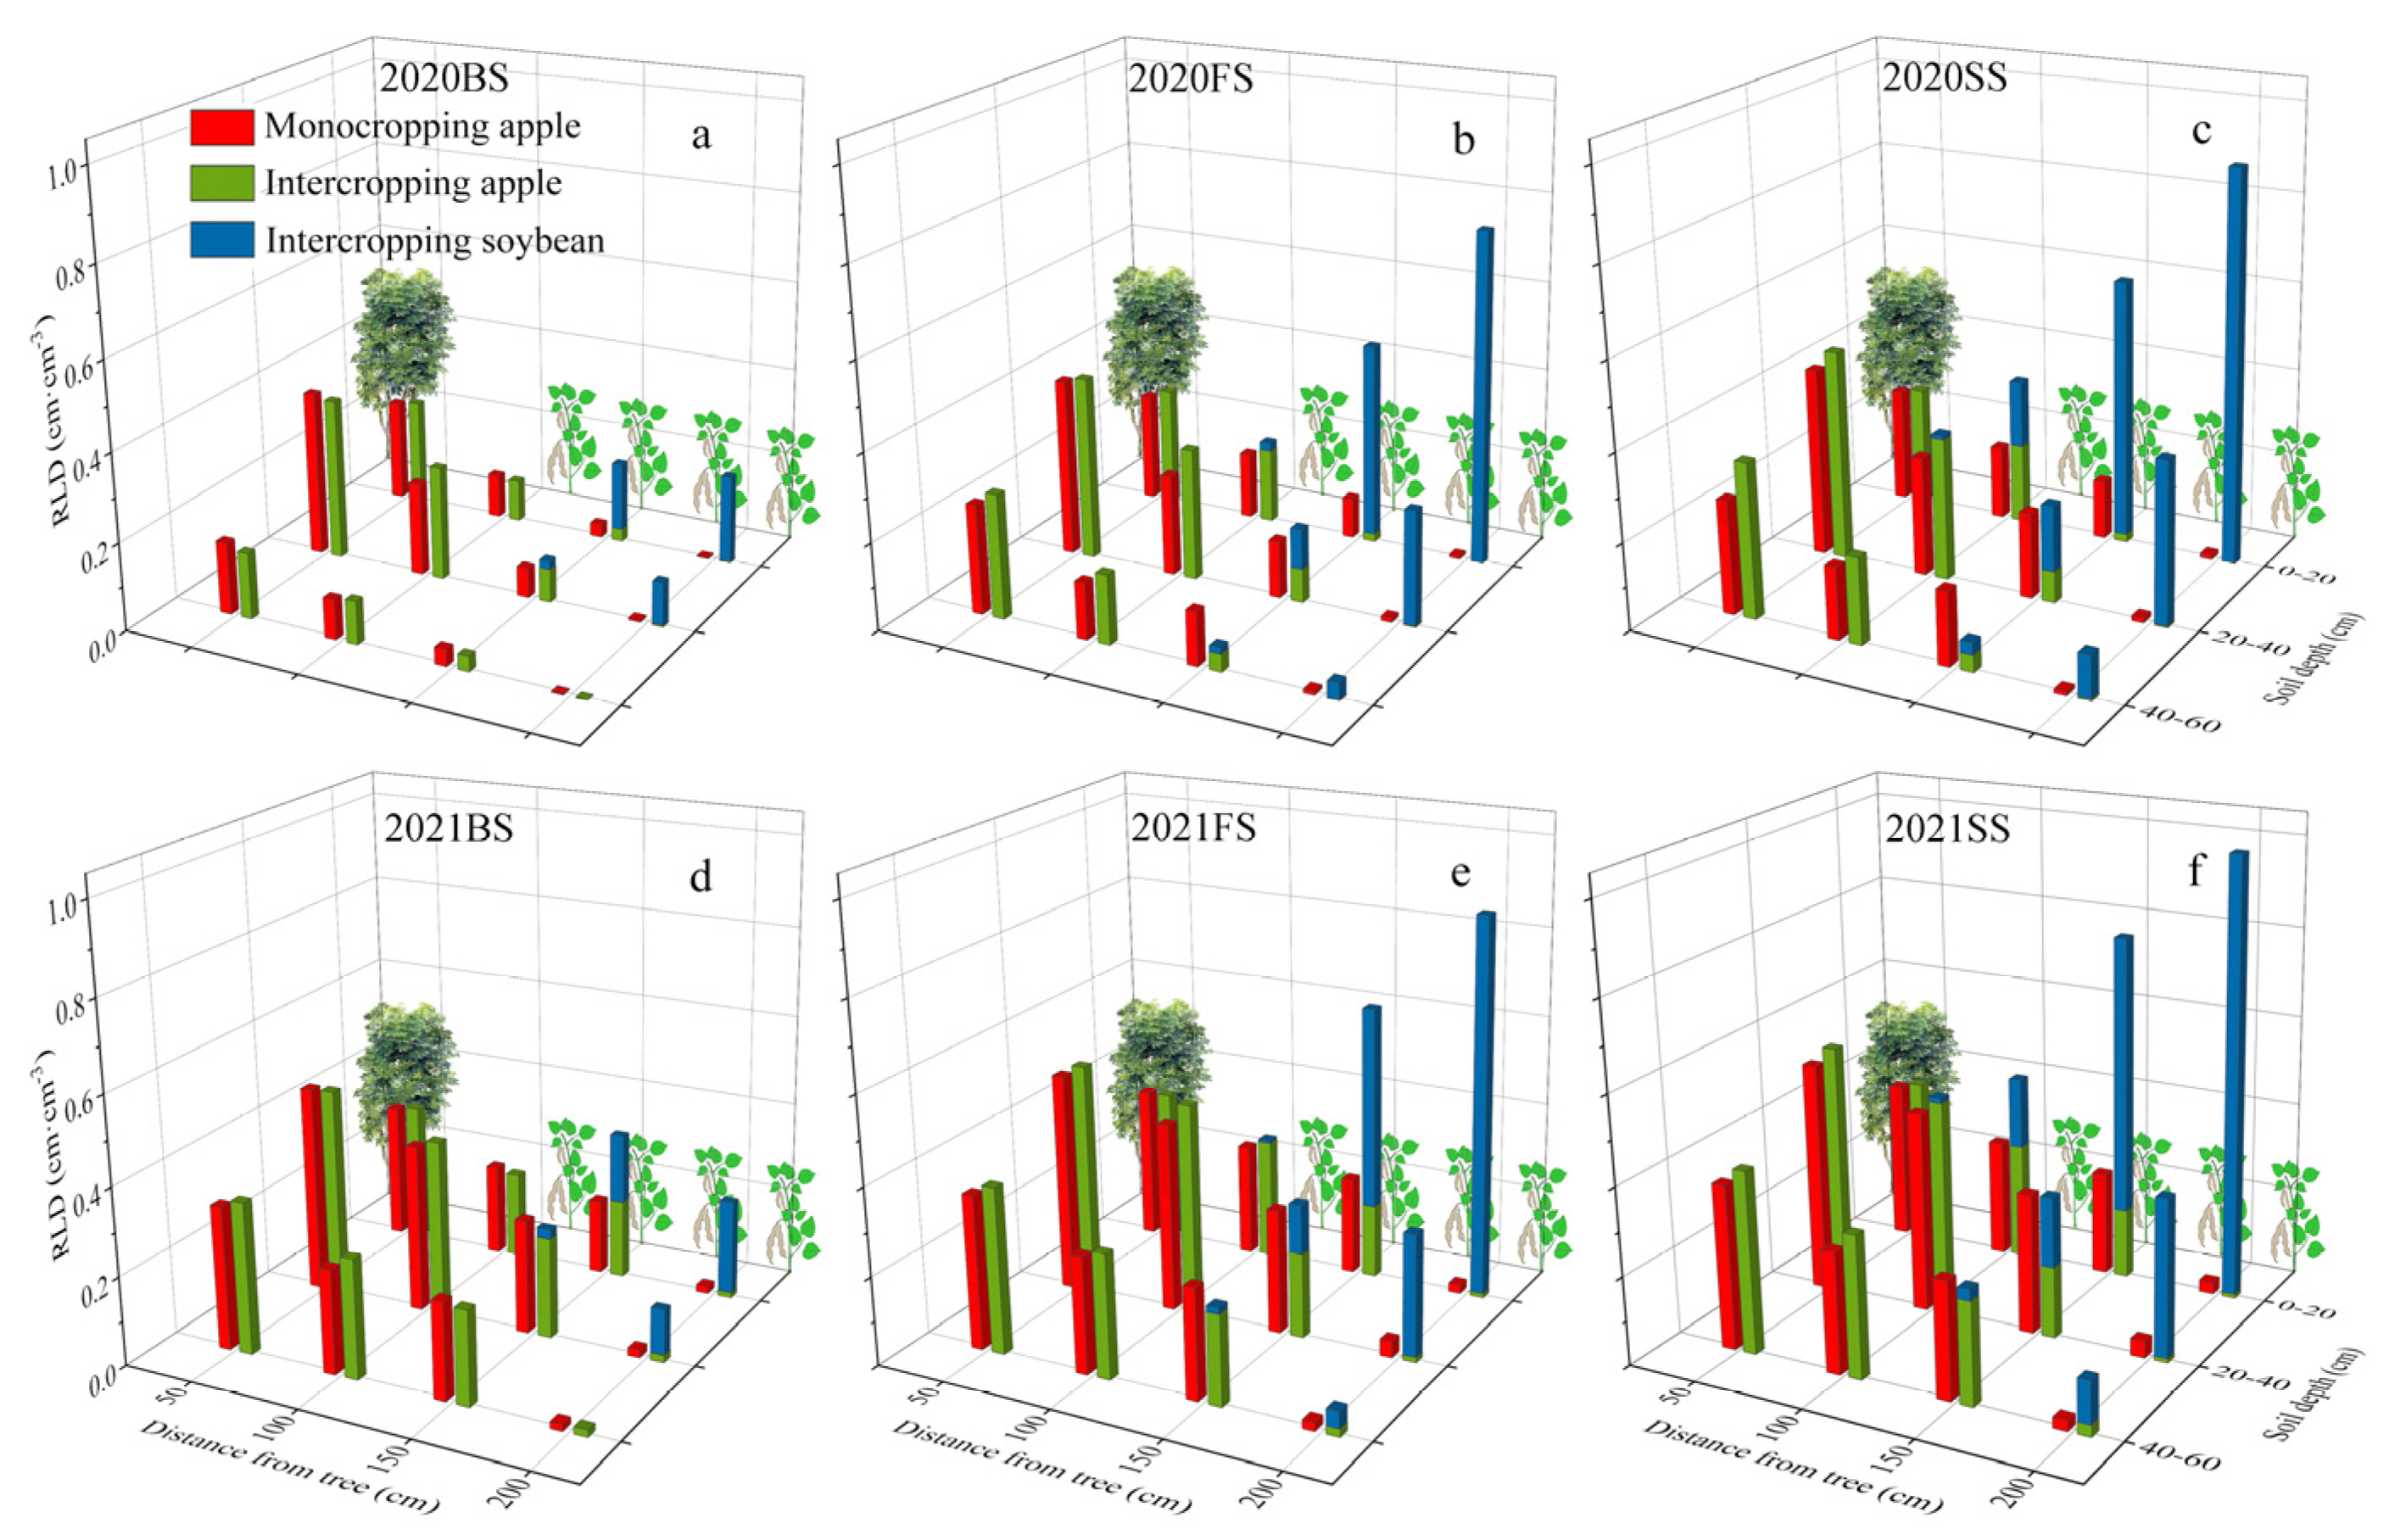
3.1. Fine Root Length Density Distribution in the Intercropping System

Two-dimensional distribution characteristics of root length density (FRLD) of apple and soybean showed that FRLD of MA and AS increased and then decreased as soil depth increased in the vertical direction (Figure 3). In the horizontal direction, FRLD decreased with increasing distance from the tree row for monocrop and intercrop apples, while soybean FRLD increased with increasing distance from the tree row and gradually decreased with increasing depth. At SS, intercropping reduced apple FRLD by 5.30% compared to MA, while the overall FRLD intercropping increased by 87.73% due to the distribution of soybean fine roots, and the distribution of FRLD in the horizontal direction in the intercropping pattern was T200 > T50 > T150 > T100 (Figure 3c,f).
By comparing the distribution of apple fine roots between monocropping and intercropping, we found that the differences were mainly at the FS and SS, where intercropping increased the FRLD of apple at T50 and T100 by 9.37% and 13.43%, respectively, and decreased the FRLD of apple fine roots at T150 and T200 from the tree by 48.48% and 57.00%, respectively (Figure 3b,c,e,f). However, the root development of soybean reached its peak at SS, and compared to monocropping, intercropping increased the total FRLD at T100, T150, and T200 by 38.20%, 89.80%, and 2936.79%, respectively (Figure 3c,f).
At T50, intercropping increased apple FRLD by 4.10%, 7.28%, and 16.74% in the 0–20 cm, 20–40 cm, and 40–60 cm soil layers, respectively; intercropping increased apple FRLD by 7.00%, 17.13%, and 16.16% at T100 in different soil layers, respectively; intercropping reduced apple FRLD by 55.86%, 46.21%, and 43.37% at T150 in different soil layers, respectively; and the intercropping reduced the apple FRLD by 73.11%, 67.80%, and 30.11% at T200 in different soil layers, respectively (Figure 3b,c,e,f). In the apple–soybean intercropping system, apple fine roots overlapped with soybean fine roots at T100, T150, and T200 at SS. The percentages of soybean fine roots in each soil layer were 37.65%, 2.15%, and 0 at T100; the percentages were 79.75%, 49.57%, and 9.84% at T150; and at T200, the percentages of soybean were 99.06%, 97.30%, and 78.37% (Figure 3c,f). Intercropping increased the distribution of fine roots in proximal trees and decreased it in distant trees.
Overall, the FRLD of MA and IA increased in 2021 compared to 2020 at all locations, with larger increments in T150 and T200, while the FRLD of intercropped soybeans was elevated in shallow soils (0–20 cm) and decreased in the middle (20–40 cm) and deep layers (40–60 cm). At the BS of 2021, the difference in fine root distribution of single intercropped fruit trees was smaller than at SS of the previous year, and then the difference between the two gradually increased again (Figure 3c,d).
Intercropping reduced the FRLD of apple and increased the FRLD of the system as a whole, and the differences between monocropping and intercropping were mainly concentrated at FS and SS. Intercropping increased the FRLD of apple at T50 and T100, and the increase was mainly in the 20–60 cm soil layer. Intercropping reduced the FRLD of apple fine roots at T150 and T200, with a greater effect in the 0–40 soil layer. At SS, apple roots were predominant at T50 and T100 and a minority at T200, and the distribution of apple and soybean fine roots was comparable at T150.

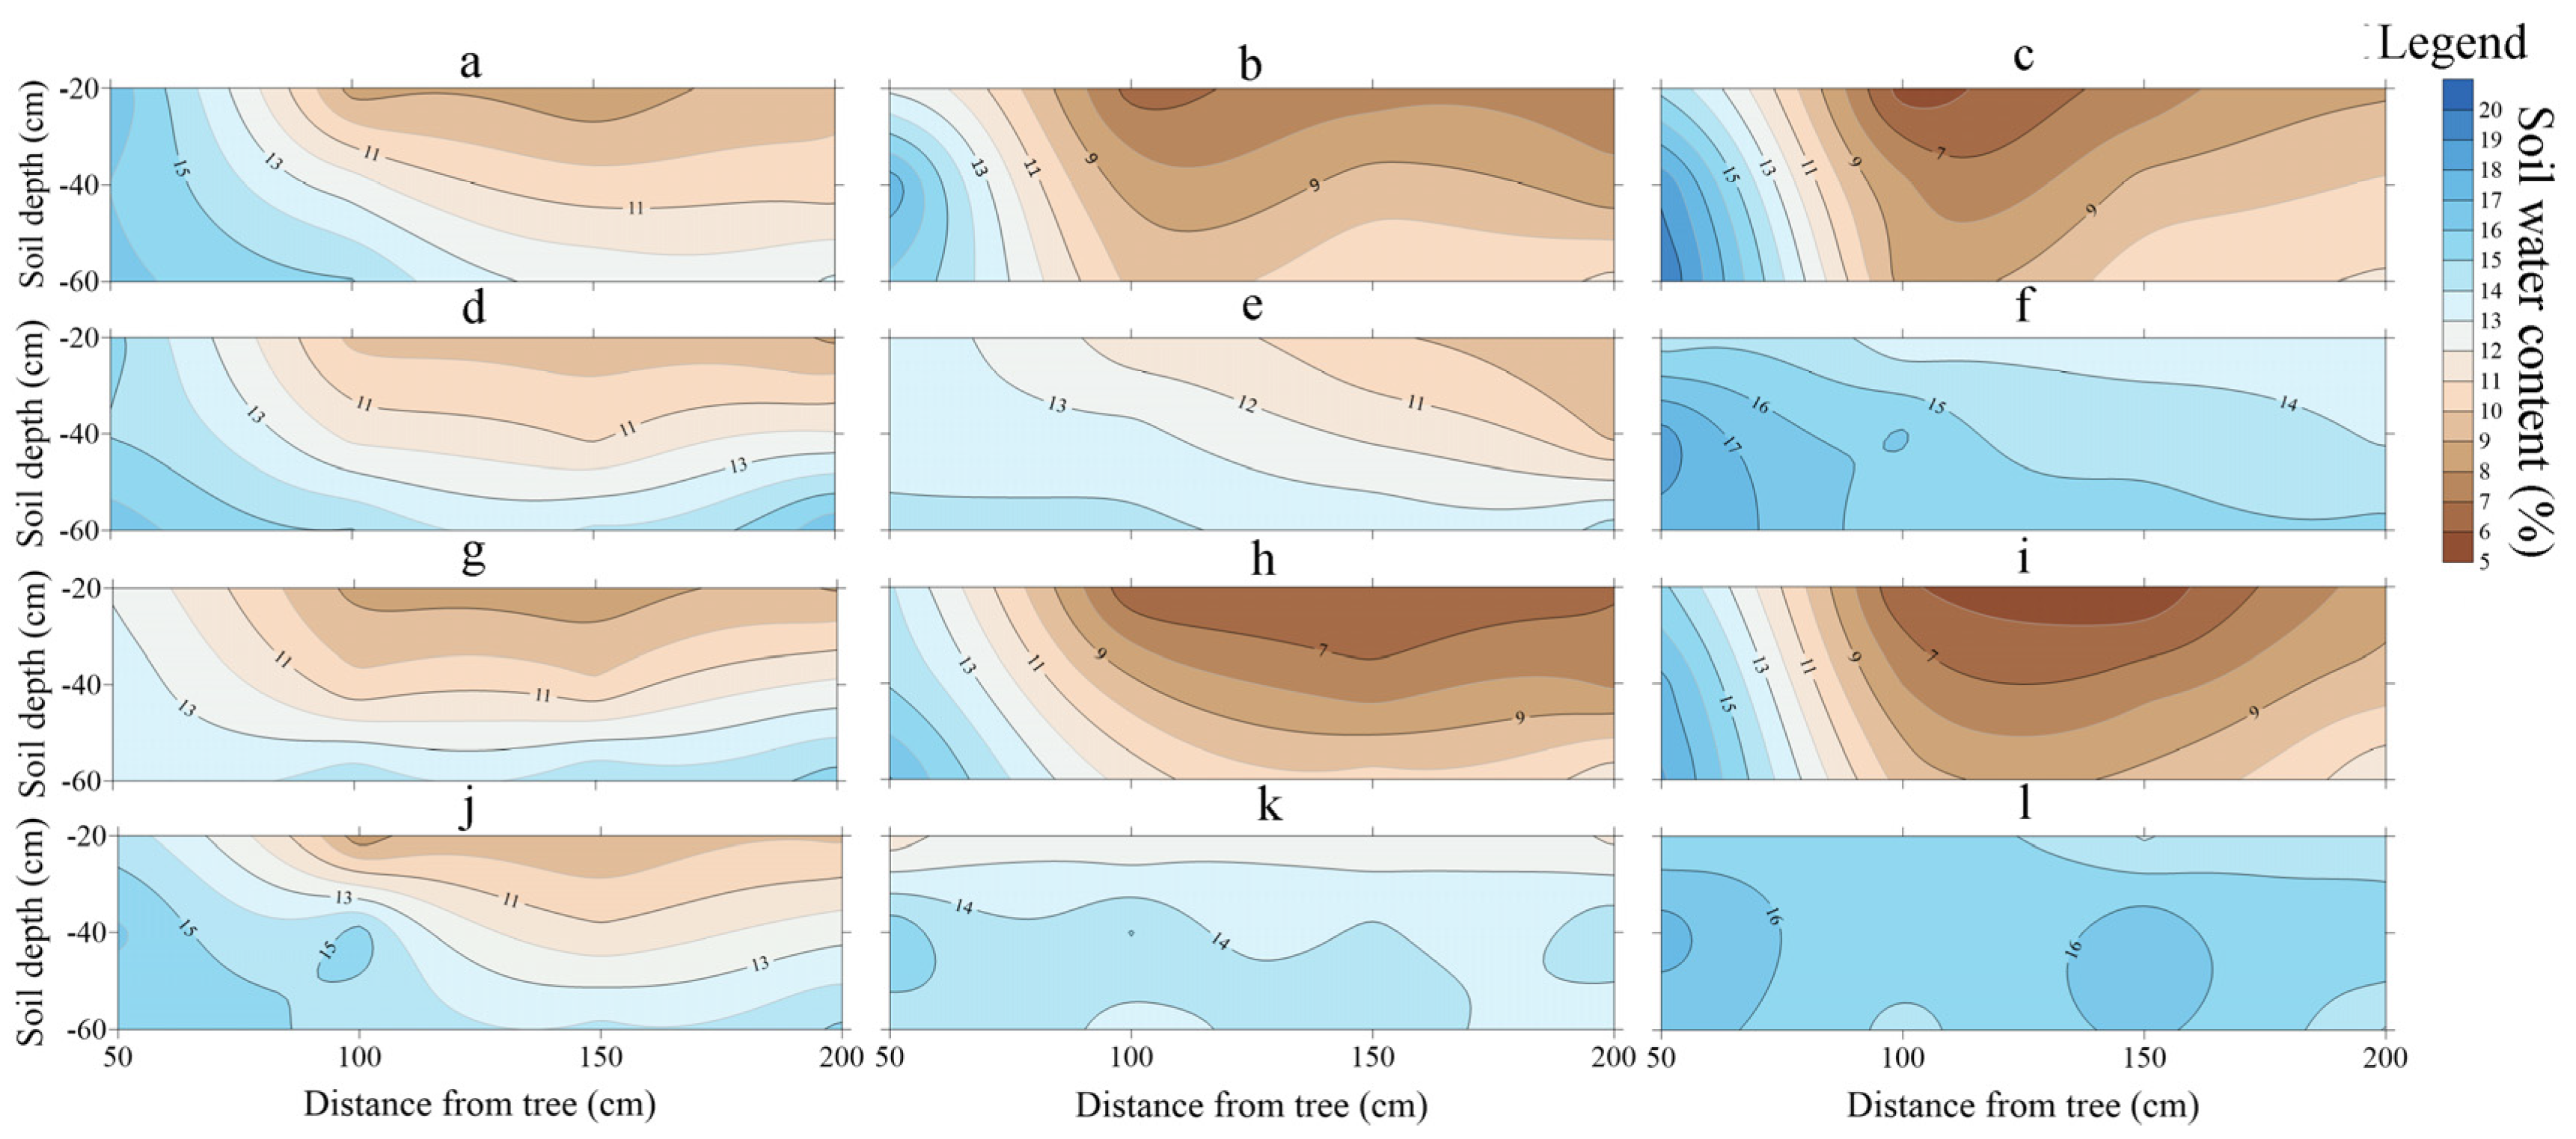
3.2. Soil Water Content Distribution
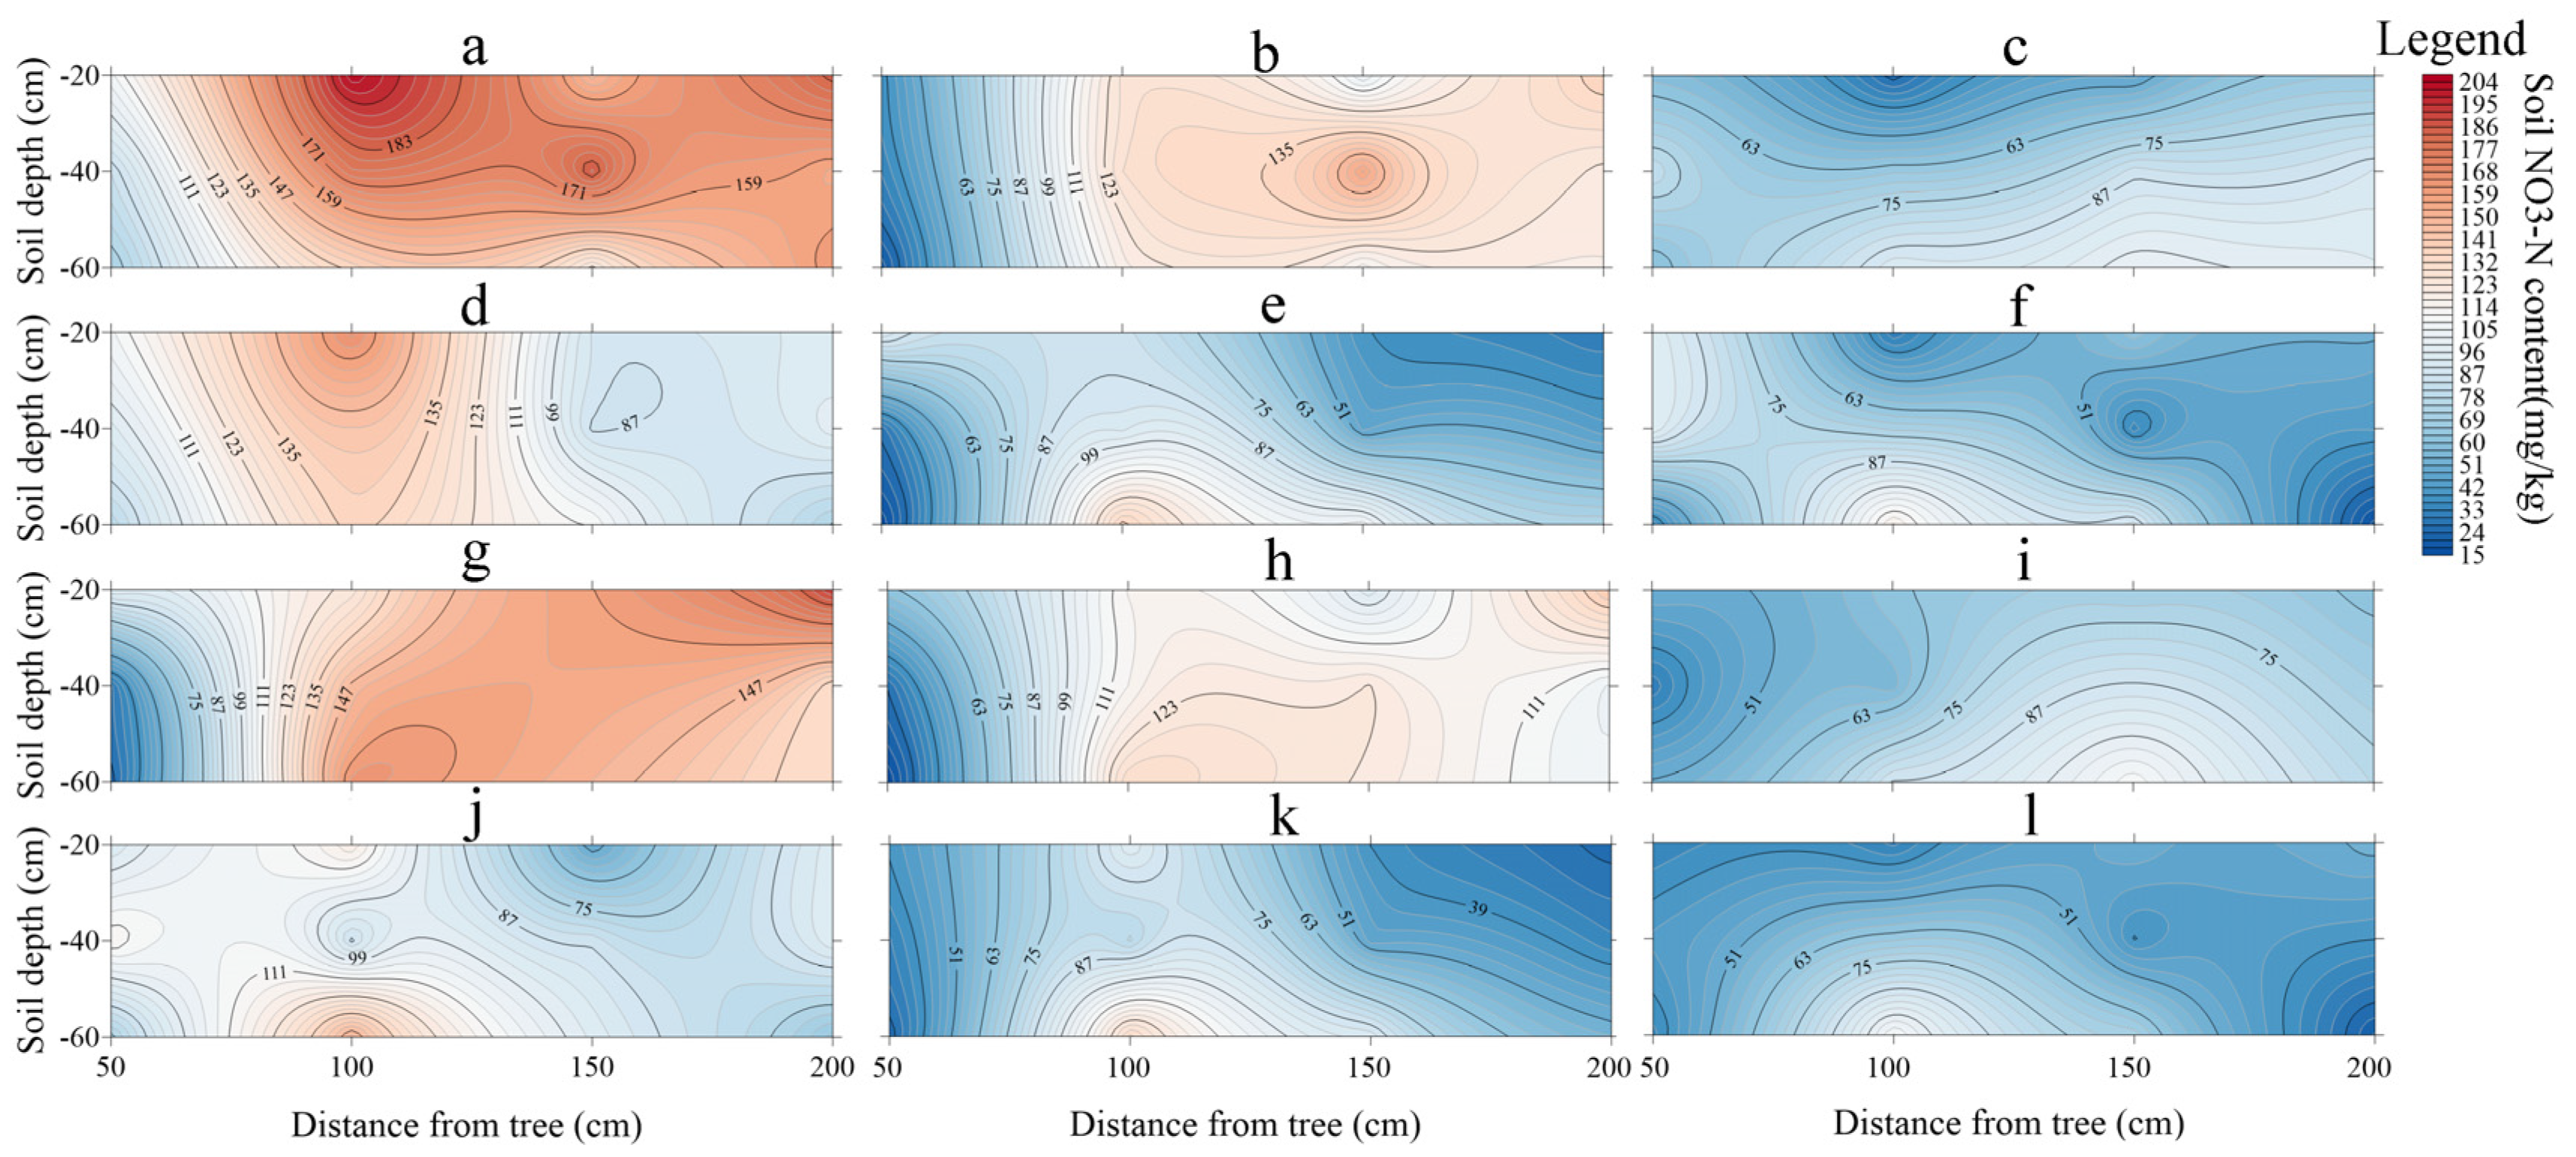
The two-dimensional distribution characteristics of soil water content showed that SWC increased with increasing soil depth for both MA and AS (Figure 4). At BS, the difference in SWC between monocropping and intercropping was relatively small, while at FS and SS, the difference in SWC between monocropping and intercropping was larger due to irrigation between tree rows, and compared with monocropping, intercropping increased the total SWC by 25.06% and 41.42% at FS and SS (Figure 4b,c,e,f), respectively.
By comparing the SWC between monocropping and intercropping, we found that the difference between them was mainly at FS and SS. Compared with monocropping, intercropping increased the SWC at T100, T150, and T200 by 80.04%, 71.60%, and 43.49% (Figure 4b,c,e,f), respectively. Compared with monocropping, the intercropping increased the SWC by 114.91%, 77.64%, and 47.56% at T100 in different soil layers, respectively; intercropping increased the SWC by 96.45%, 73.54%, and 44.81% at T150 in different soil layers, respectively; and intercropping increased the SWC by 53.24%, 53.48%, and 23.74% at T200 in different soil layers (Figure 4b,c,e,f), respectively.
Compared to 2020, the SWC in MA in 2021 decreased by 2.46%, 2.94%, and 5.01% at BS, FS, and SS, respectively, with the decrease in SWC occurring mainly in T50 and T150. Meanwhile, the SWC in AS increased by 1.07%, 11.14%, and 2.95%, respectively, with the increase in SWC occurring mainly in T100, T150, and T200. At FS and SS, intercropping increased the SWC in the system compared to monocropping, and the increase occurred mainly in the area of overlapping apple–soybean root systems, and the change in SWC was greater in the shallow layer (0–20 cm) and decreased as the soil layer deepened.

3.3. Soil NO3−N Content Distribution

The two-dimensional distribution characteristics of SNC showed that the SNC increased with the increase in soil depth and the distance from the tree row in the MA system, and in the AS system, SNC increased with soil depth (Figure 5). With the advancement of the growth period, the SNC at each soil depth decreased continuously in the MA and AS treatments. Compared to monocropping, intercropping decreased the overall SNC in the system in all three periods by 25.89%, 37.33%, and 21.06% (Figure 5a–f), respectively.
Horizontally, compared to monocropping, intercropping increased the mean SNC at T50 by 37.31% and decreased the SNC at T100, T150, and T200 by 7.38%, 38.40%, and 51.90% (Figure 5a–f), respectively. Vertically, compared to monocropping, intercropping increased the mean SNC at T50 in 0–20 cm, 20–40 cm, and 40–60 cm soil layers by 23.19%, 60.97%, and 27.78%, respectively; intercropping decreased the mean SNC at T100 by 16.47% and 15.86% (0–20 cm and 20–40 cm soil layers), respectively, and increased the mean SNC at 40–60 cm soil layers by 10.20%. Intercropping reduced the mean SNC in different soil layers at T150 by 37.27%, 57.80%, and 20.14% respectively; intercropping reduced the mean SNC in different soil layers at T200 by 48.83%, 48.89%, and 57.99% (Figure 5a–f), respectively.
Compared to 2020, the SNC in MA in 2021 decreased by 15.95% and 2.27% at BS and FS, respectively, with the decrease in SNC occurring mainly in T50 and T200, while it increased by 4.30% at SS, with the increase in SNC occurring mainly in T100 and T150. Meanwhile, the SNC in AS decreased by 11.04%, 6.14%, and 11.32%, respectively, with relatively uniform decreases across sampling sites.
At BS, FS, and SS, intercropping reduced SNC in the system compared to monocropping, and at T50, intercropping increased SNC, while intercropping showed a negative effect on SNC in the area of overlapping apple–soybean root systems. The further away from the apple tree, the greater the effect.

3.4. The Relationship between FRLD and Spatiotemporal Distribution of Soil Resources

Correlation analysis showed that in the MA treatment, the distribution of apple fine roots had an extremely significant positive correlation with SWC and ST (Table 1) and an extremely significant negative correlation with SNC and HD. In the AS treatment, apple fine root distribution was significantly positively correlated with SWC, significantly positively correlated with SNC and ST, and extremely significantly negatively correlated with HD. The results showed that in addition to soil depth, other influencing factors affect the distribution of fine roots.
From the multiple linear regression equation, it can be concluded that in the MA treatment, SWC, SNC, HD, and ST can explain 78.97% (R2) of the possibility of the formation of FRLD. The SWC, HD, and ST are the main factors affecting the FRLD (Table 2). The obtained multiple linear regression equation is: yMA = 0.301 + 0.003xSWC + 0.000053xSNC − 0.097xHD + 0.015xST. In the AS, SWC, SNC, HD, and ST could explain 77.89% (R2) of the possibility of the formation of FRLD, and all factors were the main influencing factors; the obtained multiple linear regression equation is: yAS = 0.173 + 0.008xSWC + 0.00039xSNC − 0.086xHD + 0.012xST.

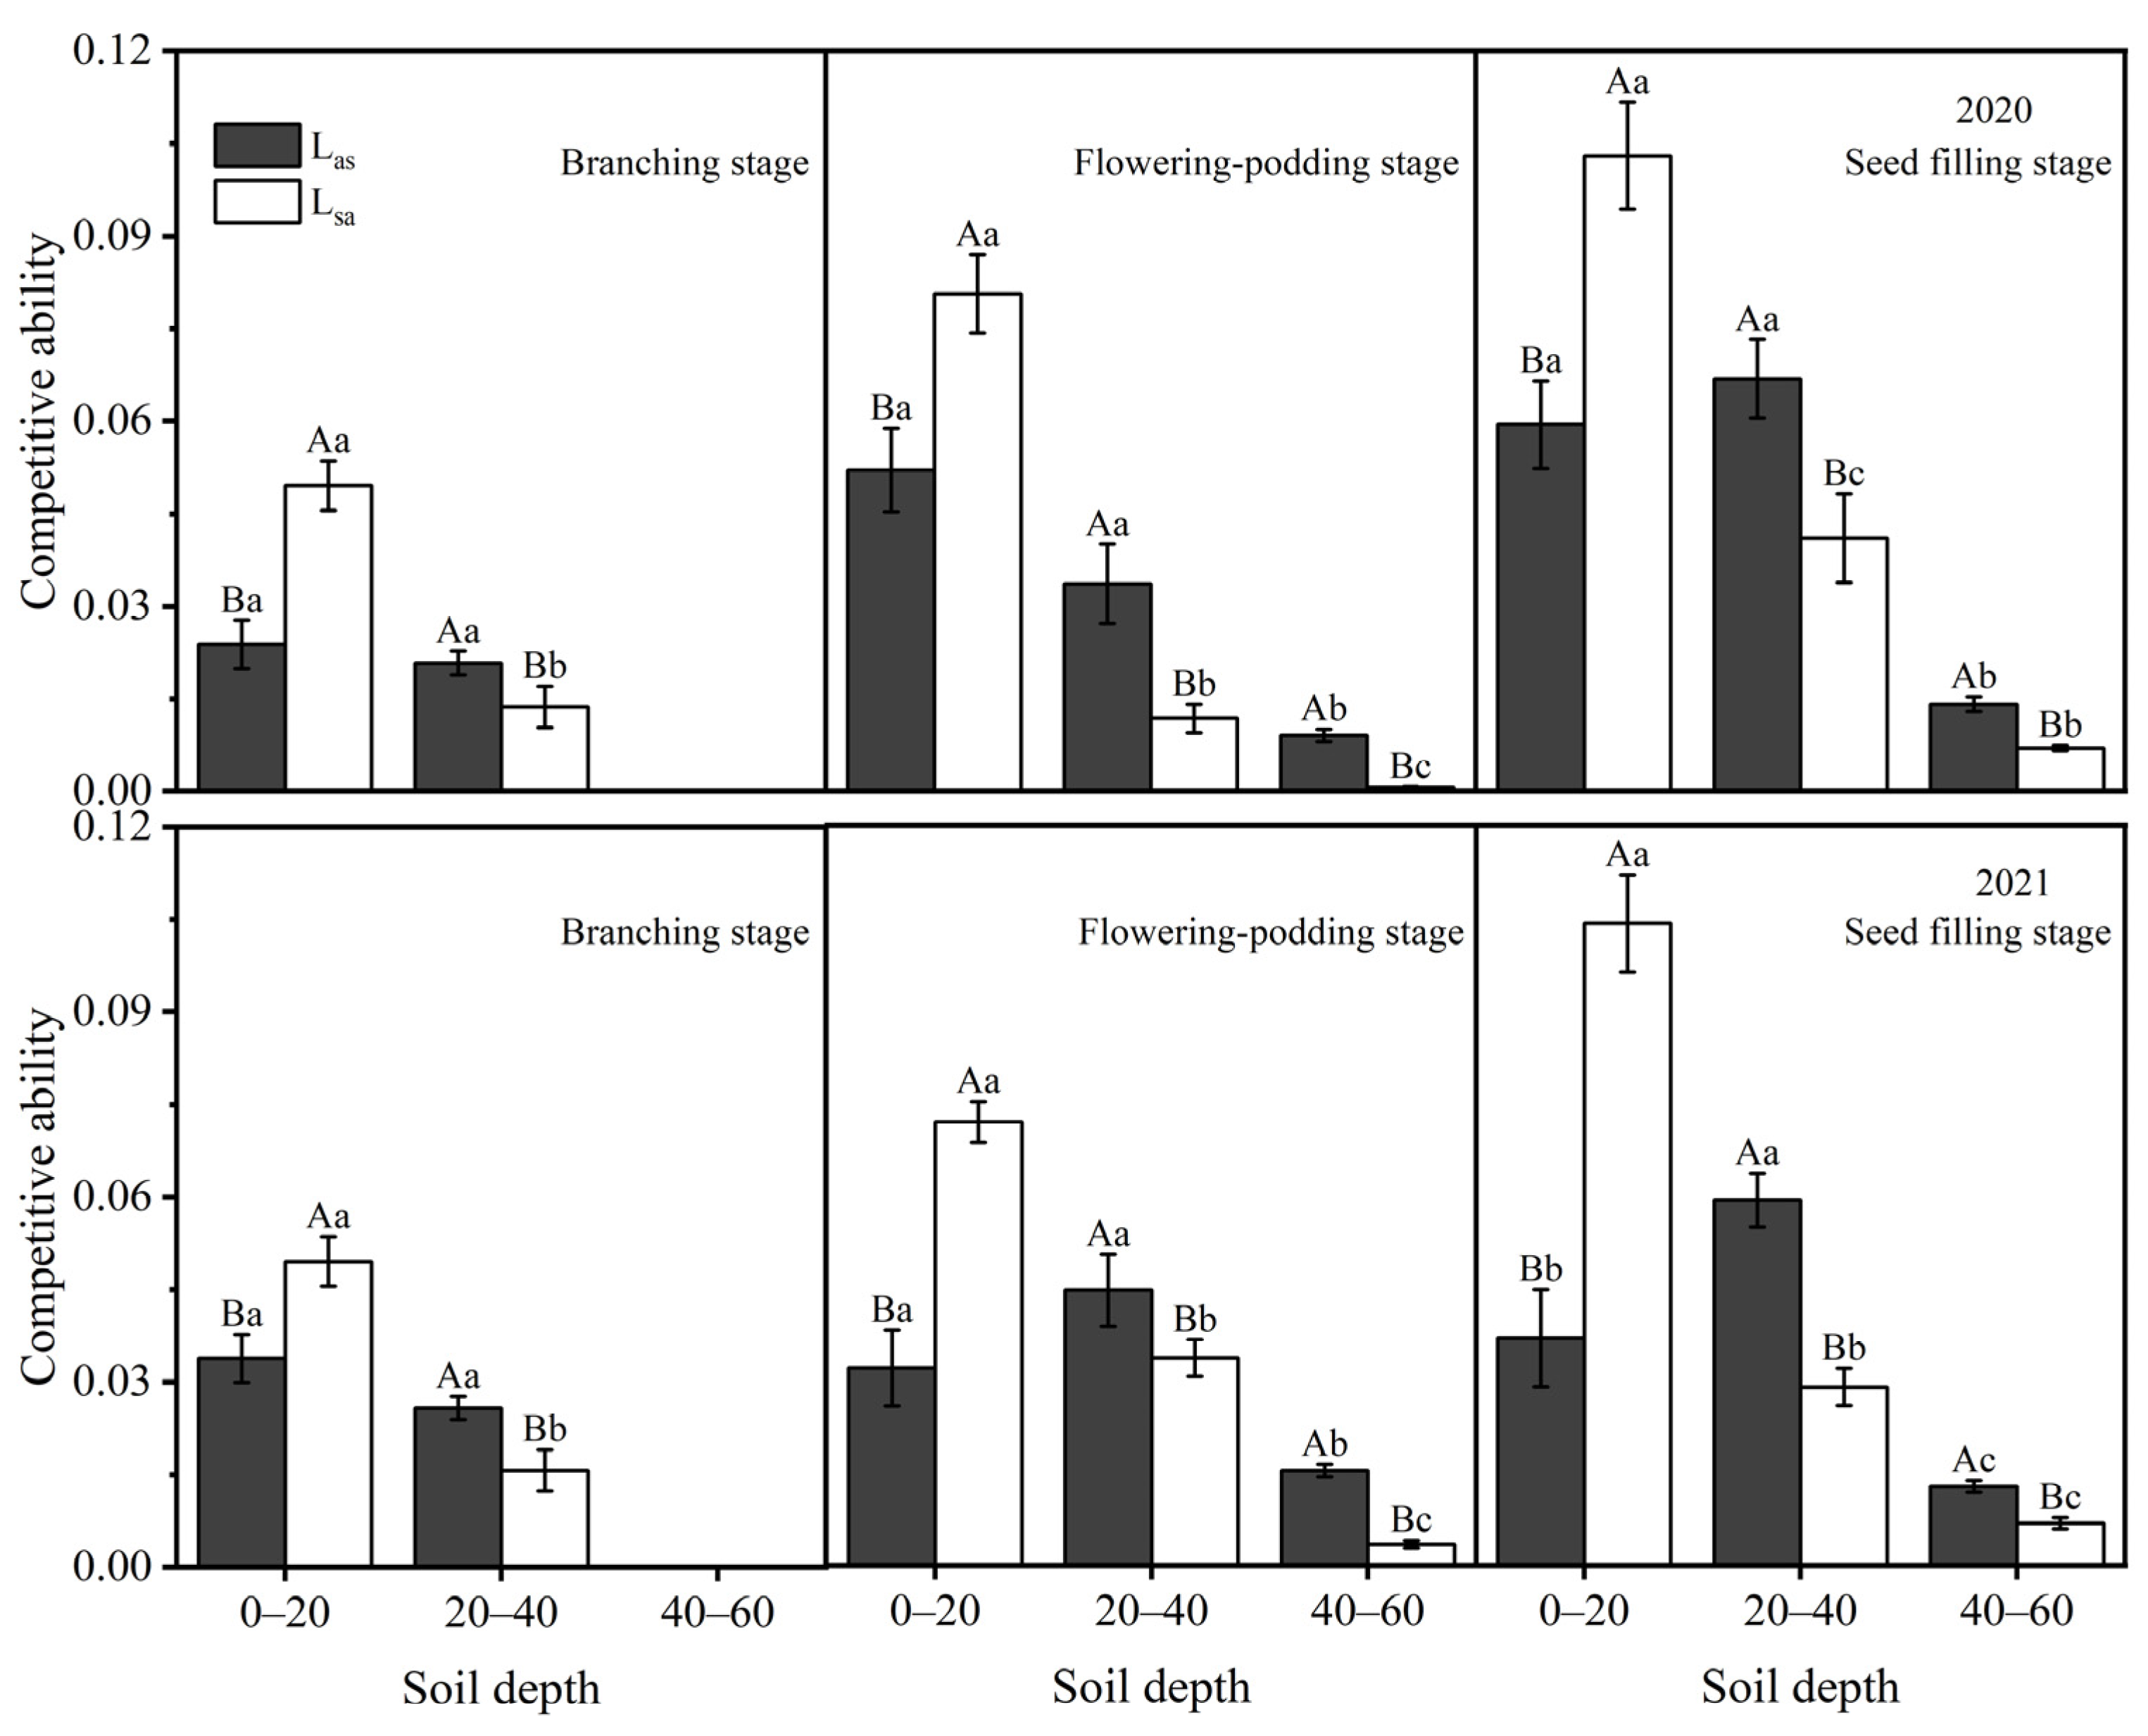
3.5. Competitiveness Index for Apple–Soybean Intercropping Systems

As shown in Figure 6, the competitiveness index of apple trees tended to increase and then decrease with increasing soil depth, while the competitiveness index of soybean plants decreased with increasing depth. The competitiveness indices of both apple and soybean increased with the advancement of the growth period, indicating that plant growth promoted changes in competitive strategies within the system. At 0–20 cm, the soybean competitiveness index was significantly greater than the apple competitiveness index, while at 20–60 cm, the soybean competitiveness index was significantly smaller than the apple competitiveness index. Competition between apple and soybean plants occurred mainly in the 0–20 cm soil layer and increased with the duration of the reproductive period, and the competition index between species peaked at SS.
The horizontal competition ability indices for apple trees and soybean plants are shown in Figure 7. There was no competition in the horizontal direction at T50 cm and T100 at the FS. The competitiveness index of soybean was significantly lower than that of apple at T100 at FS and significantly higher than that of apple at SS, and the competitiveness index of soybean plants was significantly higher than that of apple trees at T150 and T200 in the horizontal direction. At BS, interspecific competition occurred mainly at T150 and T200, and at FS and SS, the competition was more intense at T100 than at other locations.

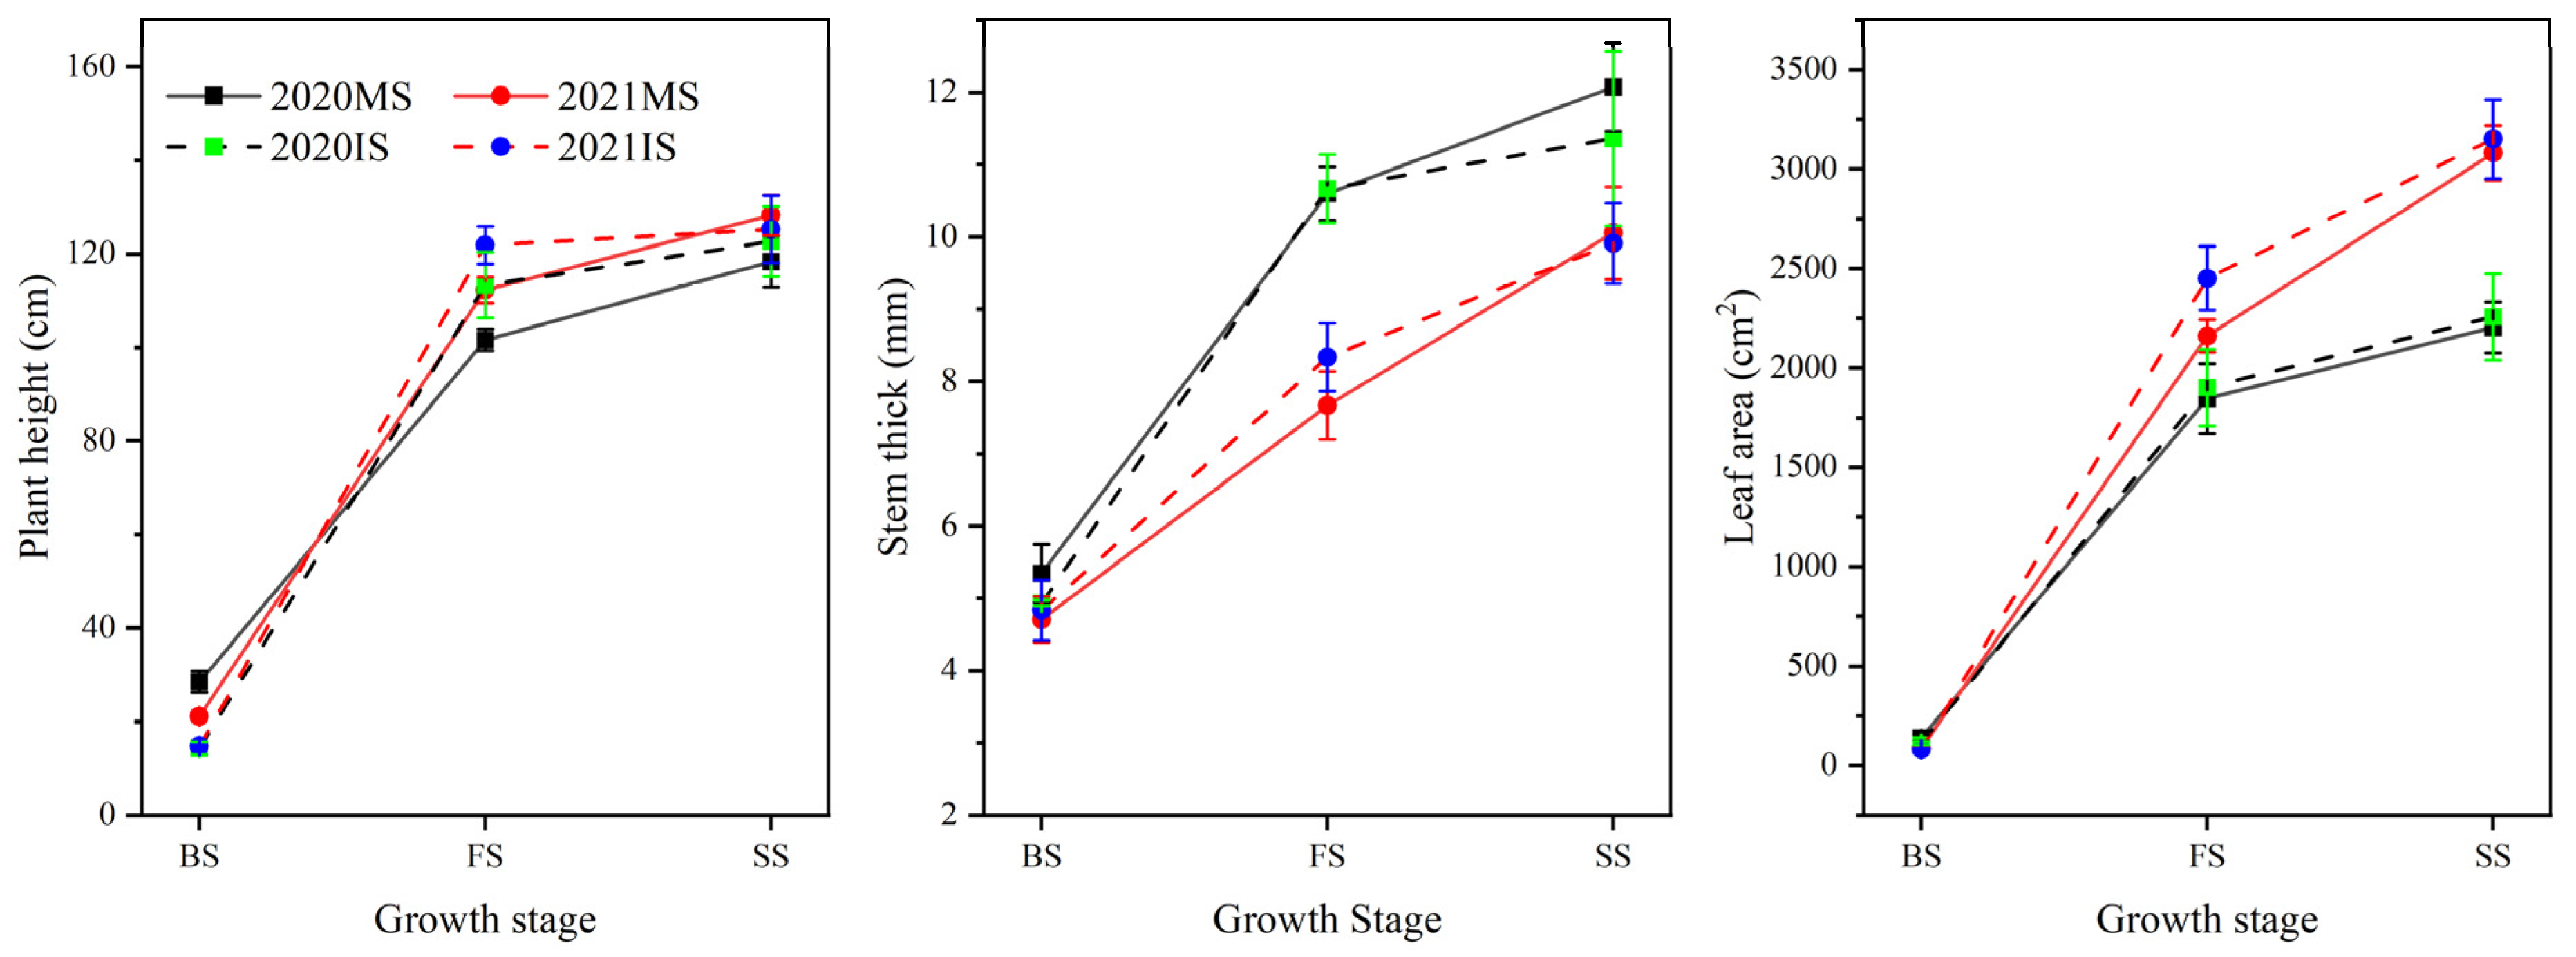
3.6. The Growth of Soybeans

As shown in Figure 8, the plant height, stem thickness, and leaf area of MS and IS all increased continuously with the advancement of the growth period and increased rapidly in the branching and pod stages. Compared with MS, IS significantly increased the soybean plant height at the FS by 10.50%. In 2020, compared with MS, IS significantly reduced the stem thickness of soybean at the seed filling stage by 26.33%, and in 2021, compared with MS, IS significantly increased the leaf area of soybean at the FS by 28.48%.

3.7. System Yield and Yield Composition Factors

As shown in Table 3, in two years, AS increased soybean pods per plant by 9.25%, and there was no significant difference compared with MA. In contrast, intercropping significantly decreased the soybean 100-grain weight by 10.67%. In 2020, intercropping significantly increased the number of soybean grains per pod by 28.70% compared with MS. Soybean yields dropped significantly by 69% in two years. Due to the different planting patterns, the seeding amount of the AS was much lower than that of the MS. In 2021, AS reduced the number of fruits per plant by 5.92%, the fruit weight by 4.38%, and the yield by 11.44%, but the differences were not significant. Calculating the LER based on the production of soybeans and fruit trees in 2021 showed that LER = 1.45 > 1. This showed that apple and soybean intercropping had production advantages.

4. Discussion

4.1. The Distribution of Fine Roots

Interspecific facilitation through the spatial distribution of root systems of constituent species has been suggested to enhance grain yield and nutrient uptake [36,37,38]. Under the traditional definition of fine roots, fine roots can be further divided into absorbing and transporting roots based on their function [39]. Root distribution plays an important role in the interaction between species within an intercropped field. In such fields, the root distribution of different species differs in time and space, and there is interspecific competition for resources (e.g., soil water and nutrients), which is very different from monoculture fields [40]. In this study, intercropping reduced the FRLD of apple and increased the overall FRLD of the system, with the differences between monoculture and intercropping concentrated at FS and SS. In the area not covered by soybean (at T50 and T100), intercropping increased FRLD of apple and the increase was greater in the 20–60 cm soil layer, while in the area covered by soybean (at T150 and T200), intercropping reduced FRLD of apple, and the reduction was greater in the 0–40 cm soil layer. Soybean cover in the field resulted in the overlapping of apple roots with soybean roots in the cover area, probably due to competition for resources resulting in more distribution of apple fine roots in the uncovered area of soybean and movement to deeper soil layers, which is direct evidence of changes in fine root distribution in apple–soybean intercropping systems, where competition is unavoidable and plants promote root development in deeper soils to take up more water and nutrients [1]. As the root system of apple trees developed, the distribution of apple tree fine roots in the 20–60 cm soil layer increased in 2021 compared to 2020, leading to a change in the distribution of fine roots in soybean in 2021 compared to 2020, with an increase in the distribution of fine roots in soybean in the 0–20 cm soil layer and a decrease in FRLD in the 20–60 cm soil layer. In addition, the T100 was the location of the greatest overlap in fine root length density between apple and soybean, which separated the dominant areas of the two species in the lower ground, with decreasing FRLD in apple with increasing distance from the tree and the opposite in soybean, a root distribution pattern that reduces below-ground competition between species and improves the utilization of deep soil resources [41]. The difference in FRLD between intercropping and monocropping apples was reduced during the recovery period from fall to spring, while the rapid growth of soybean roots was from spring to summer, and this difference in root growth time helped to reduce competition between species and improve resource utilization [17].

4.2. Distribution of Soil Water Content

Whether agroforestry has an overall positive or negative impact on soil moisture remains the focus of research investigating water dynamics in arid and semi-arid regions [42]. Maintaining sustainable soil moisture for vegetation is critical, especially in arid regions where water scarcity is the greatest limiting factor for vegetation growth and sustainability [43]. Soil moisture plays a central role in driving growth patterns in semi-arid environments [44]. In many studies, researchers have found that trees in agroforestry systems can improve soil moisture conditions [45]. In the present study, we found a large difference in soil moisture content between monoculture and intercropping at FS and SS. The SWC in intercropped fields was increased by 30.54%, and some studies have shown that planting crops or forage between trees affects soil moisture storage, soil moisture retention capacity, and soil moisture availability, increasing soil moisture under trees [46,47]. The increase was concentrated within the 0–40 cm soil layer where the apple and soybean root systems overlap (T100, T150 and T200) and was due to several factors: (1) What we cannot ignore is the effect of the irrigation pattern on soil moisture distribution. In this study, four drip irrigation strips were arranged between two rows of trees, and the study showed that drip irrigation can reduce the leakage of soil moisture below the root zone [48], while a reasonable drip irrigation system can also improve soil moisture distribution [49]. (2) Higher water content of neighboring crops is possibly related to reduced evaporation due to canopy shading, and reduced crop transpiration is due to lower wind speed and increased humidity [50,51,52]. (3) Lower soil evaporation is due to inter-row crop cover [23], resulting in improved soil quality, enhanced infiltration even during limited rainfall events, and reduced water loss during rainfall intervals [53]. We also demonstrated that SWC was an important factor affecting fine root distribution in both monocropping and intercropping patterns.

4.3. Distribution of Soil NO3-N Content

Nitrogen (N) is one of the large number of nutrients essential for all living organisms. In plants, it is a component of nucleotides, amino acids, chlorophyll, and secondary metabolites. N contributes to structural and functional aspects of growth and development, and its bioavailability within the plant affects crop productivity [54,55]. The size and structure of the root system are important variables that affect the availability of N to plants [56]. Effective NO3 root zone residues are one of the keys to ensuring high crop yields [57,58]. In agricultural production, N input to the system from leguminous crops or the combination of deep-rooted crops with shallow-rooted crops to enhance the use of soil space are examples of improving resource use efficiency in cropping systems [59]. In this experiment, intercropping reduced soil nitrate N content by an average of 28.09% over the three sampling periods compared to monocropping, and we also found that intercropping increased soil nitrate N content closer to the tree (T50), while at T100, T150, and T200, intercropping exhibited a negative effect on soil NO3-N. The decrease in SNC was greater with increasing distance from the tree. In soybean growing areas, competition for resources between apples and soybeans was intense due to the vigorous growth of soybeans. Moreover, both irrigation and fertilizer application have an impact on the distribution of SNC [60]. Studies have shown that the minimum salt concentration occurs below the drip head and increases with distance from the drip head within a certain range [61], with nitrates all clustering towards the boundary of the wetted volume [62], while the uniformity of drip irrigation is also an important factor in the distribution of SNC [63]. Our study found that intercropping had a strong effect on SNC in all soil layers, and when soil resources were abundant and evenly distributed, plants mainly absorbed resources from shallow soils [64], while the fine roots of intercropped apples could obtain nutrients from deeper soils [65]. Agroforestry complex systems could reduce nutrient leaching to deeper soils [25], resulting in lower NO3-N content in deeper soils. In addition, we also demonstrated that SNC was an important factor affecting FRLD in both monocropping and intercropping patterns.

4.4. Interspecific Competition

Crop competitiveness, especially in arid and semi-arid regions, may be related to the development of crop root systems [17]. We found that competitive relationships under intercropping systems change dynamically as crop competitiveness increases. Because soybean plants have a shorter developmental cycle than apple trees, apple trees are more competitive during this period than later, while soybean plants become progressively more competitive over time. We found that interspecific ecological niche competition reached a maximum at SS and that the most intense competition among species occurred at T100 in the horizontal direction and, in the vertical direction, in the 0–20 cm soil layer. It has been observed that interspecific interactions in apple–soybean intercropping systems cause the fine roots of intercropping apple trees to grow deeper into the soil (Figure 3), and many researchers have also suggested that this ecological niche differentiation of fine roots is beneficial in alleviating below-ground interspecific competition in apple–soybean intercropping systems and increasing the efficiency of resource use deeper in the soil [66,67]. In this study, soybean plants were found to be more competitive than fruit trees at the soil surface and at some distance from the trees, while fruit trees were more competitive in deeper soils. Therefore, when implementing agroforestry models, we need to consider enhancing water and nutrient recharge in locations and periods of intense competition, which will help alleviate competitive pressures between species and increase yields.

4.5. Crop Growth and Yield

Comparing MS and IS showed that intercropping increased the plant height and leaf area of soybeans and decreased the stem thickness of soybean before and during the growth period so that the biomass was concentrated in the stems. Studies had shown that reduced solar radiation availability leads to plants with a heightened understory and increases leaf ratio and size; these strategies are used by plants to intercept and absorb more solar radiation [68,69]. A previous study showed that high shading conditions reduced the transpiration flow of soybean plants, limiting the redistribution of nutrients and inhibiting photosynthesis, thereby resulting in an increase in flower abortion and, consequently, fewer pods per plant and a lower number of grains per plant [70]. In addition to environmental factors, different cropping patterns, irrigation and fertilizer application between MS and IS may also lead to differences in soybean yields. The apple trees in this study were 2–3 years old and at the young stage. The trees had no actual yield in the first year of the experiment, and in the second year of the experiment, there was no significant difference in yield and yield composition between monocropping and intercropping apples. This showed that intercropping in the irrigated agroforestry system had little effect on the yield of fruit trees. In this study, the LER of AS was 1.45 > 1, indicating that AS had planting advantages. The results indicated that the implementation of agroforestry in irrigated agriculture was conducive to maintaining soil moisture and that soil resources were evenly distributed in the overlapping areas of crops and trees, while under rainfed agroforestry conditions, the overlapping areas of crops and trees will cause the excessive consumption of resources, such as SWC [71]. The results of this study provide some technical guidance for the planting of agroforestry systems in young orchards under arid and semi-arid conditions in northwestern China and provide a further theoretical basis for the study of the relationship between fine roots, soil water, and soil nitrate nitrogen.
Under the influence of limited arable land resources, declining comparative returns [72], and import shocks [73], increasing soybean self-sufficiency is an urgent issue for the Chinese government to address. In 2016, China’s former Ministry of Agriculture issued the “Guidance of the Ministry of Agriculture on Promoting the Development of Soybean Production”, which stated that the layout of soybean production should be optimized to improve the quality, efficiency, and competitiveness of China’s soybean production. In 2021, China’s Ministry of Agriculture and Rural Affairs requested to overcome difficulties and expand the area dedicated to soybean oilseed crops, making the expansion of soybean oilseed crops a political priority to be completed by 2022. The Ministry has planned multiple measures to expand the acreage and increase production. Intercropping soybean with trees can mitigate the tradeoff between agricultural and orchard land and improve the replanting index of farmland. This may provide certain ideas for China to overcome the problem of limited areas for soybean planting.

5. Conclusions

Fine root distribution, soil water, and soil N were investigated for two cropping patterns (MA and AS) at different growth periods over two years, and crop growth and yield were investigated for MA, AS, and MS treatments. This study showed that differences between treatments were mainly concentrated in FS and SS, with AS having more fine roots in the field due to soybean cover compared to MA. Apple FRLD increased at T50 and T100, mainly in the 20–60 cm soil layer, and decreased at T150 and T200, mainly in the 0–40 cm soil layer. Intercropping increased SWC and reduced SNC in the soybean covered area, and intercropping increased SWC in the 0–20 cm soil layer and reduced SNC in all soil layers, while SWC and SNC were the main factors affecting FRLD. Competition between apple and soybean reached its maximum at the SS stage, with competition occurring mainly at 100 cm from the tree horizontally and in the 0–20 cm soil layer vertically. LER = 1.45 indicates a planting advantage for AS. Overall, apple–soybean intercropping altered the distribution of fine roots, increased SWC, and reduced SNC levels with high productivity. This study aims to provide some technical guidance for agroforestry complex planting in northwest China and to provide some theoretical basis for the study of the relationship between roots and water and nitrogen in agroforestry systems.

Author Contributions

Conceptualization, W.Z., Y.Z., T.T. and L.L.; methodology, W.Z. and L.S.; software, L.S.; validation, L.S. and X.W.; formal analysis, L.S.; investigation, L.S. and X.W.; resources, T.L. and W.W.; data curation, L.S. and S.Z.; writing—original draft preparation, L.S.; writing—review and editing, W.Z.; visualization, L.S.; supervision, W.Z.; project administration, W.Z. and L.L.; funding acquisition, W.Z. All authors have read and agreed to the published version of the manuscript.

Funding

This work was financially supported by the Innovation and Development Project of Shihezi University (CXFZ202008) and by the Special Funds of Agricultural Science and Technology of Huyanghe City (2022C18).

Data Availability Statement

The data presented in this study are available on request from the corresponding author.

Conflicts of Interest

The authors declare no conflict of interest.

References

  1. Malézieux, E.; Crozat, Y.; Dupraz, C.; Laurans, M.; Makowski, D.; Ozier-Lafontaine, H.; Rapidel, B.; Tourdonnet, S.; Valantin-Morison, M. Mixing plant species in cropping systems: Concepts, tools and models. A review. Agron. Sustain. Dev. 2009, 29, 43–62. [Google Scholar] [CrossRef]
  2. Pan, R.Z. Plant Physiology, 5th ed.; Higher Education Press: Beijing, China, 2004. [Google Scholar]
  3. Gao, X.; Wu, P.; Zhao, X.; Wang, J.; Shi, Y. Effects of Land Use on Soil Moisture Variations in a Semi-Arid Catchment: Implications for Land and Agricultural Water Management. Land Degrad. Dev. 2014, 25, 163–172. [Google Scholar] [CrossRef]
  4. Zhao, X.; Wu, P.; Gao, X.; Tian, L.; Li, H. Changes of soil hydraulic properties under early-stage natural vegetation recovering on the Loess Plateau of China. Catena 2014, 113, 386–391. [Google Scholar] [CrossRef]
  5. Lehmann, L.M.; Smith, J.; Westaway, S.; Pisanelli, A.; Russo, G.; Borek, R.; Sandor, M.; Gliga, A.; Smith, L.; Ghaley, B.B. Productivity and Economic Evaluation of Agroforestry Systems for Sustainable Production of Food and Non-Food Products. Sustainability 2020, 12, 5429. [Google Scholar] [CrossRef]
  6. Yang, J.F.; Zhang, T.R.; Wang, Y.J.; Zhang, R.Q.; Li, H.K. Intercropped relationship change the developmental pattern of apple and white clover. Bioengineered 2019, 10, 218–228. [Google Scholar] [CrossRef]
  7. Forey, O.; Temani, F.; Wery, J.; Jourdan, C.; Metay, A. Effect of combined deficit irrigation and grass competition at plantation on peach tree root distribution. Eur. J. Agron. 2017, 91, 16–24. [Google Scholar] [CrossRef]
  8. Fletcher, E.H.; Thetford, M.; Sharma, J.; Jose, S. Effect of root competition and shade on survival and growth of nine woody plant taxa within a pecan [Carya illinoinensis (Wangenh.) C. Koch] alley cropping system. Agrofor. Syst. 2012, 86, 49–60. [Google Scholar] [CrossRef]
  9. Abbasi, S.A.; Nazari, M.; Fallah, S.; Iranipour, R.; Mousavi, A. The competitive effect of almond trees on light and nutrients absorption, crop growth rate, and the yield in almond–cereal agroforestry systems in semi-arid regions. Agrofor. Syst. 2020, 94, 1111–1122. [Google Scholar] [CrossRef]
  10. Bouttier, L.; Paquette, A.; Messier, C.; Rivest, D.; Olivier, A.; Cogliastro, A. Vertical root separation and light interception in a temperate tree-based intercropping system of Eastern Canada. Agrofor. Syst. 2014, 88, 693–706. [Google Scholar] [CrossRef]
  11. Paul, C.; Weber, M.; Knoke, T. Agroforestry versus farm mosaic systems-Comparing land-use efficiency, economic returns and risks under climate change effects. Sci. Total Environ. 2017, 587, 22–35. [Google Scholar] [CrossRef]
  12. Zhu, X.; Liu, W.; Chen, J.; Bruijnzeel, L.A.; Mao, Z.; Yang, X.; Cardinael, R.; Meng, F.R.; Sidle, R.C.; Seitz, S.; et al. Reductions in water, soil and nutrient losses and pesticide pollution in agroforestry practices: A review of evidence and processes. Plant Soil 2019, 453, 45–86. [Google Scholar] [CrossRef]
  13. Abbas, G.; Ali, A.; Khan, M.; Mahmood, H.Z.; Wahab, S.A.; Amir-ud-Din, R. The Transition from Arid Farming Systems to Agroforestry Systems in Pakistan: A Comparison of Monetary Returns. Small–Scale For. 2021, 20, 325–350. [Google Scholar] [CrossRef]
  14. Pratiwi, A.; Suzuki, A. Reducing Agricultural Income Vulnerabilities through Agroforestry Training: Evidence from a Randomised Field Experiment in Indonesia. Bull. Indones. Econ. Stud. 2018, 55, 83–116. [Google Scholar] [CrossRef]
  15. Gao, L.; Xu, H.; Bi, H.; Xi, W.; Bao, B.; Wang, X.; Bi, C.; Chang, Y. Intercropping competition between apple trees and crops in agroforestry systems on the Loess Plateau of China. PLoS ONE 2018, 8, e70739. [Google Scholar] [CrossRef]
  16. Kubo, S.; Fuku, Y.; Shimamoto, T.; Kuwayama, A.; Ohya, M.; Amano, H.; Maruo, T.; Goto, T.; Komiya, T.; Kadota, K. Vascular Injury Caused by Retrieval of Ruptured and Detached Balloon Valvuloplasty Catheter During Transcatheter Aortic Valve Replacement. JACC Cardiovasc. Interv. 2017, 10, 1593–1595. [Google Scholar] [CrossRef]
  17. Sun, Y.; Bi, H.; Xu, H.; Duan, H.; Peng, R.; Wang, J. Variation of Fine Roots Distribution in Apple (Malus pumila M.)–Crop Intercropping Systems on the Loess Plateau of China. Agronomy 2018, 8, 280–295. [Google Scholar] [CrossRef]
  18. Mulia, R.; Dupraz, C. Unusual Fine Root Distributions of Two Deciduous Tree Species in Southern France: What Consequences for Modelling of Tree Root Dynamics? Plant Soil 2006, 281, 71–85. [Google Scholar] [CrossRef]
  19. Noordwijk, M.V.; Cadisch, G.; Ong, C.K. Below-Ground Interactions in Tropical Agroecosystems Concepts and Models with Multiple Plant Components; CABI Pub: Wallingford, UK; Cambridge, MA, USA, 2004. [Google Scholar]
  20. Xia, H.Y.; Zhao, J.H.; Sun, J.H.; Bao, X.G.; Christie, P.; Zhang, F.S.; Li, L. Dynamics of root length and distribution and shoot biomass of maize as affected by intercropping with different companion crops and phosphorus application rates. Field Crops Res. 2013, 150, 52–62. [Google Scholar] [CrossRef]
  21. Baptista, I.; Ritsema, C.; Querido, A.; Ferreira, A.D.; Geissen, V. Improving rainwater-use in Cabo Verde drylands by reducing runoff and erosion. Geoderma 2015, 1, 237–297. [Google Scholar] [CrossRef]
  22. Yao, S.; Merwin, I.A.; Bird, G.W.; Abawi, G.S.; Thies, J.E. Orchard floor management practices that maintain vegetative or biomass groundcover stimulate soil microbial activity and alter soil microbial community composition. Plant Soil 2005, 271, 377–389. [Google Scholar] [CrossRef]
  23. Ling, Q.; Gao, X.; Zhao, X.; Huang, J.; Li, H.; Li, L.; Sun, W.; Wu, P. Soil water effects of agroforestry in rainfed jujube (Ziziphus jujube Mill.) orchards on loess hillslopes in Northwest China. Agr. Ecosyst. Environagr. Ecosyst. Environ. 2017, 247, 343–351. [Google Scholar] [CrossRef]
  24. Zhao, Y.; Zhang, B.; Hill, R. Water use assessment in alley cropping systems within subtropical China. Agrofor. Syst. 2012, 84, 243–259. [Google Scholar] [CrossRef]
  25. Pavlidis, G.; Tsihrintzis, V.A. Environmental Benefits and Control of Pollution to Surface Water and Groundwater by Agroforestry Systems: A review. Water Resour Manag 2017, 32, 1–29. [Google Scholar] [CrossRef]
  26. Rodriguez, C.; Carlsson, G.; Englund, J.E.; Flöhr, A.; Pelzer, E.; Jeuffroy, M.H.; Makowski, D.; Jensen, E.S. Grain legume-cereal intercropping enhances the use of soil-derived and biologically fixed nitrogen in temperate agroecosystems. A meta-analysis. Eur. J. Agron. 2020, 118, 126077. [Google Scholar] [CrossRef]
  27. Zhang, D.; Du, G.; Sun, Z.; Bai, W.; Wang, Q.; Feng, L.; Zheng, J.; Zhang, Z.; Liu, Y.; Yang, S.; et al. Agroforestry enables high efficiency of light capture, photosynthesis and dry matter production in a semi-arid climate. Eur. J. Agron. 2018, 94, 1–11. [Google Scholar] [CrossRef]
  28. Phiri, A.T.; Njira, K. Grain Legume-Based Cropping Systems’ Effects on Soil Organic Carbon and Nutrient Dynamics. Agric. Res. 2022, 12, 45–52. [Google Scholar] [CrossRef]
  29. Chamkhi, I.; Cheto, S.; Geistlinger, J.; Zeroual, Y.; Kouisni, L.; Bargaz, A.; Ghoulam, C. Legume-based intercropping systems promote beneficial rhizobacterial community and crop yield under stressing conditions. Ind. Crops Prod. 2022, 183, 114958. [Google Scholar] [CrossRef]
  30. Muoni, T.; Jonsson, M.; Duncan, A.J.; Watson, C.A.; Bergkvist, G.; Barnes, A.P.; Oborn, I. Effects of management practices on legume productivity in smallholder farming systems in sub-Saharan Africa. Food Energy Secur. 2022, 11, e366. [Google Scholar] [CrossRef]
  31. Chen, C.; Liu, W.; Wu, J.; Jiang, X.; Zhu, X. Can intercropping with the cash crop help improve the soil physico-chemical properties of rubber plantations? Geoderma 2019, 335, 149–160. [Google Scholar] [CrossRef]
  32. Li, L.P.; Hai, Y.; Anwar, M.; Tang, Z.Y.; Fang, J.Y. Community Structure and Conservation of Wild Fruit Forests in the Ili Valley, Xinjiang. Arid Zone Res. 2011, 28, 7–13. (In Chinese) [Google Scholar]
  33. Smit, A.L. Root Methods : A Handbook; Springer: Berlin, Germany; New York, NY, USA, 2000. [Google Scholar]
  34. Wu, F.; Liao, B.W.; Chen, Y.J.; Jiang, Z.M.; Guo, Y.P.; Li, M. Niches of nine mangrove species in a Sonneratia apetala-colonized area of Dongzhai Harbor, Hainan Island, China. Ecol. Evol. 2020, 10, 11838–11846. [Google Scholar] [CrossRef]
  35. Lu, R.K. Soil Agrochemical Analysis Methods; China Agricultural Science and Technology Press: Beijing, China, 2000. [Google Scholar]
  36. Tofinga, M.P.; Paolini, R.; Snaydon, R.W. A study of root and shoot interactions between cereals and peas in mixtures. J. Agr. Sci. 1993, 120, 13–24. [Google Scholar] [CrossRef]
  37. Seran, T.H.; Brintha, I. Review on maize based intercropping. J. Agron. Crops Sci. 2010, 9, 135–145. [Google Scholar]
  38. Yang, C.; Chai, Q.; Huang, G. Root distribution and yield responses of wheat/maize intercropping to alternate irrigation in the arid areas of Northwest China. Plant Soil Environ. 2010, 56, 253–262. [Google Scholar] [CrossRef]
  39. McCormack, M.L.; Dickie, I.A.; Eissenstat, D.M.; Fahey, T.J.; Fernandez, C.W.; Guo, D.L.; Helmisaari, H.S.; Hobbie, E.A.; Iversen, C.M.; Jackson, R.B.; et al. Redefining fine roots improves understanding of below-ground contributions to terrestrial biosphere processes. New Phytol. 2015, 207, 505–518. [Google Scholar] [CrossRef]
  40. Li, X.; Šimůnek, J.; Shi, H.; Yan, J.; Peng, Z.; Gong, X. Spatial distribution of soil water, soil temperature, and plant roots in a drip-irrigated intercropping field with plastic mulch. Eur. J. Agron. 2017, 83, 47–56. [Google Scholar] [CrossRef]
  41. Forey, O.; Metay, A.; Bertrand, N.; Wery, J. Two years old peach trees intercropped with a grass mixture can grow through a lithic discontinuity to access water the grass cannot. Agrofor. Syst. 2021, 95, 151–163. [Google Scholar] [CrossRef]
  42. Yun, L.; Bi, H.; Gao, L.; Zhu, Q.; Ma, W.; Cui, Z.; Wilcox, B.P. Soil Moisture and Soil Nutrient Content in Walnut-Crop Intercropping Systems in the Loess Plateau of China. Arid Land Res. Manag. 2012, 26, 285–296. [Google Scholar] [CrossRef]
  43. Huang, Z.; Liu, Y.; Qiu, K.; López-Vicente, M.; Shen, W.; Wu, G.L. Soil-water deficit in deep soil layers results from the planted forest in a semi-arid sandy land: Implications for sustainable agroforestry water management. Agr. Water Manag. 2021, 254, 106985. [Google Scholar] [CrossRef]
  44. Bosi, C.; Pezzopane, J.R.M.; Sentelhas, P.C. Soil water availability in a full sun pasture and in a silvopastoral system with eucalyptus. Agrofor. Syst. 2019, 94, 429–440. [Google Scholar] [CrossRef]
  45. Thierfelder, C.; Chivenge, P.; Mupangwa, W.; Rosenstock, T.S.; Lamanna, C.; Eyre, J.X. How climate-smart is conservation agriculture (CA)?—Its potential to deliver on adaptation, mitigation and productivity on smallholder farms in southern Africa. Food Secur. 2017, 9, 537–560. [Google Scholar] [CrossRef]
  46. Rachman, A.; Anderson, S.H.; Gantzer, C.J.; Alberts, E.E. Soil hydraulic properties influenced by stiff-stemmed grass hedge systems. Soil Sci. Soc. Am. J. 2004, 68, 1386–1393. [Google Scholar] [CrossRef]
  47. Walsh, B.D.; Salmins, S.; Buszard, D.J.; Mackenzie, A.F. Impact of soil management systems on organic dwarf apple orchards and soil aggregate stability bulk density, temperature and water content. Can. J. Soil Sci. 1996, 76, 203–209. [Google Scholar] [CrossRef]
  48. Hanson, B.; May, D. Effect of subsurface drip irrigation on processing tomato yield, water table depth, soil salinity, and profitability. Agric. Water Manag. 2004, 68, 1–17. [Google Scholar] [CrossRef]
  49. El-Nesr, M.N.; Alazba, A.A.; Šimůnek, J. HYDRUS simulations of the effects of dual-drip subsurface irrigation and a physical barrier on water movement and solute transport in soils. Irrig. Sci. 2014, 32, 111–125. [Google Scholar] [CrossRef]
  50. Campi, P.; Palumbo, A.D.; Mastrorilli, M. Effects of tree windbreak on microclimate and wheat productivity in a Mediterranean environment. Eur. J. Agron. 2009, 30, 220–227. [Google Scholar] [CrossRef]
  51. Lin, B.B. The role of agroforestry in reducing water loss through soil evaporation and crop transpiration in coffee agroecosystems. Agr. Forest Meteorol. 2010, 150, 510–518. [Google Scholar] [CrossRef]
  52. Teodoro, A.V.; Sousa-Souto, L.; Klein, A.M.; Tscharntke, T. Seasonal contrasts in the response of coffee ants to agroforestry shade-tree management. Environ. Entomol. 2010, 39, 1744–1750. [Google Scholar] [CrossRef]
  53. Schwab, N.; Schickhoff, U.; Fischer, E. Transition to agroforestry significantly improves soil quality: A case study in the central mid-hills of Nepal. Agr. Ecosyst. Environ. 2015, 205, 57–69. [Google Scholar] [CrossRef]
  54. Fredes, I.; Moreno, S.; Díaz, F.P.; Gutiérrez, R.A. Nitrate signaling and the control of Arabidopsis growth and development. Curr. Opin. Plant Biol. 2019, 47, 112–118. [Google Scholar] [CrossRef]
  55. Miller, A.J.; Cramer, M.D. Root Nitrogen Acquisition and Assimilation. Plant Soil 2005, 274, 1–36. [Google Scholar] [CrossRef]
  56. Zhu, L.X.; Zhang, W.J. Effects of Controlled-Release Urea Combined with Conventional Urea on Nitrogen Uptake, Root Yield, and Quality of Platycodon Grandiflorum. J. Plant Nutr. 2017, 40, 662–672. [Google Scholar] [CrossRef]
  57. Fan, P.P.; Jiang, Y.X. Nitrogen dynamics differed among the first six root branch orders of Fraxinus mandshurica and Larix gmelinii during short-term decomposition. J. Plant Res. 2010, 123, 433–438. [Google Scholar] [CrossRef]
  58. Wang, Y.S.; Liu, F.L.; Neergaard, A.; Jensen, L.S.; Luxhøi, J.; Jensen, C.R. Alternate partial root-zone irrigation induced dry/wet cycles of soils stimulate N mineralization and improve N nutrition in tomatoes. Plant Soil 2010, 337, 167–177. [Google Scholar] [CrossRef]
  59. Ramachandran, N.P.K.; Mohan, K.B.; Nair, V.D. Agroforestry as a strategy for carbon sequestration. J. Plant Nutr. Soil 2009, 172, 10–23. [Google Scholar] [CrossRef]
  60. Li, J.; Zhang, J.; Rao, M. Modeling of waterflow and nitrate transport under surface drip fertigation. Trans. Asae 2005, 48, 627–637. [Google Scholar]
  61. Kahlon, M.S.; Josan, A.S.; Khera, K.L. A comparative study on soil and plant parameters under furrow and drip irrigated tomatoes with poor quality water. Res. Crops 2008, 9, 62–72. [Google Scholar]
  62. Li, J.S.; Zhang, J.J.; Rao, M.J. Simulation of water and nitrate transport under drip irrigation using HYDRUS-2D-model verification. In Proceedings of the 7th International Conference on Environment and Water, Beijing, China, 11–14 October 2004; pp. 221–229. [Google Scholar]
  63. Wang, Z.; Li, J.; Li, Y. Effects of drip irrigation system uniformity and nitrogen applied on deep percolation and nitrate leaching during growing seasons of spring maize in semi-humid region. Irrig. Sci. 2014, 32, 221–236. [Google Scholar] [CrossRef]
  64. Yang, B.; Meng, X.; Singh, A.K.; Wang, P.; Song, L.; Zakari, S.; Liu, W. Intercrops improve surface water availability in rubber-based agroforestry systems. Agric. Ecosyst. Environ. 2020, 298, 106937. [Google Scholar] [CrossRef]
  65. Lopez-Diaz, M.L.; Rolo, V.; Moreno, G. Trees’ role in nitrogen leaching after organic, mineral fertilization: A greenhouse experiment. J. Environ. Qual. 2011, 40, 853–859. [Google Scholar] [CrossRef]
  66. Livesley, S.J.; Gregory, P.J.; Buresh, R.J. Competition in tree row agroforestry systems. 1. Distribution and dynamics of fine root length and biomass. Plant Soil 2000, 227, 149–161. [Google Scholar] [CrossRef]
  67. Xu, H.S.; Bi, H.X.; Xi, W.M.; Powell, R.L.; Gao, L.B.; Yu, L. Root Distribution Variation of Crops under Walnut-Based Intercropping Systems in the Loess Plateau of China. Pak. J. Agr. Sci. 2014, 51, 773–778. [Google Scholar]
  68. Sgarbossa, J.; Elli, E.F.; Schwerz, F.; Nardini, C.; Miguel, K.F.; Schmidt, D.; Dal, A.; Caron, B.O. Bean–soybean succession under full sun and in agroforestry systems: Impacts on radiation use efficiency, growth and yield. J. Agron. Crops Sci. 2020, 207, 362–377. [Google Scholar] [CrossRef]
  69. Wu, Y.; Gong, W.; Yang, W. Shade Inhibits Leaf Size by Controlling Cell Proliferation and Enlargement in Soybean. Sci. Rep. 2017, 7, 9259. [Google Scholar] [CrossRef]
  70. Caron, B.O.; Sgarbossa, J.; Schwerz, F.; Elli, E.F.; Eloy, E.; Behling, A. Dynamics of solar radiation and soybean yield in agroforestry systems. An. Acad. Bras. Ciências 2018, 90, 3799–3812. [Google Scholar] [CrossRef]
  71. Ling, Q.; Zhao, X.; Wu, P.; Gao, X.; Sun, W. Effect of the fodder species canola (Brassica napus L.) and daylily (Hemerocallis fulva L.) on soil physical properties and soil water content in a rainfed orchard on the semiarid Loess Plateau, China. Plant Soil 2019, 453, 209–228. [Google Scholar] [CrossRef]
  72. Liu, C.Q. Challenges and Countermeasures for the supply security of important agricultural products in China. Econ. Asp. 2021, 5, 61–73. (In Chinese) [Google Scholar]
  73. Chen, Y.F.; Wang, J.Y.; Zhang, F.G. Globalization and the new pattern of food security. J. Nat. Resour. 2021, 36, 1362–1380. (In Chinese) [Google Scholar]
Figure 1. The location of the study site.
Agronomy 13 00548 g001
Figure 2. Diagram of a soybean–apple intercropping system.
Agronomy 13 00548 g002
Figure 3. Two–dimensional fine root length density distribution in different growth stages in MA and AS systems. BS: branching stage (left: a,d), FS: flowering-podding stage (b,e); SS: seed filling stage (right: c,f); in the 2020 (top) and 2021 (bottom) seasons.
Agronomy 13 00548 g003
Figure 4. Two–dimensional SWC distribution in different growth stages of MA and AS system. (left: a,d,g,j) Soybean branching stage; (b,e,h,k) soybean flowering-podding stage; (right: c,f,i,l) seed filling stage; 2020 MA (ac), 2020 AS (df), 2021 MA (gi), 2021 AS (jl).
Agronomy 13 00548 g004
Figure 5. Two–dimensional soil NO3−N content distribution in different growth stages of MA and AS systems. (left: a,d,g,j) Soybean branching stage; (b,e,h,k) soybean flowering-podding stage; (right: c,f,i,l) seed filling stage; 2020 MA (ac), 2020 AS (df), 2021 MA (gi), 2021 AS (jl).
Agronomy 13 00548 g005
Figure 6. Competitiveness index of apple–soybean agroforestry system in the vertical direction. Las: competitiveness index of apple to soybean; Lsa: competitiveness index of soybean to apple. Lowercase letters indicate the significance analysis of different soil depths of the same species (p < 0.05). Capital letters indicate the significance analysis of the same soil depth for different species (p < 0.05).
Agronomy 13 00548 g006
Figure 7. Competitiveness index of apple–soybean agroforestry system in the horizontal direction. Las: competitiveness index of apple to soybean; Lsa: competitiveness index of soybean to apple. Lowercase letters indicate the significance analysis of different soil depths of the same species (p < 0.05). Capital letters indicate the significance analysis of the same soil depth for different species (p < 0.05).
Agronomy 13 00548 g007
Figure 8. Dynamic changes in the plant height, stem thickness, and leaf area of soybean under different planting patterns in 2020 and 2021. BS: branching stage, FS: flowering-podding stage, and SS: seed filling stage.
Agronomy 13 00548 g008
Table 1. Results of correlation analysis of fine root density and different influencing factors.
TreatmentsIndexFRLDSWCSNCSDHDST
MAFRLD1
SWC0.497 **1
SNC−0.477 **−0.280 **1
SD0.044−0.320.439 **1
HD−0.871 **0.484 **−0.535 **01
ST0.177 **0.357 **−0.132001
ASFRLD1
SWC0.452 **1
SNC0.168 *−0.1151
SD0.1190.490 **0.1141
HD−0.854 **−0.342 **−0.167 *01
ST0.165 *0.283 **−0.373 **001
MA: monocropping apple, AS: apple–soybean intercropping, FRLD: fine root length density, SWC: soil water content, SNC: soil NO3−N content, SD: soil depth, HD: horizontal distance, ST: sampling time (n = 36). * Significant at 5% (p < 0.05). ** Very significant at 1% (p < 0.01).
Table 2. Results of multiple linear regression analysis of fine root density and different influencing factors.
TreatmentModelNonstandardized
Coefficient
Standardized Coefficient tSig.Multicol
Linearity
Model Parameters
BStandard Error ToleanceVIFR2Sig.
MAConstant0.301 0.028 10.666 2 × 10⁻²¹ 0.78974.2199 × 10−71
SWC0.003 0.001 0.080 2.125 0.0350.689 1.451
SNC0.0000533 0.000 0.019 0.495 0.6210.632 1.582
HD−0.097 0.005 −0.837 −20.503 4 × 10−520.587 1.705
ST0.015 0.003 0.194 5.570 8 × 10−80.806 1.241
ASConstant0.173 0.033 5.218 4 × 10⁻⁷ 0.77898.11 × 10−69
SWC0.008 0.002 0.152 4.220 4 × 10−50.798 1.254
SNC0.00038970.000 0.117 3.308 0.0010.828 1.208
HD−0.086 0.004 −0.782 −22.345 2 × 10−570.839 1.192
ST0.012 0.003 0.165 4.613 7 × 10−60.802 1.247
MA: monocropping apple, AS: apple–soybean intercropping, SWC: soil water content, SNC: soil NO3−N content, HD: horizontal distance, ST: sampling time (n = 36).
Table 3. Soybean and apple yield and yield composition factors under different planting patterns in 2020 and 2021.
YearsTreatmentPlant Number · ha−1 Trees Number · ha−1No. of Pods·Plant−1 No. of Fruits·Plant−1No. of Seed·Pod−1100-Grain Weight (g)
Single Fruit Weight (g)
Yield (kg · ha−1)
2020Monocropping
soybean
2.4 × 10540.63 ± 7.96 a2.3 ± 0.80 a29.74 ± 0.76 b6636.51 ± 590.56 b
Intercropping
soybean
1.1 × 10544.2 ± 12.38 a2.96 ± 0.90 b26.50 ± 0.68 a3759.91 ± 338.53 a
2021Monocropping
soybean
2.4 × 10540.74 ± 7.85 a2.47 ± 0.80 a30.04 ± 0.88 b7243.20 ± 623.99 b
Intercropping
soybean
1.1 × 10544.7 ± 10.44 a2.88 ± 0.94 a26.9 ± 0.87 a3815.04 ± 349.07 a
Monocropping
apple
6758.44 ± 1.06 a 227.62 ± 14.43 a1296.75 ± 163.34 a
Intercropping apple6757.94 ± 0.95 a 217.64 ± 10.95 a1148.44 ± 97.82 a
Letters indicate significance analysis between treatments (p < 0.05).
Disclaimer/Publisher’s Note: The statements, opinions and data contained in all publications are solely those of the individual author(s) and contributor(s) and not of MDPI and/or the editor(s). MDPI and/or the editor(s) disclaim responsibility for any injury to people or property resulting from any ideas, methods, instructions or products referred to in the content.

