Article

Effects of Superphosphate as an Additive on Nutrient Characteristics and NH3, CO2, CH4, and N2O Emissions during Pig Manure Composting

College of Agriculture, Henan University of Science and Technology, Luoyang 471000, China
*
Author to whom correspondence should be addressed.
Agronomy 2023, 13(2), 560; https://doi.org/10.3390/agronomy13020560
Submission received: 4 January 2023 / Revised: 7 February 2023 / Accepted: 13 February 2023 / Published: 15 February 2023

Abstract

:
Nutrient conservation and greenhouse gas emission control during composting have attracted much attention. This study investigated the effects of different amounts of superphosphate (SSP) on greenhouse gas emissions and the dynamic changes in nutrients during pig manure composting. Six treatments were used: pig manure + straw (S1), pig manure + straw + 3% SSP (S2), pig manure + straw + 6% SSP (S3), pig manure (M1), pig manure + 3% SSP (M2), and pig manure + 6% SSP (M3). The results showed that the addition of SSP had no negative effect on organic matter composting, and all treatments met the requirement of being harmless. The contents of TN, TP, and TK increased during the composting process, but the content of organic matter decreased gradually. At the end of composting, the total nutrient content of the pig manure + straw + 6% SSP treatment was the highest (6.39%), while that of the pig manure treatment was the lowest (4.47%). The NH3 emission reductions with additions of 3% and 6% SSP were 37.13~56.80% and 45.63~77.04%, respectively, compared with the pig manure treatment. The treatment addition of 6% SSP reduced CO2 emissions by 10.3~20.1% compared with the pig manure treatment. The pig manure + 6% SSP treatment resulted in the lowest cumulative emission of N2O, which was 79.75% lower than that of the pig manure treatment. For the cumulative emission of CH4, the treatment of pig manure + 6% SSP was at least 23.14 mg·kg−1 and had the lowest global warming potential. In conclusion, adding 6% SSP to pig manure compost effectively reduces NH3 and CO2 emissions and improves compost quality.

1. Introduction

The livestock and poultry breeding industry carries out large-scale and intensive agricultural production in China [1], which consequently has led to the output of large amounts of livestock manure [2]. The serious environmental pollution caused by this output has attracted much attention [3,4]. Aerobic composting is considered to be an effective way to realize the harmless treatment and recycling of livestock manure. However, the large amounts of NH3 and greenhouse gases (CO2, CH4, and N2O) produced during the composting process restrict the recycling of nutrients and cause air pollution [5,6].
In recent years, the emission characteristics and control of NH3, CO2, CH4, and N2O during composting have become a focus of research. During the process of composting livestock manure, a large number of gases, such as NH3, CO2, CH4, and N2O, are produced by the aerobic degradation of organic matter. The emissions of the above gases are regulated by a variety of factors, including temperature, pH [7], moisture content [8], and additives [9]. It has been reported that approximately 16–74% of the initial total nitrogen is lost during the composting process, and 0.1–9.9% of the initial total nitrogen is lost as N2O. The amount of CH4 produced accounts for approximately 0.8–6% of the total carbon mass during the aerobic composting process [10]. Therefore, reducing NH3 and greenhouse gas emissions during composting is a requirement for high-quality composting.
Studies have shown that chemical additives such as phosphogypsum, magnesium hydroxide, and superphosphate (SSP) are able to reduce nitrogen loss during manure composting [11,12]. For example, some studies showed that SSP can affect nitrogen conservation [13] and GHG emissions [14]. However, there were inconsistent findings on the impact of the use of such additives on greenhouse gas emissions. Cao et al. [15] demonstrated that the addition of SSP was able to effectively reduce nitrogen in the form of nitrogenous gases. Li et al. [16] found that the addition of SSP reduced the emission of NH3 but increased the emission of N2O. It is generally believed that the addition of SSP in the composting process plays a crucial role in NH3 volatilization, reducing NH3 volatilization by reducing the pH of compost, but it is closely related to its dosage. The excessive addition of SSP may increase the nutrient content of the compost but may also adversely affect the compost and lead to increased greenhouse gas emissions [17]. Therefore, determining the appropriate amount of SSP is the key parameter. Limited studies have investigated the addition of different quantities of SSP in compost to evaluate how it affects NH3, CO2, CH4, and N2O emissions. Furthermore, little research has been focused on the two composting scenarios of pig manure and pig manure + straw at the same time. Hence, in this study, different concentrations of SSP addition under two composting modes are used, in order to (i) clarify the change in nutrient characteristics during composting; (ii) investigate the effect of NH3, CO2, CH4, and N2O emissions; and (iii) determine the appropriate amount of SSP to improve the quality of compost and reduce the above gas emissions.

2. Materials and Methods

2.1. Materials and Design

The materials used in this study included fresh pig manure and cornstalks. Fresh pig manure was collected from a large pig farm in Luoyang, Henan Province, China, with a moisture content of approximately 75%. The dry straw was crushed to a size of 0.5~1 cm and then evenly mixed with a dry weight ratio of 1.5:1; the total fresh weight was 28 kg. The characteristics of the raw materials are shown in Table 1. The SSP used in this study was purchased from Yunnan Anning Yunke Fertilizer Co., Ltd., (Yunnan, China), with effective P2O5 ≥ 16.0%. The composting experiment was carried out on the farm of Henan University of Science and Technology with a homemade composting device.
It was previously found that 9.6–46% of the initial TN content is lost as NH3 [18,19], according to the reasonable molar addition of phosphate at 10~20% of the initial TN content [20]; thus, the concentration range of SSP addition was approximately 3~6%. Therefore, six treatments were used: pig manure + straw (S1), pig manure + straw + 3% SSP (S2), pig manure + straw + 6% SSP (S3), pig manure (M1), pig manure + 3% SSP (M2), and pig manure + 6% SSP (M3), with M1 as the control. The amount of SSP added was the dry weight of the raw materials. The composting experiment lasted for 60 days from 12 July to 10 September 2021. M1, M2, and M3 were treatment groups with pig manure as M treatment. S1, S2, and S3 were treatment groups with pig manure and straw as S treatment.

2.2. Composting Device and Implementation

A schematic diagram of the homemade composting device is shown in Figure 1. The device was made of Plexiglas with a volume of 75 L (inner diameter of 0.38 m and height of 0.6 m). The top of the device was equipped with a temperature measurement port and an exhaust port, and three sampling ports were set at 18, 36, and 50 cm away from the top on the side of the device. A sieve plate with a 1 mm hole was installed at the bottom of the device to support the compost raw materials, and ceramsite with a diameter of 5~8 mm and a thickness of 2 cm was laid on the sieve plate. The ceramsite and the compost material were separated by a nylon mesh with a diameter of 2 mm. The bottom of the device was provided with a vent and a drainage port, and the vent was connected to a flowmeter and an air pump. In addition, in order to reduce the heat loss of the compost, a sponge with a thickness of 5 cm was used as an insulation layer on the outer layer of the device.
After the main materials and additions of the compost were manually mixed, the moisture content of the materials was adjusted to 65%, and then the above materials were put into the homemade composting device. In order to avoid the influence of ambient temperature, the temperature was measured at 8:00 and 17:00 every day, as taking the average value of temperature at two time points can more accurately represent the temperature of the reactor. After composting started, aeration was carried out every other day at a rate of 3.6 m3·h−1 for 20 min, and aeration was stopped when the temperature of the compost dropped to 40 °C. Additionally, the compost was manually turned every 7 days. When the temperature of the compost changed slowly and approached the ambient temperature, the compost materials were removed from the device and put into the foam box for post-decomposition fermentation.

2.3. Sampling and Analyses

Solid samples were collected on the 0th, 7th, 11th, 20th, 40th, and 60th days of composting. To make the samples representative, stainless steel grain detector samplers of different lengths were used according to the height of the compost to ensure that samples were collected. Amounts of approximately 200 g were collected and mixed evenly as a sample of the compost. The samples were divided into two parts: one was stored as a fresh sample at 4 °C, and the other was air-dried, ground, and sieved for the determination of nutrient content. The basic physical and chemical properties were determined according to Organic Fertilizer Standard NY 525-2012 [21]. pH was determined using a pH meter at a solid–liquid ratio of 1:10, and EC was determined using a conductivity meter. TN was determined by the Kjeldahl nitrogen method. TP was determined by the molybdenum yellow colorimetric method. TK was determined by flame photometry. Organic matter was determined by the potassium dichromate capacity method.
Greenhouse gases and NH3 were collected from the top of the device at 8:00 every day. NH3 was measured with a portable gas detector T-1800, greenhouse gases were collected with a 50 mL gas sampling bag, and CO2, CH4, and N2O were analyzed with a gas chromatograph (Agilent 7890B). It was assumed that the average rate obtained during the collection hour was representative of the whole day. Gas samples were collected 15 times on days 1–12, 15, 17 and 20. During the post-decomposition period, the gas samples were no longer collected because the reaction in the compost tended to be flat. At this stage, the composts were turned over every 10 days until the end of the 60-day composting experiment.

2.4. Data Processing and Analysis

Between-treatment comparisons were performed with analysis of variance and multiple comparisons using the mean of three replicates. Excel 2010 (Washington, USA) was used for data sorting and statistical analysis, SPSS 17.0 (Chicago, IL, USA) was used for significant analysis and multiple comparisons (p < 0.05), and Origin 2021 (Northampton, MA, USA) was used for graph drawing. The gas emission rate was calculated as follows:
F = ρ·V·(dc/dt)·273/(273 + T)/m
where F is the emission rate of measured gas, mg·(kg·h)−1; ρ is the density of the measured gas under the standard state (NH3 is 0.771 kg·m−3, N2O is 1.978 kg·m−3, CO2 is 1.977 kg·m−3, CH4 is 0.717 kg·m−3); V is the volume of the sampling headspace, m3; dc/dt is the change rate of gas concentration during the sampling time; T is the internal temperature in the composting process, ℃; and m is the dry mass of the compost, kg.
The cumulative gas emissions were calculated as follows:
Q = Σ∆fi·ti, ∆fi = (fi-1 + fi)/2
where Q is the cumulative gas emission, mg·kg−1; ti is the sampling interval from Day i-1 to Day i (t0 represents the day of establishing compost), h; ∆fi is the average emission rate during the sampling period from Day i-1 to Day i, mg·(kg·h)−1; and f0 is taken as 0.
The global warming potential (GWP) was calculated as follows:
GWP = fCO2 + 25·fCH4 + 298·fN2O
where f is the total emission amount of greenhouse gases during the composting process, kg·Mg−1.

3. Results

3.1. Changes in Physicochemical Characteristics during Composting

3.1.1. Changes in Temperature, pH, EC

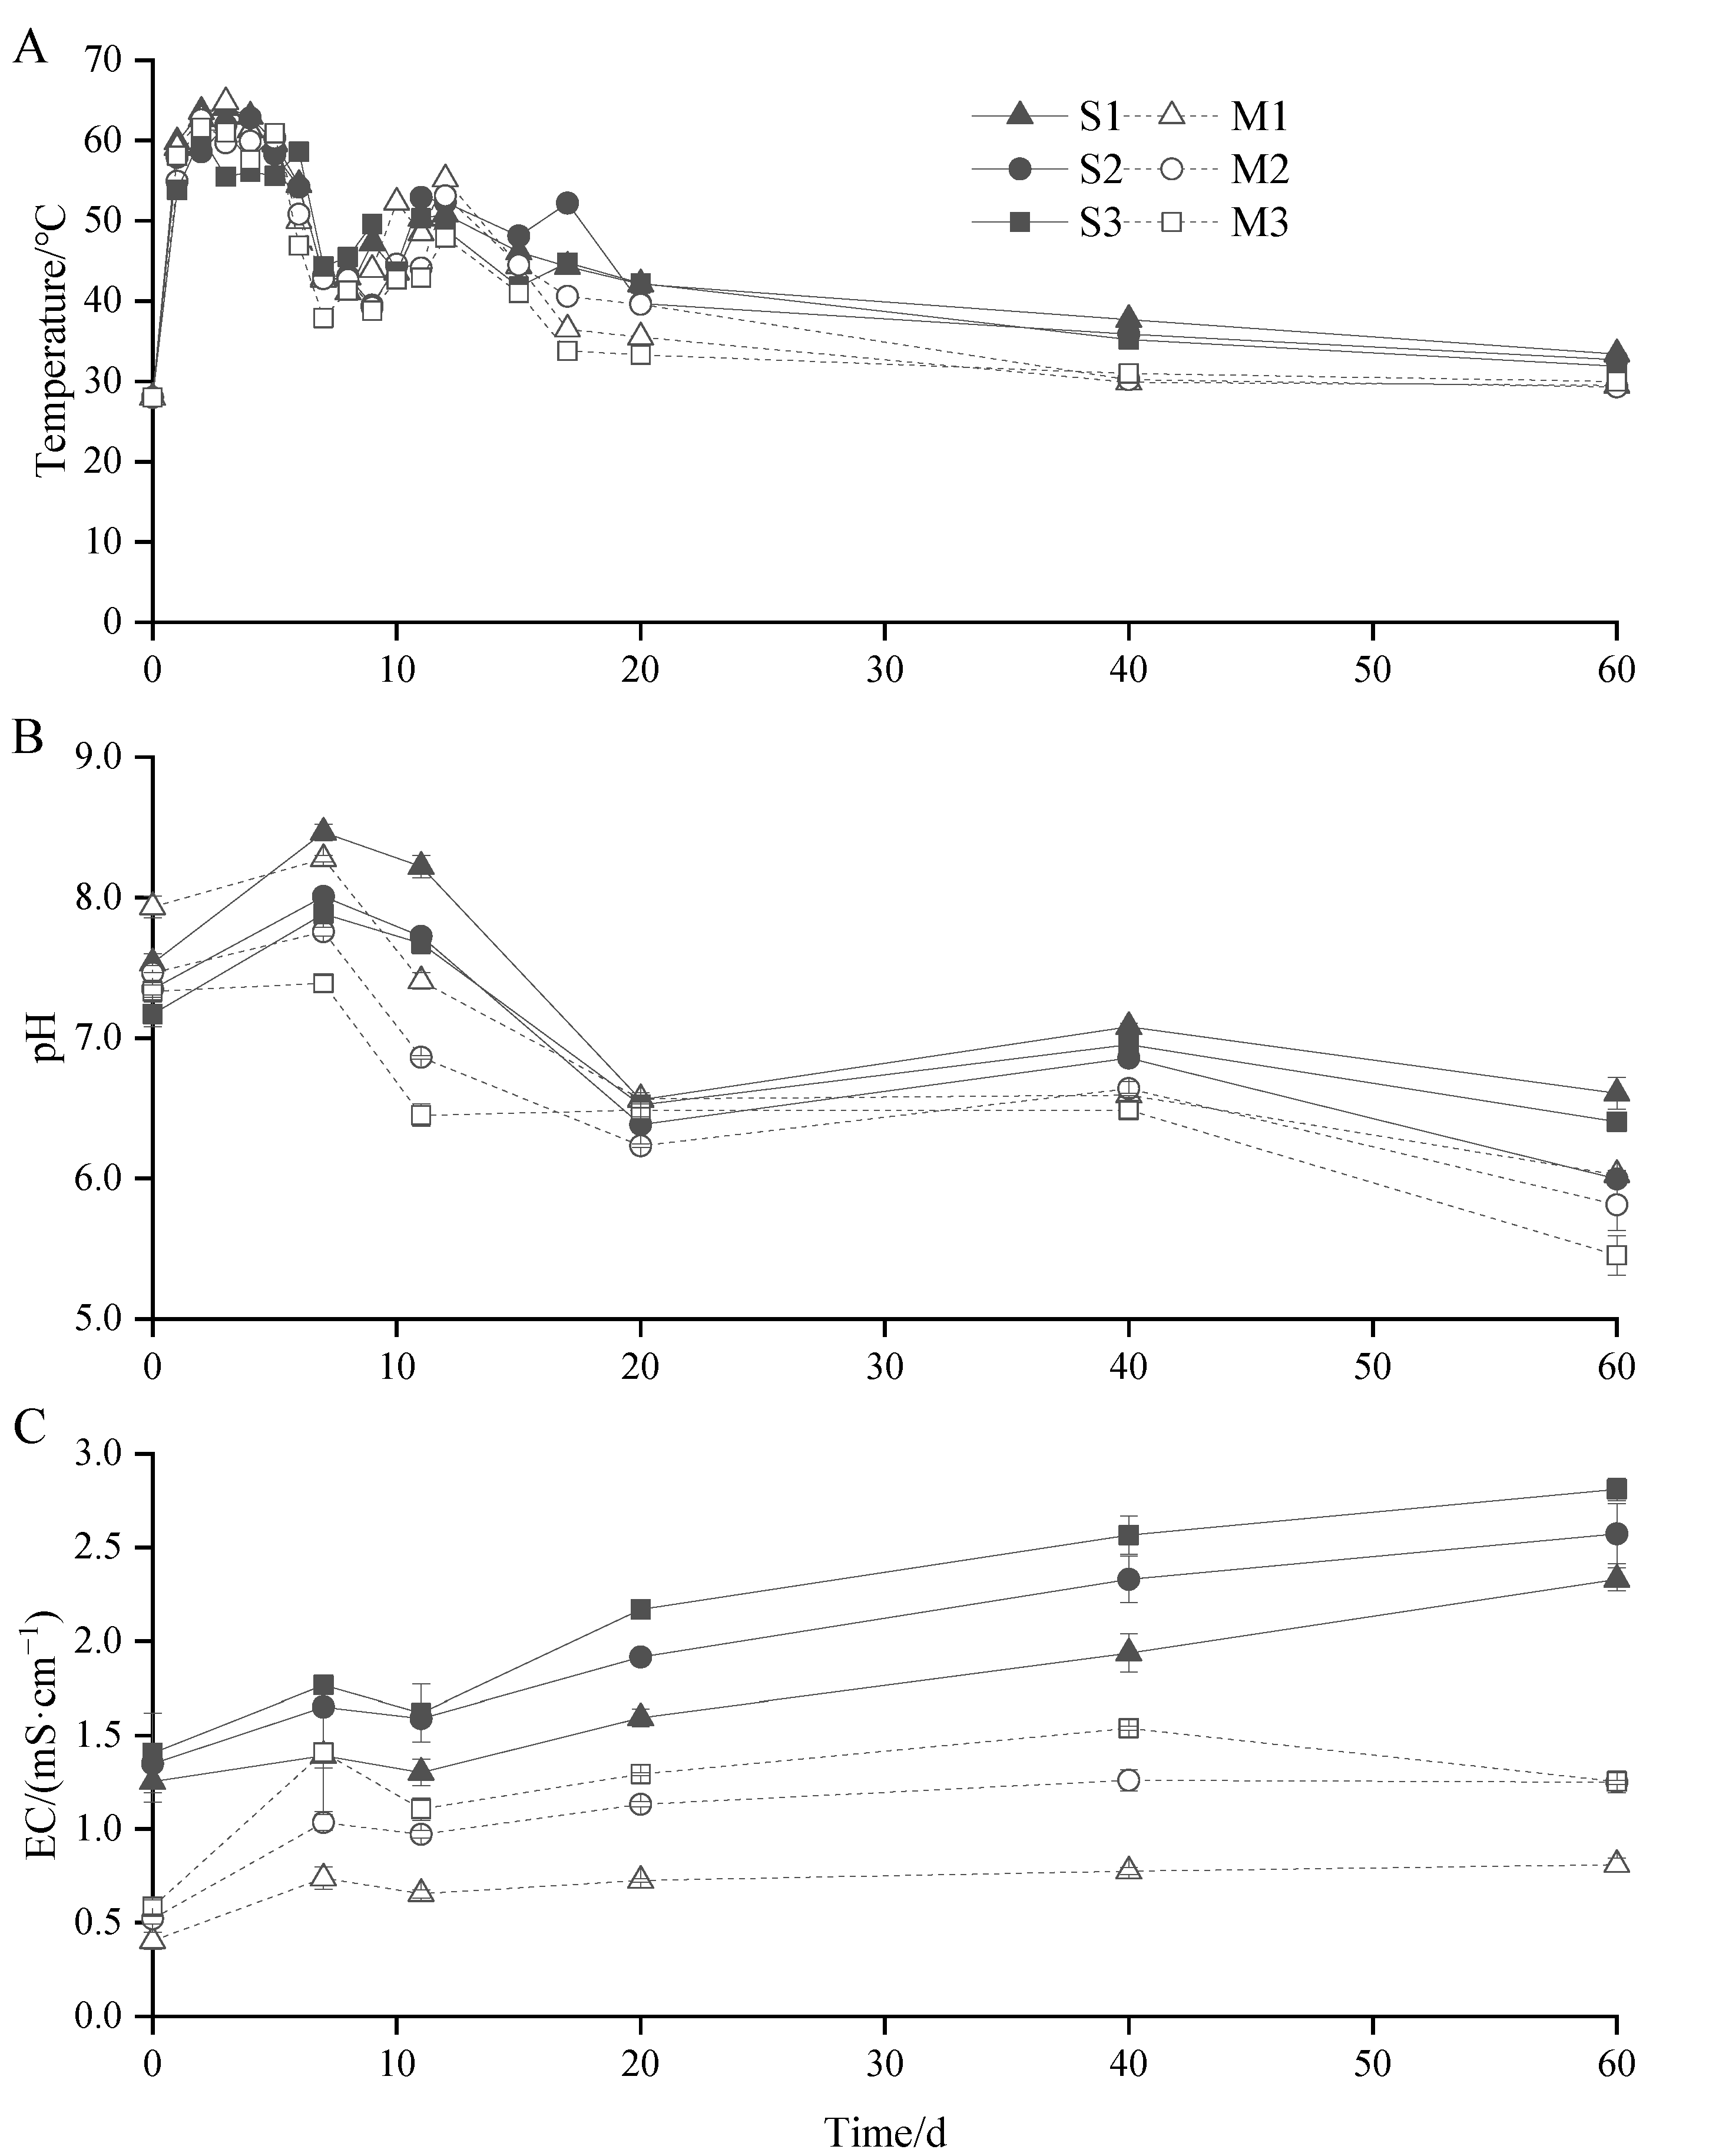
The temperature change in the different treatments was basically the same. As shown in Figure 2A, the composting process is typically divided into four periods based upon the temperature: mesophilic, thermophilic, cooling, and maturity period. The temperature increased rapidly after the beginning of composting and rose to more than 55 °C on the second day. The M2, S3, and M3 treatments reached peaks at 62.6 °C, 60.5 °C, and 61.6 °C on the second day, the S1 and M1 treatments reached peaks at 64.1 °C and 64.8 °C on the third day, and the S2 treatment peaked at 62.8 °C on the fourth day. The highest temperature of the S treatment with straw was higher than that of the M treatment without straw, and the highest temperature of all treatments with SSP was lower than that of the treatment without SSP. With the increase in SSP addition, the highest temperature of each treatment gradually decreased, and the range of decrease was 1.2~2.3 °C. However, the addition of SSP did not cause a significant difference in temperature (p > 0.05). The duration of the thermophilic period (>55 °C) of each treatment performed in this study met the temperature requirements laid out in the Technical Specifications for Composting of Livestock and Poultry Manure (NY/T3442-2019) [22], and the fecal coliform count was less than 100/g at the end of composting.
The pH of each treatment changed consistently with time (Figure 2B) during the process of composting. It gradually increased and peaked within 0~7 days, then decreased and finally stabilized. Adding straw resulted in an increase in the pH after composting. The pH of the M treatments without straw decreased with the increase in the amount of SSP, and the decrease in pH of the M treatment was higher than that of the S treatment with straw. At the end, the pH of each treatment was reduced to 5.45~6.61, and the pH value of the M3 treatment was significantly lower than those of other treatments (p < 0.05). It can be concluded that the addition of straw can stabilize the pH of compost. Overall, the EC of each treatment increased with increasing composting time (Figure 3C) but decreased slightly at 11 days. The EC of the S treatment with straw was higher than that of the M treatment without straw, indicating that the addition of straw could significantly improve the EC value of compost, and the EC gradually increased with an increasing amount of SSP. The EC reached a maximum at the end of 60 days of composting, during which the minimum value of the M1 treatment was 0.81 mS·cm−1, the maximum value of the S3 treatment was 2.81 mS·cm−1, and the EC values of the S2, S3, M2, and M3 treatments were significantly higher than those of the S1 and M1 treatments.

3.1.2. Changes in TN, TP, TK, and Organic Matter

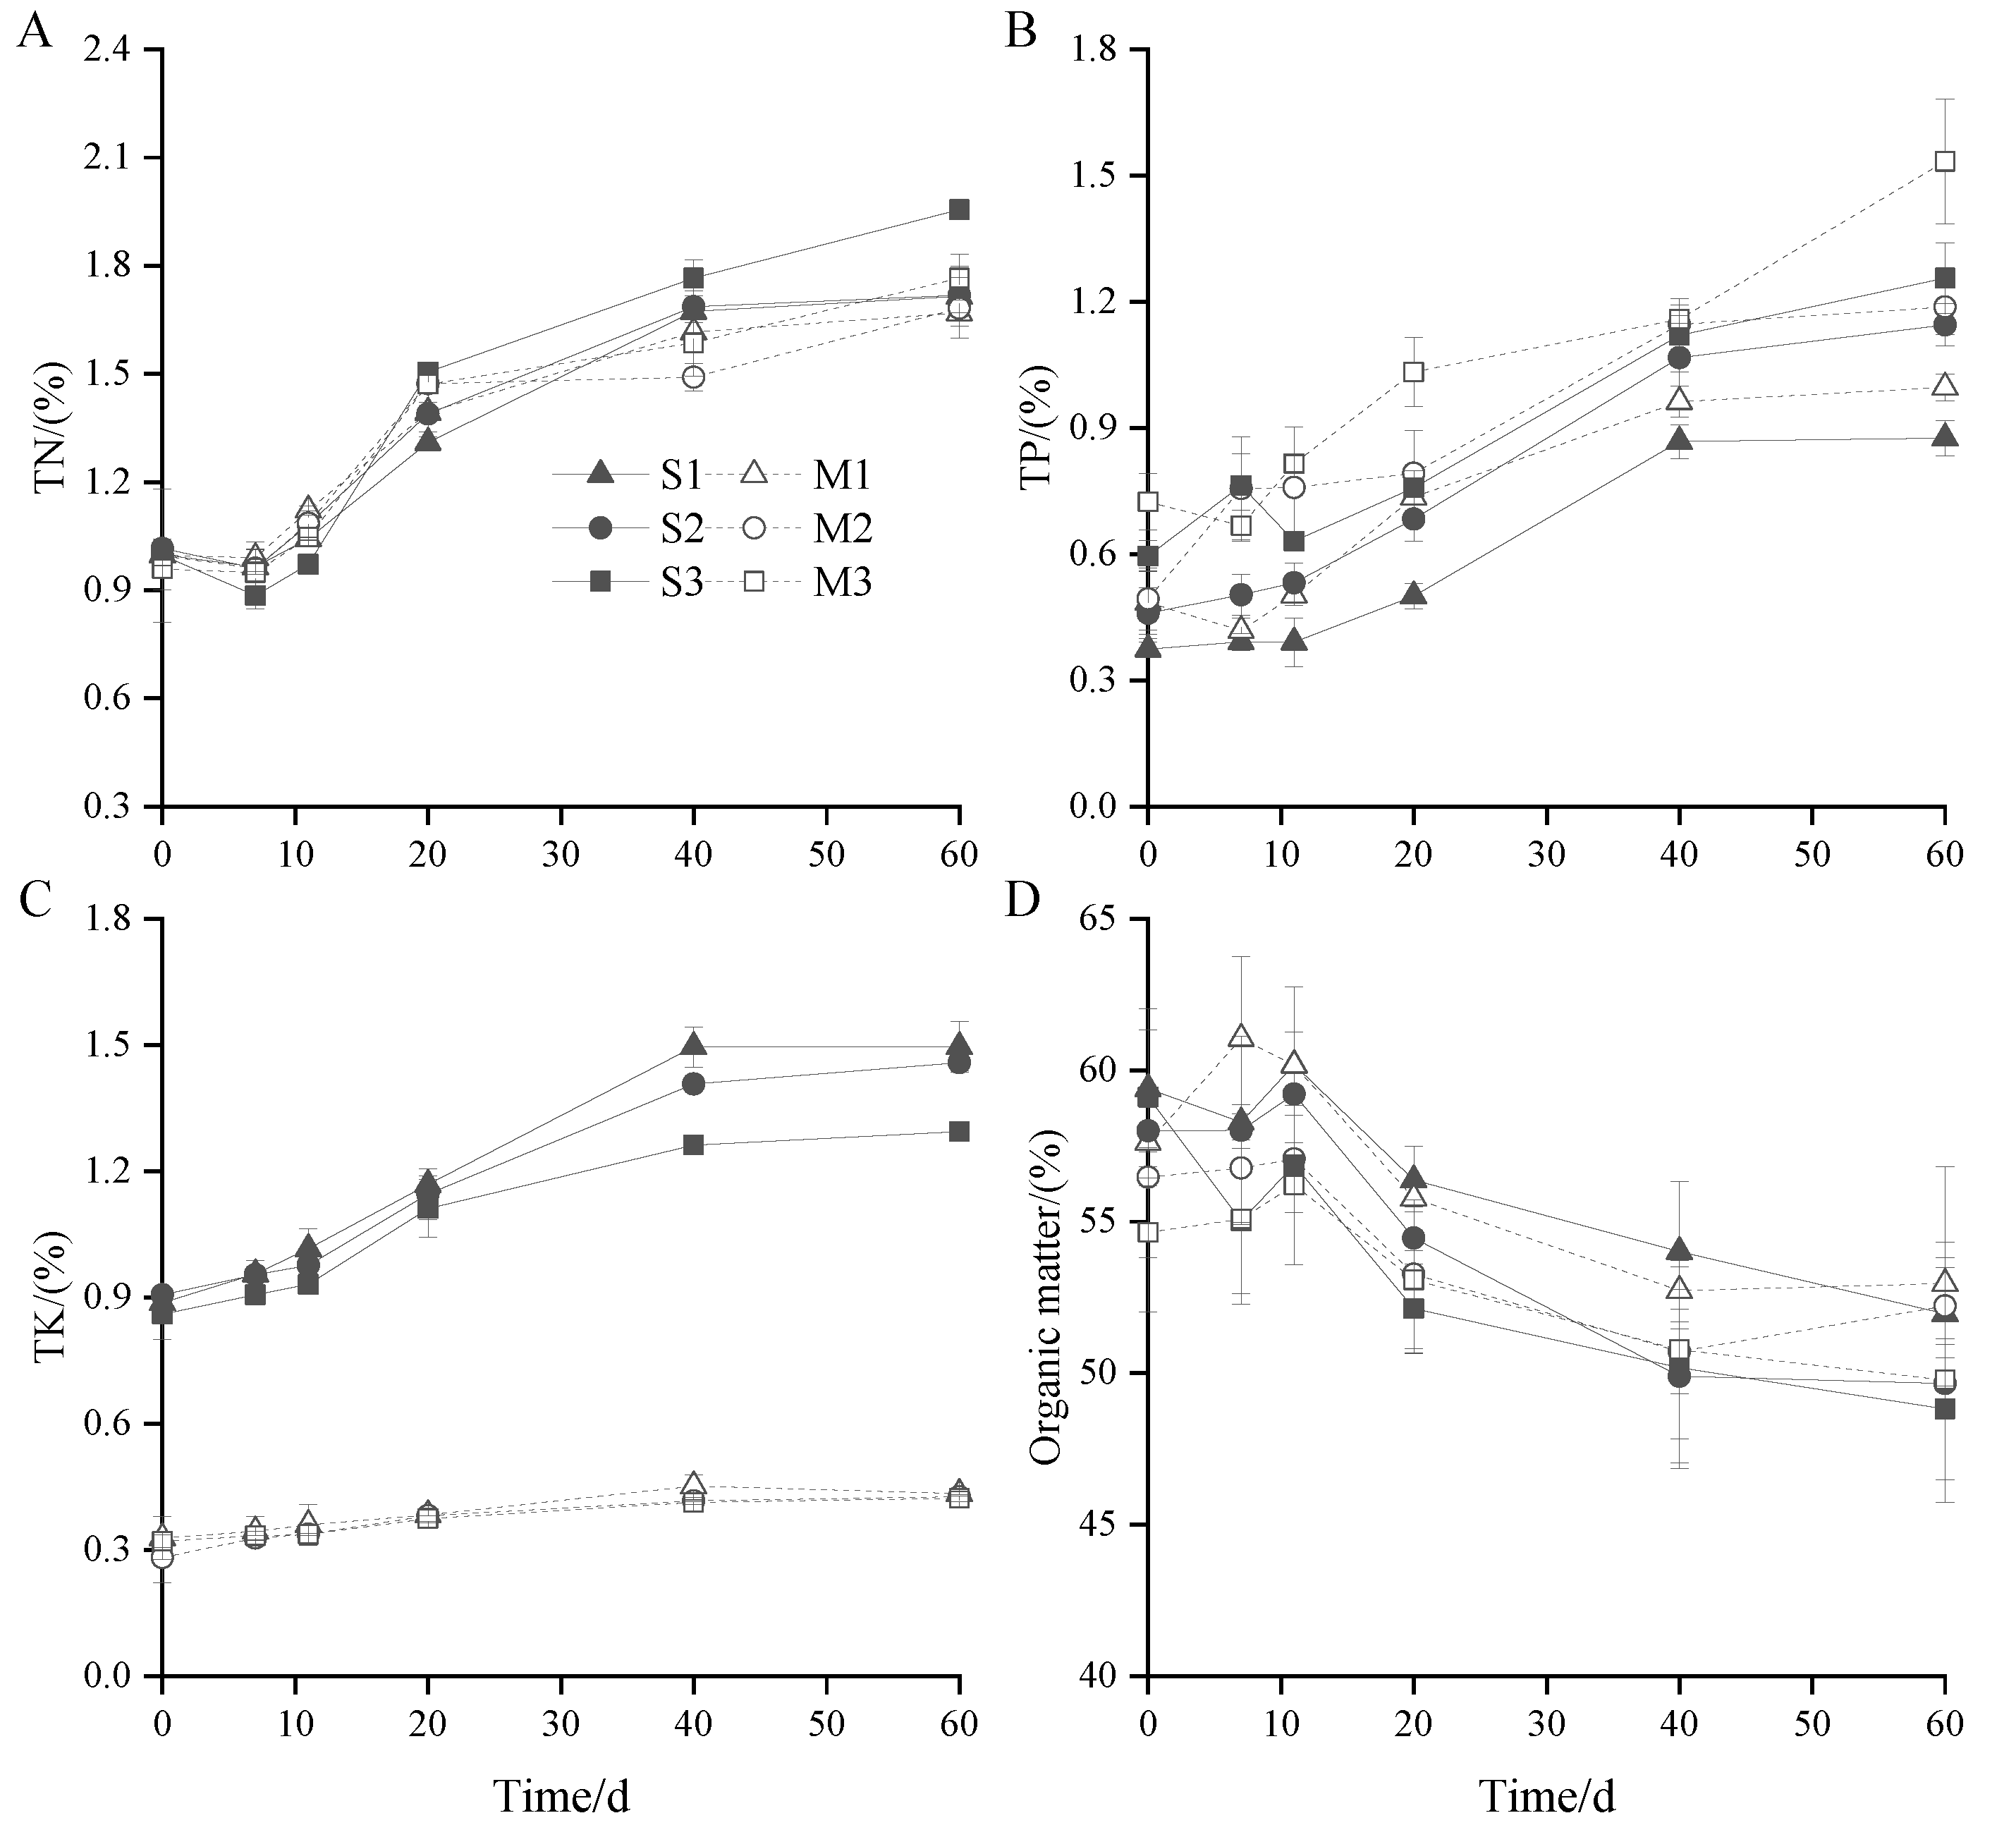
As shown in Figure 3A, the TN content of each treatment showed a trend of decreasing first and then increasing during the composting process, and all reached the lowest value on the 7th day, the lowest value of which was 0.89% in the S3 treatment. At the end of composting, the content of each treatment reached the maximum value, ranging from 1.67–1.96%, and the TN content gradually increased with the addition of SSP. The S3 treatment showed a significantly greater increase than other treatments (p < 0.05), indicating that the addition of SSP had a good nitrogen retention effect on pig manure compost. Additionally, at the same level of SSP, the TN content of the S treatment with straw was higher than that of the M treatment without straw. The TP content of each treatment showed an overall upward trend (Figure 3B). At the end of 60 days of composting, the TP content of each treatment reached the maximum and increased with the increase in SSP. Additionally, the TP content of the M treatment without straw was higher than that of the S treatment with straw. The maximum TP content of M3 was 1.53%, and the minimum TP content of S1 was 0.88%. The change in TK content of each treatment in the composting process is shown in Figure 3C. Since straw is a material with a high potassium content, the TK content of the S treatment with straw was significantly higher than that of the M treatment without straw (p < 0.05), and the TK content of the M treatment showed little change during the whole composting process, remaining between 0.3% and 0.4%. The TK content in the S treatment increased significantly and tended to be stable after 40 days. At the end of composting, the TK contents of the S1, S2, and S3 treatments were 1.50%, 1.46%, and 1.29%, respectively, which increased by 68.59%, 60.93%, and 50.46% compared with the initial TK contents. Contrary to the changes in N, P, and K, the organic matter in the compost was decomposed into CO2 and water evaporation during the reaction, which showed a gradually decreasing trend (Figure 3D). At the end of 60 days of composting, the organic matter content of each treatment decreased to 48.81~52.96%, which was 7.53~17.43% lower than that of the initial organic matter content. At the same SSP level, the organic matter content of the M treatment without straw was higher than that of the S treatment with straw.

3.2. Characteristics of Gas Emissions during Composting

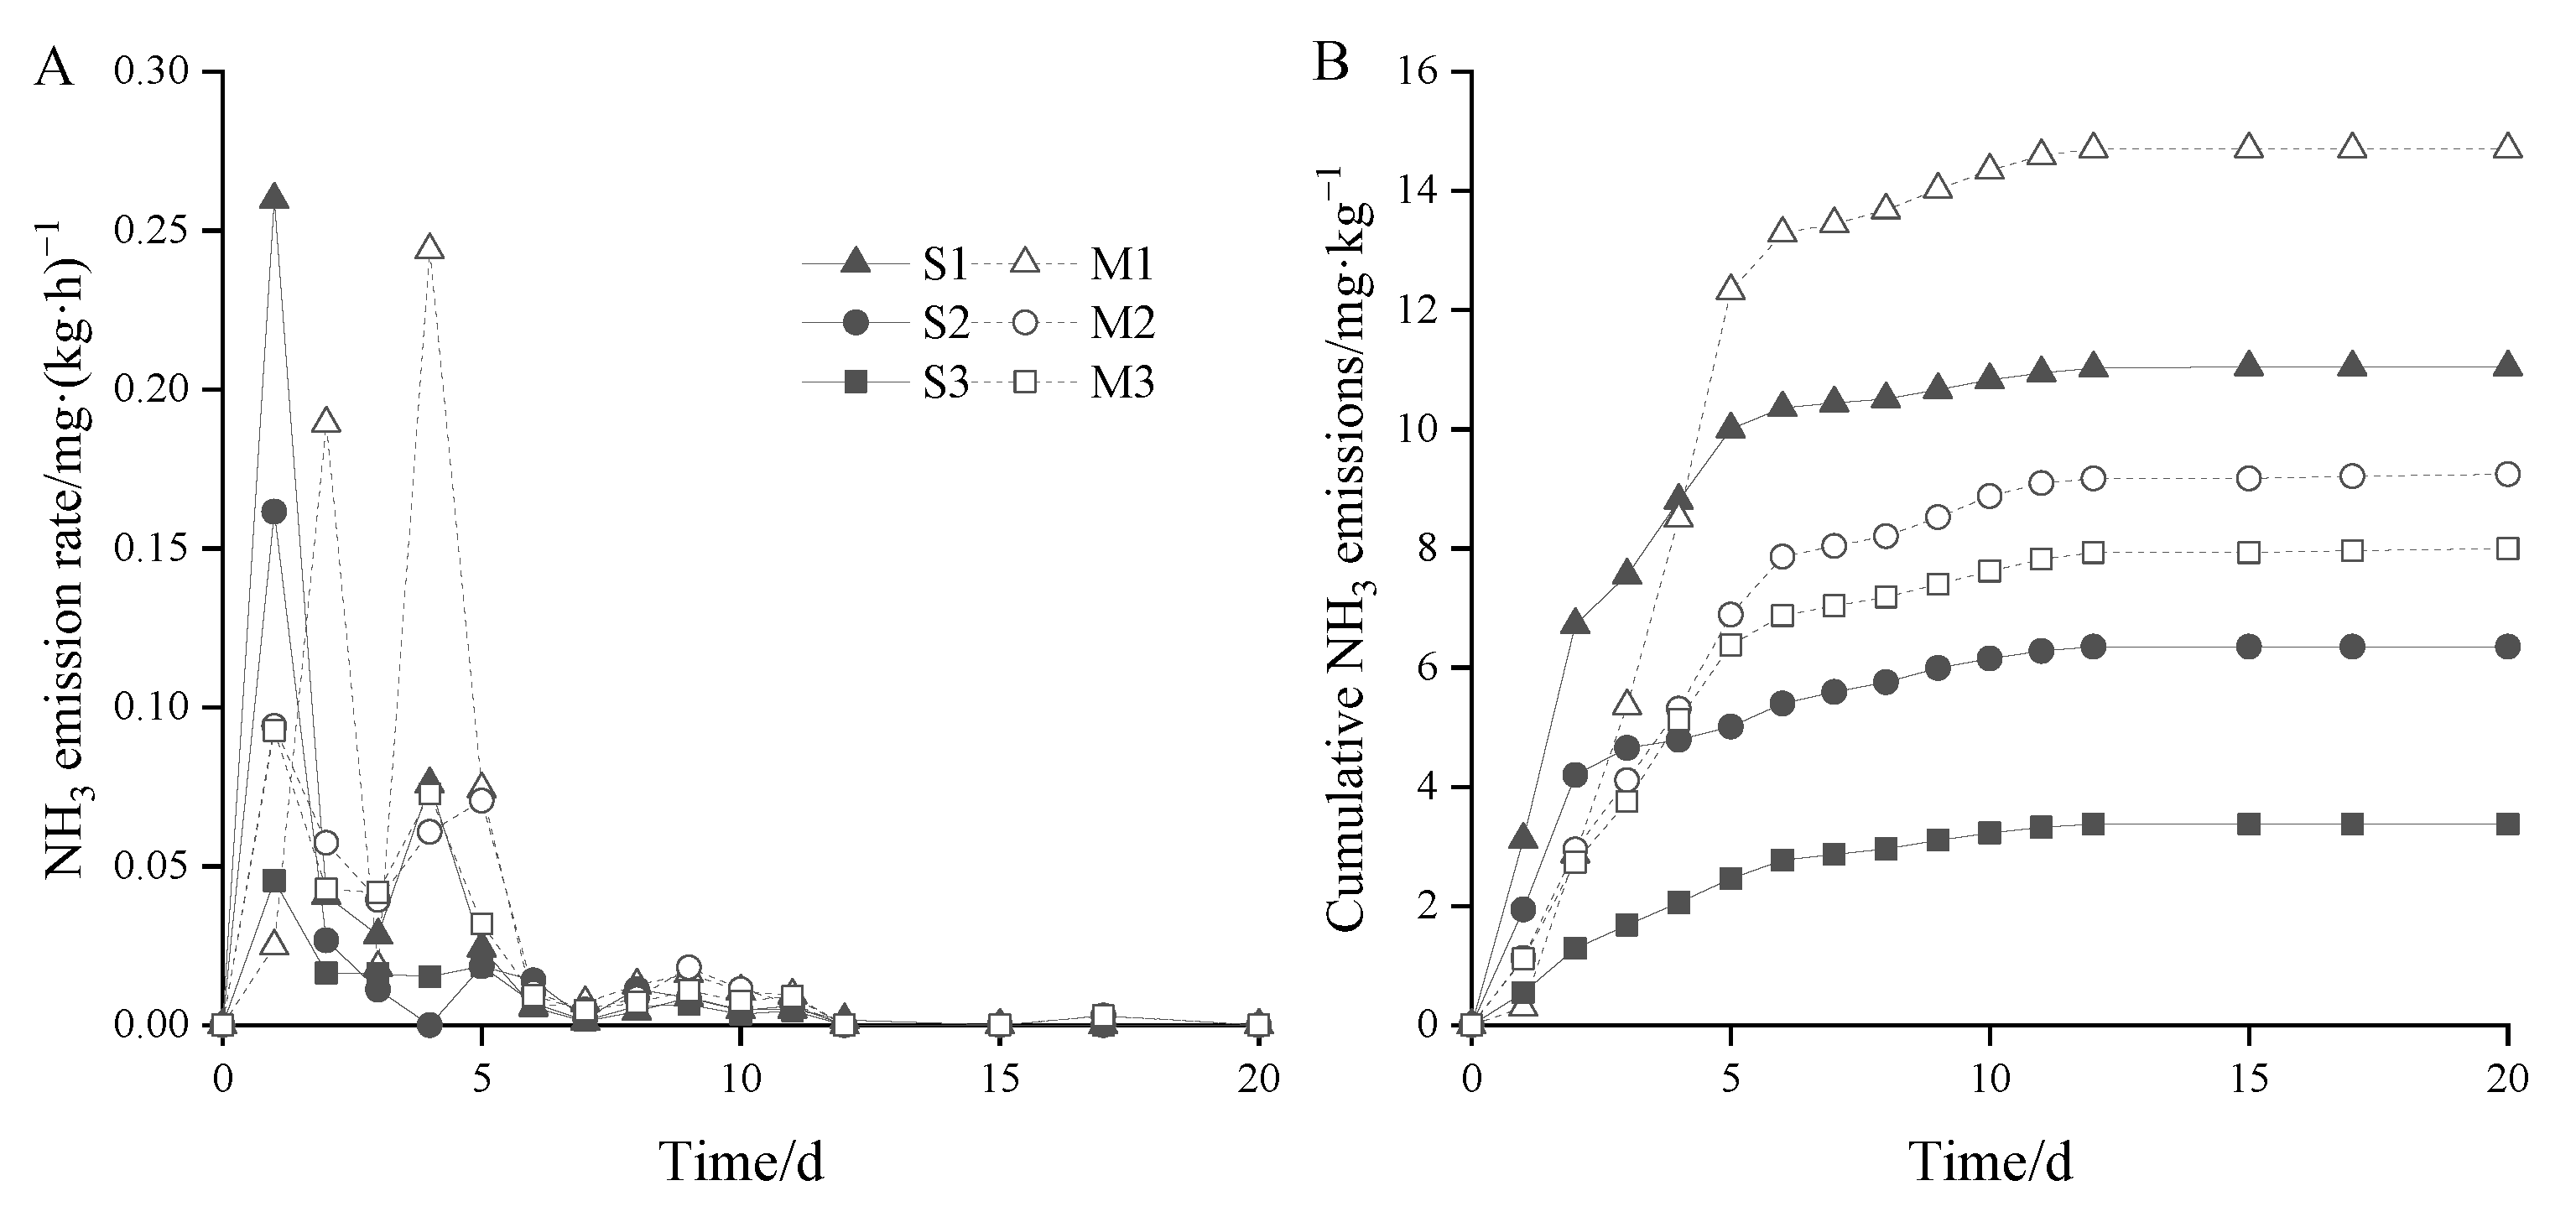
The emission rate and cumulative emission of NH3 in each composting process are shown in Figure 4. As shown in Figure 4A, the NH3 emissions of each treatment were mainly concentrated in the first 11 days, and the emission rate of each treatment approached 0 after 11 days. The emission rate of NH3 at the beginning of composting was S1 > S2 > M2 > M3 > S3 > M1. As seen from Figure 4B, the cumulative emission of NH3 in the treatment with SSP was smaller than that in the treatment without SSP, and the cumulative emission of NH3 decreased with increasing SSP. The cumulative NH3 emissions of the S2, S3, M2, and M3 treatments were reduced significantly compared with the S1 and M1 treatments (p < 0.05). The addition of SSP effectively reduced the loss of nitrogen in the form of NH3 volatilization during composting, and under the same amount of SSP addition, the cumulative emission of NH3 in the M treatment was greater than that in the S treatment. In the first 6 days of composting, the cumulative emissions of NH3 from the M1 and S1 treatments reached more than 90% of the total emissions, and those from the M2, S2, M3, and S3 treatments reached more than 80% of the total emissions. After 10 days of composting, the cumulative emissions of NH3 from each treatment reached more than 95% of the total emissions. At the end of the 20-day measurement, the NH3 emissions of the M2 and M3 treatments were reduced by 37.13% and 45.63%, respectively, compared with the M1 treatment, and the NH3 emissions of the S2 and S3 treatments were reduced by 42.50% and 69.44%, respectively, compared with the S1 treatment. The addition of SSP effectively reduced NH3 emissions.
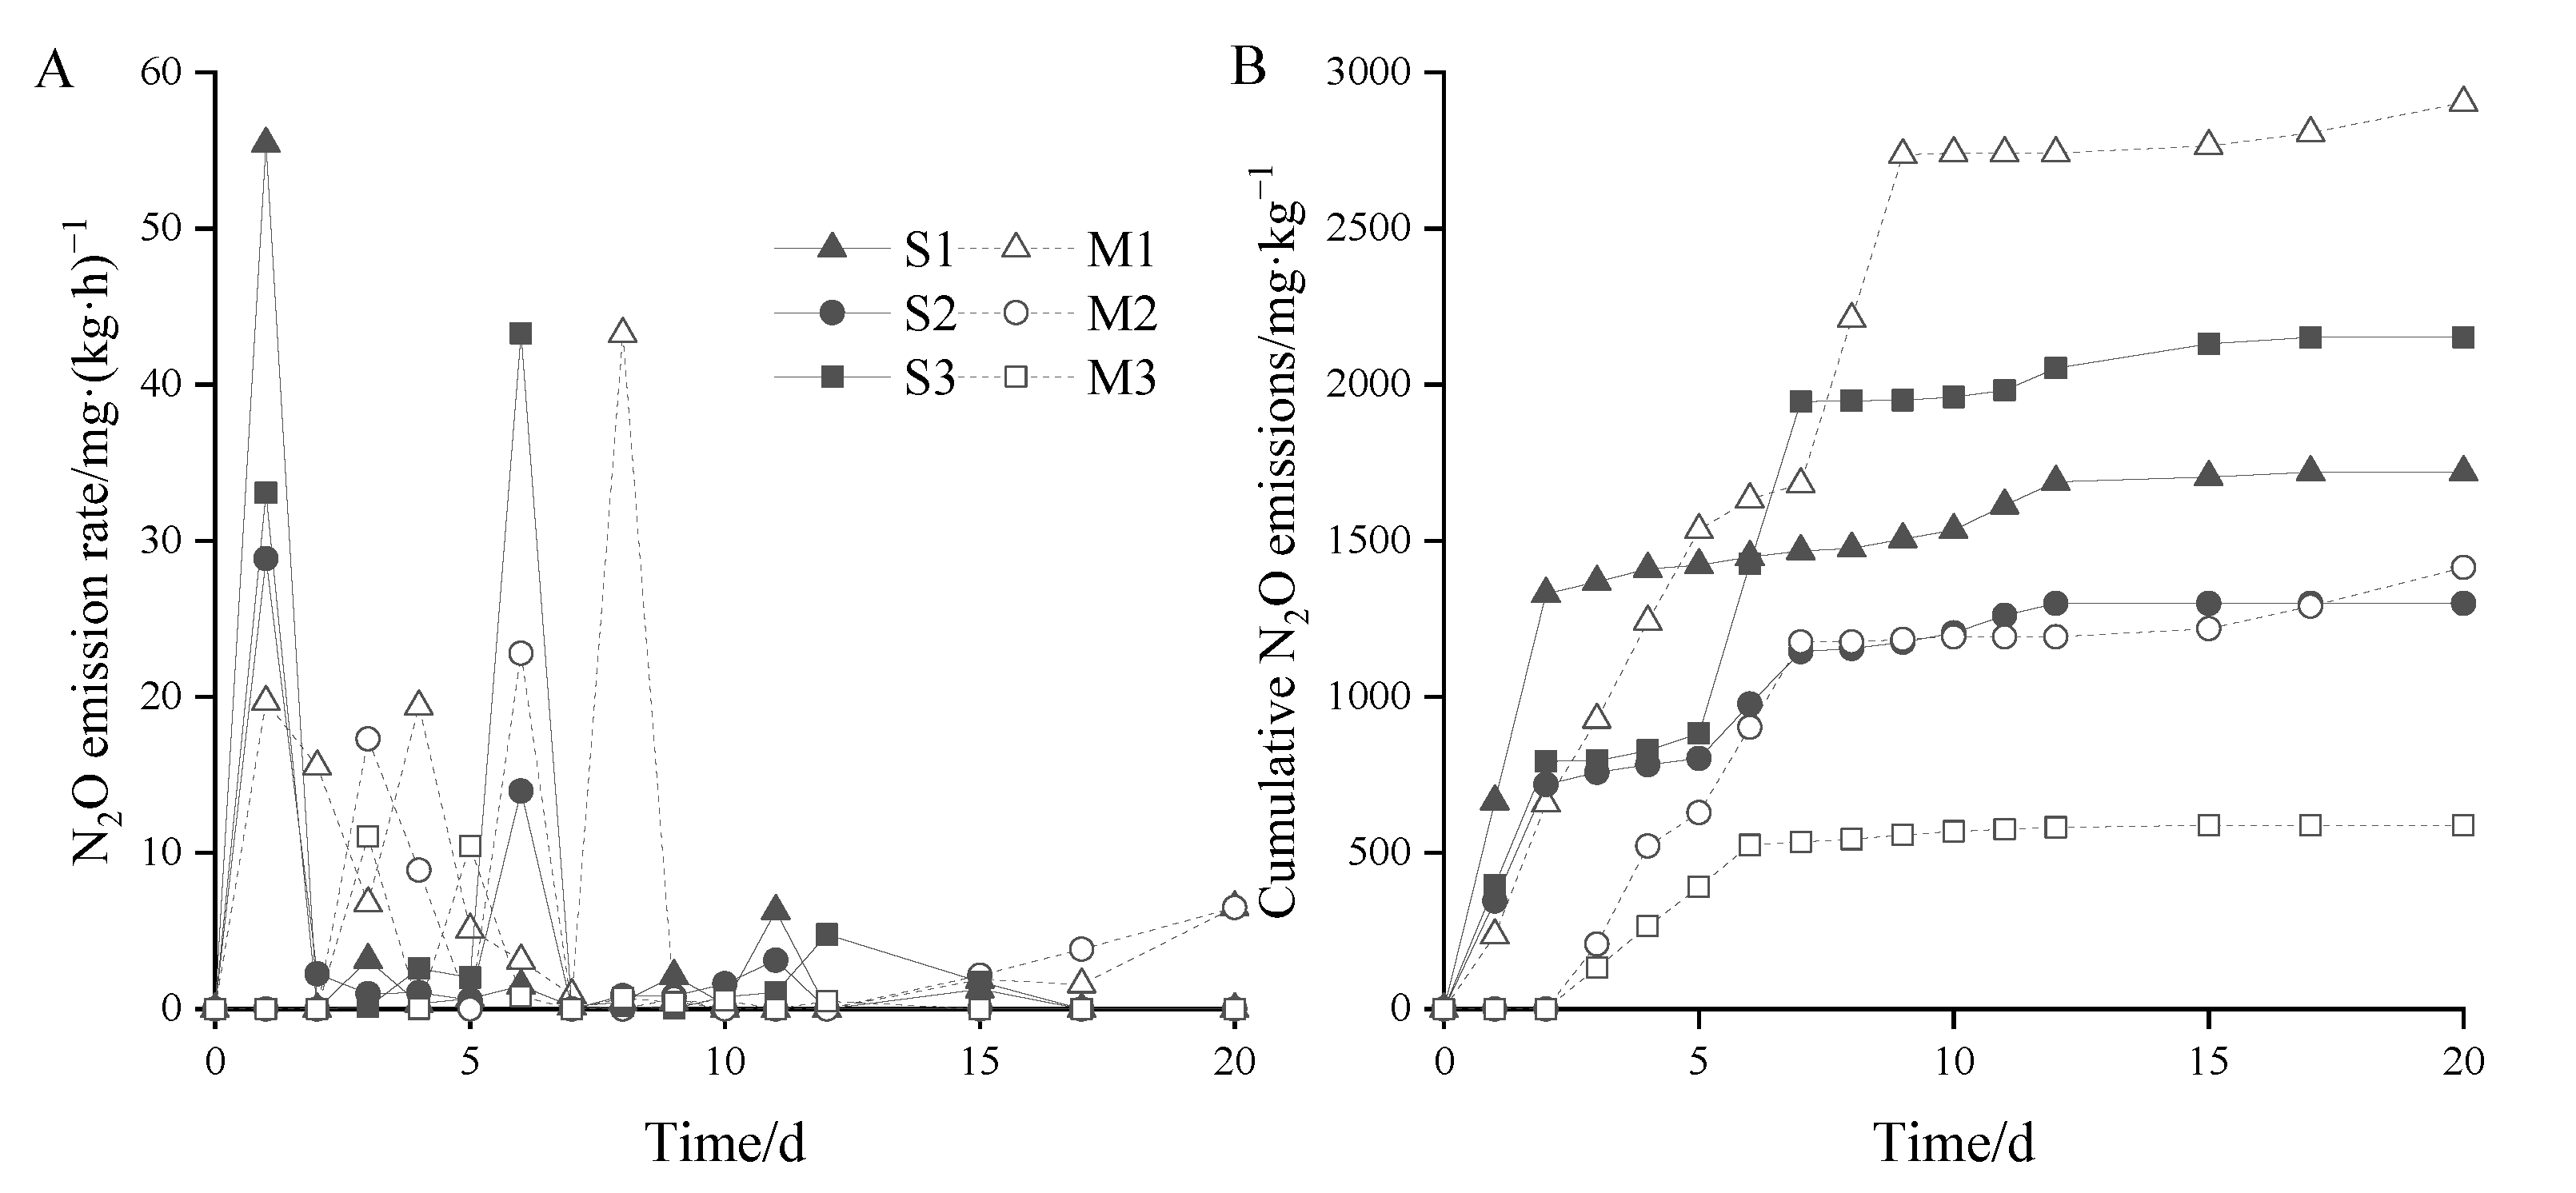
N2O in the composting process is mainly produced by nitrification and denitrification. The N2O emission rate of each treatment is shown in Figure 5A, and the production of N2O was mainly concentrated from 1 to 9 days. The peak values of S1 and S2 were 55.42 and 28.84 mg·(kg·h)−1 on the first day after composting, and the peak values of S3 and M1 were 43.28 and 43.24 mg·(kg·h)−1 on the sixth and eighth days, respectively. Compared with other treatments, the N2O emission rates of M2 and M3 were maintained at lower levels. As shown in Figure 5B, in the M treatment without straw, with the addition of SSP, the cumulative N2O emissions gradually decreased, and the emission reduction rates of the M2 and M3 treatments were 51.29% and 79.75% higher (p < 0.05) compared with the M1 treatment, respectively. In the process of composting, the cumulative N2O emissions of each treatment reached more than 80% of the total emissions on the ninth day and then gradually leveled off. At the end of the 20-day measurement, the cumulative N2O emission of each treatment was 587.83–2902.70 mg·kg−1. In the S treatment, the cumulative emission of N2O in the S3 treatment was higher than that in S1 and S2, which may be because the addition of SSP affected the contents of ammonia nitrogen and nitrate nitrogen in the reactor.
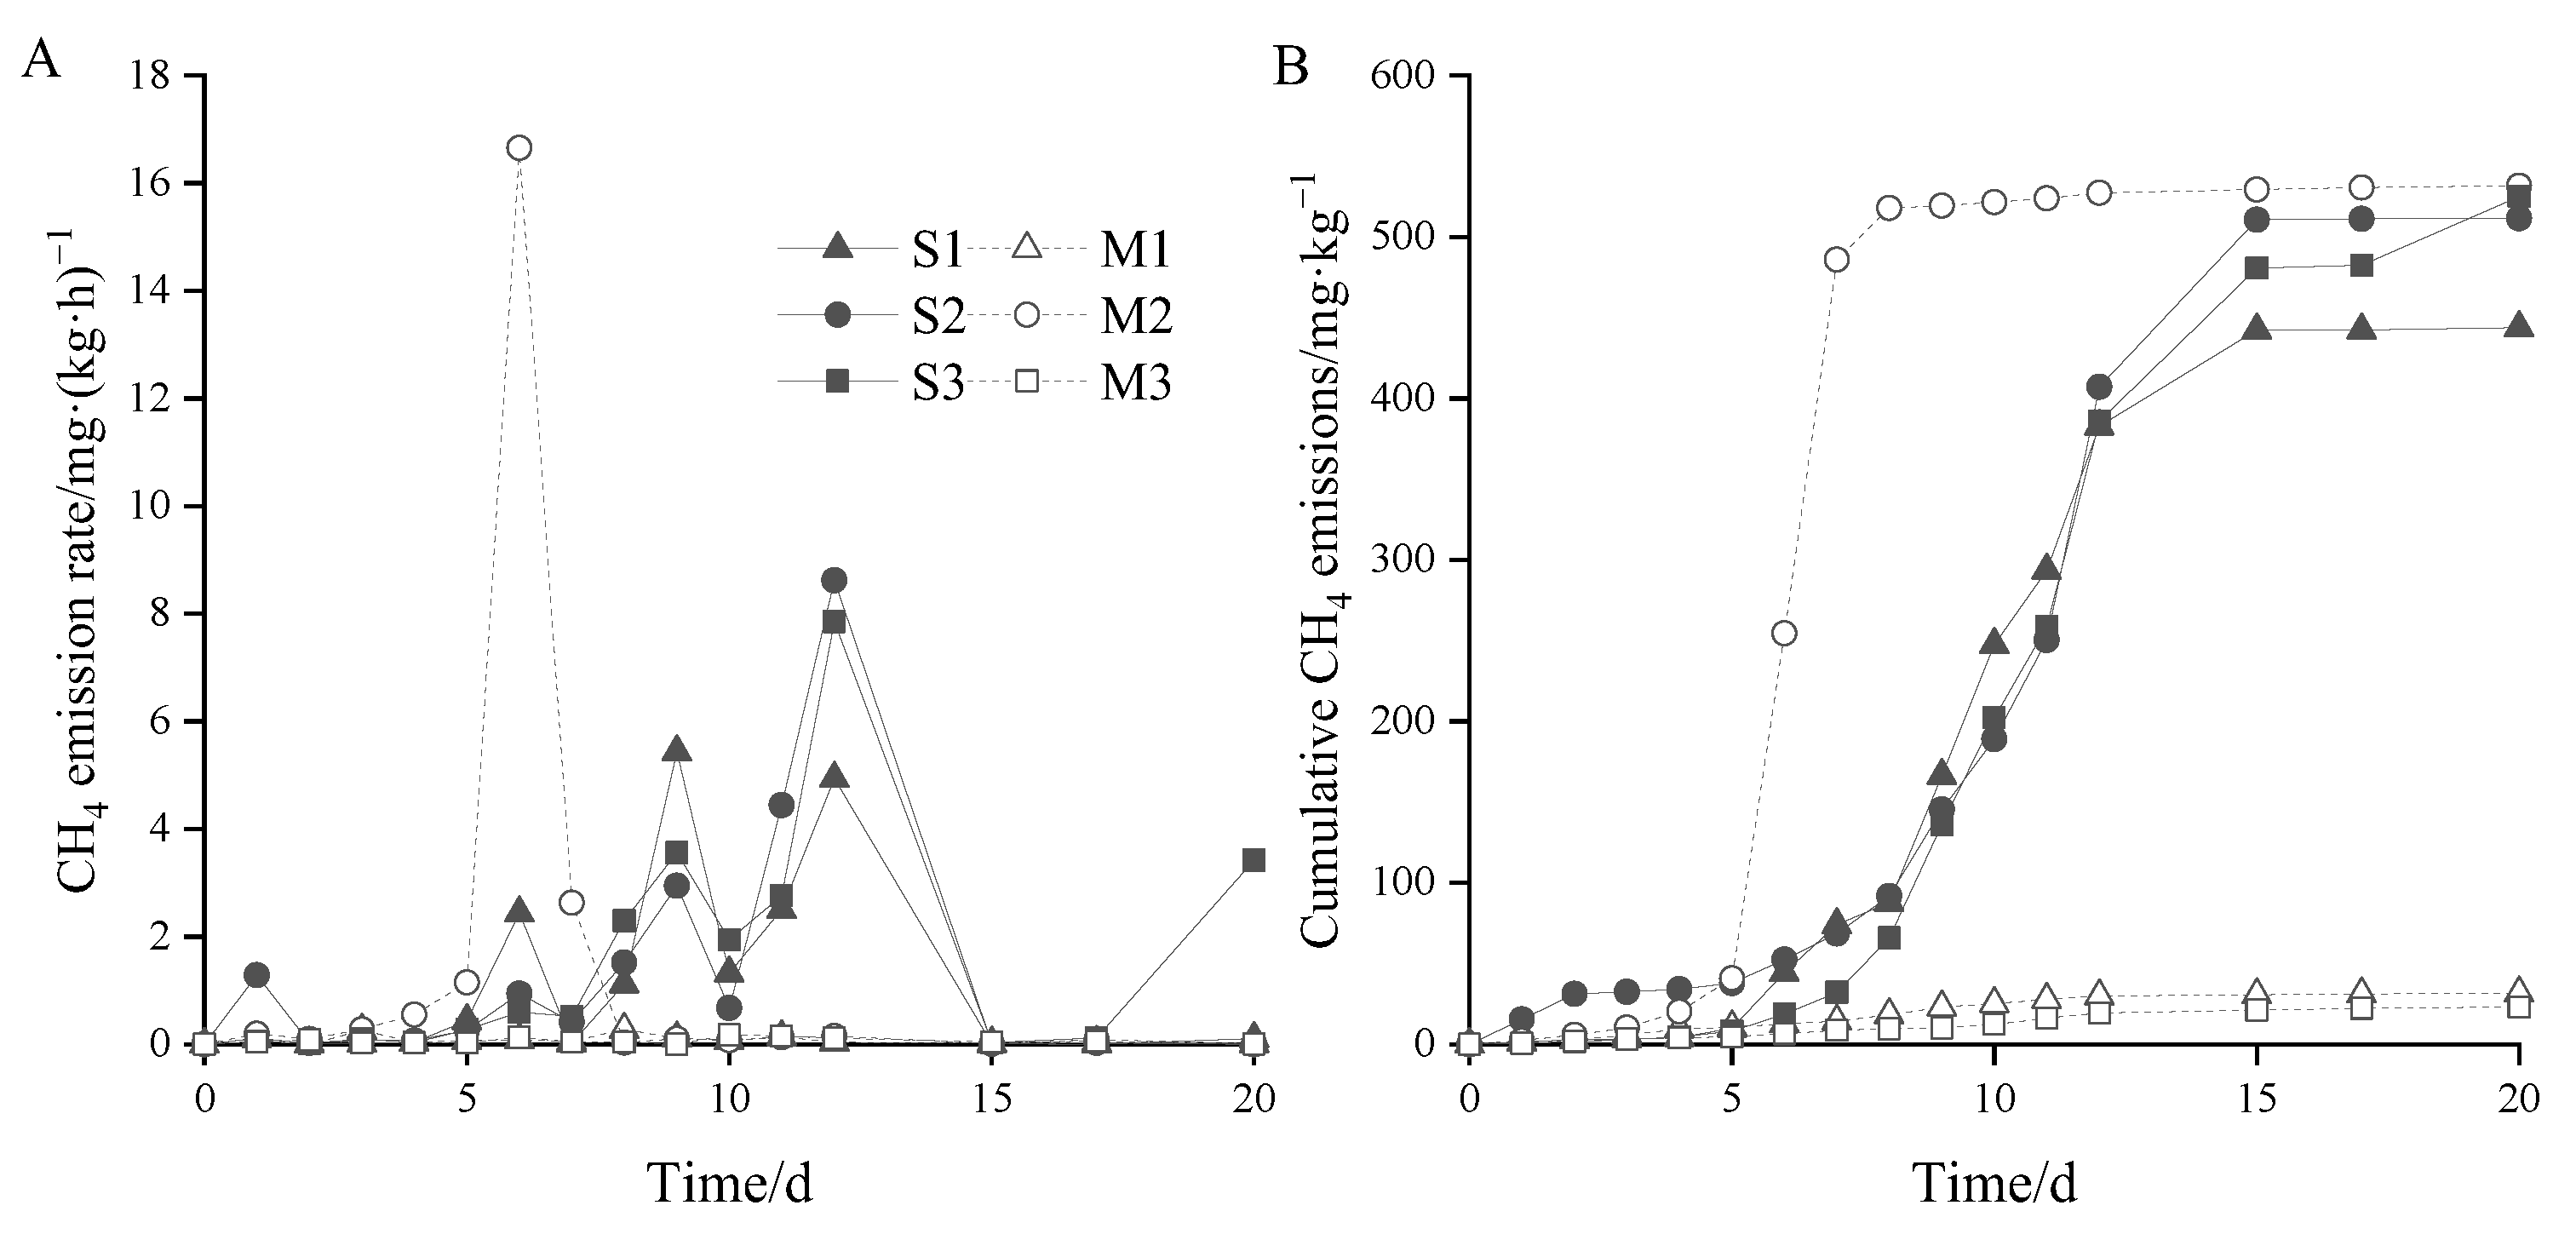
Local anoxia may occur during the process of aerobic composting, in which case CH4 will be produced by anaerobic fermentation. During this composting process, as shown in Figure 6A, the CH4 emission rates in the S1, S2, and S3 treatments were consistent with the change trend of cumulative emissions. The emission of CH4 was mainly concentrated on the 6th to the 12th days; the peak value of the S1 treatment was 5.43 mg·(kg·h)−1 on the 9th day, and the peak values of the S2 and S3 treatments were 8.62 and 7.86 mg·(kg·h)−1 on the 12th day, respectively. An emission peak occurred in the M2 treatment on the 6th day, while the CH4 emission rate was at a low level throughout the whole process of the M1 and M3 treatments, ranging from 0–0.3 mg·(kg·h)−1. According to Figure 6B, at the end of the 20-day measurement, the maximum cumulative CH4 emission of the M2 treatment was 531.77 mg·kg−1, followed by the S3, S2, and S1 treatments, and emissions increased with the increase in SSP addition. The cumulative CH4 emissions of the M1 and M3 treatments were significantly lower than those of the other treatments (p < 0.05), at 31.78 and 23.14 mg·kg−1, respectively. On the 15th day of composting, the cumulative emissions of CH4 in each treatment reached more than 90% of the total emissions.
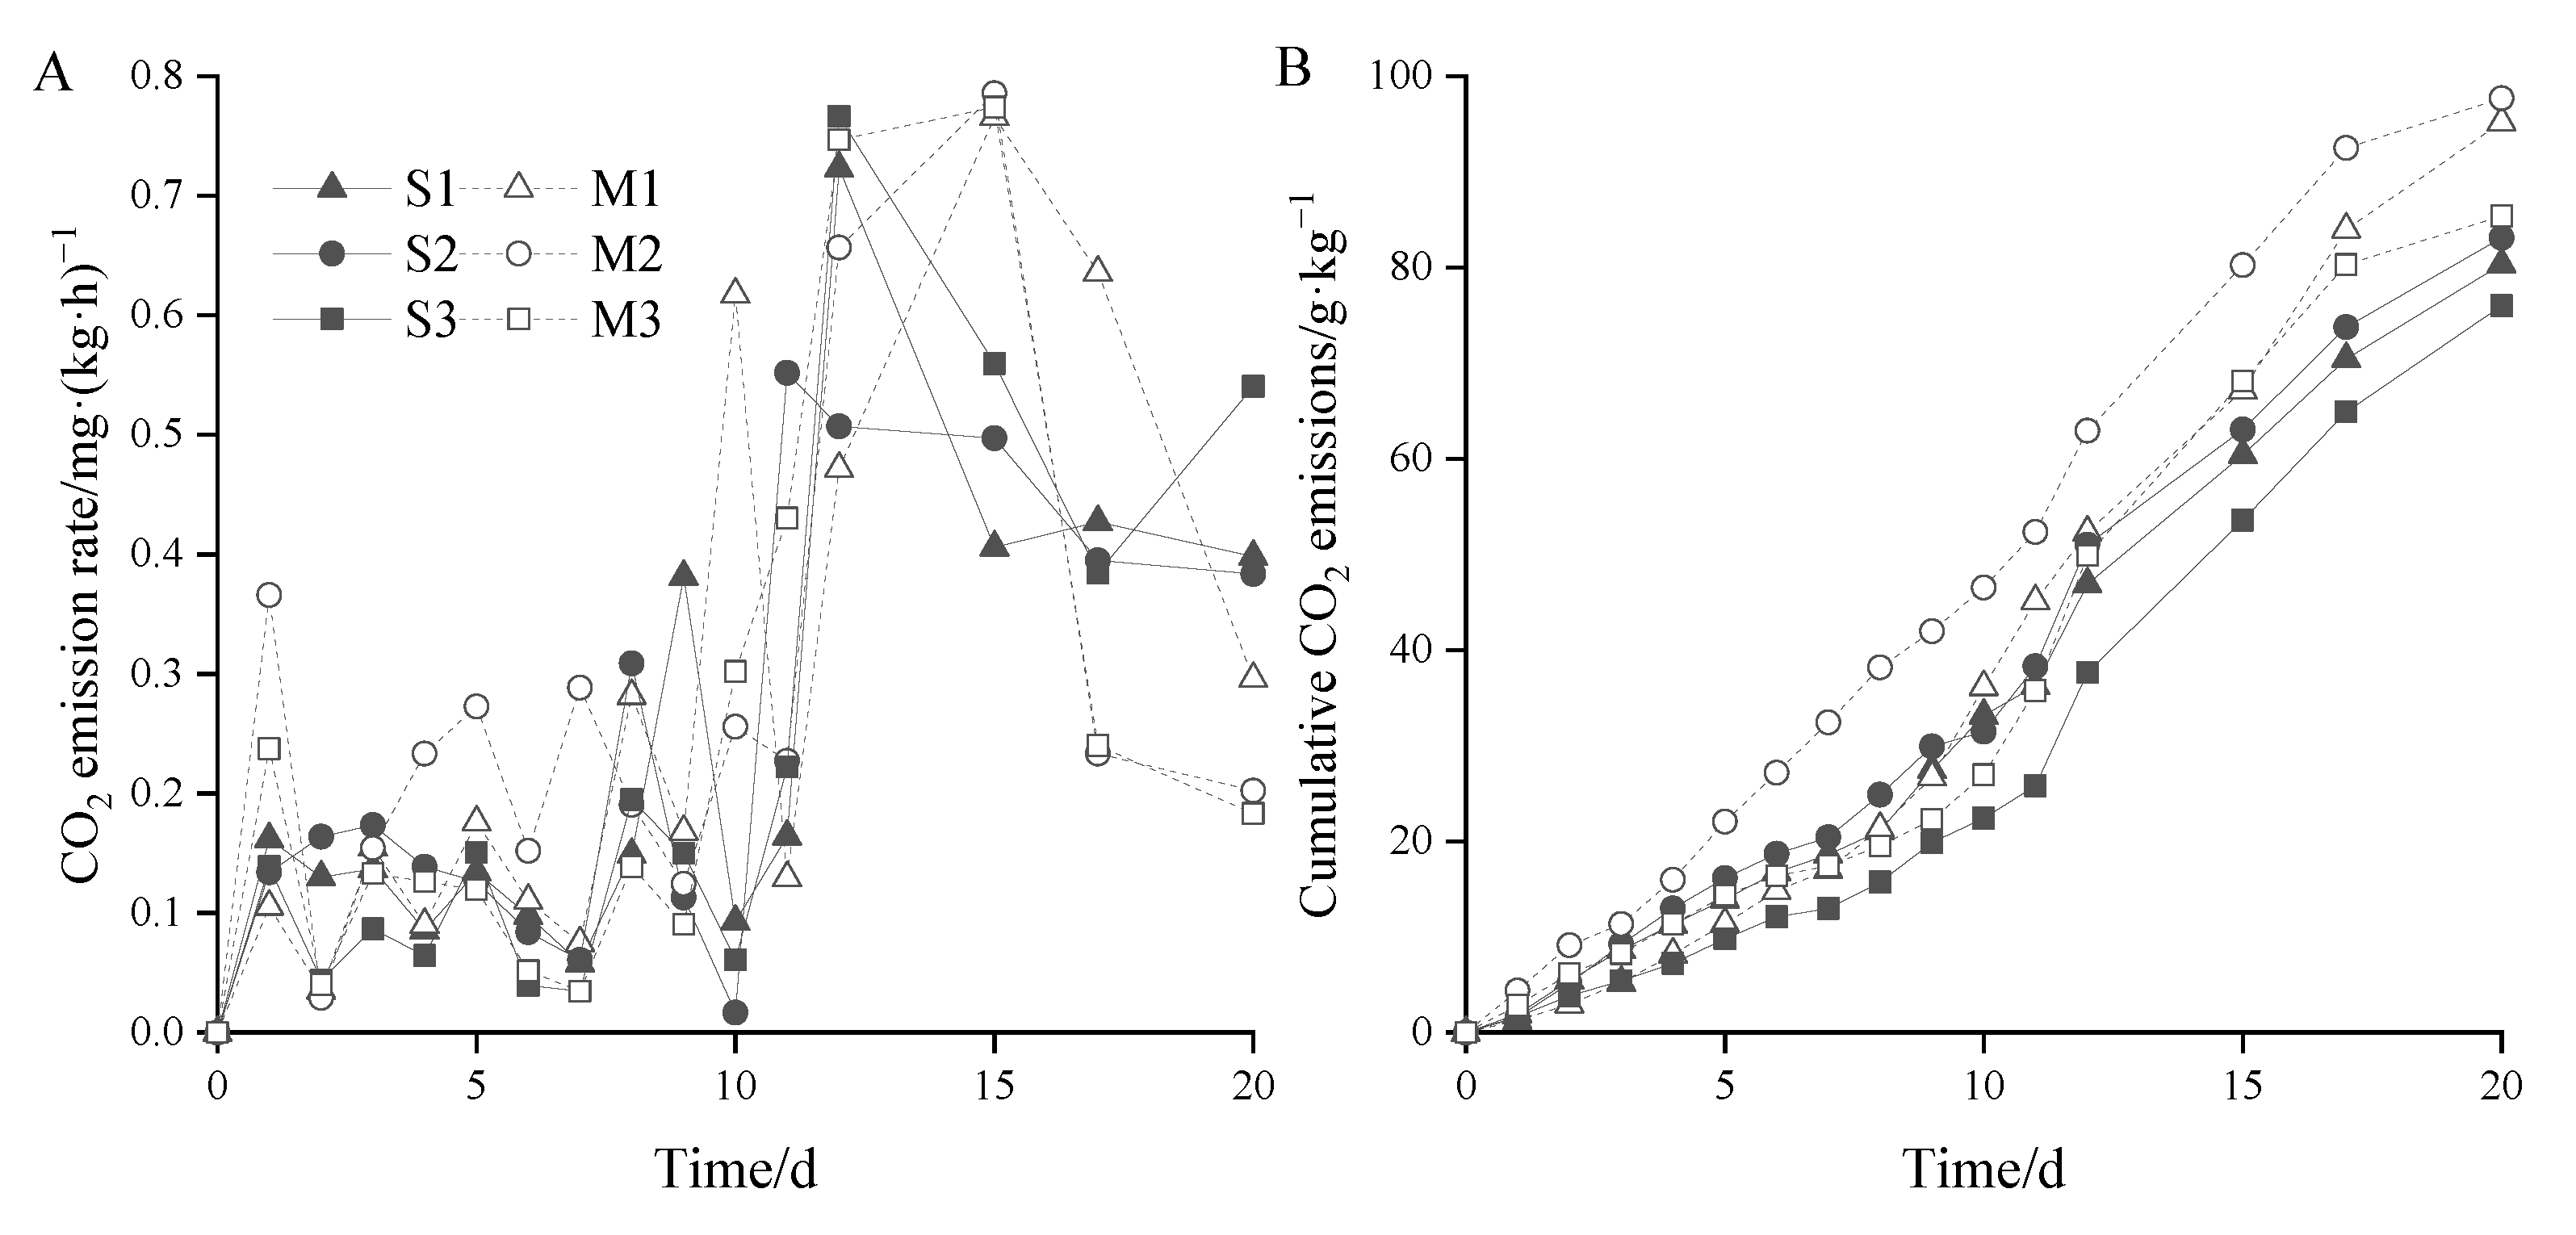
As shown in Figure 7A, the CO2 emission rate of each treatment fluctuated, with the most drastic fluctuation from the 8th to the 16th day. The emissions peaks of M1, M2, and M3 on the 15th day of composting were 766.16, 785.78, and 774.14 mg·(kg·h)−1, respectively. The S1 and S3 treatments reached emission peaks of 723.13 and 766.37 mg·(kg·h)−1 on the 12th day, respectively. The S2 treatment reached the emission peak on the 11th day (551.91 mg·(kg·h)−1), and this peak was significantly lower than that of the other treatments. As shown in Figure 7B, the cumulative CO2 emissions of each treatment increased slowly, mainly after the 9th day, and the CO2 emissions from the 9th to the 20th day accounted for 57.04–73.93% of the total emissions during the whole measurement period. At the end of the 20-day measurement, the cumulative CO2 emissions of the M treatment without straw were higher than those of the S treatment with straw. The addition of 6% SSP reduced the CO2 emission, in which the CO2 emission of the M3 treatment was reduced by 10.30% compared with that of the M1 treatment, and that of the S3 treatment was reduced by 5.39% compared with that of the S1 treatment. The cumulative CO2 emissions of the S3 and M3 treatments were reduced significantly compared with the S1 and M1 treatments (p < 0.05).
CO2, CH4, and N2O are the main greenhouse gases produced during the composting process. The warming potential of greenhouse gases in each treatment is shown in Table 2. The global warming potential of each treatment was 261.14~960.98 kg·Mg−1, among which the rate of contribution of N2O was the largest, accounting for 67.08~90.01% of the total global warming potential, followed by the rate of contribution of CO2, which was 9.91~32.70%. CH4 accounted for a small proportion of the total global warming potential. In the M treatment, the total warming potential decreased with the increase in SSP. The M2 and M3 treatments showed a significant difference from the M1 treatment (p < 0.05), while for the S treatment, the situation was S3 > S1 > S2 because the level of N2O emission in the S3 treatment was significantly higher than that in the other two treatments.

4. Discussion

4.1. Effects of Superphosphate on the Main Parameters of the Composting Process

Temperature is the most important factor affecting the degradation of organic material. A rise in temperature is the result of microbial metabolic heat production and accumulation, reflecting the metabolic intensity of microorganisms and the conversion rate of compost substances, which eventually affect gas emissions during composting [23,24]. For example, too high a composting temperature (more than 70 °C) will inhibit the growth of microorganisms and cause a large amount of greenhouse gas emissions [20,25]. The addition of SSP showed no significant effect on temperature change, indicating that SSP had no adverse effects during composting, as reported previously by Yuan et al. [20]. In addition, an appropriate pH value is conducive to the in-pile reaction [26]. Onwosi et al. [8] found that too low a pH would delay the compost entering the thermophilic phase. In this study, the addition of SSP at the beginning of composting decreased the maximum temperature of the compost, which may be because the addition of SSP reduced the pH value of the compost, which had an inhibitory effect on the activity of thermophilic microorganisms in the compost [27]. However, this had no adverse effect on compost quality, which was consistent with the results of Voropaev et al. [28] and Mei et al. [29] in their studies on the effects of additives on compost. The EC value reflects the content of soluble salt in compost [8]. The increase in the EC value in compost with time is due to the production of a large amount of salt, such as ammonium ions, nitrate nitrogen, and nitrite nitrogen [30]. In addition, the main components of SSP are Ca(H2PO4) 2·H2O, a small amount of free H3PO4 and anhydrous calcium sulfate. There were many soluble ions [31], so the EC value of each treatment increased with increasing SSP, and the EC values of 3% and 6% SSP additions were significantly higher than those without SSP. Yang et al. [32] also indicated that in the treatment with SSP added, phosphate radicals easily formed phosphate with ammonia, so the treatment with SSP added in the composting process increased the EC value compared with the treatment without the addition of SSP.
TN loss in the process of composting is mainly caused by the volatilized forms of NH3 and N2O, while SSP can reduce nitrogen loss by reducing nitrogen gas emissions [10,32]. In the process of composting, the nitrogen loss of compost gradually decreased with increasing SSP. Wu et al. [17] found that the nitrogen fixation rate of phosphate reached 24.4%, and Predotova et al. [33] determined that a 50% nitrogen loss in manure compost was reduced by the addition of 33% phosphate. This was also reflected in this study, in which the addition of 6% SSP in both treatments significantly reduced the loss of nitrogen. Hu et al. [34] pointed out that phosphorus and potassium in compost are not easily lost, and their total amount is not affected by morphological changes. Therefore, the increase in TP and TK contents over time in this study was mainly caused by the “concentration effect” formed by water loss and organic matter mineralization and decomposition [35]. In addition, the TP content of each treatment at the end of composting was determined by the amount of SSP added, and the addition of straw had a dilution effect on pig manure compost. During the process of composting, the content of organic matter decreased with increasing SSP, and the degradation rate of organic matter increased, which indicated that the addition of SSP could accelerate the decomposition of organic matter. Li et al. [36] pointed out that this may be because Ca2+ in SSP is the activator of some microbial amylases and proteases, which improved the activity of microorganisms and their decomposition of organic matter. In this study, the degradation effect on organic matter with 6% SSP was significantly higher than that without SSP.

4.2. Effects of Superphosphate on Compost Gas Emission

Temperature is a reflection of the intensity of NH3 emissions in compost; a high emission rate was maintained during the thermophilic period [37]. During the early stage of composting, organic matter was decomposed by microorganisms to produce NH4+. At this time, the compost was in the thermophilic stage, and NH4+ was rapidly converted into NH3 and dissipated [10]. With the prolongation of composting time, the substrate in the pile was gradually depleted, ammonification was weakened [38], and the emission rate of NH3 gradually decreased, which was consistent with previous research results [25,39]. In this study, the addition of SSP significantly reduced the cumulative emission of NH3, which may be because calcium SSP contains a large amount of Ca(H2PO4)2 and CaSO4·2H2O [7], in which free sulfuric acid and phosphoric acid react with ammonia to generate ammonium sulfate and ammonium phosphate, respectively [40]. In addition, phosphoric acid reacts with ammonia to gradually form monoammonium phosphate, diammonium phosphate, and triammonium phosphate. The more phosphoric acid and ammonia that can be reacted, the easier it is to form triammonium phosphate [41]. At the same time, SSP can also inhibit the ionization of NH4+ by reducing the pH value of the reactor. Therefore, in this study, with the increase in the amount of SSP, the cumulative emission of NH3 decreased. SSP has a good fixation effect on NH3 in compost. The emission reduction effect of 6% SSP was significantly higher than that of 3% SSP.
N2O in compost is mainly produced by the nitrification of ammonia nitrogen under nitrifying bacteria and the denitrification of nitrate nitrogen under denitrifying bacteria [42]. Some researchers believe that N2O can also be produced by the ammonia oxidation reaction of high-temperature-resistant methane-oxidizing bacteria in the early stage of composting [43]. At present, different researchers have different views on the impact of SSP on N2O emissions in compost. In a study of pig manure composting, Luo et al. [44] found that the cumulative N2O emission of SSP was reduced by 17.7–34.7% when the fresh weight of added material was 3.3–13.2%, but Yang et al. [45] and Li et al. [16] both indicated that SSP had a promoting effect on N2O emission. In this study, the cumulative N2O emissions of the group without straw treatment decreased with the increase in SSP, which was consistent with the research results of Luo et al. [44] and Yamulki et al. [46], namely, that SSP reduced the N2O emissions in the thermophilic period. However, the N2O emissions of the group with straw treatment did not follow this rule. Maeda et al. [47] also found that the N2O emissions in compost were complex. Since N2O emission is regulated by various factors such as nitrogen form, straw addition, and water content, it is necessary to further study its mechanism of action.
When anaerobic conditions occur in the reactor, methanogens use simple organic matter in the bottom material of the reactor for anaerobic digestion and decompose the organic matter into CH4 [48]. Yang et al. [45] found in vegetable compost that CH4 emissions tended to decrease with increasing SSP addition, which was not reflected in this experiment and may be related to the materials and conditions of composting. With the composting process, the oxygen in the pile was gradually consumed, the dense pile made it difficult for external oxygen to enter [49], and the pile was prone to becoming a hypoxic environment, so good ventilation conditions should be guaranteed.
Carbon loss in composting is mainly in the form of CO2, and the CO2 emission rate reflects the decomposition of organic matter and the activity of microorganisms during the process [50]. In this study, after composting began, organic matter was decomposed to produce CO2 and H2O under the activity of microorganisms [51]. Awasthi et al. [50] proposed that SSP could slow the decomposition of organic matter by inhibiting microbial activity, therefore inhibiting CO2 emissions in compost. However, this may be related to the amount of SSP. This study found that 3% SSP increased CO2 emissions, while 6% SSP significantly reduced CO2 emissions, which was consistent with Yang et al.’s [45] proposal that adding a small amount of SSP will increase CO2 emissions but increasing the amount will reduce CO2 emissions.
This study found that N2O contributed the most to the greenhouse effect, which was consistent with the results of Luo et al. [44]. The N2O emissions in pig manure compost accounted for 56~69% of the greenhouse effect. However, this was higher than the global warming potential of 154.68~327.30 kg·Mg−1 measured by Zhao et al. [52] in a study on pig manure composting by turning pile frequency, because N2O emissions in this experiment were larger and the global warming potential was 298 times that of CO2. Jiang et al. [53] conducted pig manure composting under different conditions and found that the total greenhouse gas emissions ranged from 289–720 kg·Mg−1, which was consistent with the experimental results.

5. Conclusions

The addition of SSP reduced the maximum temperature during composting but had no negative effect on the quality of compost, and the addition of SSP increased the total nutrient content at the end of composting.
The emission of NH3 in the composting process was mainly concentrated in the thermophilic period. The addition of SSP reduced the emission of NH3. The rate of the reduction in NH3 with 6% SSP addition was 45.63~77.04% compared with the pig manure treatment.
During the process of composting, the global warming potential of the pig manure + 6% SSP treatment was reduced by 72.8% compared with the pig manure treatment.

Author Contributions

Data curation, Y.P. and P.S.; writing—original draft preparation, Y.P.; writing—review and editing, Y.P.; supervision, H.C.; project administration, H.C. All authors have read and agreed to the published version of the manuscript.

Funding

This research was funded by the National Key R&D Program of China (2017YFD0801304).

Data Availability Statement

This study includes all supporting data, which can be obtained from the corresponding authors upon request.

Acknowledgments

The authors thank the review experts for their valuable comments and suggestions and express their gratitude to all the participating administrators involved in this work.

Conflicts of Interest

The authors declare no conflict of interest.

References

  1. Hu, Z.Z.; Yu, F.W.; Zhao, Z.L. Review of research on utilization of livestock and poultry waste in China. Ecol. Econ. 2019, 35, 186–193. [Google Scholar]
  2. Rural Social and Economic Survey Division, National Bureau of Statistics. China Rural Statistical Yearbook; China Statistics Press: Beijing, China, 2019.
  3. Naujokienė, V.; Bagdonienė, I.; Bleizgys, R.; Rubežius, M. A biotreatment effect on dynamics of cattle manure composition and reduction of ammonia emissions from agriculture. Agriculture 2021, 11, 11040303. [Google Scholar] [CrossRef]
  4. Jain, M.S.; Jambhulkar, R.; Kalamdhad, A.S. Biochar amendment for batch composting of nitrogen rich organic waste: Effect on degradation kinetics, composting physis and nutritional properties. Bioresour. Technol. 2018, 253, 204–213. [Google Scholar] [CrossRef] [PubMed]
  5. Wojcieszak, D.; Zaborowicz, M.; Przybył, J.; Boniecki, P.; Jedru´s, A. Assessment of the content of dry matter and dry organic matter in compost with neural modelling methods. Agriculture 2021, 11, 11040307. [Google Scholar] [CrossRef]
  6. Impraim, R.; Weatherley, A.; Coates, T.; Chen, D.L.; Suter, H. Lignite improved the quality of composted manure and mitigated emissions of ammonia and greenhouse gases during forced aeration composting. Sustainability 2020, 12, 10528. [Google Scholar] [CrossRef]
  7. Gabhane, J.; William, S.P.M.P.; Bidyadhar, R.; Bhilawe, P.; Anand, D.; Vaidya, A.N.; Wate, S.R. Additives aided composting of green waste: Effects on organic matter degradation, compost maturity, and quality of the finished compost. Bioresour. Technol. 2012, 114, 382–388. [Google Scholar] [CrossRef]
  8. Onwosi, C.O.; Igbokwe, V.C.; Odimba, J.N.; Eke, I.E.; Nwankwoala, M.O.; Iroh, I.N.; Ezeogu, L. Composting technology in waste stabilization: On the methods, challenges and future prospects. J. Environ. Manag. 2017, 190, 140–157. [Google Scholar] [CrossRef]
  9. Awasthi, M.K.; Duan, Y.; Awasthi, S.K.; Liu, T.; Zhang, Z.Q. Effect of biochar and bacterial inoculum additions on cow dung composting. Bioresour. Technol. 2020, 297, 122407. [Google Scholar] [CrossRef]
  10. Awasthi, M.K.; Wang, Q.; Huang, H.; Ren, X.N.; Lahori, A.H.; Mahar, A.; Ali, A.; Shen, F.; Li, R.H.; Zhang, Z.Q. Influence of zeolite and lime as additives on greenhouse gas emissions and maturity evolution during sewage sludge composting. Bioresour. Technol. 2016, 216, 172–181. [Google Scholar] [CrossRef]
  11. Li, Y.B.; Liu, T.T.; Song, J.L.; Lv, J.H.; Jiang, J.S. Effects of chemical additives on emissions of ammonia and greenhouse gas during sewage sludge composting. Process. Saf. Environ. Prot. 2020, 143, 129–137. [Google Scholar] [CrossRef]
  12. Fukumoto, Y.; Suzuki, K.; Kuroda, K.; Waki, M.; Yasuda, T. Effects of struvite formation and nitratation promotion on nitrogenous emissions such as NH3, N2O and NO during swine manure composting. Bioresour. Technol. 2011, 102, 1468–1474. [Google Scholar] [CrossRef]
  13. Jiang, T.; Ma, X.; Yang, J.; Tang, Q.; Yi, Z.; Chen, M.; Li, G. Effect of different struvite crystallization methods on gaseous emission and the comprehensive comparison during the composting. Bioresour. Technol. 2016, 217, 219–226. [Google Scholar] [CrossRef] [PubMed]
  14. Zhang, D.; Luo, W.; Yuan, J.; Li, G.; Luo, Y. Effects of woody peat and superphosphate on compost maturity and gaseous emissions during pig manure composting. Waste Manag. 2017, 68, 56–63. [Google Scholar] [CrossRef] [PubMed]
  15. Cao, J.; Li, R.; Qu, H.; Wang, P.; Fu, J.; Chen, M.; Chen, Y. Effects of the membrane-covered technology and superphosphate on the compost quality and nitrogencontaining gas emissions during aerobic composting. BioResources 2022, 17, 1781–1793. [Google Scholar] [CrossRef]
  16. Li, Y.; Qiu, H.Z.; Zang, J.B.; Su, Y.Q.; Wei, R.Y.; Cheng, Z.Y. Effects of superphosphate and furfural residue addition on NH3 emissions and nitrogen conversion during the aerobic composting. Chin. J. Environ. Eng. 2021, 15, 3992–4000. [Google Scholar]
  17. Wu, J.; He, S.Z.; Li, G.X.; Zhao, Z.H.; Wei, Y.Q.; Lin, Z.; Tao, D. Reducing ammonia and greenhouse gas emission with adding high levels of superphosphate fertilizer during composting. Environ. Sci. Pollut. Res. Int. 2019, 26, 30921–30929. [Google Scholar] [CrossRef]
  18. Jiang, T.; Schuchardt, F.; Li, G.X.; Guo, R.; Zhao, Y.Q. Effect of C/N ratio, aeration rate and moisture content on ammonia and greenhouse gas emission during the composting. J. Environ. Sci. 2011, 23, 1754–1760. [Google Scholar] [CrossRef] [PubMed]
  19. Luo, W.H.; Yuan, J.; Luo, Y.M.; Li, G.X.; Nghiem, L.D.; Price, W.E. Effects of mixing and covering with mature compost on gaseous emissions during composting. Chemosphere 2014, 117, 14–19. [Google Scholar] [CrossRef] [Green Version]
  20. Yuan, J.; Li, Y.; Zhang, H.; Zhang, D.; Chadwick, D.; Li, G.; Wang, G.; Chi, M.; Yang, F. Effects of adding bulking agents on the biodrying of kitchen waste and the odor emissions produced. J. Environ. Sci. 2018, 67, 344–355. [Google Scholar] [CrossRef]
  21. NY 525-2012; Organic Manure. The Ministry of Agriculture of the People’s Republic of China: Beijing, China, 2012.
  22. NY/T3442-2019; Technical Specification for Composting Livestock and Poultry Manure. Ministry of Agriculture and Rural Affairs of the People’s Republic of China: Beijing, China, 2019.
  23. Akdeniz, N. A systematic review of biochar use in animal waste composting. Waste Manag. 2019, 88, 291–300. [Google Scholar] [CrossRef]
  24. Szanto, G.L.; Hamelers, H.V.; Rulkens, W.H.; Veeken, A.H.M. NH3, N2O and CH4 emissions during passively aerated composting of straw-rich pig manure. Bioresour. Technol. 2007, 98, 2659–2670. [Google Scholar] [CrossRef] [PubMed]
  25. Yang, Y.; Yin, Z.M.; Li, L.Q.; Li, Y.; Liu, Y.; Luo, Y.M.; Li, G.X.; Yuan, J. Effects of dicyandiamide, phosphogypsum and superphosphate on greenhouse gas emissions during pig manure composting. Sci. Total Environ. 2022, 846, 157487. [Google Scholar] [CrossRef] [PubMed]
  26. Bernal, M.P.; Sommer, S.G.; Chadwick, D.; Chen, Q.; Li, G.X.; Michel, F.C. Current approaches and future trends in compost quality criteria for agronomic, environmental, and human health benefits. Adv. Agron. 2017, 144, 143–233. [Google Scholar]
  27. Lei, L.S.; Gu, J.; Wang, X.J.; Song, Z.L.; Wang, J.; Yu, J.; Hu, T.; Dai, X.X.; Xie, J.; Zhao, W.Y. Microbial succession and molecular ecological networks response to the addition of superphosphate and phosphogypsum during swine manure composting. J. Environ. Manag. 2021, 279, 111560. [Google Scholar] [CrossRef]
  28. Voropaev, V.; Alfimova, N.; Nikulin, I.; Nikulicheva, T.; Titenko, A.; Nikulichev, V. Influence of gypsum-containing waste on ammonia binding in animal waste composting. Agriculture 2021, 11, 1153. [Google Scholar] [CrossRef]
  29. Mei, J.; Li, B.; Su, L.H.; Zhou, X.J.; Duan, E.S. Effects of potassium persulfate on nitrogen loss and microbial community during cow manure and corn straw composting. Bioresour. Technol. 2022, 363, 127919. [Google Scholar] [CrossRef] [PubMed]
  30. Bernal, M.P.; Alburquerque, J.A.; Moral, R. Composting of animal manures and chemical criteria for compost maturity assessment. A review. Bioresour. Technol. 2009, 100, 5444–5453. [Google Scholar] [CrossRef] [PubMed]
  31. Kammoun, M.; Ghorbel, I.; Charfeddine, S.; Kamoun, L.; Gargouri-Bouzid, R.; Nouri-Ellouz, O. The positive effect of phosphogypsum-supplemented composts on potato plant growth in the field and tuber yield. J. Environ. Manag. 2017, 200, 475–483. [Google Scholar] [CrossRef]
  32. Zhang, Z.; Liu, D.H.; Qiao, Y.; Li, S.L.; Chen, Y.F.; Hu, C. Mitigation of carbon and nitrogen losses during pig manure composting: A meta-analysis. Sci. Total Environ. 2021, 783, 147103. [Google Scholar] [CrossRef]
  33. Predotova, M.; Schlecht, E.; Buerkert, A. Nitrogen and carbon losses from dung storage in urban gardens of Niamey, Niger. Nutr. Cycl. Agroecosyst. 2010, 87, 103–114. [Google Scholar] [CrossRef] [Green Version]
  34. Hu, Y.T.; Shi, L.H.; Liu, D.M.; Tong, S.W.; Wei, M.Y.; Sun, J. Effects of adding sulphuric acid on composting process of cattle manure and changes of main nutrients. J. Plant Nutr. 2014, 20, 718–725. [Google Scholar]
  35. Bustamante, M.A.; Ceglie, F.G.; Aly, A.; Mihreteab, H.T.; Ciaccia, C.; Tittarelli, F. Phosphorus availability from rock phosphate: Combined effect of green waste composting and sulfur addition. J. Environ. Manag. 2016, 182, 557–563. [Google Scholar] [CrossRef] [PubMed]
  36. Li, G.X.; Zhang, F.S. Solid Waste Composting and Organic Compound Fertilizer Production; Chemical Industry Press: Beijing, China, 2000. [Google Scholar]
  37. Walling, E.; Trémier, A.; Vaneeckhaute, C. A review of mathematical models for composting. Waste Manag. 2020, 113, 379–394. [Google Scholar] [CrossRef] [PubMed]
  38. El-Rahim, M.G.M.A.; Dou, S.; Xin, L.; Xie, S.; Sharaf, A.; Alio Moussa, A.; Eissa, M.A.; Mustafa, A.A.; Ali, G.A.M.; Hamed, M.H. Effect of biochar addition method on ammonia volatilization and quality of chicken manure compost. Zemdirb. Agric. 2021, 108, 331–338. [Google Scholar] [CrossRef]
  39. Barthod, J.; Rumpel, C.; Dignac, M. Composting with additives to improve organic amendments. A review. Agron. Sustain. Dev. 2018, 38, 1–23. [Google Scholar] [CrossRef] [Green Version]
  40. Yuan, J.; Li, Y.; Chen, S.L.; Li, D.Y.; Tang, H.; Chadwick, D.; Li, S.Y.; Li, W.W.; Li, G.X. Effects of phosphogypsum, superphosphate, and dicyandiamide on gaseous emission and compost quality during sewage sludge composting. Bioresour. Technol. 2018, 270, 368–376. [Google Scholar] [CrossRef]
  41. Sarda, L.G.; Higarashi, M.M.; Nicoloso, R.S.; Falkoski, C.; Ribeiro, S.M.S.; Silveira, C.A.P.; Soares, H.M. Effects of dicyandiamide and Mg/P on the global warming potential of swine slurry and sawdust cocomposting. Environ. Sci. Pollut. Res. 2020, 27, 30405–30418. [Google Scholar] [CrossRef]
  42. Cáceres, R.; Maliãska, K.; Marfà, O. Nitrification within composting: A review. Waste Manag. 2018, 72, 119–137. [Google Scholar] [CrossRef]
  43. Wang, Q.; Awasthi, M.K.; Ren, X.N.; Zhao, J.C.; Li, R.H.; Wang, Z.; Wang, M.J.; Chen, H.Y.; Zhang, Z.Q. Combining biochar, zeolite and wood vinegar for composting of pig manure: The effect on greenhouse gas emission and nitrogen conservation. Waste Manag. 2018, 74, 221–230. [Google Scholar] [CrossRef]
  44. Luo, Y.M.; Li, G.X.; Frank, S.; Wang, K.; Jiang, T.; Luo, W.H. Effects of additive superphosphate on NH3, N2O and CH4 emissions during pig manure composting. Trans. Chin. Soc. Agric. Eng. 2012, 28, 235–242. [Google Scholar]
  45. Yang, Y.; Sun, Q.P.; Li, N.; Liu, C.S.; Li, J.J.; Liu, B.S.; Zou, G.Y. Effects of superphosphate addition on NH3 and greenhouse gas emissions during vegetable waste composting. Agric. Sci. Technol. 2016, 17, 900–905. [Google Scholar]
  46. Yamulki, S. Effect of straw addition on nitrous oxide and methane emissions from stored farmyard manures. Agric. Ecosyst. Environ. 2006, 112, 140–145. [Google Scholar] [CrossRef]
  47. Maeda, K.; Toyoda, S.; Philippot, L.; Hattori, S.; Nakajima, K.; Ito, Y.; Yoshida, N. Relative contribution of nirKand nirS-bacterial denitrifiers as well as fungal denitrifiers to nitrous oxide production from dairy manure compost. Environ. Sci. Technol. 2017, 51, 14083–14091. [Google Scholar] [CrossRef] [PubMed]
  48. Santos, A.; Bustamante, M.A.; Tortosa, G.; Moral, R.; Bernal, M.P. Gaseous emissions and process development during composting of pig slurry: The influence of the proportion of cotton gin waste. J. Clean. Prod. 2016, 112, 81–90. [Google Scholar] [CrossRef]
  49. Philippe, F.X.; Laitat, M.; Nicks, B.; Cabaraux, J.F. Ammonia and greenhouse gas emissions during the fattening of pigs kept on two types of straw floor. Agric. Ecosyst. Environ. 2012, 150, 45–53. [Google Scholar] [CrossRef]
  50. Awasthi, M.K.; Wang, M.; Chen, H.; Wang, Q.; Zhao, J.; Ren, X.; Li, D.; Awasthi, S.K.; Shen, F.; Li, R.; et al. Heterogeneity of biochar amendment to improve the carbon and nitrogen sequestration through reduce the greenhouse gases emissions during sewage sludge composting. Bioresour. Technol. 2017, 224, 428–438. [Google Scholar] [CrossRef]
  51. Caricasole, P.; Provenzano, M.R.; Hatcher, P.G.; Senesi, N. Chemical characteristics of dissolved organic matter during composting of different organic wastes assessed by C-13 CPMAS NMR spectroscopy. Bioresour. Technol. 2010, 101, 8232–8236. [Google Scholar] [CrossRef]
  52. Zhao, C.Y.; Li, H.M.; Wei, Y.S.; Zhong, J.; Zheng, J.X.; Han, S.H.; Wan, H.F. Effects of turning frequency on emission of greenhouse gas and ammonia during swine manure windrow composting. Environmental 2014, 35, 533–540. [Google Scholar]
  53. Jiang, J.S.; Huang, Y.M.; Liu, X.L.; Huang, H. The effects of apple pomace, bentonite and calcium superphosphate on swine manure aerobic composting. Waste Manag. 2014, 34, 1595–1602. [Google Scholar] [CrossRef]
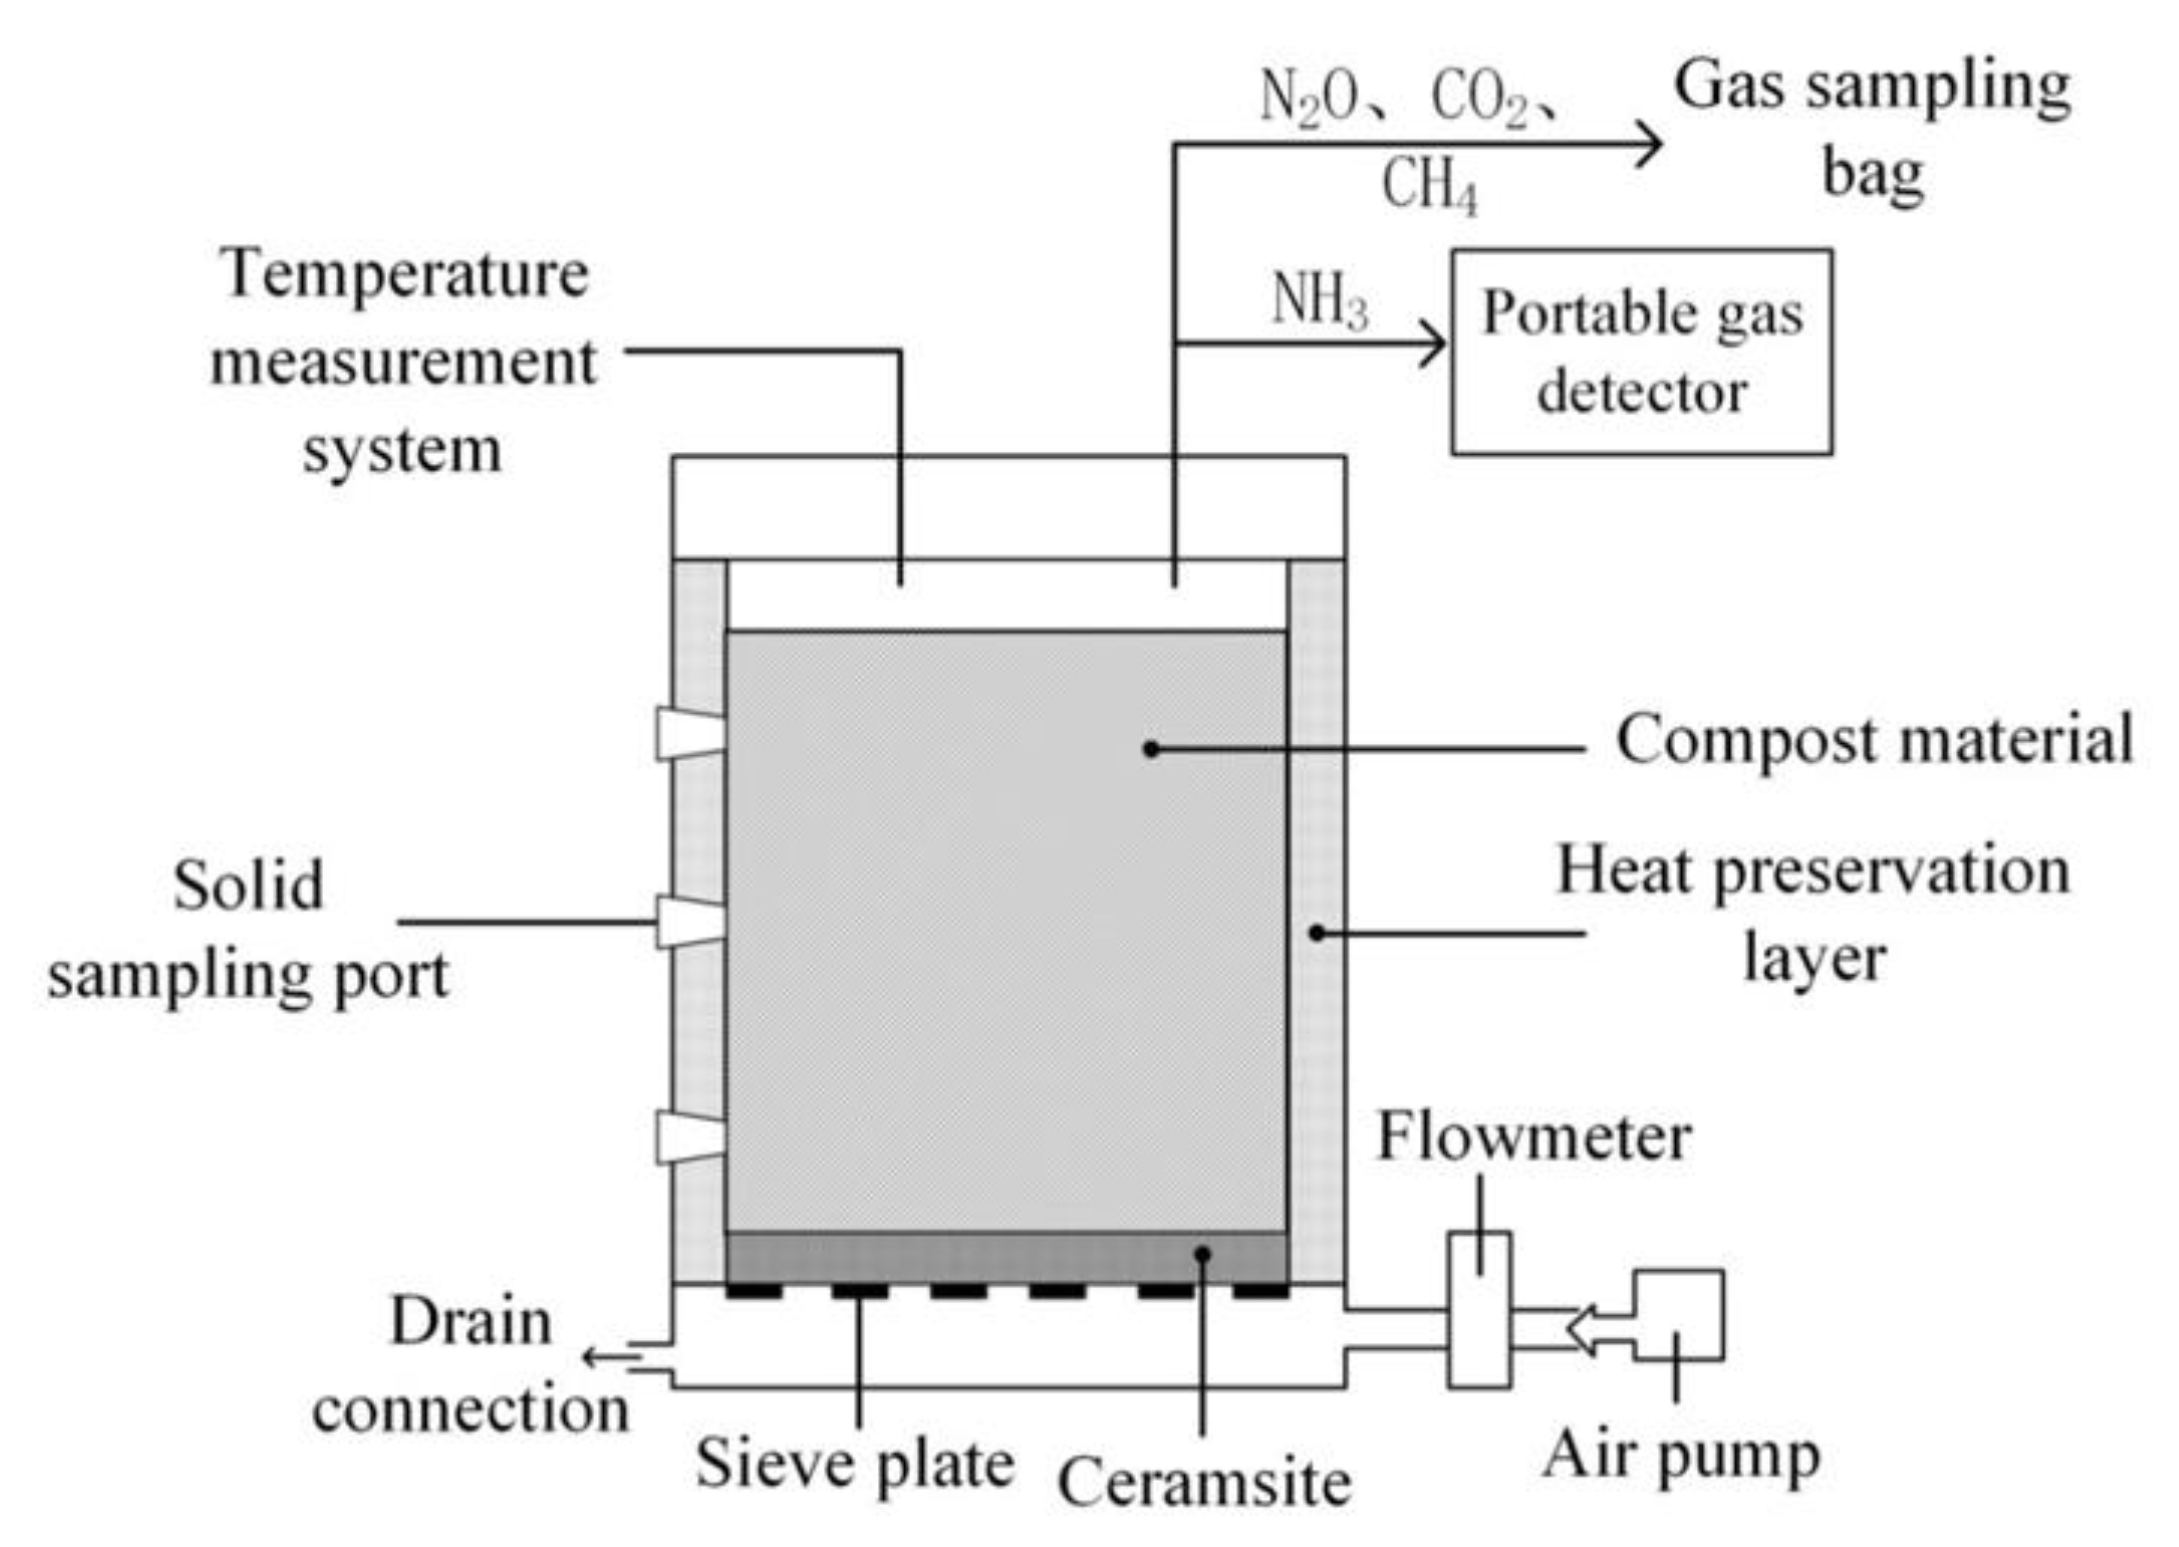
Figure 1. Schematic diagram of the composting system.
Agronomy 13 00560 g001
Figure 2. Variation in temperature (A), Ph (B), and EC (C) during composting. S1: pig manure + straw; S2: pig manure + straw + 3% SSP; S3: pig manure + straw + 6% SSP; M1: pig manure; M2: pig manure + 3% SSP; M3: pig manure + 6% SSP.
Agronomy 13 00560 g002
Figure 3. Variation in TN (A), TP (B), TK (C), and organic matter (D) during composting. S1: pig manure + straw; S2: pig manure + straw + 3% SSP; S3: pig manure + straw + 6% SSP; M1: pig manure; M2: pig manure + 3% SSP; M3: pig manure + 6% SSP.
Agronomy 13 00560 g003
Figure 4. NH3 emission rate (A) and cumulative NH3 emissions (B) during composting. S1: pig manure + straw; S2: pig manure + straw + 3% SSP; S3: pig manure + straw + 6% SSP; M1: pig manure; M2: pig manure + 3% SSP; M3: pig manure + 6% SSP.
Agronomy 13 00560 g004
Figure 5. N2O emission rate (A) and cumulative N2O emissions (B) during composting. S1: pig manure + straw; S2: pig manure + straw + 3% SSP; S3: pig manure + straw + 6% SSP; M1: pig manure; M2: pig manure + 3% SSP; M3: pig manure + 6% SSP.
Agronomy 13 00560 g005
Figure 6. CH4 emission rate (A) and cumulative CH4 emissions (B) during composting. S1: pig manure + straw; S2: pig manure + straw + 3% SSP; S3: pig manure + straw + 6% SSP; M1: pig manure; M2: pig manure + 3% SSP; M3: pig manure + 6% SSP.
Agronomy 13 00560 g006
Figure 7. CO2 emission rate (A) and cumulative CO2 emissions (B) during composting. S1: pig manure + straw; S2: pig manure + straw + 3% SSP; S3: pig manure + straw + 6% SSP; M1: pig manure; M2: pig manure + 3% SSP; M3: pig manure + 6% SSP.
Agronomy 13 00560 g007
Table 1. Characteristics of compost materials.
MaterialspHTN/(%)TP/(%)TK/(%)TOC/(%)
Pig manure7.93 ± 0.081.00 ± 0.000.49 ± 0.080.33 ± 0.0557.61 ± 1.17
Straw6.71 ± 0.070.83 ± 0.050.39 ± 0.061.00 ± 0.0461.03 ± 2.17
Note: TN: total nitrogen; TP: total phosphorus; TK: total potassium; TOC: total organic carbon.
Table 2. Global warming potential of CO2, CH4, and N2O (kg·Mg−1).
TreatmentN2OCH4CO2Total
S1512.1911.1080.34603.63
M1865.000.8095.19960.98
S2387.0212.7983.12482.93
M2421.3513.2997.71532.35
S3641.0613.1376.01730.20
M3175.170.5885.39261.14
S1: pig manure + straw; S2: pig manure + straw + 3% SSP; S3: pig manure + straw + 6% SSP; M1: pig manure; M2: pig manure + 3% SSP; M3: pig manure + 6% SSP.
Disclaimer/Publisher’s Note: The statements, opinions and data contained in all publications are solely those of the individual author(s) and contributor(s) and not of MDPI and/or the editor(s). MDPI and/or the editor(s) disclaim responsibility for any injury to people or property resulting from any ideas, methods, instructions or products referred to in the content.