Article

Transcriptome and Proteome Analysis Identifies Salt Stress Response Genes in Bottle Gourd Rootstock-Grafted Watermelon Seedlings

College of Horticulture, Nanjing Agricultural University, Nanjing 210095, China
*
Author to whom correspondence should be addressed.
Agronomy 2023, 13(3), 618; https://doi.org/10.3390/agronomy13030618
Submission received: 27 December 2022 / Revised: 13 February 2023 / Accepted: 20 February 2023 / Published: 21 February 2023
(This article belongs to the Special Issue Recent Advances in Horticultural Crops-from Omics to Biotechnology)

Abstract

:
Soil salinization poses a huge challenge to the development of agriculture and seriously decreases crop yield and quality. In recent years, grafting has become one of the key agronomic techniques used to enhance plant abiotic stress tolerance. In this study, we found that watermelon [Citrullus lanatus (Thunb.) Matsum. & Nakai] grafted onto bottle gourd (Lagenaria siceraria Standl.) significantly enhanced salt tolerance. Transcriptome analysis revealed that a total of 8462 differentially expressed genes (DEGs) were identified, and the number of up- and down-regulated genes were 3207 and 5255, respectively. The DEGs in the bottle gourd rootstock-grafted plants were mainly involved in carbon metabolism, photosynthesis, and plant hormone signal transduction. Furthermore, proteome analysis identified 28 differently expressed proteins (DEPs) in bottle gourd rootstock-grafted plants under salt stress. These DEPs were closely associated with amino acid and protein synthesis, photosynthesis, mitochondrial metabolism and carbon metabolism, and stress defense. Combined transcriptome and proteome analyses showed that salt stress-responded genes in bottle gourd rootstock-grafted watermelon seedlings were mainly involved in plant hormone signal transduction, photosynthesis, and amino acid synthesis pathways.

1. Introduction

This research describes and provides evidence for salt tolerance in the C3 plant watermelon [Citrullus lanatus (Thunb.) Matsum. & Nakai]. The area of secondary salinization is increasing due to excessive fertilization, which seriously declines crop yield [1]. Excessive salt leads to osmotic stress and ion toxicity, and destroys the balance of soil nutrients, which ultimately influences plant growth [2]. In order to resist salt stress, plants often adapt to or resist the harm of salt entering their cells by regulating their own physiological metabolic changes. In long-term evolution, plants have developed a variety of mechanisms for adapting to salt stress, such as activation of the anti-oxidative system, the exclusion of salts, and the accumulation of salts for osmotic adjustment by the roots [3]. Plant roots play a critical role in salt stress resistance [4]. Therefore, using grafting technology to select salt tolerant roots as rootstocks can improve plant salt tolerance.
Previous research showed that salt tolerant rootstock grafting can significantly improve the tolerance of crops to salt stress [5,6]. Salt stress-tolerant rootstock roots of grafted plants have been found to limit the entry of harmful salt ions (Na+ and Cl) into scion leaves and maintain a low Na+/K+ ratio in leaf cells to ensure their normal physiological functions [5,7,8]. Presently, most of the research about how grafting improves plant salt tolerance focuses on rootstocks, and most research results focus on rootstocks’ participation in regulating ion absorption and transport, osmotic balance, hormone balance, redox balance, etc. [9,10,11]. Recently, some studies have also explored salt tolerance genes, transcriptional regulation, and protein expression in grafted plants [6,12]. Furthermore, there is communication between long-distance signals and substances in grafted plants, and in addition to common hormones, mineral elements, and soluble sugars, organic macromolecular mRNAs, miRNAs, peptides, and functional proteins can also be delivered between rootstocks and scions, influencing grafted plants’ growth under salt stress [11].
Watermelon is a widely cultivated vegetable crop species that is sensitive to salinity, and 300 mM NaCl treatment significantly inhibits the growth and photosynthesis of watermelon [13,14]. Grafting is widely used as an economic, effective, and convenient method to increase watermelon salt tolerance [9]. Bottle gourd (Lagenaria siceraria Standl.) is a member of the Cucurbitaceae family. It originates from sub-Saharan Africa and is widely cultivated, especially in East Asian and sub-Saharan African countries [15]. Bottle gourd exhibits a high salinity tolerance and is widely used as the rootstock of watermelon [16]. However, the genes and proteins of bottle gourd rootstock-grafted plants response to salt stress are not fully understood. In the present study, we used bottle gourd rootstock-grafted watermelon to analyze changes in transcription and protein levels during salt stress at different treatment time points and explored the salt stress-responded genes in bottle gourd rootstock-grafted watermelon seedlings.

2. Materials and Methods

2.1. Plant Materials

In the experiments, the watermelon cultivar Xiuli was used as the scion, which is a salt sensitive cultivar that was obtained from the Institute of Horticulture, Anhui Academy of Agricultural Sciences. Bottle gourd cultivar Chaofeng Kangshengwang, a salt tolerant variety, was used as the rootstock. The germinated seeds were sown in quartz sand. The watermelon seeds for the scion were then sown after 7 d of the rootstocks. When the cotyledons of the scion were expanded, top insertion grafts were performed [17]. The grafted plants were cultured in an artificial climate chamber under the following conditions: 22/18 °C day/night, 65–75% relative humidity, 300 μmol m−2 s−1 photosynthetic photon flux density, and a 14/10 h photoperiod.

2.2. Experimental Design

The 21-day-old grafted plants were transferred into 20 L plastic hydroponic tanks that were filled with ½ Hoagland nutrient solution. There were 12 plants in each hydroponic tank, each treatment contained 3 tanks, and they were grown in the same conditions, as mentioned above. Following transplanting for 7 d, 100 mM NaCl was added into the nutrient solution to induce salt stress according to the method used in our previous study [18]. The grafted plants with watermelon as the rootstock that were treated with NaCl were designated as Ss, and the bottle gourd as the rootstock treated with NaCl were designated as Rs.

2.3. Measurement of Fresh and Dry Weight

Following salt stress for 0, 1, 3, and 6 d, three seedlings from each treatment were washed with distilled water. Then, the seedlings were dried with filter paper, and their fresh weights were determined using an electronic balance (OHAUS, Parsippany, NJ, USA). The dry weight was detected, as previously described [19].

2.4. RNA Extraction and Transcriptome Sequencing

For RNA isolation, the leaves were harvested from the Ss and Rs plants at 0, 1, and 3 d and frozen in liquid nitrogen immediately. Total RNA was isolated with a total RNA isolation kit (Takara, Otsu, Japan), following the manufacturer’s instructions. One μg of RNA was reverse transcribed to the cDNA library with a NEBNext® Ultra RNA Library Prep Kit for Illumina® (New England Biolabs, Beverly, MA, USA). The cDNA libraries were sequenced by Beijing Tsingke Biotechnology Co., Ltd. with an Illumina HiSeq2000 platform (Illumina, San Diego, CA, USA).

2.5. RNA Sequence Data Analysis

The clean reads were mapped to the watermelon reference genome [Watermelon (97103) v2 Genome, http://cucurbitgenomics.org/organism/21, access on 28 July 2021] with TopHat v1.4.0 [20]. The expression levels of the genes were estimated by fragments per kilo-base of transcript per million fragments mapped. A DESeq2 R package (1.26.0) was used to analyze the differentially expressed genes (DEGs) according to a false discovery rate (FDR) of <0.05 and |log2 (fold change)|≥1 with a p-value < 0.05 [21]. These DEGs were employed for gene ontology (GO) and the Kyoto Encyclopedia of Genes and Genomes (KEGG) pathways using the GO seq R package and KOBAS 2.0 software at a threshold of FDR ≤ 0.05 [22,23].

2.6. Protein Extraction

To analyze the change in proteins, the leaves of the Ss and Rs plants were collected at 0, 1, 3, and 6 d of salt stress. Leaf samples (1.5 g) were used to isolate the total proteins using the trichloroacetic acid-acetone precipitation method [24], and the concentrations were measured using the Bradford method [25] and stored at −80 °C.

2.7. Two-Dimensional Electrophoresis (2-DE) and Staining

Eight hundred μg of proteins were loaded into an IPG strip (pH 4–7, 13 cm, GE Healthcare, Madison, WI, USA) in a 250 μL rehydration buffer for 12 h, and then isoelectric focusing was carried out following the method of He et al. [26]. Following electrophoresis, the gels were stained by Coomassie Brilliant Blue (CBB) R-250.

2.8. Image Acquisition and Spot Identification

The CBB R-250 stained gel was scanned using an Image Scanner III (GE Healthcare) and analyzed using Image MasterTM 2-D Platinum software (version 6.0, GE Healthcare). Each treatment analyzed at least 3 gels. Each protein spot abundance was measured using percentage volume (vol.%), and at least 1.5-fold changes in spots were identified through matrix-assisted laser desorption/ionization time-of-flight/time-of-flight mass spectrometry (MALDI-TOF/TOF-MS) by Applied Protein Technology Biotechnology Co., Ltd. (Shanghai, China).

2.9. Statistical Analysis

All data represent the mean ± SD (n = 3). Analysis of variance was used for the statistical analysis, and Tukey’s test was used to analyze the significance of treatment differences using SPSS 18.0 software (SPSS Inc., Chicago, IL, USA) at p < 0.05.

3. Results

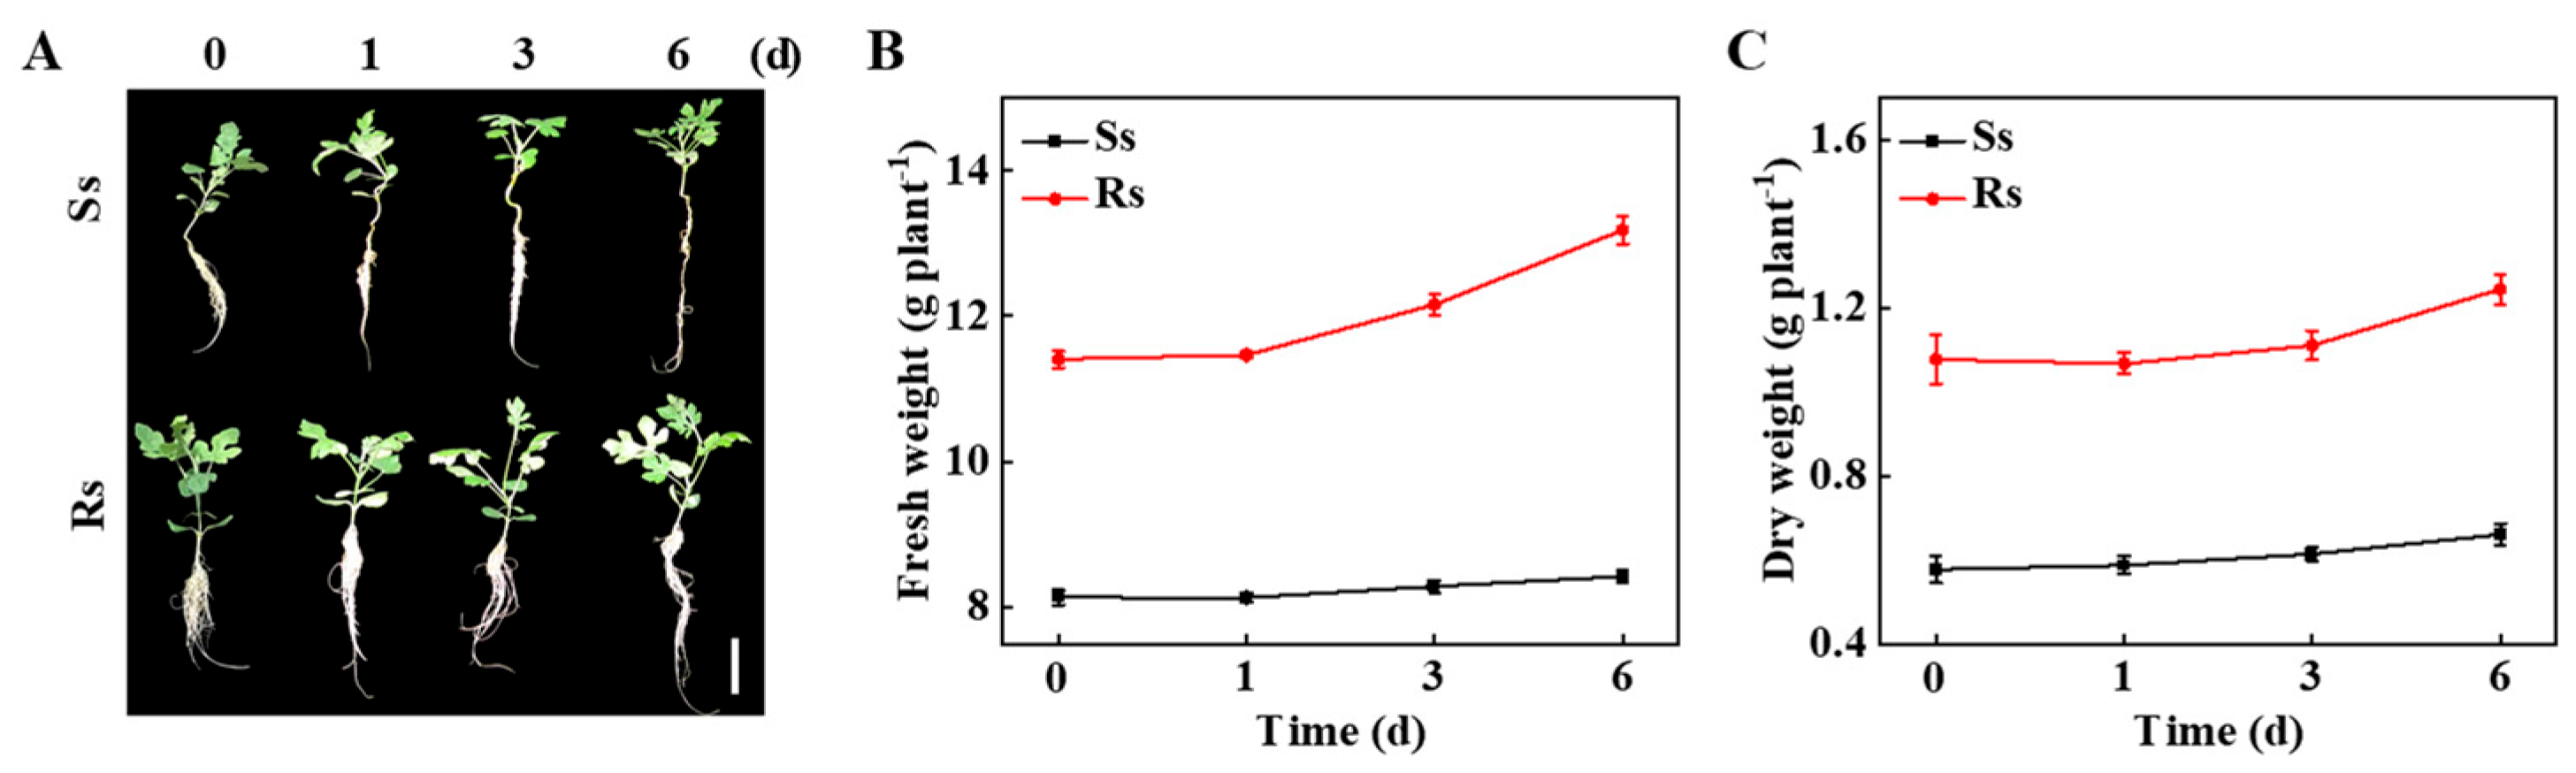
3.1. Bottle Gourd Rootstock Enhanced the Tolerance of Grafted Watermelon to Salt Stress

To test the tolerance of grafted seedlings to salt stress, the self-grafted (Ss) and bottle gourd rootstock-grafted (Rs) watermelon plants were treated with 100 mM NaCl for 6 d, and then the phenotype and biomass were analyzed. Salt stress inhibited the growth of the Ss and Rs plants, but this effect was more profound in the Ss plants (Figure 1A). The fresh and dry weights of the seedlings gradually increased during the elongation of the salt treatment (Figure 1B,C). The Ss and Rs plants’ fresh weight at 6 d increased by 3.44% and 15.51%, respectively, compared with their fresh weight at 0 d (Figure 1B). These results indicate that watermelon grafted onto bottle gourd increases salt tolerance.

3.2. Transcriptome Sequencing Identification of DEGs in Salt Stressed Grafted Watermelon Plants

We constructed 18 cDNA libraries from the Ss and Rs leaves after salt stress treatment at 0, 1, and 3 d and identified DEGs responsible for salt stress in grafted watermelon plants. A total of 743,711,688 clean reads and 206.98 Gb of sequence data were acquired after removing the low-quality sequence reads and adaptor sequences from the raw data (Table S1). The clean reads to raw reads ratio was more than 93.12%, the Q30 was over 93.75%, and the content of GC was about 44% (Table S1), indicating that the sequence data quality and integrity were sufficient for further detailed analysis. Furthermore, the ratio between the reads of each sample and the watermelon reference genome was 73.86–98.20%, and the uniquely mapped ratio was between 70.86% and 95.76% (Table S2).
DEGs were classified according to the up-regulated and down-regulated genes of the Ss and Rs plants. The transcriptome results indicated that the number of DEGs in the Ss plants was higher than the Rs plants at 1 d of salt stress, while it was lower than the Rs plants at 3 d of salt stress (Figure 2A). A total of 1976 (626 up-regulated and 1350 down-regulated), 1705 (628 up-regulated and 1077 down-regulated), 1790 (741 up-regulated and 1049 down-regulated), and 2946 (1212 up-regulated and 1734 down-regulated) DEGs were estimated from the groups of Ss 0 d vs. Ss 1 d, Ss 0 d vs. Ss 3 d, Rs 0 d vs. Rs 1 d, and Rs 0 d vs. Rs 3 d, respectively (Figure 2A and Table S3). A Venn diagram assay showed that 5364 DEGs were detected in the Ss and Rs plants under salt stress (Figure 2B).

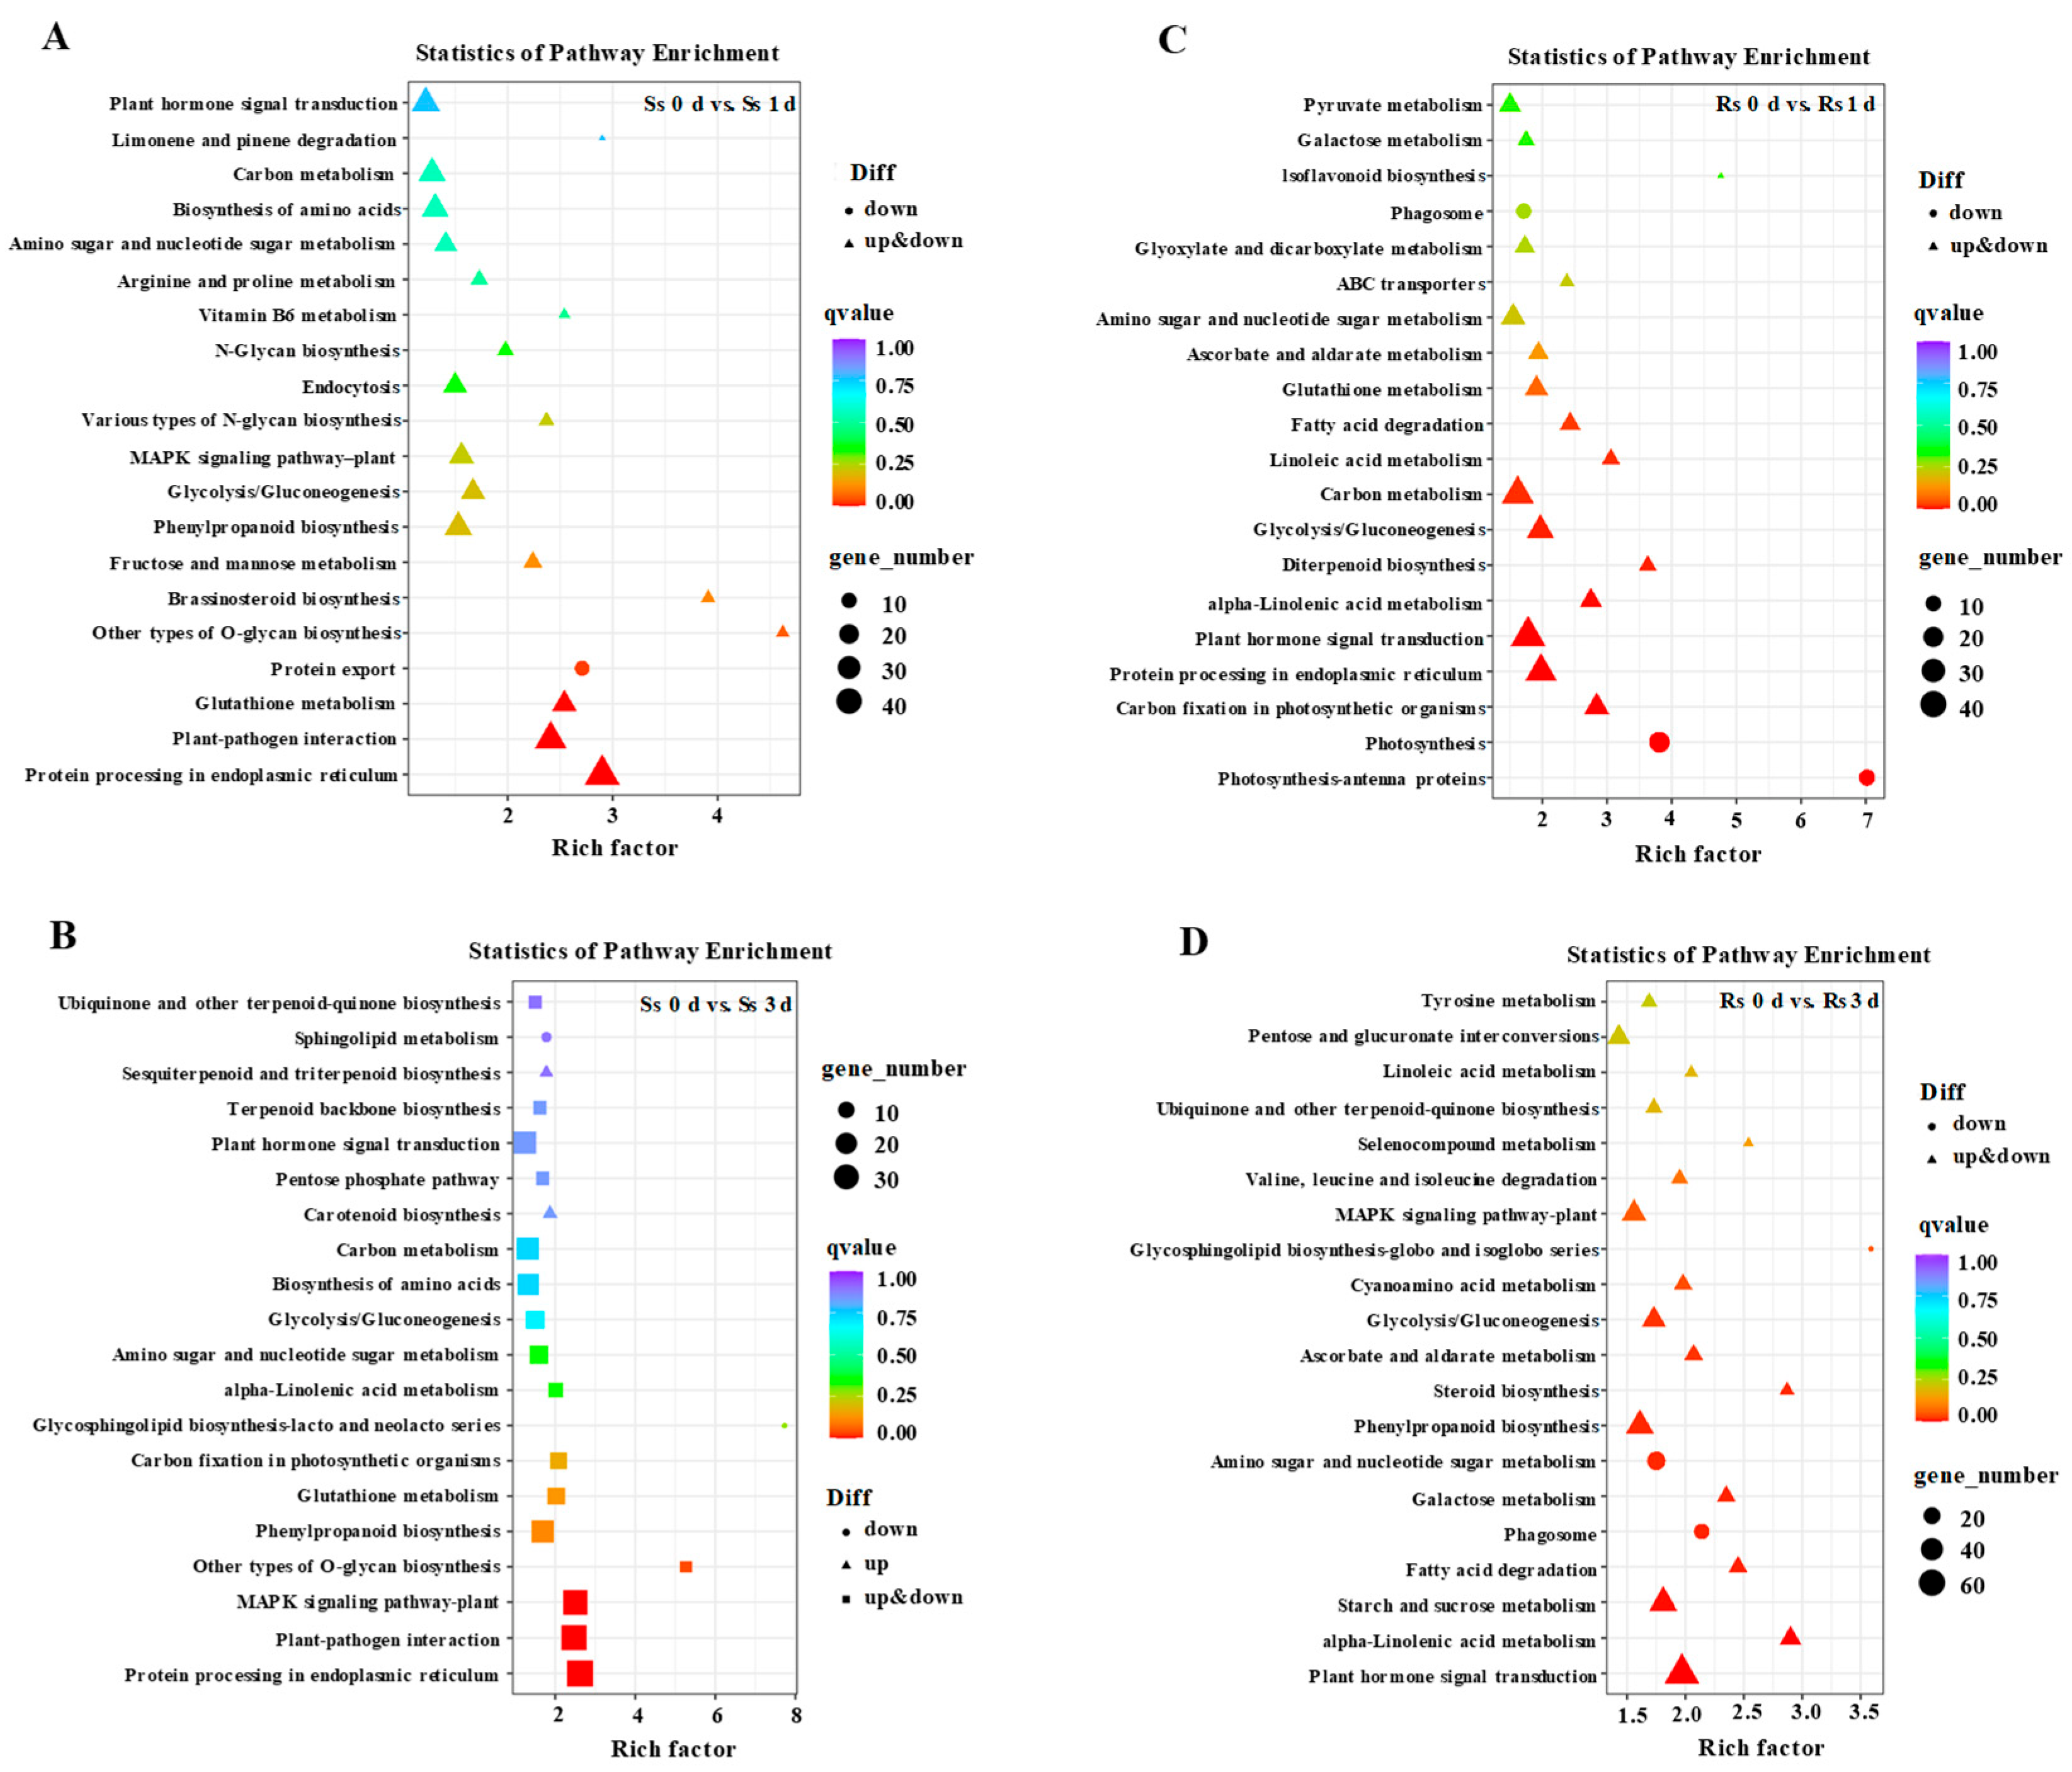
3.3. GO and KEGG Pathway Analyses of DEGs

GO pathway analysis was performed to categorize the role of the DEGs in the groups Ss 0 d vs. Ss 1 d, Ss 0 d vs. Ss 3 d, Rs 0 d vs. Rs 1 d, and Rs 0 d vs. Rs 3 d. These DEGs were divided into three GO classifications. As shown in Table 1, 19, 14, and 9 GO terms were enriched in the biological process, cellular components, and molecular function, respectively. The biological process encoded classified GO terms that were significantly enriched in the cellular process, metabolic process, biological regulation, single-organism process, localization, and response to stimulus (Table 1 and Table S4). The highly enriched GO terms that belonged to the cellular component were related to the membrane, cell, organelle, organelle part, membrane part, cell part, and macromolecular complex (Table 1 and Table S4). Moreover, molecular function GO enrichment analysis revealed that binding, transporter activity, and catalytic activity were highly enriched (Table 1 and Table S4).
To further analyze the signal transduction pathways of these DEGs, KEGG pathway analysis was used to identify the highly enriched pathways. The results showed that 114, 109, 112, and 118 KEGG pathways were identified in DEGs of Ss 0 d vs. Ss 1 d, Ss 0 d vs. Ss 3 d, Rs 0 d vs. Rs 1 d, and Rs 0 d vs. Rs 3 d, respectively (Figure 3 and Table S5). The highly enriched pathways in the groups Ss 0 d vs. Ss 1 d and Ss 0 d vs. Ss 3 d were protein processing in endoplasmic reticulum, glutathione metabolism, MAPK signaling pathway, and plant–pathogen interaction (Figure 3). Meanwhile, plant hormone signal transduction, carbon metabolism, photosynthesis, carbon fixation in photosynthetic organisms, photosynthesis–antenna proteins, and starch and sucrose metabolism pathways were mainly detected in the groups Rs 0 d vs. Rs 1 d and Rs 0 d vs. Rs 3 d (Figure 3). In addition, 18 DEGs were identified that were enriched in the plant hormone signal transduction pathway. Among these DEGs, the DEGs involved in auxin and abscisic acid (ABA) were highly detected, such as indole-3-acetic acid-amido synthetase, auxin-responsive protein, auxin response factor, auxin-induced protein, ABA receptor, protein phosphatase 2C, and ABA-insensitive 5 (Figure 4A and Table S3). Furthermore, transcription factors play critical roles in salt stress [27,28]. We found 16 differentially expressed transcription factors, including MYB, WRKY, bHLH, and NAC family genes (Figure 4B). Three MYB transcription factors were drastically induced by salt stress, but their expression levels in the Ss plants were still lower than the levels in the Rs plants (Figure 4B). The expression of the WRKY transcription factors in the Rs plants was lower than that in the Ss plants at 0 d (Figure 4B). Their expression level increased under salt stress in the Rs plants but decreased in the Ss plants (Figure 4B). Although salt stress enhanced the transcript level of bHLH and NAC transcription factor, their transcript level in the Ss plants was no more than that detected in the Rs plants (Figure 4B).

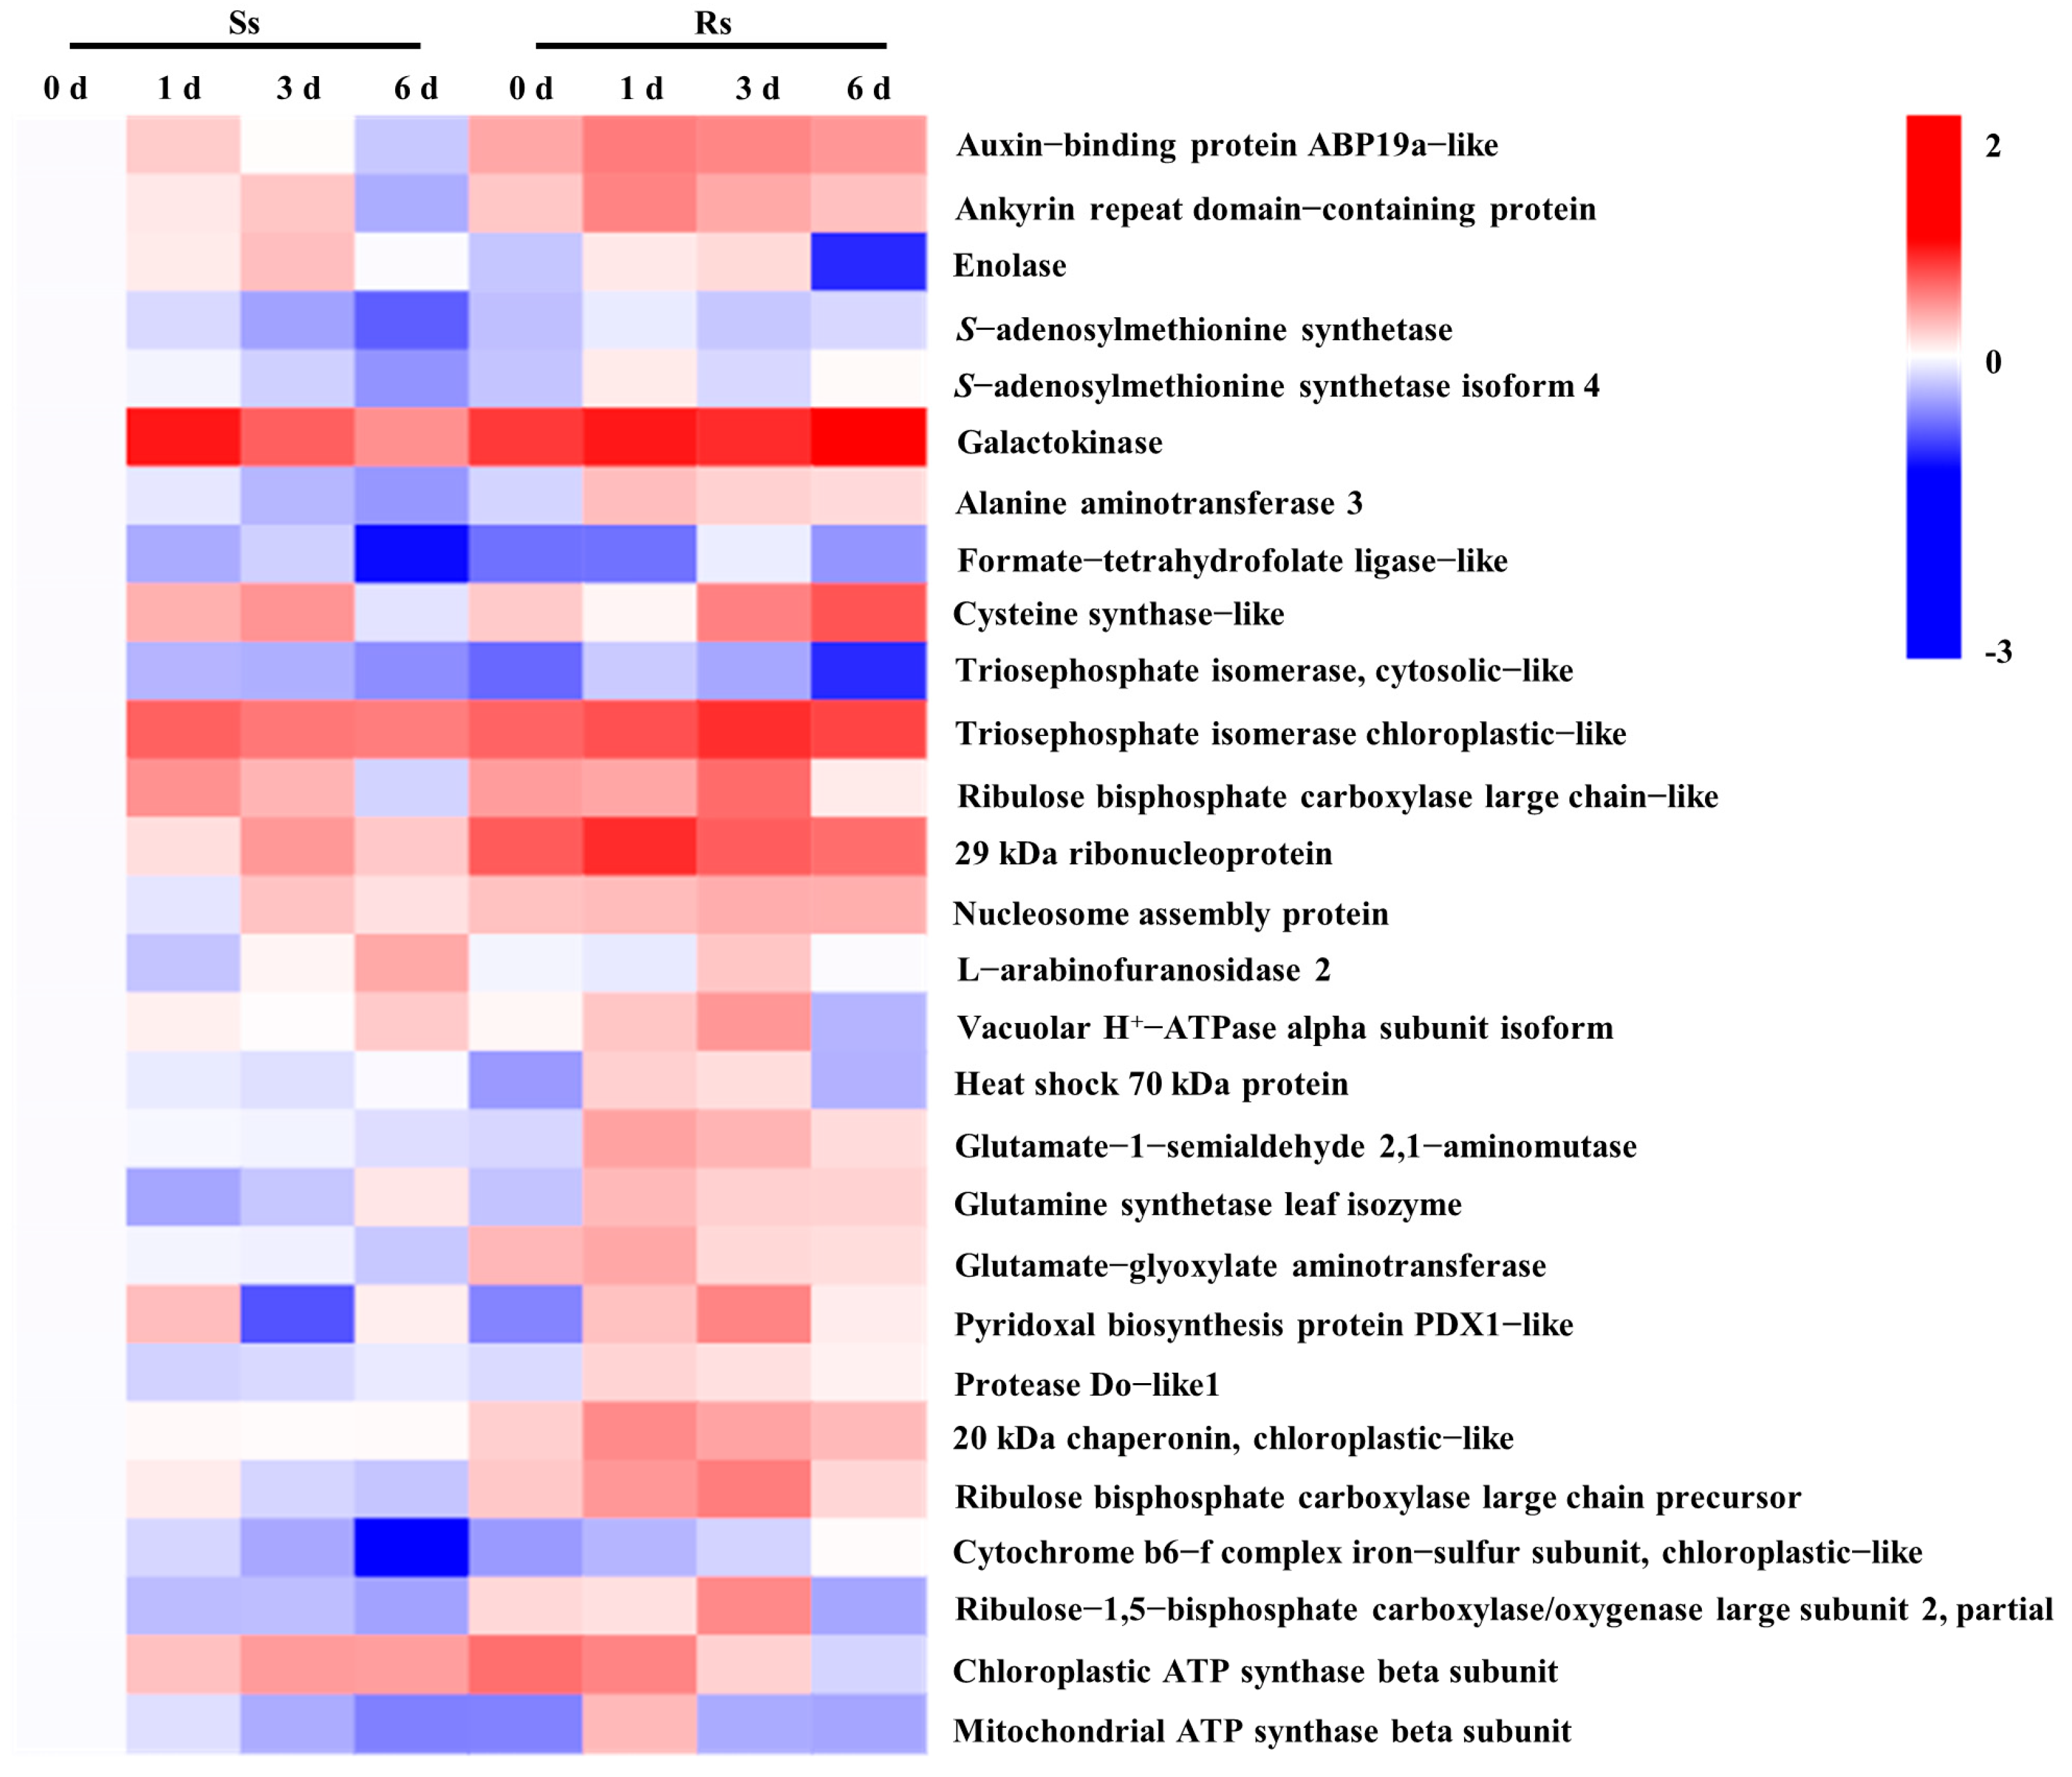
3.4. 2-DE Analysis of Differentially Expressed Proteins (DEPs)

2-DE electrophoresis was used to identify the DEPs in the leaves of the Ss and Rs plants at 0, 1, 3, and 6 d, and a total of eight 2-DE electrophoresis maps were obtained (Figure 5). More than 250 protein spots were detected, while 40 of them exhibited significant differences that were used for further identification, and only 28 protein spots with at least 1.5-fold changes were identified (Table 2 and Table S6).
The identified protein spots were mainly divided into five categories according to their participation in various biological processes, such as amino acid and protein synthesis, photosynthesis, mitochondrial metabolism and carbon metabolism, stress defense, and others (Figure S1). There were 10 proteins (35.7%) related to amino acid and protein synthesis, including S-adenosylmethionine synthetase (spot B3), S-adenosylmethionine synthetase isoform 4 (spot B4), alanine aminotransferase 3 (spot B6), cysteine synthase (spot B8), 29 kDa ribonucleoprotein (spot B12), glutamate-1-semialdehyde 2,1-aminomutase (spot C5), glutamine synthetase leaf isozyme (spot C6), glutamate–glyoxylate aminotransferase (spot C7), pyridoxal biosynthesis protein PDX1-like (spot C8), and protease Do-like1 (spot C9) (Table 2). Five proteins (17.9%) related to photosynthesis were identified, including triosephosphate isomerase (TPI) chloroplastic-like (spot B10), ribulose bisphosphate carboxylase large chain (spot B11), ribulose bisphosphate carboxylase large chain precursor (spot C11), cytochrome b6-f complex iron–sulfur subunit, chloroplastic-like (spot C12), and ribulose-1,5-bisphosphate carboxylase/oxygenase (Rubisco) large subunit 2 (spot C13) (Table 2). Seven proteins (25.0%) related to mitochondrial metabolism and carbon metabolism were identified (Table 2). Three proteins (10.7%) related to stress defense were detected, including formate–tetrahydrofolate ligase-like (spot B7), heat shock 70 kDa protein (spot C4), and 20 kDa chaperonin, chloroplastic-like (spot C10) (Table 2).
To comprehensively compare the 28 identified proteins, we performed a heatmap analysis using log2 transformation of the relative volume (vol. %) obtained from Imagemaster TM 2D Platinum software. Among the 28 proteins, the abundance of 14 proteins in the Ss plants was lower than that observed in the Rs plants (Figure 6). Furthermore, the abundance of 11 proteins in the Rs plants was more profound than in the Ss plants, including auxin-binding protein ABP19a-like (spot A2), ankyrin repeat domain-containing protein (spot B1), alanine aminotransferase 3 (spot B6), 29 kDa ribonucleoprotein (spot B12), glutamate-1-semialdehyde 2,1-aminomutase (spot C5), glutamine synthetase leaf isozyme (spot C6), glutamate–glyoxylate aminotransferase (spot C7), protease Do-like1 (spot C9), 20 kDa chaperonin, chloroplastic-like (spot C10), ribulose bisphosphate carboxylase large chain precursor (spot C11), and Rubisco large subunit 2 (spot C13) (Figure 6). The levels of stress defense protein heat shock 70 kDa protein (spot C4), and 20 kDa chaperonin, chloroplastic-like (spot C10) increased in the Rs plants, while their abundance slightly changed in the Ss plants (Figure 6). In addition, the level of cytochrome b6-f complex iron–sulfur subunit, chloroplastic-like (spot C12) in the Ss plants gradually declined with the elongation of salt stress, but increased in the Rs plants (Figure 6).

3.5. Combined Analysis of DEGs and DEPs

The transcriptome and proteome combined analyses revealed that four, two, five, and seven genes/proteins were commonly identified in the Ss 0 d vs. Ss 1 d, Ss 0 d vs. Ss 3 d, Rs 0 d vs. Rs 1 d, and Rs 0 d vs. Rs 3 d groups, respectively (Table S7). The co-detected genes/proteins in the Ss plants were involved in carbon metabolism and stress defense, while those in the Rs plants were involved in hormone metabolism, carbon metabolism, amino acid synthesis, and photosynthesis (Table S7).

4. Discussion

Salinity restricts the growth of plants by reducing the rate of leaf area expansion and roots growth [29,30]. It has been demonstrated that grafting effectively enhances the salt tolerance of vegetable crops [31]. A previous study revealed that when watermelon was grafted onto pumpkin rootstock, the growth rate of the biomass and the leaf area of the rootstock and the self-grafted seedlings declined under high salt stress, but these effects were more obvious in self-grafted plants [9]. Furthermore, watermelon grafted onto bottle gourd increases the nitrogen use efficiency, fruit yield, and fruit quality [32,33]. For instance, the fruit yield of per plant in bottle gourd RS-25 rootstock-grafted watermelon increases by 29.94% compared with non-grafted plants [34]. Salt stress significantly inhibited the growth of watermelon, and this trend was more pronounced in self-grafted plants than in plants grafted onto bottle gourd (Figure 1). We used transcriptome and proteome analyses to compare the DEGs and DEPs in self-grafted and bottle gourd rootstock-grafted plants at different time points. Combined transcriptome and proteome analyses showed that the DEGs/DEPs were highly involved in the plant hormone signal transduction, photosynthesis, and the amino acid synthesis pathway.

4.1. DEGs and DEPs Associated with Plant Hormones

Auxin is a growth promotion hormone that mediates the regulation of salt stress [35,36]. Salt stress inhibits the transcription of auxin biosynthesis genes and receptors, which reduces auxin accumulation and transport and further restricts plant growth under salt stress [37,38,39,40]. In this study, transcriptome analysis showed that the transcription of most of genes in the auxin signal pathway of the Rs plants was higher than what was observed in the Ss plants (Figure 4A). For instance, the transcription level of GH3 and ARFs increased in the leaves under salt stress for 1 d (Figure 4A and Table S3). Furthermore, proteome analysis revealed that the abundance of auxin-binding protein in the Rs plants was higher than that in the Ss plants (Figure 6). Similarly, the ectopic overexpression of maize (Zea mays L.) auxin receptor AFB2 in tobacco (Nicotiana tabacum) increases salt tolerance through regulation of the transcription of APX and CAT [41]. However, cotton (Gossypium hirsutum) GH3.5 silenced plants decrease chlorophyll content, and are hypersensitive to salt stress [42]. Salt stress induces the expression of most of auxin/indoleacetic acid (Aux/IAA) genes in apples [43]. Importantly, tobacco IAA26 overexpressing plants significantly enhance salt tolerance by regulating potassium uptake and antioxidant activity [44]. IAA20 positively regulates salt stress tolerance in rice (Oryza sativa) via an ABA pathway [45]. These results indicate that bottle gourd rootstock might regulate auxin homeostasis to promote grafted watermelon growth to adapt to salt stress. Furthermore, the expressions of an ABA receptor (PYR/PYL) and two of ABI5 were significantly elevated during salt stress, but their level in the Ss plants was no more than that in the Rs plants (Figure 4A). The ABA signal pathway is involved in salt stress response, and an exogenous application of a moderate concentration of ABA increases salt stress tolerance by increasing antioxidant enzyme activities, photosynthesis, and ion homeostasis [46,47,48]. Thus, the ABA signal pathway might mediate bottle gourd rootstock-induced salt tolerance.

4.2. DEGs and DEPs Associated with Photosynthesis

Photosynthesis is hypersensitive to salt stress, and the expression of genes related to photosynthesis is down-regulated under salt stress [49]. Here, we found that most of the genes and protein abundance in photosynthesis were reduced in both the Ss and Rs plants (Figure 6 and Table S3). Rubisco is generally considered as the key enzyme of C3 plant photosynthesis. Rubisco’s large subunit fragments in the 2-DE map is very common, which may be caused by protein modification or cleavage [50]. The results of the 2-DE experiment revealed that the expression of several Rubisco related proteins in the Rs plants was up-regulated (Figure 6). Other proteomic studies also reveal that salt tolerant varieties maintain higher protein levels related to photosynthesis to adapt to salt stress, which indirectly improves salt tolerance [51,52].
TPI mediates the interconversion of glyceraldehyde-3-phosphate and dihydroxyacetone phosphate in the process of glycolysis and the Calvin–Benson cycle [53,54]. There are two isoforms of the TPI gene in Arabidopsis [55,56]. The cytoplasmic TPI (cTPI) isoform is sensitive to redox agents, but the chloroplast TPI (pdTPI) isoform is resistant [55,56]. We found that cTPI was identified in DEGs and DEPs selected in Ss 0 d vs. Ss 1 d, and pdTPI was detected in Rs 0 d vs. Rs 3 d (Table S7). Importantly, the abundance of cTPI in the Ss plants was decreased, but pdTPI in the Rs plants increased (Figure 6), which might cope with oxidative damage caused by salt stress to maintain higher photosynthesis.
Under salt stress, the protein levels of chloroplast cytochrome b6-f complex ferrithionein in bottle gourd rootstock-grafted plants gradually increased, while protein levels in self-grafted plants continued to decrease (Figure 6). The main physiological function of this protein is to carry out electron transfer and the associated proton transmembrane transport, thus establishing the proton gradient between the two sides of the membrane to provide the impetus for synthesis [57]. At the same time, it is also involved in regulating the distribution of excitation energy between the two light systems and the distribution proportion of photosynthesis products to maintain the best efficiency of photosynthesis in the changing environment [57]. This showed that in the presence of salt stress, bottle gourd rootstock-grafted plants can still keep their photosynthesis running normally to promote watermelon growth and increase salt tolerance.

4.3. DEGs and DEPs Associated with Amino Acid Synthesis

Previous studies showed that the increase in amino acid and protein biosynthesis in the scion depends on the characteristics of rootstock [58]. This property makes the rootstock uptake more nitrogen from the matrix, then transports it to the scion, where it accumulates [58]. In the face of stress, plants can use this nitrogen to rapidly synthesize related proteins and actively respond to salt stress. Therefore, the accumulation of amino acids in plants is usually regarded as an indicator of salt resistance [59]. Indeed, the protein levels of amino acid synthesis in the Rs plants were higher than those in the Ss plants (Figure 6).
Glutamine synthetase leaf isozyme was identified in DEGs and DEPs selected in Rs 0 d vs. Rs 1 d. For glutamine synthetase in all seed plants, it is responsible for the reassimilation of NH4+ released in photorespiration and the assimilation of NH4+ that originated from nitrite reduction in the plastids [60]. NH4+ formation is a proton-generating process, which plays a vital role in regulating pH homeostasis [61]. Glutamine synthetase can eliminate the toxicity of NH4+ accumulated under stress by synthesizing NH4+ into amino acids, including glutamine and glutamate [62]. At the initial stage of salt stress, bottle gourd rootstock-grafted plants regulated glutamine synthetase leaf isozyme at the transcriptional and protein levels (Figure 6 and Table S3), indicating that bottle gourd rootstock-grafted plants could quickly respond to salt stress and ensure normal nitrogen metabolism in plants.
S-adenosylmethionine is a precursor to ethylene and polyamine biosynthesis [63]. Recent research results also confirmed that ethylene and polyamines are involved in plant stress resistance [64,65,66]. As a key enzyme for S-adenosylmethionine synthesis, S-adenosylmethionine synthetases are crucial for salt stress [67]. In this study, S-adenosylmethionine synthetase isoform 4 was regulated at the level of transcription and protein in the Rs plants during salt stress for 1 and 3 d (Figure 6 and Table S3). This indicates that bottle gourd rootstock-grafted watermelon plants respond more rapidly to salt stress than self-grafted plants and can further respond to long-term salt stress. Similarly, exogenous application of 1 mM spermidine on cucumber leaves increases the levels of S-adenosylmethionine synthetase isoform 2, resulting in an enhanced salt tolerance [68]. Therefore, the up-regulation of S-adenosylmethionine synthetases expression in plants enhances their salt tolerance.

5. Conclusions

In the present research, we found that watermelon grafted onto bottle gourd significantly promoted growth and increased salt tolerance. Transcriptomes and proteomes were used to analyze the DEGs/DEPs in the leaves of grafted watermelon seedlings under salt stress. Combined transcriptome and proteome analyses showed that these DEGs/DEPs were mainly involved in plant hormones signal transduction, photosynthesis, and the amino acid synthesis pathway.

Supplementary Materials

The following supporting information can be downloaded at: www.mdpi.com/article/10.3390/agronomy13030618/s1, Figure S1: Functional classification and distribution of 28 differentially expressed proteins; Table S1: Overview of raw and clean reads in grafting plants exposed to salt stress for 0, 1, and 3 d; Table S2: Mapping results of clean reads against the watermelon genomic sequence; Table S3: The differentially expressed genes under salt stress; Table S4: GO analysis of DEGs under salt stress; Table S5: KEGG pathway analysis of DEGs under salt stress; Table S6: Fold change of DEPs in bottle gourd rootstock- and self-grafted watermelon seedlings under salt stress; Table S7: Co-detected genes in DEGs and DEPs of each group.

Author Contributions

Conceived and designed the experiments: S.G. and Y.W. Performed the experiments: Y.W., J.Z. and W.W. Analyzed the data: J.S., S.S. and S.G. Contributed reagents/materials/analysis tools: Y.W., J.Z. and W.W. Wrote the paper: Y.W. and J.Z. All authors have read and agreed to the published version of the manuscript.

Funding

This research was funded by the National Natural Science Foundation of China (32272793) and the earmarked fund for CARS (CARS-23).

Data Availability Statement

The data presented in this study are available upon request from the corresponding author.

Conflicts of Interest

The authors declare no conflict of interest.

References

  1. Landi, S.; Hausman, J.F.; Guerriero, G.; Esposito, S. Poaceae vs. abiotic stress: Focus on drought and salt stress, recent insights and perspectives. Front. Plant Sci. 2017, 8, 1214. [Google Scholar] [CrossRef] [PubMed] [Green Version]
  2. Ali, S.; Rizwan, M.; Qayyum, M.F.; Ok, Y.S.; Ibrahim, M.; Riaz, M.; Arif, M.S.; Hafeez, F.; Al-Wabel, M.I.; Shahzad, A.N. Biochar soil amendment on alleviation of drought and salt stress in plants: A critical review. Environ. Sci. Pollut. Res. 2017, 24, 12700–12712. [Google Scholar] [CrossRef] [PubMed]
  3. Zhang, H.; Li, X.; Zhang, S.; Yin, Z.; Zhu, W.; Li, J.; Meng, L.; Zhong, H.; Xu, N.; Wu, Y.; et al. Rootstock alleviates salt stress in grafted mulberry seedlings: Physiological and PSII function responses. Front. Plant Sci. 2018, 9, 1806. [Google Scholar] [CrossRef] [PubMed]
  4. Koleska, I.; Hasanagic, D.; Todorovic, V.; Murtic, S.; Maksimovic, I. Grafting influence on the weight and quality of tomato fruit under salt stress. Ann. Appl. Biol. 2018, 172, 187–196. [Google Scholar] [CrossRef]
  5. Guo, Z.; Qin, Y.; Lv, J.; Wang, X.; Dong, H.; Dong, X.; Zhang, T.; Du, N.; Piao, F. Luffa rootstock enhances salt tolerance and improves yield and quality of grafted cucumber plants by reducing sodium transport to the shoot. Environ. Pollut. 2023, 316, 120521. [Google Scholar] [CrossRef] [PubMed]
  6. Peng, Y.; Cao, H.; Peng, Z.; Zhou, L.; Sohail, H.; Cui, L.; Yang, L.; Huang, Y.; Bie, Z. Transcriptomic and functional characterization reveals CsHAK5;3 as a key player in K plus homeostasis in grafted cucumbers under saline conditions. Plant Sci. 2023, 326, 111509. [Google Scholar] [CrossRef] [PubMed]
  7. Penella, C.; Nebauer, S.G.; Lopez-Galarza, S.; Quinones, A.; Bautista, A.S.; Calatayud, A. Grafting pepper onto tolerant rootstocks: An environmental-friendly technique overcome water and salt stress. Sci. Hortic. 2017, 226, 33–41. [Google Scholar] [CrossRef]
  8. Ulas, A.; Aydin, A.; Ulas, F.; Yetisir, H.; Miano, T.F. Cucurbita rootstocks improve salt tolerance of melon scions by inducing physiological, biochemical and nutritional responses. Horticulturae 2020, 6, 66. [Google Scholar] [CrossRef]
  9. Yan, Y.; Wang, S.; Wei, M.; Gong, B.; Shi, Q. Effect of different rootstocks on the salt stress tolerance in watermelon seedlings. Hortic. Plant J. 2018, 4, 239–249. [Google Scholar] [CrossRef]
  10. Kacjan Marsic, N.; Stolfa, P.; Vodnik, D.; Kosmelj, K.; Mikulic-Petkovsek, M.; Kump, B.; Vidrih, R.; Kokalj, D.; Piskernik, S.; Ferjancic, B.; et al. Physiological and biochemical responses of ungrafted and grafted bell pepper plants (Capsicum annuum L. var. grossum (L.) Sendtn.) grown under moderate salt stress. Plants 2021, 10, 314. [Google Scholar] [CrossRef] [PubMed]
  11. Lu, X.; Liu, W.; Wang, T.; Zhang, J.; Li, X.; Zhang, W. Systemic long-distance signaling and communication between rootstock and scion in grafted vegetables. Front. Plant Sci. 2020, 11, 460. [Google Scholar] [CrossRef]
  12. Buesa, I.; Perez-Perez, J.G.; Visconti, F.; Strah, R.; Intrigliolo, D.S.; Bonet, L.; Gruden, K.; Pompe-Novak, M.; de Paz, J.M. Physiological and transcriptional responses to saline irrigation of young ’Tempranillo’ vines grafted onto different rootstocks. Front. Plant Sci. 2022, 13, 866053. [Google Scholar] [CrossRef]
  13. Zhu, H.; Zhao, S.; Lu, X.; He, N.; Gao, L.; Dou, J.; Bie, Z.; Liu, W. Genome duplication improves the resistance of watermelon root to salt stress. Plant Physiol. Biochem. 2018, 133, 11–21. [Google Scholar] [CrossRef] [PubMed]
  14. Li, H.; Chang, J.; Chen, H.; Wang, Z.; Gu, X.; Wei, C.; Zhang, Y.; Ma, J.; Yang, J.; Zhang, X. Exogenous melatonin confers salt stress tolerance to watermelon by improving photosynthesis and redox homeostasis. Front. Plant Sci. 2017, 8, 295. [Google Scholar] [CrossRef] [Green Version]
  15. Wu, S.; Shamimuzzaman, M.; Sun, H.; Salse, J.; Sui, X.L.; Wilder, A.; Wu, Z.J.; Levi, A.; Xu, Y.; Ling, K.S.; et al. The bottle gourd genome provides insights into Cucurbitaceae evolution and facilitates mapping of a Papaya ring-spot virus resistance locus. Plant J. 2017, 92, 963–975. [Google Scholar] [CrossRef] [PubMed] [Green Version]
  16. Mkhize, P.; Mashilo, J.; Shimelis, H. Progress on genetic improvement and analysis of bottle gourd [Lagenaria siceraria (Molina) Standl.] for agronomic traits, nutrient compositions, and stress tolerance: A review. Front. Sustain. Food Syst. 2021, 5, 683635. [Google Scholar] [CrossRef]
  17. Davis, A.R.; Perkins-Veazie, P.; Sakata, Y.; Lopez-Galarza, S.; Maroto, J.V.; Lee, S.G.; Huh, Y.C.; Sun, Z.; Miguel, A.; King, S.R.; et al. Cucurbit grafting. Crit. Rev. Plant Sci. 2008, 27, 50–74. [Google Scholar] [CrossRef]
  18. Yang, Y.J.; Lu, X.M.; Yan, B.; Li, B.; Sun, J.; Guo, S.; Tezuka, T. Bottle gourd rootstock-grafting affects nitrogen metabolism in NaCl-stressed watermelon leaves and enhances short-term salt tolerance. J. Plant Physiol. 2013, 170, 653–661. [Google Scholar] [CrossRef]
  19. Wang, Y.; Zhang, W.; Liu, W.; Ahammed, G.J.; Wen, W.; Guo, S.; Shu, S.; Sun, J. Auxin is involved in arbuscular mycorrhizal fungi-promoted tomato growth and NADP-malic enzymes expression in continuous cropping substrates. BMC Plant Biol. 2021, 21, 48. [Google Scholar] [CrossRef]
  20. Trapnell, C.; Williams, B.A.; Pertea, G.; Mortazavi, A.; Kwan, G.; van Baren, M.J.; Salzberg, S.L.; Wold, B.J.; Pachter, L. Transcript assembly and quantification by RNA-Seq reveals unannotated transcripts and isoform switching during cell differentiation. Nat. Biotech. 2010, 28, 511–515. [Google Scholar] [CrossRef] [Green Version]
  21. Love, M.I.; Huber, W.; Anders, S. Moderated estimation of fold change and dispersion for RNA-seq data with DESeq2. Genome Biol. 2014, 15, 550. [Google Scholar] [CrossRef] [Green Version]
  22. Young, M.D.; Wakefield, M.J.; Smyth, G.K.; Oshlack, A. Gene ontology analysis for RNA-seq: Accounting for selection bias. Genome Biol. 2010, 11, R14. [Google Scholar] [CrossRef] [Green Version]
  23. Xie, C.; Mao, X.; Huang, J.; Ding, Y.; Wu, J.; Dong, S.; Kong, L.; Gao, G.; Li, C.Y.; Wei, L. KOBAS 2.0: A web server for annotation and identification of enriched pathways and diseases. Nucleic Acids Res. 2011, 39, W316–W322. [Google Scholar] [CrossRef] [PubMed] [Green Version]
  24. Hurkman, W.J.; Tanaka, C.K. Solubilization of plant membrane-proteins for analysis by two-dimensional gel-electrophoresis. Plant Physiol. 1986, 81, 802–806. [Google Scholar] [CrossRef] [Green Version]
  25. Bradford, M.M. A rapid and sensitive method for the quantitation of microgram quantities of protein utilizing the principle of protein-dye binding. Anal. Biochem. 1976, 72, 248–254. [Google Scholar] [CrossRef] [PubMed]
  26. He, L.; Lu, X.; Tian, J.; Yang, Y.; Li, B.; Li, J.; Guo, S. Proteomic analysis of the effects of exogenous calcium on hypoxic-responsive proteins in cucumber roots. Proteome Sci. 2012, 10, 42. [Google Scholar] [CrossRef] [PubMed] [Green Version]
  27. Li, W.; Pang, S.; Lu, Z.; Jin, B. Function and mechanism of WRKY transcription factors in abiotic stress responses of plants. Plants 2020, 9, 1515. [Google Scholar] [CrossRef] [PubMed]
  28. Yoon, Y.; Seo, D.H.; Shin, H.; Kim, H.J.; Kim, C.M.; Jang, G. The role of stress-responsive transcription factors in modulating abiotic stress tolerance in plants. Agronomy 2020, 10, 788. [Google Scholar] [CrossRef]
  29. dos Santos, T.B.; Ribas, A.F.; de Souza, S.G.H.; Budzinski, I.G.F.; Domingues, D.S. Physiological responses to drought, salinity, and heat stress in plants: A review. Stresses 2022, 2, 113–135. [Google Scholar] [CrossRef]
  30. Ondrasek, G.; Rathod, S.; Manohara, K.K.; Gireesh, C.; Anantha, M.S.; Sakhare, A.S.; Parmar, B.; Yadav, B.K.; Bandumula, N.; Raihan, F.; et al. Salt stress in plants and mitigation approaches. Plants 2022, 11, 717. [Google Scholar] [CrossRef] [PubMed]
  31. Behera, T.K.; Krishna, R.; Ansari, W.A.; Aamir, M.; Kumar, P.; Kashyap, S.P.; Pandey, S.; Kole, C. Approaches involved in the vegetable crops salt stress tolerance improvement: Present status and way ahead. Front. Plant Sci. 2022, 12, 787292. [Google Scholar] [CrossRef] [PubMed]
  32. Mashilo, J.; Shimelis, H.; Ngwepe, R.M. Genetic resources of bottle gourd (Lagenaria siceraria (Molina) Standl.] and citron watermelon (Citrullus lanatus var. citroides (L.H. Bailey) Mansf. ex Greb.)- implications for genetic improvement, product development and commercialization: A review. S. Afr. J. Bot. 2022, 145, 28–47. [Google Scholar] [CrossRef]
  33. Chen, X.L.; Guo, P.J.; Wang, Z.Y.; Liang, J.Y.; Li, G.H.; He, W.W.; Zhen, A. Grafting improves growth and nitrogen-use efficiency by enhancing NO3 uptake, photosynthesis, and gene expression of nitrate transporters and nitrogen metabolizing enzymes in watermelon under reduced nitrogen application. Plant Soil 2022, 480, 305–327. [Google Scholar] [CrossRef]
  34. Pal, S.; Rao, E.S.; Hebbar, S.S.; Sriram, S.; Pitchaimuthu, M.; Rao, V.K. Assessment of Fusarium wilt resistant Citrullus sp. rootstocks for yield and quality traits of grafted watermelon. Sci. Hortic. 2020, 272, 109497. [Google Scholar] [CrossRef]
  35. Ribba, T.; Garrido-Vargas, F.; Antonio O’Brien, J. Auxin-mediated responses under salt stress: From developmental regulation to biotechnological applications. J. Exp. Bot. 2020, 71, 3843–3853. [Google Scholar] [CrossRef]
  36. Verma, S.; Negi, N.P.; Pareek, S.; Mudgal, G.; Kumar, D. Auxin response factors in plant adaptation to drought and salinity stress. Physiol. Plant. 2022, 174, e13714. [Google Scholar] [CrossRef] [PubMed]
  37. Iglesias, M.J.; Terrile, M.C.; Windels, D.; Lombardo, M.C.; Bartoli, C.G.; Vazquez, F.; Estelle, M.; Casalongue, C.A. MiR393 regulation of auxin signaling and redox-related components during acclimation to salinity in Arabidopsis. PLoS ONE 2014, 9, e107678. [Google Scholar] [CrossRef] [PubMed] [Green Version]
  38. Liu, W.; Li, R.J.; Han, T.T.; Cai, W.; Fu, Z.W.; Lu, Y.T. Salt stress reduces root meristem size by nitric oxide-mediated modulation of auxin accumulation and signaling in Arabidopsis. Plant Physiol. 2015, 168, 343–356. [Google Scholar] [CrossRef] [PubMed] [Green Version]
  39. Jiang, K.; Moe-Lange, J.; Hennet, L.; Feldman, L.J. Salt stress affects the redox status of Arabidopsis root meristems. Front. Plant Sci. 2016, 7, 81. [Google Scholar] [CrossRef] [Green Version]
  40. Wang, P.; Shen, L.; Guo, J.; Jing, W.; Qu, Y.; Li, W.; Bi, R.; Xuan, W.; Zhang, Q.; Zhang, W. Phosphatidic acid directly regulates PINOID-dependent phosphorylation and activation of the PIN-FORMED2 auxin efflux transporter in response to salt stress. Plant Cell 2019, 31, 250–271. [Google Scholar] [CrossRef] [Green Version]
  41. Yang, C.W.; Deng, W.; Tang, N.; Wang, X.M.; Yan, F.; Lin, D.B.; Li, Z.G. Overexpression of ZmAFB2, the maize homologue of AFB2 gene, enhances salt tolerance in transgenic tobacco. Plant Cell Tiss. Organ. Cult. 2013, 112, 171–179. [Google Scholar] [CrossRef]
  42. Kirungu, J.N.; Magwanga, R.O.; Lu, P.; Cai, X.Y.; Zhou, Z.L.; Wang, X.X.; Peng, R.H.; Wang, K.B.; Liu, F. Functional characterization of Gh_A08G1120 (GH3.5) gene reveal their significant role in enhancing drought and salt stress tolerance in cotton. BMC Genet. 2019, 20, 62. [Google Scholar] [CrossRef] [PubMed] [Green Version]
  43. Li, Y.; Wang, L.; Yu, B.; Guo, J.; Zhao, Y.; Zhu, Y. Expression analysis of AUX/IAA family genes in apple under salt stress. Biochem. Genet. 2022, 60, 1205–1221. [Google Scholar] [CrossRef]
  44. Fu, Y.; Wang, C.; Lian, W.; Zhu, X.; Yu, Q.; Jia, Y.; Jia, H.; Xie, L. NtIAA26 positively regulates salt tolerance in tobacco by modulating potassium uptake and antioxidant activity. Plant Growth Regul. 2022, 97, 559–569. [Google Scholar] [CrossRef]
  45. Zhang, A.Y.; Yang, X.; Lu, J.; Song, F.Y.; Sun, J.H.; Wang, C.; Lian, J.; Zhao, L.; Zhao, B.C. OsIAA20, an Aux/IAA protein, mediates abiotic stress tolerance in rice through an ABA pathway. Plant Sci. 2021, 308, 110903. [Google Scholar] [CrossRef] [PubMed]
  46. Amjad, M.; Akhtar, J.; Anwar-ul-Haq, M.; Yang, A.; Akhtar, S.S.; Jacobsen, S.E. Integrating role of ethylene and ABA in tomato plants adaptation to salt stress. Sci. Hortic. 2014, 172, 109–116. [Google Scholar] [CrossRef]
  47. Wang, G.L.; Ren, X.Q.; Liu, J.X.; Yang, F.; Wang, Y.P.; Xiong, A.S. Transcript profiling reveals an important role of cell wall remodeling and hormone signaling under salt stress in garlic. Plant Physiol. Biochem. 2019, 135, 87–98. [Google Scholar] [CrossRef]
  48. Feng, X.Y.; Chen, S.Y.; Yang, S.M.; An, X.; Liu, Y.Y.; Lu, H.L.; Yang, C.Q.; Qin, Y.G. Effects of exogenous abscisic acid on salt tolerance of watermelon seedlings under NaCl stress. Appl. Ecol. Environ. Res. 2022, 20, 4515–4524. [Google Scholar] [CrossRef]
  49. Zhong, M.; Wang, Y.; Zhang, Y.; Shu, S.; Sun, J.; Guo, S. Overexpression of transglutaminase from cucumber in tobacco increases salt tolerance through regulation of photosynthesis. Int. J. Mol. Sci. 2019, 20, 894. [Google Scholar] [CrossRef] [Green Version]
  50. Taylor, N.L.; Heazlewood, J.L.; Day, D.A.; Millar, A.H. Differential impact of environmental stresses on the pea mitochondrial proteome. Mol. Cell. Proteom. 2005, 4, 1122–1133. [Google Scholar] [CrossRef] [Green Version]
  51. Rasoulnia, A.; Bihamta, M.R.; Peyghambari, S.A.; Alizadeh, H.; Rahnama, A. Proteomic response of barley leaves to salinity. Mol. Biol. Rep. 2011, 38, 5055–5063. [Google Scholar] [CrossRef] [PubMed]
  52. de Abreu, C.E.B.; Araújo, G.D.; Monteiro-Moreira, A.C.D.; Costa, J.H.; Leite, H.D.; Moreno, F.B.M.B.; Prisco, J.T.; Gomes-Filho, E. Proteomic analysis of salt stress and recovery in leaves of Vigna unguiculata cultivars differing in salt tolerance. Plant Cell Rep. 2014, 33, 1289–1306. [Google Scholar] [CrossRef] [PubMed]
  53. Zaffagninia, M.; Michelet, L.; Sciabolini, C.; Di Giacinto, N.; Morisse, S.; Marchand, C.H.; Trost, P.; Fermani, S.; Lemaire, S.D. High-resolution crystal structure and redox properties of chloroplastic triosephosphate isomerase from Chlamydomonas reinhardtii. Mol. Plant 2014, 7, 101–120. [Google Scholar] [CrossRef] [PubMed] [Green Version]
  54. Castro-Torres, E.; Jimenez-Sandoval, P.; Fernandez-de Gortari, E.; Lopez-Castillo, M.; Baruch-Torres, N.; Lopez-Hidalgo, M.; Peralta-Castro, A.; Diaz-Quezada, C.; Sotelo-Mundo, R.R.; Benitez-Cardoza, C.G.; et al. Structural basis for the limited response to oxidative and thiol-conjugating agents by triosephosphate isomerase from the photosynthetic bacteria synechocystis. Front. Mol. Biosci. 2018, 5, 103. [Google Scholar] [CrossRef] [PubMed] [Green Version]
  55. Lopez-Castillo, L.M.; Jimenez-Sandoval, P.; Baruch-Torres, N.; Trasvina-Arenas, C.H.; Diaz-Quezada, C.; Lara-Gonzalez, S.; Winkler, R.; Brieba, L.G. Structural basis for redox regulation of cytoplasmic and chloroplastic triosephosphate isomerases from Arabidopsis thaliana. Front. Plant Sci. 2016, 7, 1817. [Google Scholar] [CrossRef] [PubMed] [Green Version]
  56. Castro-Torres, E.; Jimenez-Sandoval, P.; Romero-Romero, S.; Fuentes-Pascacio, A.; Lopez-Castillo, L.M.; Diaz-Quezada, C.; Fernandez-Velasco, D.A.; Torres-Larios, A.; Brieba, L.G. Structural basis for the modulation of plant cytosolic triosephosphate isomerase activity by mimicry of redox-based modifications. Plant J. 2019, 99, 950–964. [Google Scholar] [CrossRef] [PubMed]
  57. Yamori, W.; Takahashi, S.; Makino, A.; Price, G.D.; Badger, M.R.; von Caemmerer, S. The roles of ATP synthase and the cytochrome b6/f complexes in limiting chloroplast electron transport and determining photosynthetic capacity. Plant Physiol. 2011, 155, 956–962. [Google Scholar] [CrossRef] [Green Version]
  58. Martinez-Ballesta, M.C.; Alcaraz-Lopez, C.; Muries, B.; Mota-Cadenas, C.; Carvajal, M. Physiological aspects of rootstock-scion interactions. Sci. Hortic. 2010, 127, 112–118. [Google Scholar] [CrossRef]
  59. Ashraf, M.; Harris, P.J.C. Potential biochemical indicators of salinity tolerance in plants. Plant Sci. 2004, 166, 3–16. [Google Scholar] [CrossRef]
  60. Valderrama-Martin, J.M.; Ortigosa, F.; Avila, C.; Canovas, F.M.; Hirel, B.; Canton, F.R.; Canas, R.A. A revised view on the evolution of glutamine synthetase isoenzymes in plants. Plant J. 2022, 110, 946–960. [Google Scholar] [CrossRef] [PubMed]
  61. Marino, D.; Canas, R.A.; Betti, M. Is plastidic glutamine synthetase essential for C-3 plants? A tale of photorespiratory mutants, ammonium tolerance and conifers. New Phytol. 2022, 234, 1559–1565. [Google Scholar] [CrossRef] [PubMed]
  62. Lopez-Zavala, A.A.; Carrasco-Miranda, J.S.; Ramirez-Aguirre, C.D.; Lopez-Hidalgo, M.; Benitez-Cardoza, C.G.; Ochoa-Leyva, A.; Cardona-Felix, C.S.; Diaz-Quezada, C.; Rudino-Pinera, E.; Sotelo-Mundo, R.R.; et al. Structural insights from a novel invertebrate triosephosphate isomerase from Litopenaeus vannamei. BBA-Proteins Proteom. 2016, 1864, 1696–1706. [Google Scholar] [CrossRef] [PubMed] [Green Version]
  63. Roje, S. S-Adenosyl-L-methionine: Beyond the universal methyl group donor. Phytochemistry 2006, 67, 1686–1698. [Google Scholar] [CrossRef] [PubMed]
  64. Muller, M. Foes or friends: ABA and ethylene interaction under abiotic stress. Plants 2021, 10, 448. [Google Scholar] [CrossRef]
  65. Wang, W.; Paschalidis, K.; Feng, J.C.; Song, J.; Liu, J.H. Polyamine catabolism in plants: A universal process with diverse functions. Front. Plant Sci. 2019, 10, 561. [Google Scholar] [CrossRef] [PubMed] [Green Version]
  66. Chen, D.; Shao, Q.; Yin, L.; Younis, A.; Zheng, B. Polyamine function in plants: Metabolism, regulation on development, and roles in abiotic stress responses. Front. Plant Sci. 2019, 9, 1945. [Google Scholar] [CrossRef]
  67. He, M.W.; Wang, Y.; Wu, J.Q.; Shu, S.; Sun, J.; Guo, S.R. Isolation and characterization of S-Adenosylmethionine synthase gene from cucumber and responsive to abiotic stress. Plant Physiol. Biochem. 2019, 141, 431–445. [Google Scholar] [CrossRef] [PubMed]
  68. Li, B.; He, L.; Guo, S.; Li, J.; Yang, Y.J.; Yan, B.; Sun, J.; Li, J. Proteomics reveal cucumber Spd-responses under normal condition and salt stress. Plant Physiol. Biochem. 2013, 67, 7–14. [Google Scholar] [CrossRef]
Figure 1. Bottle gourd rootstock enhanced the salt stress tolerance of the grafted watermelon seedlings. (A) Plant phenotype. Bar: 5 cm. (B) Fresh weight. (C) Dry weight. Watermelons grafted onto watermelon (Ss) and bottle gourd (Rs) were treated with 100 mM NaCl, and the phenotype, fresh weight, and dry weight were measured at the indicated time points. The data represent the mean ± SD (n = 3).
Agronomy 13 00618 g001
Figure 2. Overview and Venn diagram analysis of differentially expressed genes (DEGs) in self-grafted (Ss) and bottle gourd rootstock-grafted (Rs) watermelon seedlings exposed to 100 mM NaCl for 0, 1, and 3 d. (A) The total number of DEGs in the Ss and Rs plants. (B) All of the DEGs were measured in the transcriptome data.
Agronomy 13 00618 g002
Figure 3. KEGG pathway analysis of DEGs in self-grafted (Ss) and bottle gourd rootstock-grafted (Rs) watermelon seedlings exposed to 100 mM NaCl for 0, 1, and 3 d. (A) KEGG pathway analysis of the Ss 0 d vs. Ss 1 d group. (B) KEGG pathway analysis of the Ss 0 d vs. Ss 3 d group. (C) KEGG pathway analysis of the Rs 0 d vs. Rs 1 d group. (D) KEGG pathway analysis of the Rs 0 d vs. Rs 3 d group.
Agronomy 13 00618 g003
Figure 4. Heatmap analysis of DEGs involved in plant hormone (A) and stress response transcription factors (B). Data in the heatmap originated from transcriptomic results after log2 transformation.
Agronomy 13 00618 g004
Figure 5. Representative two-dimensional electrophoresis (2-DE) gel images of proteins isolated from watermelon leaves under salt stress. (A) Proteins in self-grafted (Ss) watermelon plants at 0 d. (B) Proteins in bottle gourd rootstock-grafted (Rs) watermelon plants at 0 d. (C) Proteins in the Ss plants at 1 d. (D) Proteins in the Rs plants at 1 d. (E) Proteins in the Ss plants at 3 d. (F) Proteins in the Rs plants at 3 d. (G) Proteins in the Ss plants at 6 d. (H) Proteins in the Rs plants at 6 d. Arrows indicate the successfully identified 28 differentially expressed proteins. pI: isoelectric point.
Agronomy 13 00618 g005
Figure 6. Heatmap analysis of differentially expressed proteins (DEPs) in self-grafted (Ss) and bottle gourd rootstock-grafted (Rs) watermelon seedlings exposed to 100 mM NaCl for 0, 1, 3, and 6 d. Data in the heatmap were standardized in vol. % of protein spots after log2 transformation.
Agronomy 13 00618 g006
Table 1. GO pathway analysis of DEGs in self-grafted (Ss) and bottle gourd rootstock-grafted (Rs) watermelon seedlings exposed to 100 mM NaCl for 0, 1, and 3 d.
GO ClassificationGO TermTotal Number of DEGsNumber of DEGs in Ss 0 d vs. Ss 1 dNumber of DEGs in Ss 0 d vs. Ss 3 dNumber of DEGs in Rs 0 d vs. Rs 1 dNumber of DEGs in Rs 0 d vs. Rs 3 d
biological processmetabolic process6103597556588935
biological processcellular process5004516459482747
biological processsingle-organism process3033312304338506
biological processlocalization1251149121124187
biological processbiological regulation1103134117123177
biological processresponse to stimulus95411496103166
biological processsignaling31843322549
biological processcellular component organization or biogenesis60936464189
biological processmulticellular organismal process26226211740
biological processdevelopmental process29823212452
biological processreproduction14698722
biological processreproductive process14088720
biological processdetoxification111816923
biological processmulti-organism process697878
biological processgrowth4054615
biological processcell killing42122
biological processimmune system process180210
biological processbiological adhesion30001
biological processrhythmic process50101
cellular componentmembrane4238469421404699
cellular componentmembrane part3751423372366622
cellular componentcell3531303257311432
cellular componentcell part3531303257311432
cellular componentorganelle2425214191213306
cellular componentorganelle part77455686873
cellular componentmacromolecular complex72532275130
cellular componentcell junction6595814
cellular componentextracellular region82671020
cellular componentmembrane-enclosed lumen1056355
cellular componentextracellular region part121201
cellular componentvirion260101
cellular componentvirion part260101
cellular componentsupramolecular complex30011
molecular functioncatalytic activity5639489554552975
molecular functionbinding5829487444521840
molecular functiontransporter activity49655485376
molecular functionnucleic acid binding transcription factor activity33849454762
molecular functionstructural molecule activity2761162119
molecular functionantioxidant activity106816923
molecular functionmolecular function regulator141871621
molecular functionelectron carrier activity201210
molecular functionmolecular transducer activity251222
Table 2. Differentially expressed protein spots between bottle gourd rootstock and self-grafted watermelon.
Spot ID 1Accession No. 2Protein Name 3Group 4Mr (kDa)/
pI 5
Peptide CountScore 6Protein Score C.I.% 7
A2Cla97C09G162960Auxin-binding protein ABP19a-likeHormone metabolism21.50/6.383196100
B1Cla97C02G036490Ankyrin repeat domain-containing proteinProtein interaction38.87/4.5211150100
B2Cla97C04G076580EnolaseCarbon metabolism48.15/5.7112126100
B3Cla97C10G194620S-adenosylmethionine synthetaseAmino acid synthesis43.70/5.5918482100
B4Cla97C09G167000S-adenosylmethionine synthetase isoform 4Amino acid synthesis43.65/5.3516515100
B5Cla97C05G088280GalactokinaseCarbon metabolism55.10/66185100
B6Cla97C05G107900Alanine aminotransferase 3Amino acid synthesis53.79/5.5289799.98
B7Cla97C03G064150Formate-tetrahydrofolate ligase-likeStress defence68.58/7.219123100
B8Cla97C02G042210Cysteine synthase-likeAmino acid synthesis34.57/5.9210267100
B9Cla97C04G071440Triosephosphate isomerase, cytosolic-likeCarbon metabolism27.50/5.6187596.70
B10Cla97C02G037100Triosephosphate isomerase chloroplastic-likePhotosynthesis33.00/7.0112209100
B11Cla97C07G134850Ribulose bisphosphate carboxylase large chain-likePhotosynthesis16.81/4.785267100
B12Cla97C10G20344029 kDa ribonucleoproteinProtein synthesis30.48/5.845112100
C1Cla97C11G208080Nucleosome assembly proteinChromosome assembly43.03/4.317240100
C2Cla97C09G177130L-arabinofuranosidase 2Carbon metabolism85.45/6.9913168100
C3Cla97C09G163740Vacuolar H+-ATPase alpha subunit isoformEnergy metabolism68.81/5.213198100
C4Cla97C10G192810Heat shock 70 kDa proteinStress defence73.25/5.6915140100
C5Cla97C09G178080Glutamate-1-semialdehyde 2,1-aminomutaseAmino acid synthesis49.84/5.6711161100
C6Cla97C05G086890Glutamine synthetase leaf isozymeAmino acid synthesis48.03/7.6216179100
C7Cla97C05G107870Glutamate-glyoxylate aminotransferaseAmino acid synthesis53.83/6.511117100
C8Cla97C10G205390Pyridoxal biosynthesis protein PDX1-likeAmino acid synthesis33.23/5.85117998.69
C9Cla97C09G180430Protease Do-like1Protein degradation46.92/7.1318460100
C10Cla97C03G06507020 kDa chaperonin, chloroplastic-likeStress defence26.88/7.858165100
C11Cla97C03G060940Ribulose bisphosphate carboxylase large chain precursorPhotosynthesis56.55/9.0415345100
C12Cla97C02G027850Cytochrome b6-f complex iron-sulfur subunit, chloroplastic-likePhotosynthesis24.21/8.533123100
C13Cla97C03G051890Ribulose-1,5-bisphosphate carboxylase/oxygenase large subunit 2, partialPhotosynthesis19.70/6.185112100
C14Cla97C01G006310Chloroplastic ATP synthase beta subunitEnergy metabolism51.92/5.071110099.99
C15Cla97C05G104100Mitochondrial ATP synthase beta subunitEnergy metabolism59.89/5.90107395
1 Spot number in Figure 5. 2 Accession number in watermelon genome. 3 Description of the matched protein. 4 Functional classification. 5 Mr: theoretical molecular mass; pI: isoelectric point. 6 The score obtained from MascotTM (Matrix Science, London, UK) for each match. 7 C. I. % indicates protein score in the confidence interval.
Disclaimer/Publisher’s Note: The statements, opinions and data contained in all publications are solely those of the individual author(s) and contributor(s) and not of MDPI and/or the editor(s). MDPI and/or the editor(s) disclaim responsibility for any injury to people or property resulting from any ideas, methods, instructions or products referred to in the content.

