Article

Spatially Explicit Soil Acidification under Optimized Fertilizer Use in Sub-Saharan Africa

1
College of Natural Resources and Environment, Northwest A&F University, Xianyang 712100, China
2
Department of Agriculture, Faculty of Agriculture, Environmental Management and Renewable Energy, University of Technology and Arts of Byumba, Byumba P.O. Box 25, Rwanda
3
Key Laboratory of Plant Nutrition and the Agri-Environment in Northwest China, Ministry of Agriculture, Xianyang 712100, China
4
Soil Science Department, Faculty of Agriculture, Zagazig University, Zagazig 44511, Egypt
5
College of Tropical Crops, Hainan University, Haikou 570228, China
6
Liebig Centre for Agroecology and Climate Impact Research, Justus Liebig University, 35390 Giessen, Germany
*
Author to whom correspondence should be addressed.
Agronomy 2023, 13(3), 632; https://doi.org/10.3390/agronomy13030632
Submission received: 27 January 2023 / Revised: 14 February 2023 / Accepted: 20 February 2023 / Published: 22 February 2023
(This article belongs to the Special Issue The Development and Application of Machine Learning in Agriculture)

Abstract

:
Acidic soils (pH < 5.5) cover roughly 30% of Sub-Saharan Africa. Low nitrogen fertilizer application (15 kg N ha−1 yr−1) has no effect on soil acidification in Sub-Saharan Africa (SSA). However, the effect of optimized fertilizer use on soil acidification (H+) in SSA crops remains unknown. This study intended to predict the spatial variation of H+ caused by optimized fertilizer use using data from 5782 field trials in SSA cropland. We used ensemble machine learning to predict spatial variation (H+) after measuring the inputs and outputs of major elements and their effect on H+ production. The results revealed that H+ ranged spatially from 0 to 16 keq H+ ha−1 yr−1. The most protons (H+) were produced by cassava, banana, and Irish potatoes systems with 12.0, 9.8, and 8.9 keq H+ ha−1 yr−1, respectively. The results of the 10-fold cross validation for the soil acidification model were a coefficient of determination (R2) of 0.6, a root mean square error (RMSE) of 2.1, and a mean absolute error (MAE) of 1.4. Net basic cation loss drives soil acidification under optimized fertilizer application and climate covariates had a higher relative importance than other covariates. Digital soil mapping can produce soil acidification maps for sustainable land use and management plans.

1. Introduction

More than a third of Sub-Saharan Africa has acid soils (pH < 5.5) [1] and soil acidity is caused by the presence of hydrogen (H+) ions, which can be generated either naturally by soil formation processes or by anthropogenic activities [2,3]. In regions where precipitation exceeds evapotranspiration, soil acidification is a persistent process that can be sped up or slowed down by the actions of plants, animals, and humans [4,5]. Soil acidification is primarily caused by the release of protons (H+) during the transformations and cycling of carbon (C), nitrogen (N), and sulfur (S) in the soil–plant–animal system [6]. The most proton (H+) and hydroxyl ion (OH) generating processes occur during the cycling of C, N, and S (Table S1). Soil acidification in agricultural systems is typically attributed to an imbalance in the carbon and nitrogen cycles, which leads to (1) net H+ excretion by plant roots due to excess cation uptake over anions; (2) removal of alkalinity in farm products (crop harvest and animal product); (3) accumulation of organic anions in soil organic matter; (4) mineralization of organic matter, nitrification of ammonium, and subsequent nitrate leaching; and (5) input of ammonium-based fertilizers [7].
Crop yields are limited in Sub-Saharan countries where food production is critical [8]. Low crop yield is mostly attributable to two main factors: First, the toxicity of aluminium (Al3+), manganese (Mn2+), and hydrogen (H+) activity, which prevents crops from obtaining essential nutrients such as calcium (Ca2+), magnesium (Mg2+), molybdenum (Mo), and phosphorus (P) [9,10]. Secondly, cropland in SSA is characterized by highly weathered soil, a lack of sufficient soil nutrient stocks, high soil nutrient depletion, and low fertilizer use (less than 15 kg N ha−1 yr−1) [11]. The main concern for increasing the crop yield in SSA is managing acidic soils, increasing inorganic fertilizer use, and maximizing nutrient use efficiency. For example Wortmann et al. [12] found that optimized N fertilizer for maize ranged from 90 to 50 kg N ha−1 yr−1 and the maximum maize yield potential ranged from 0.91 to 2.28 Mg ha−1 yr−1 in 16 countries in Sub-Saharan Africa.
It has been shown that long term ammonium-based fertilizers exacerbate soil acidity [13,14]. Red–yellow Podzolic soils experienced a decrease in pH of 1.4 units from 360 kg N ha−1 yr−1, while a 5 year maize and cowpea rotation led to a reduction of 0.84 pH units in Nigeria [15,16]. It has been also shown that soil pH was lowered by 1.7 pH units when 80–120 kg N ha−1 yr−1 was applied to three tropical soils (Luvisols, Acrisols, and Ferralsols) [17]. However, no studies have been conducted to investigate the impact of optimized fertilizer use on soil acidification and its spatial distribution. As a result, there is an urgent need to understand how optimized fertilizer use and crop yield affect soil acidification in Sub-Saharan Africa.
Soils are considered spatially variable natural bodies due to the interaction of intrinsic (geologic and soil formation processes) and extrinsic (soil management practices, fertilization, and crop rotation) factors [3,18]. Soil properties maps (physical and chemical properties of soil) have been produced using machine learning and legacy data at different scales from watershed level, country level, continental level, and global level [19,20,21,22,23,24]. Despite extensive work on mapping soil properties, only few efforts have been made in Sub-Saharan Africa to map some soil functions and soil degradation processes using digital soil mapping tools [20,25,26]. Thus, more work is needed to translate agricultural research findings into practical decision-making tools using digital soil mapping tools. Soil acidification maps have the potential to be a key decision tool in spatial planning for intensive agriculture for sustainable land use and management.
This is the first study to examine the proton (H+) production under optimized fertilizer use and their spatial distribution in SSA cropland. We hypothesized that net basic cation loss has a strong relationship with soil acidification rather than nitrogen transformations in SSA under optimized fertilizer use. Therefore, our study aimed: (1) to investigate H+ production under optimizer N fertilizers and calculate net basic cation loss and net anion accumulation in SSA, (2) to find the relationship of soil acidification with ammonium-based fertilizers, crop yield, N transformation, basic cation removal, bicarbonate leaching, net basic cation loss, net anion accumulations, crop evapotranspiration, and mean annual precipitation, (3) to predict the spatial distribution of soil pH and soil acidification in SSA cropland. The results obtained may contribute to the adoption of sustainable fertilizer use management in SSA cropland and it will highlight the regions which will be at high soil acidification in SSA cropland.

2. Materials and Methods

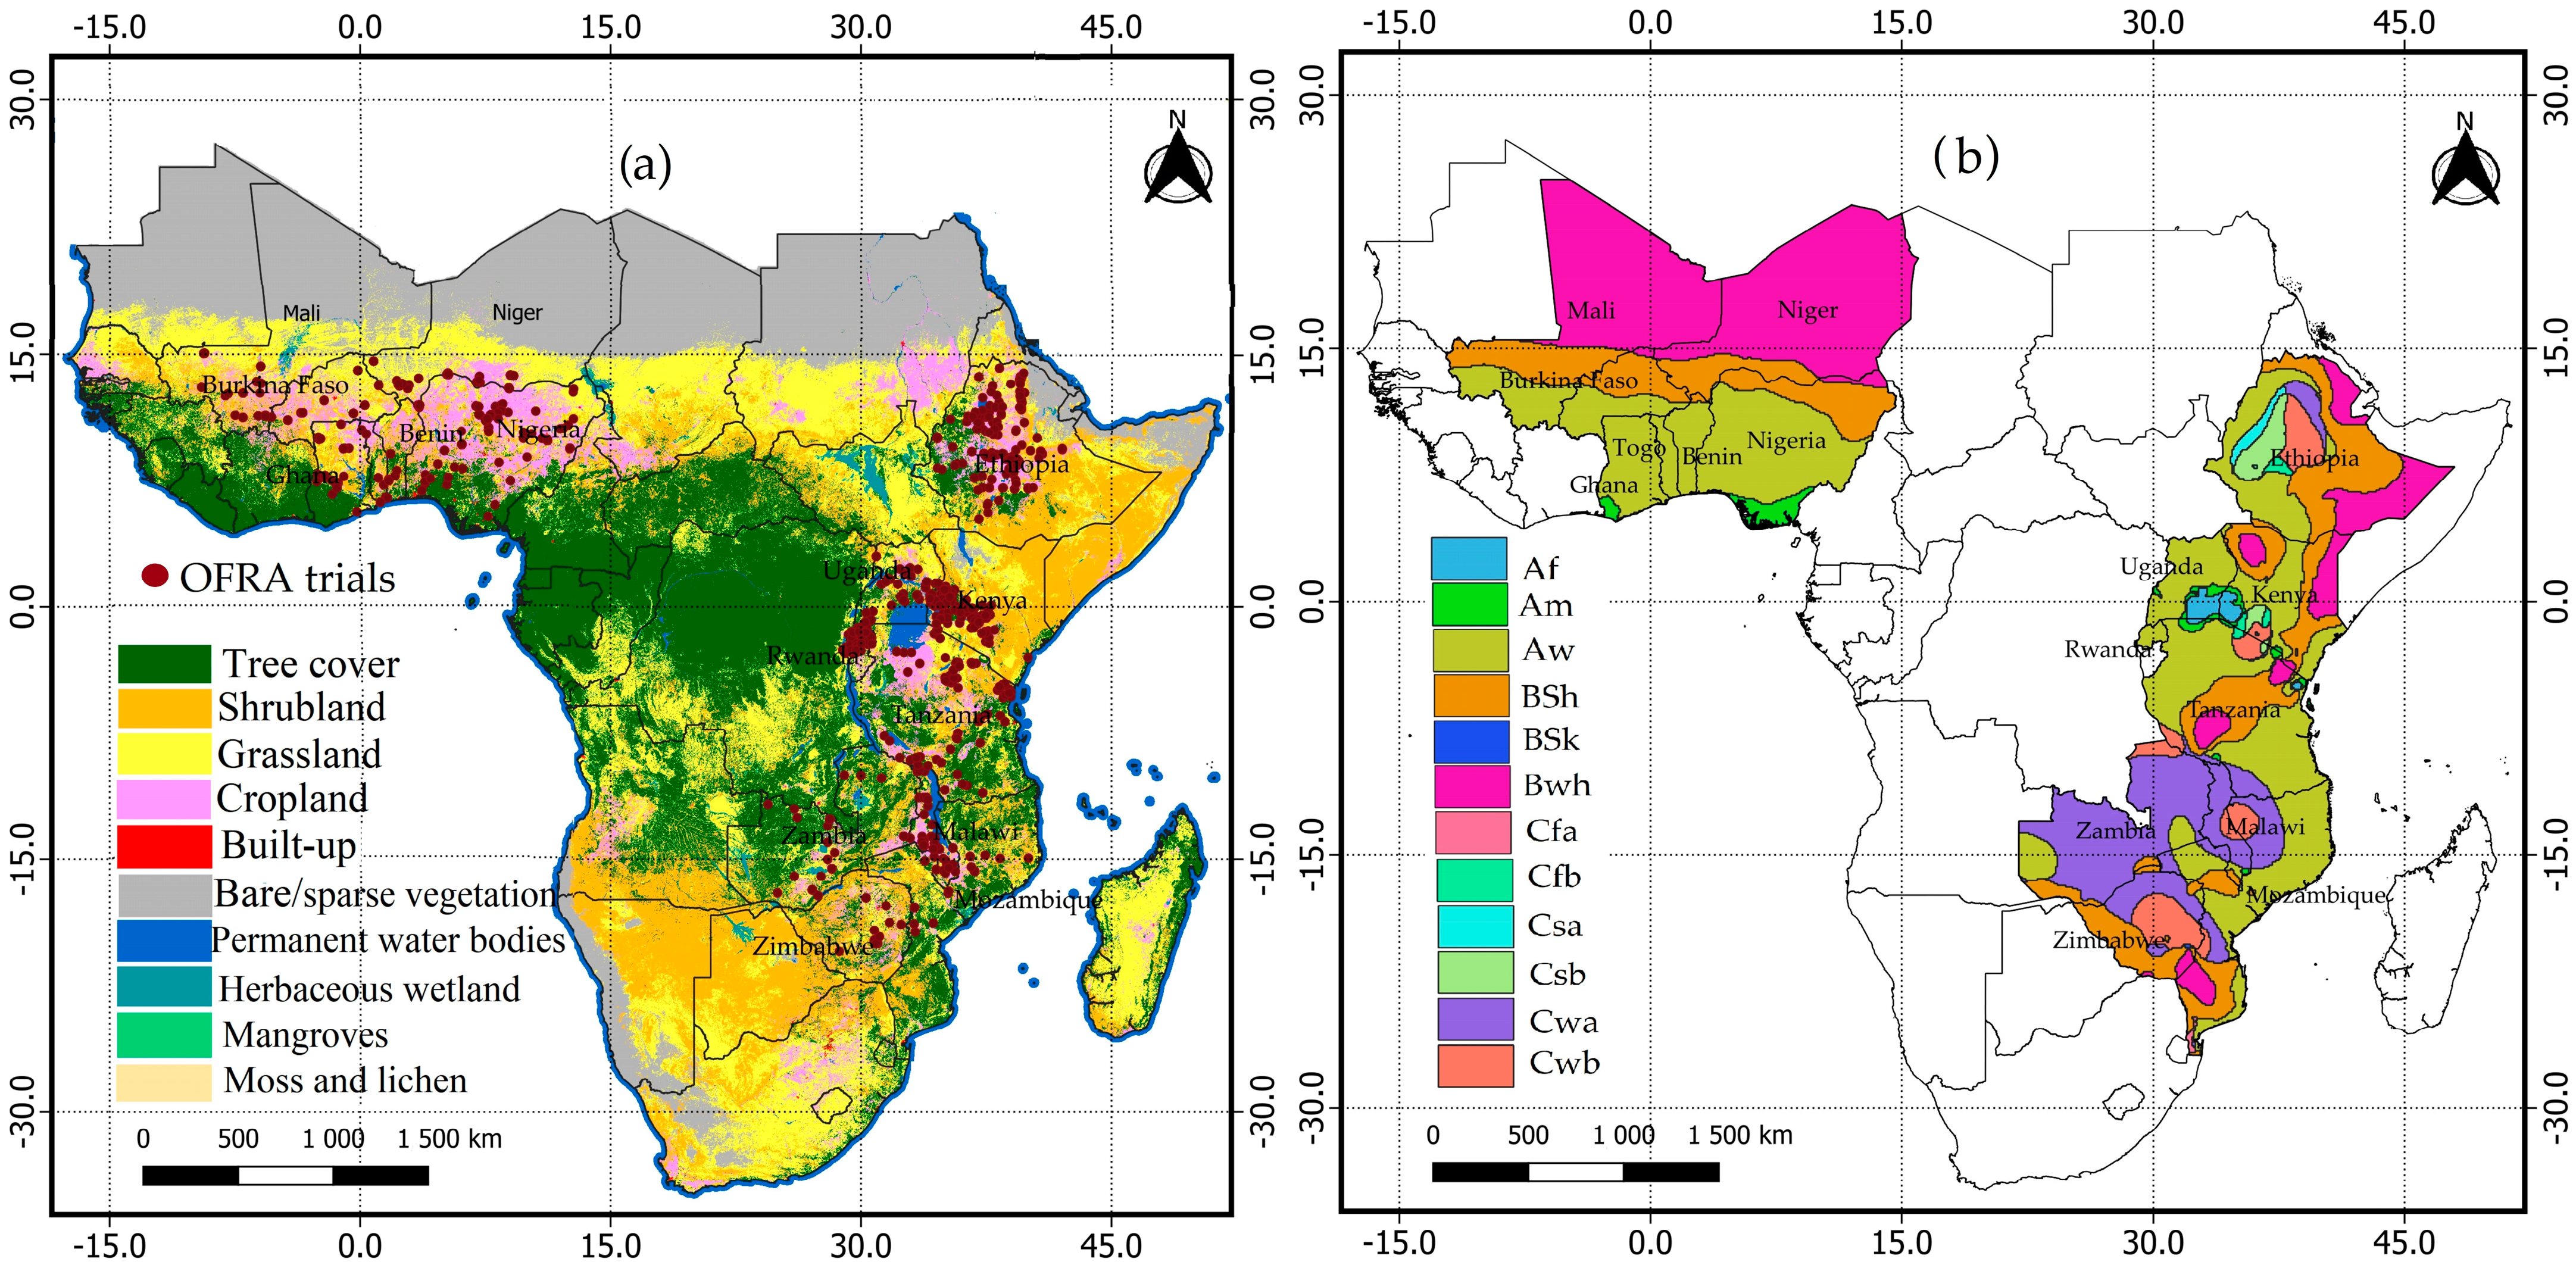
2.1. Site Description

Sub-Saharan Africa includes 50 countries plus the southern part of Mauritania. However, due to the lack of due to lack of field trials data in all Sub-Saharan Africa cropland, we restricted our analysis in 16 SSA countries including Mali, Burkina Faso, Togo, Niger, Ghana, Benin, Nigeria, Ethiopia, Kenya, Uganda, Rwanda, Tanzania, Malawi, Mozambique, Zambia, and Zimbabwe (Figure 1a). The study area has a wide variety of soil types and the top 6 soil types in the the cropland areas of these 16 countries are Arenosols (18%), Leptisols (12.5%), Cambisols (12%), Lixisols (9%), Luvisols (7%), and Ferralsols (5%) [27]. There are three major types of climate in our case study including climate A, B, and C. A represents a tropical climate that covers 11.8% of the land (MAP > 1500 mm), B represents an arid climate that covers 57.2% of the land (MAP < 250 mm yr−1), and C represents a temperate climate that covers 31% of the land (MAP ranges between 500 and 1500 mm yr−1) [28] (Figure 1b). We predicted soil pH and soil acidification in SSA cropland using field data from the optimizing fertilizer recommendations in Africa (OFRA) [12] (Figure 1). Soil data and crop yield data from 5783 field trials under (OFRA) are presented in Table 1 and Table 2, respectively. We did not predict soil acidification in whole SSA cropland because we wanted to avoid uncertainties which may have been raised due to predicting undistributed training data [29]. Cropland of our case study was extracted from the global land use and land cover dataset from the European Space Agency (ESA) World Cover 10 m 2020 product [30]. This study focused on the top cultivated horizon (Ap horizon) because more than 95% of N fertilisation, soil nitrification, and N uptake by roots occur in the upper 40 cm [31].

2.2. Calculation of Element Fluxes and Soil Acidification Rates

2.2.1. Assessment of the Nutrient Budget in OFRA Field Trials

Total deposition of N, S, and C compounds (WD, kg N ha−1 yr−1) was calculated by multiplying the annual volume weighted mean concentrations (VWM; μeq L−1) by the mean annual precipitation (MAP) and the molar mass of each species (Mi, g mol−1) and dividing by the ionic charge (ci) [32]. VWM data were gathered from the INDAAF network (International Network to Study Deposition and Atmospheric Composition in Africa) (https://indaaf.obs-mip.fr/). The MAP of every field trial was collected from the OFRA dataset. Optimized mineral fertilizer rate, manure application, anions, and basic cation inputs were collected from the OFRA dataset (Table 2).
The removal of major nutrients (N, P, K, Ca, Mg, and S) and Na and Cl by harvesting was assessed by multiplying the harvested amounts of grain (the crop yield) and straw (the crop residues) with the element concentrations in grain and straw (Table S2) [33]. Different assumptions were used to calculate nutrient discharge losses from the soil system. We assumed that the N pool change was negligible (no net mineralization, immobilization, or adsorption of NH4+ or NO3) and that ammonium was fully nitrified to nitrate, implying that all N losses to water were nitrate [34]. Soil CO2 pressure and pH have a significant impact on HCO3 discharge [35]. The losses of basic cations were estimated using a charge balance in leachate equal to the molar equivalent of all anions. The accumulation of anions and basic cations was set to equal their respective surpluses [36]. Annual average input and output fluxes were given in kilogram and converted to in kilo equivalent per hectare, the first being used as the common standard for nutrient balances and the latter giving a more direct impression and easier understanding of the acidity calculations [37] (Table S3).

2.2.2. Calculation of Soil Acidification (H+) and Change in Total Soil Acid Neutralizing Capacity (ANC)

The acidity budget was calculated by adding all H+ production processes (H+ deposition, N transformation, and plant uptake) and H+ neutralisation processes [38,39].
The total H+ production (H+ soil) was calculated as:
H + s o i l = H + t r a n s + H + c a t u p + H + H C O 3
where H+ soil is total H+ produced, H+ trans is sum of H+ from deposition, fertilizer inputs, manure, fixation, and leaching, H+ Catup is H+ from basic cation uptake minus H+ from anion uptake, and H+HCO3 is bicarbonate leached minus bicarbonate deposited from atmosphere). The change in total soil acid neutralizing capacity (ANC) was calculated using the following equation:
Δ A N C = Δ A N C C a t + Δ A N C A n
Δ A N C C a t = C a t o u t C a t i n = C a t u p + C a t l e C a t i n
Δ A N C A n = A n i n A n o u t = A n i n A n o u t A n l e
where Δ A N C is the change in total soil acid neutralizing capacity, Δ A N C C a t is net basic cation loss (actual soil acidity), Δ A N C A n is anion accumulation (potential soil acidity), AN is anions, Cat is cations, in is inputs, out is, outputs, le is leaching.

2.3. Mapping Soil Acidification in Selected Countries in SSA

2.3.1. Covariates Collection and Selection

In this study, 36 environmental covariates were chosen because they all have a relationship with soil pH and represent 5 soil-forming factors (climate, topography, organism, parent material, and time) plus soil properties related to soil acidity [40] (Table S4).
Recursive feature elimination analysis (RFE) was used to select the best performing subset of static covariates. The RFE procedure is similar to backward regression, in that it starts with the maximum number of covariates and iteratively removes the weakest explanatory variable until the specified number of covariates is reached [41].

2.3.2. Model Evaluation, Prediction, and Uncertainties Assessment

The performance of the final model was evaluated using 10-fold cross-validation. Thus, the dataset was randomly split into ten equally sized folds, and nine of these were used to calibrate the ensemble model and predict the soil pH and second soil acidity for the remaining fold. This procedure was carried out 10 times, each time setting aside a different fold. We plotted the predictions against the independent observations and computed the mean absolute errors (MAE), root mean square errors (RMSE), and coefficient of determination (R2).
We used the “caretEnsemble” package to predict soil pH and second soil acidity in cropland of selected countries in Sub-Saharan Africa. The “caretEnsemble” uses multiple base models to build a single best prediction model [42]. In this study we used Random Forest (“rf”), and eXtreme Gradient Boosting (“xgbDART”) to build the best model which could predict soil acidification with low uncertainties. Predictions at 1 km spatial resolution were made in cropland of 16 countries which had OFRA field trials and other countries were excluded in our analysis to minimize uncertainties (Figure 1).
We used the 0.5-quantile (i.e., the median) as a prediction of the soil pH and second soil acidity and the 0.05- and 0.95-quantiles as the lower and upper limits of a 90% prediction interval, respectively. Then uncertainty was assessed by standard deviation maps [43,44,45]. The modelling was performed using the R programming language (https://www.r-project.org/). The map visualization was performed by ArcMap 10.7.

2.4. Linear Mixed-Effect Analysis

The relationships of soil acidification (H+) and its driving factors were tested by the linear mixed-effect (LME) model and this model was built by the maximum likelihood estimation (SPSS ver. 23). Soil acidification factors were all factors used in proton (H+) calculations (Equations (1)–(4)) including optimized fertilizer rate (Urea and DAP), crop yield, H+ from N transformation, H+ from bicarbonate leaching, H+ from basic cation uptake by crops, H+ from net basic cation loss, H+ from net accumulation of anions, and MAP. The main driver was the factor with a strong relationship (higher coefficient of determination = R2) and significant at 95% confidence level.

3. Results

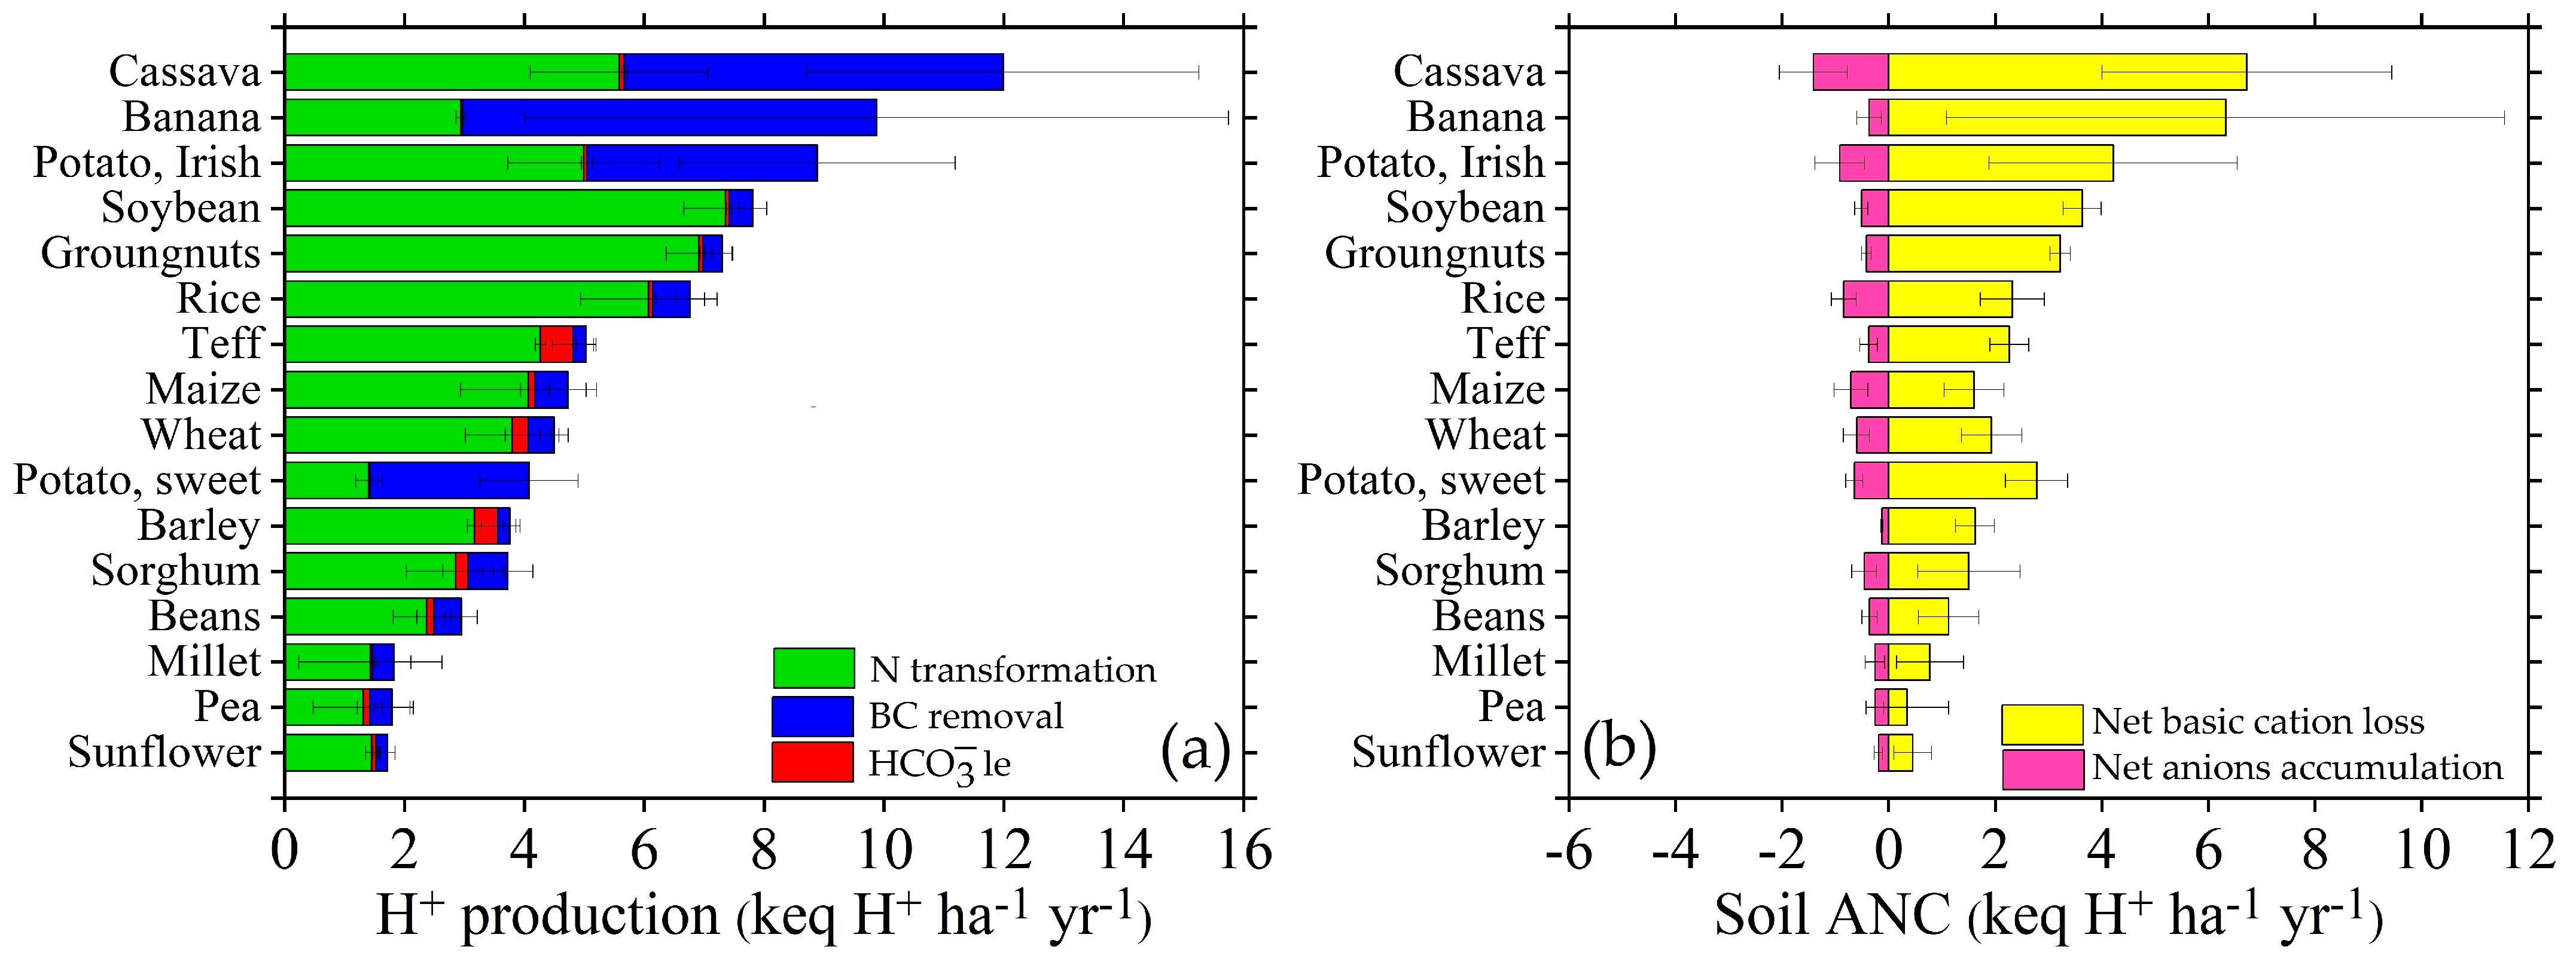
3.1. Descriptive Statistics of Nutrient Fluxes, Soil Acidification, and Total Soil Acid Neutralizing Capacity (ANC) in Different Cropping Systems

The mean H+ production from different nutrients fluxes of all cropping systems was N transformation (3.70 keq H+, ha−1 yr−1), basic cation inputs (0.81 keq H+ha−1yr−1), anion inputs (0.07 keq H+ha−1yr−1), bicarbonate leaching (0.14 keq ha−1yr−1), basic cation uptake (1.93 keq H+ha−1yr−1), anion uptake (0.41 keq H+ ha−1yr−1), basic cation leaching (1.83 keq ha−1yr−1), and nitrate leaching (0.11 keq ha−1 yr−1), ANCAn (−0.34 keq H+ ha−1yr−1), ANCCat (3.76 keq H+ ha−1yr−1). The mean soil acidification of all cropping systems was 5.41 keq H+ ha−1yr−1 while the mean total of soil acid neutralizing capacity (ANC) was 2.5 keq H+ ha−1yr−1 (Table 3). The soybean cropping system has the highest H+ from N transformation (7.35 keq H+ ha−1 yr−1) while the lowest H+ production from N transformation was recorded in the pea cropping system (1.31 keq H+ ha−1yr−1 ). The highest basic cation inputs were recorded in the Irish potato cropping system (1.53 keq H+ ha−1yr−1), high anion inputs were recorded in Irish potatoes (0.12 keq H+ ha−1 yr−1), high bicarbonate leaching was recorded in the teff cropping system (0.54 keq H+ ha−1 yr−1), high basic cation uptake was recorded in cassava (7.63 keq H+ ha−1 yr−1), high anion uptake was recorded in cassava (1.31 keq H+ ha−1yr−1), high basic cation leaching was recorded in the soybean cropping system (3.86 keq H+ha−1yr−1) and high nitrate leaching was recorded in soybean (0.26 keq H+ ha−1 yr−1) (Figure 2).

3.2. Spatial Patterns of Soil pH and Soil Acidification

3.2.1. Selected Environmental Covariates and Their Relative Importance

Recursive feature elimination indicated that the optimal number of environmental covariates to be included in soil pH and soil acidification was around 22 and 30, respectively (Figure 3a). Including more covariates did not lead to a further decrease in the RMSE. Top four covariates for soil pH modelling were basic cations (BS), crop yield (yield), slope, and temperature seasonality (BIO 4). Crop yield (yield), soil bulk density (BD), soil organic carbon (SOC), and clay content were the top four important covariates which drove the spatial pattern of soil acidification (H+) in SSA (Figure 3b,c). The influence of climate variables in the spatial variation of soil pH was 43% followed by soil properties (32.8%), topographic features (12.5%), human activities (8.5%), and parent material (2.9%). The spatial pattern of soil acidification was influenced by climate variables (40.5%), followed by soil properties (35.5%), terrain features (11%), human activities (9%), and parent material (4%) (Figure 3b,c).

3.2.2. Cross Validation Results

A density scatter plot of predicted against observed soil pH (Figure 4a) shows that predictions were not biased (RMSE was small, 0.11 pH unit) and the ensemble model built was explained by only 96% of the 0–20 cm soil pH variation (Figure 4a). The predictions and observations were concentrated along the 1:1 line and very close to the predictive line. A density scatter plot of predicted against observed soil acidification (H+) (Figure 4b) shows that errors were in some cases high (2.1 keq H+ha−1yr−1). Figure 4b also shows that the model under predicted but this is a common characteristic of statistical prediction methods. The ensemble model built explained 61% of proton (H+) production variation (Figure 4a). The predictions and observations were concentrated along the 1:1 line below 10 keq H+ ha−1 yr−1 above predicted line was away to 1:1 line (Figure 4b).

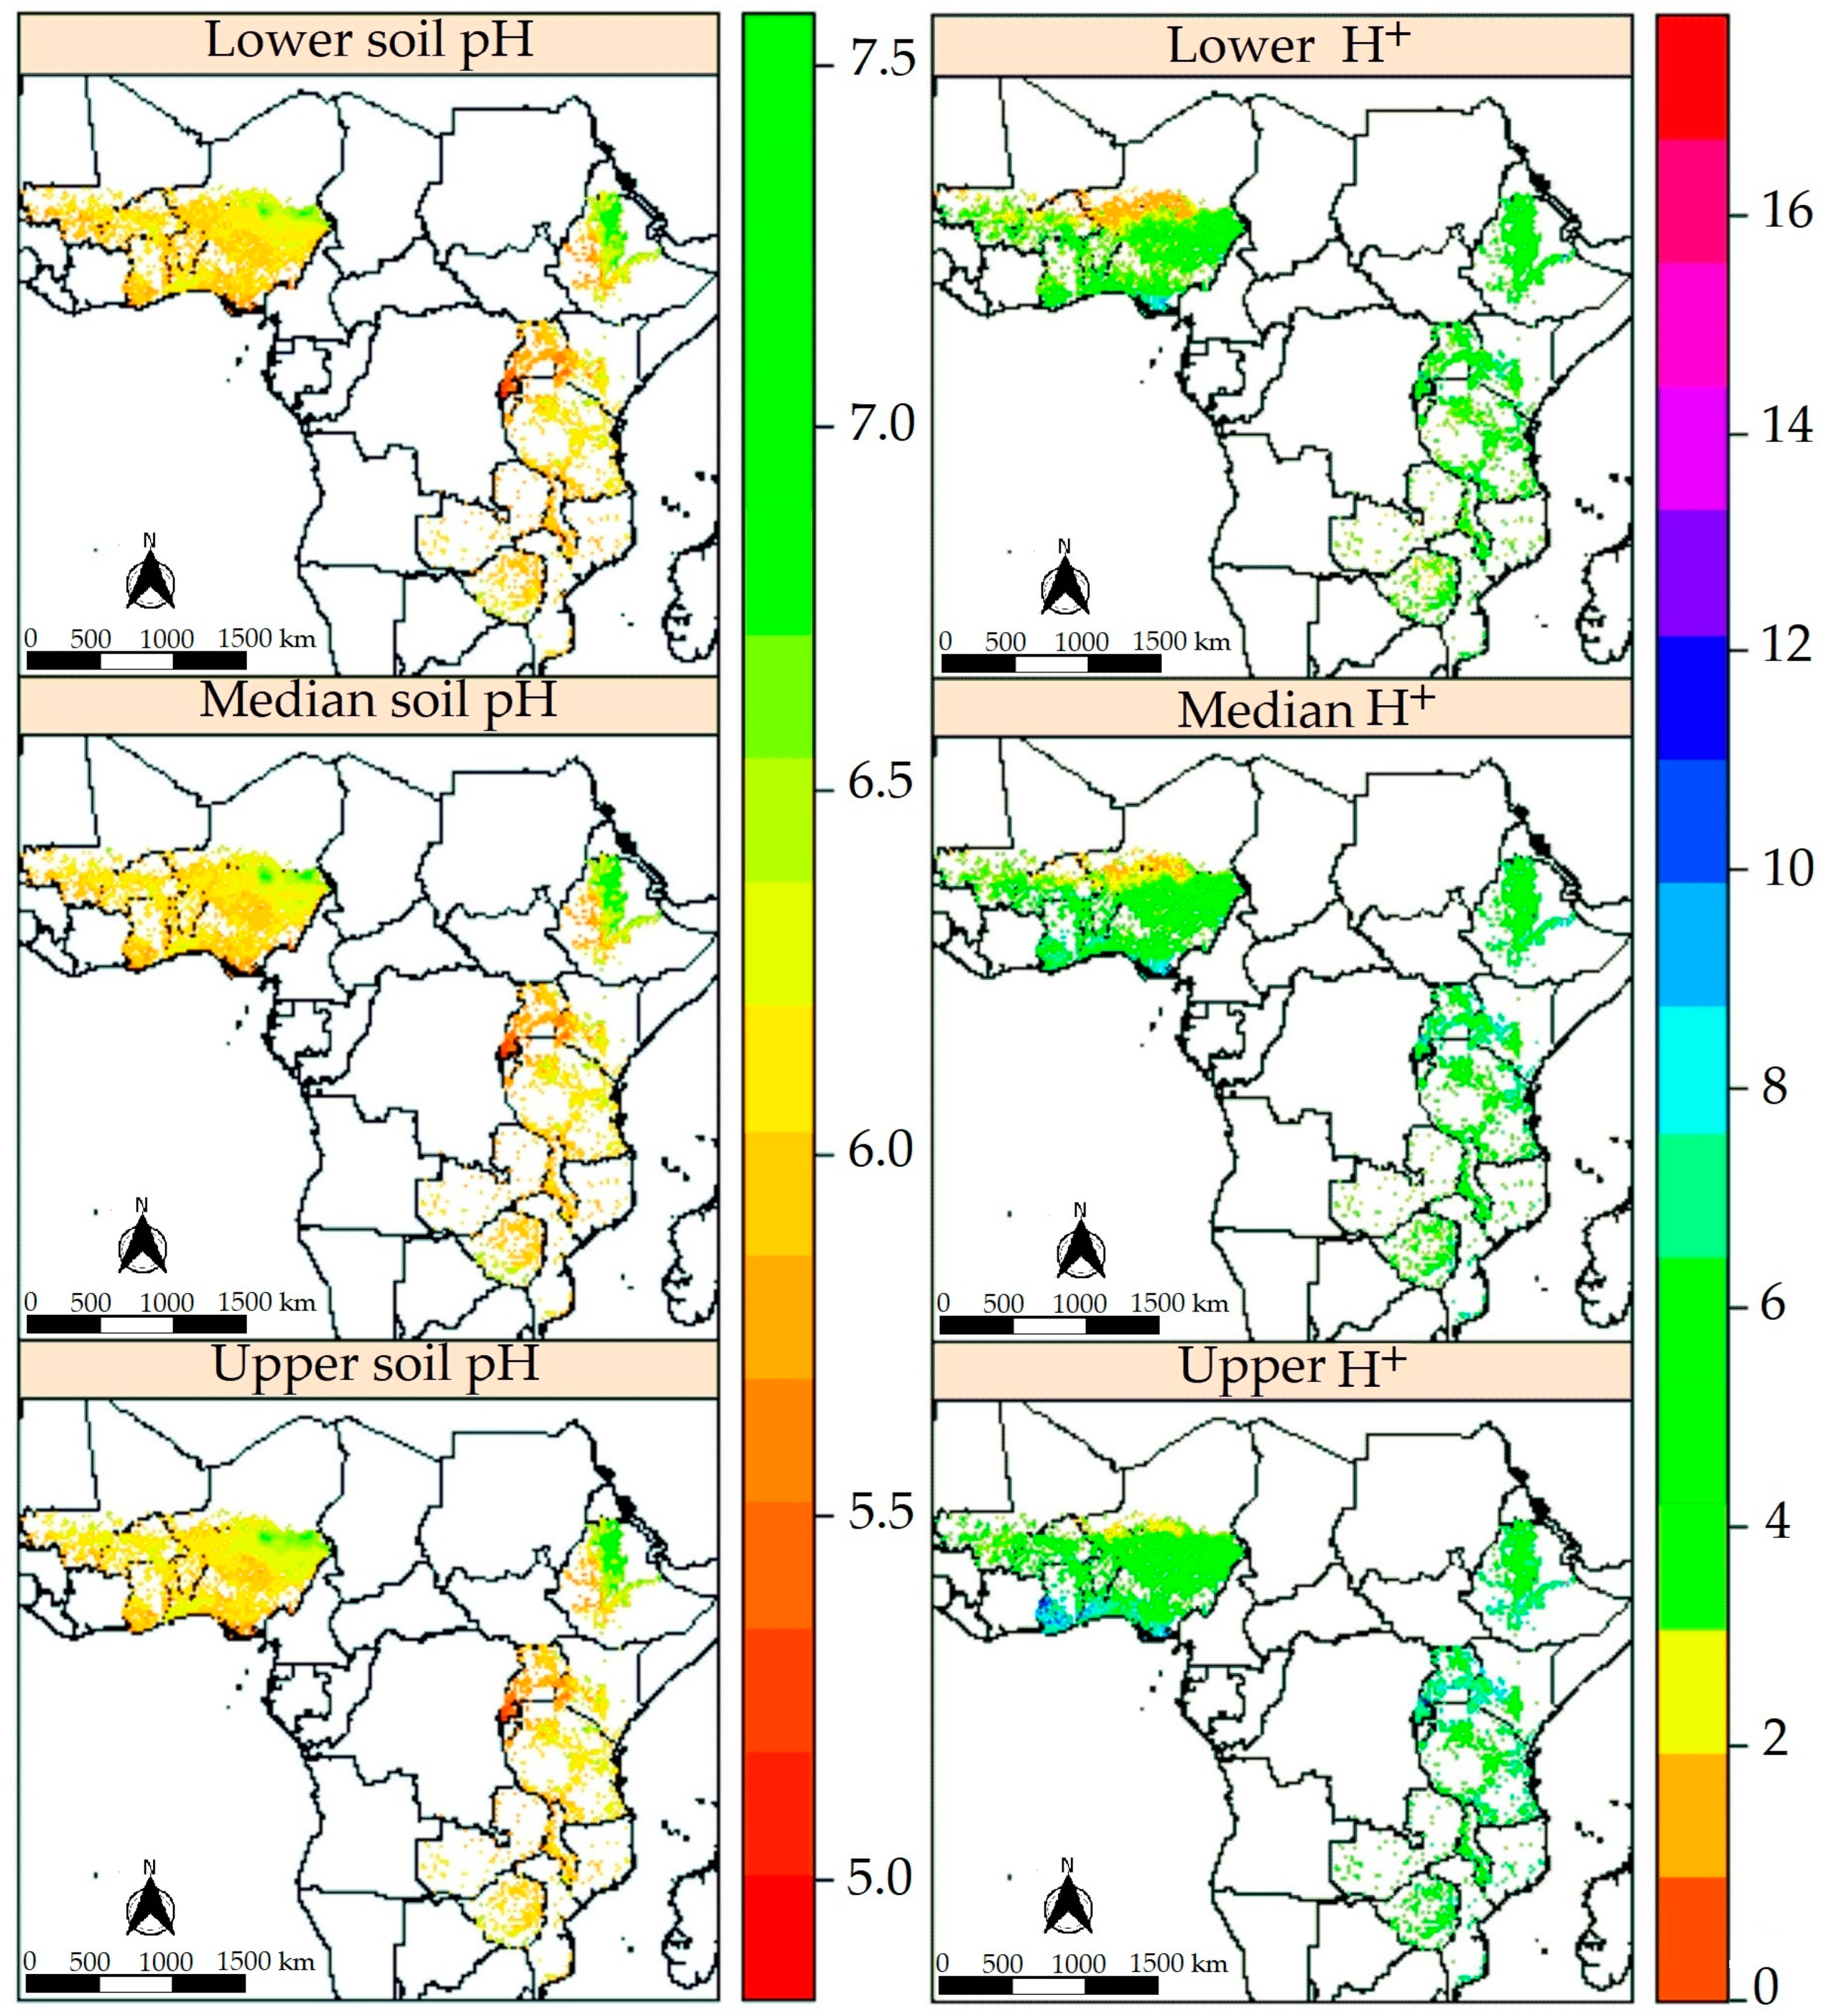
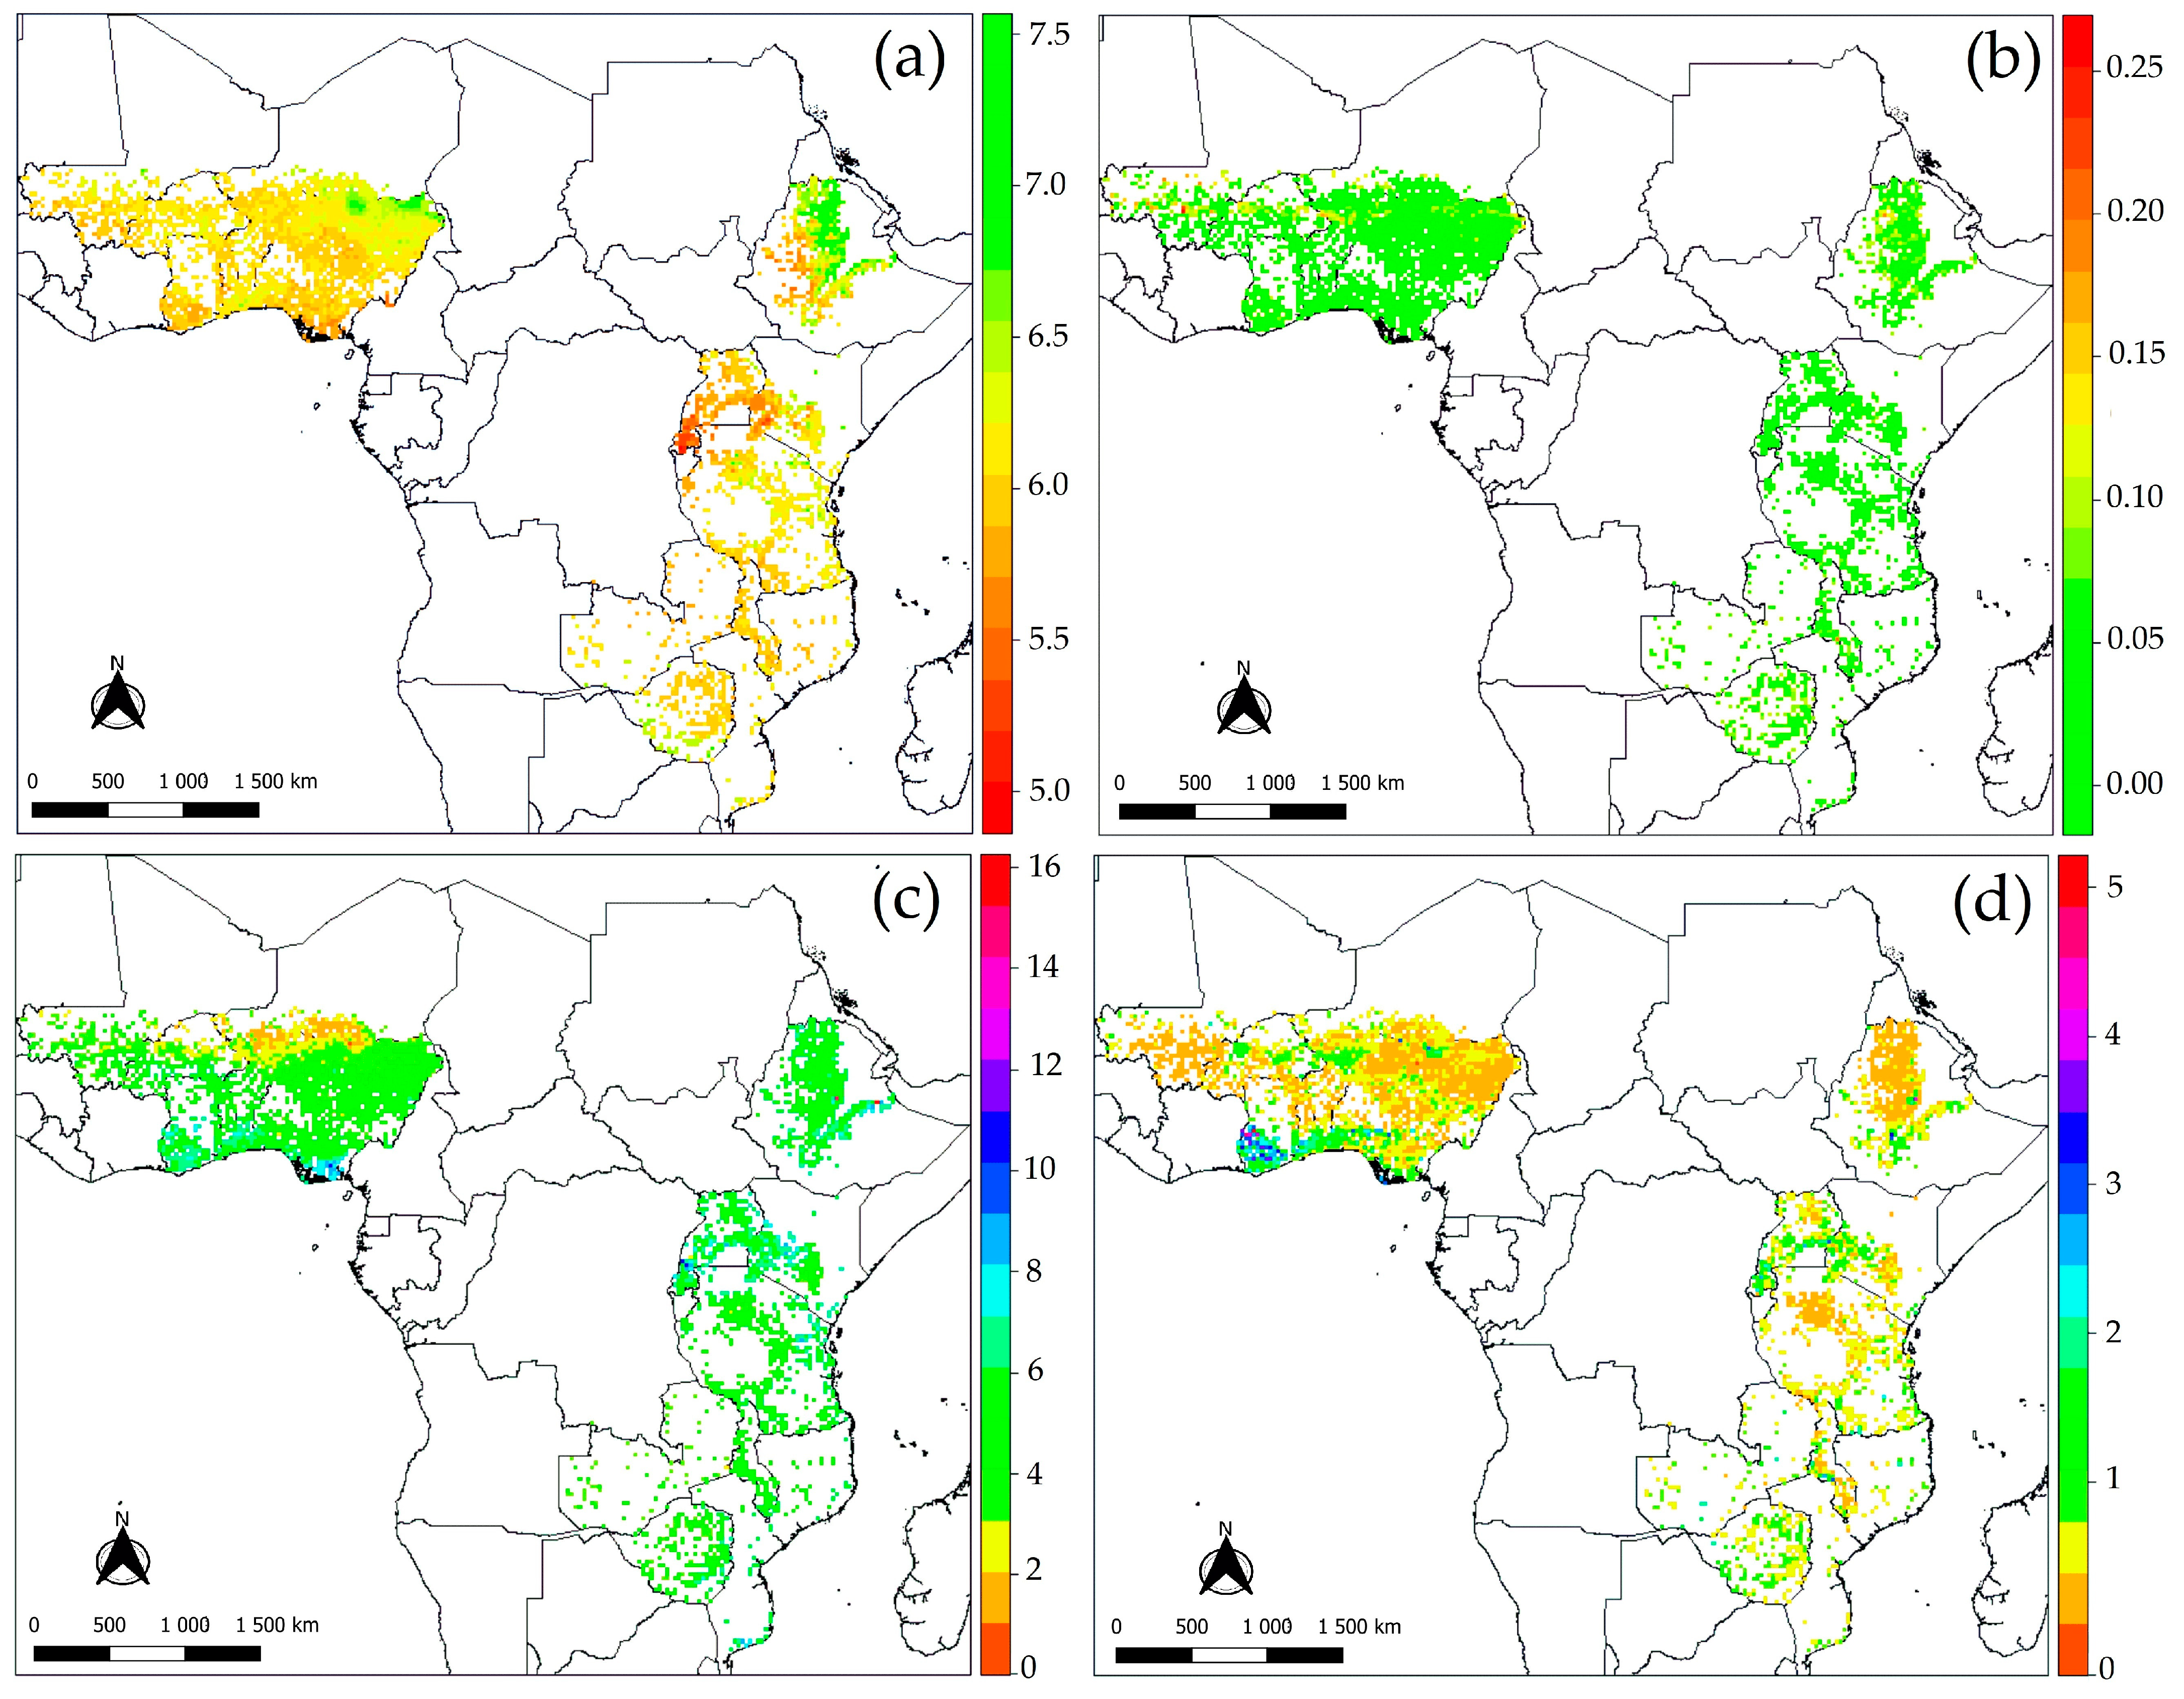
3.2.3. Predictions of Soil pH, Produced Protons (H+), and Their Uncertainties

The highest soil pH (above 7) was observed in the eastern cropland of Ethiopia, south east of Niger. Soil pH between 6.5 and 7 was observed in the southern part of Niger. The larger part of cropland in 16 countries studied had a soil pH that ranged from 6 to 6.5. This range was observed in the southern part of Mali, Nigeria, Tanzania, Zambia, Malawi, Mozambique, and Zimbabwe. The lowest predicted soil pH (6.5–4.8) was observed in the western part of Ethiopia, Kenya, Uganda, and Rwanda. There was not a distinct difference between the lower, median, and upper prediction map of soil pH (Figure 5, Left).
The predicted soil acidification expressed in keq H+ ha−1 yr−1 showed that the H+ predicted ranged from 0 to 18 keq H+. The variation of spatial prediction was distinct between lower, median, and upper prediction maps which shows the high variation of H+ production in different cropping systems. Zimbabwe, Niger, and Mali had the lowest H+ which ranged between 0 and 5 keq ha−1 yr−1. The south-west parts of SSA and the eastern part except Zimbabwe produced higher H+ ranging between 5 and 8 keq H+ ha−1 yr−1 and a small part of the eastern part of Ethiopia and the southern part of Burkina Faso had the highest H+ production higher than 8 keq H+ha−1yr−1 but lower than 13 (under median H+ map) while under the upper production map these areas had a H+ production which was higher than 12 keq H+ ha−1 yr−1 (Figure 5, Right).
The uncertainties assessment showed that soil pH errors ranged between 0 and 0.25 pH units. However the larger part of soil pH map had very low errors (<0.05 pH unit) except part of Mali, the western part of Ethiopia, and parts of Zimbabwe which had soil pH errors ranging from 0.05 to 0.15 pH units of standard deviation (Figure 6a,b). The highest soil pH errors were also observed in Mali (south-western part) with a standard deviation higher than 0.15 pH units but it is very small area. The assessment of uncertainties of spatial variation of H+ showed that the standard deviation map almost ranged from 0 to 2 keq H+ ha−1 yr−1. The southern part of Burkina Faso, Benin, Ghana, and Nigeria had the highest errors ranging from 2 to 3 keq H+ ha−1 yr−1 (Figure 6c,d).

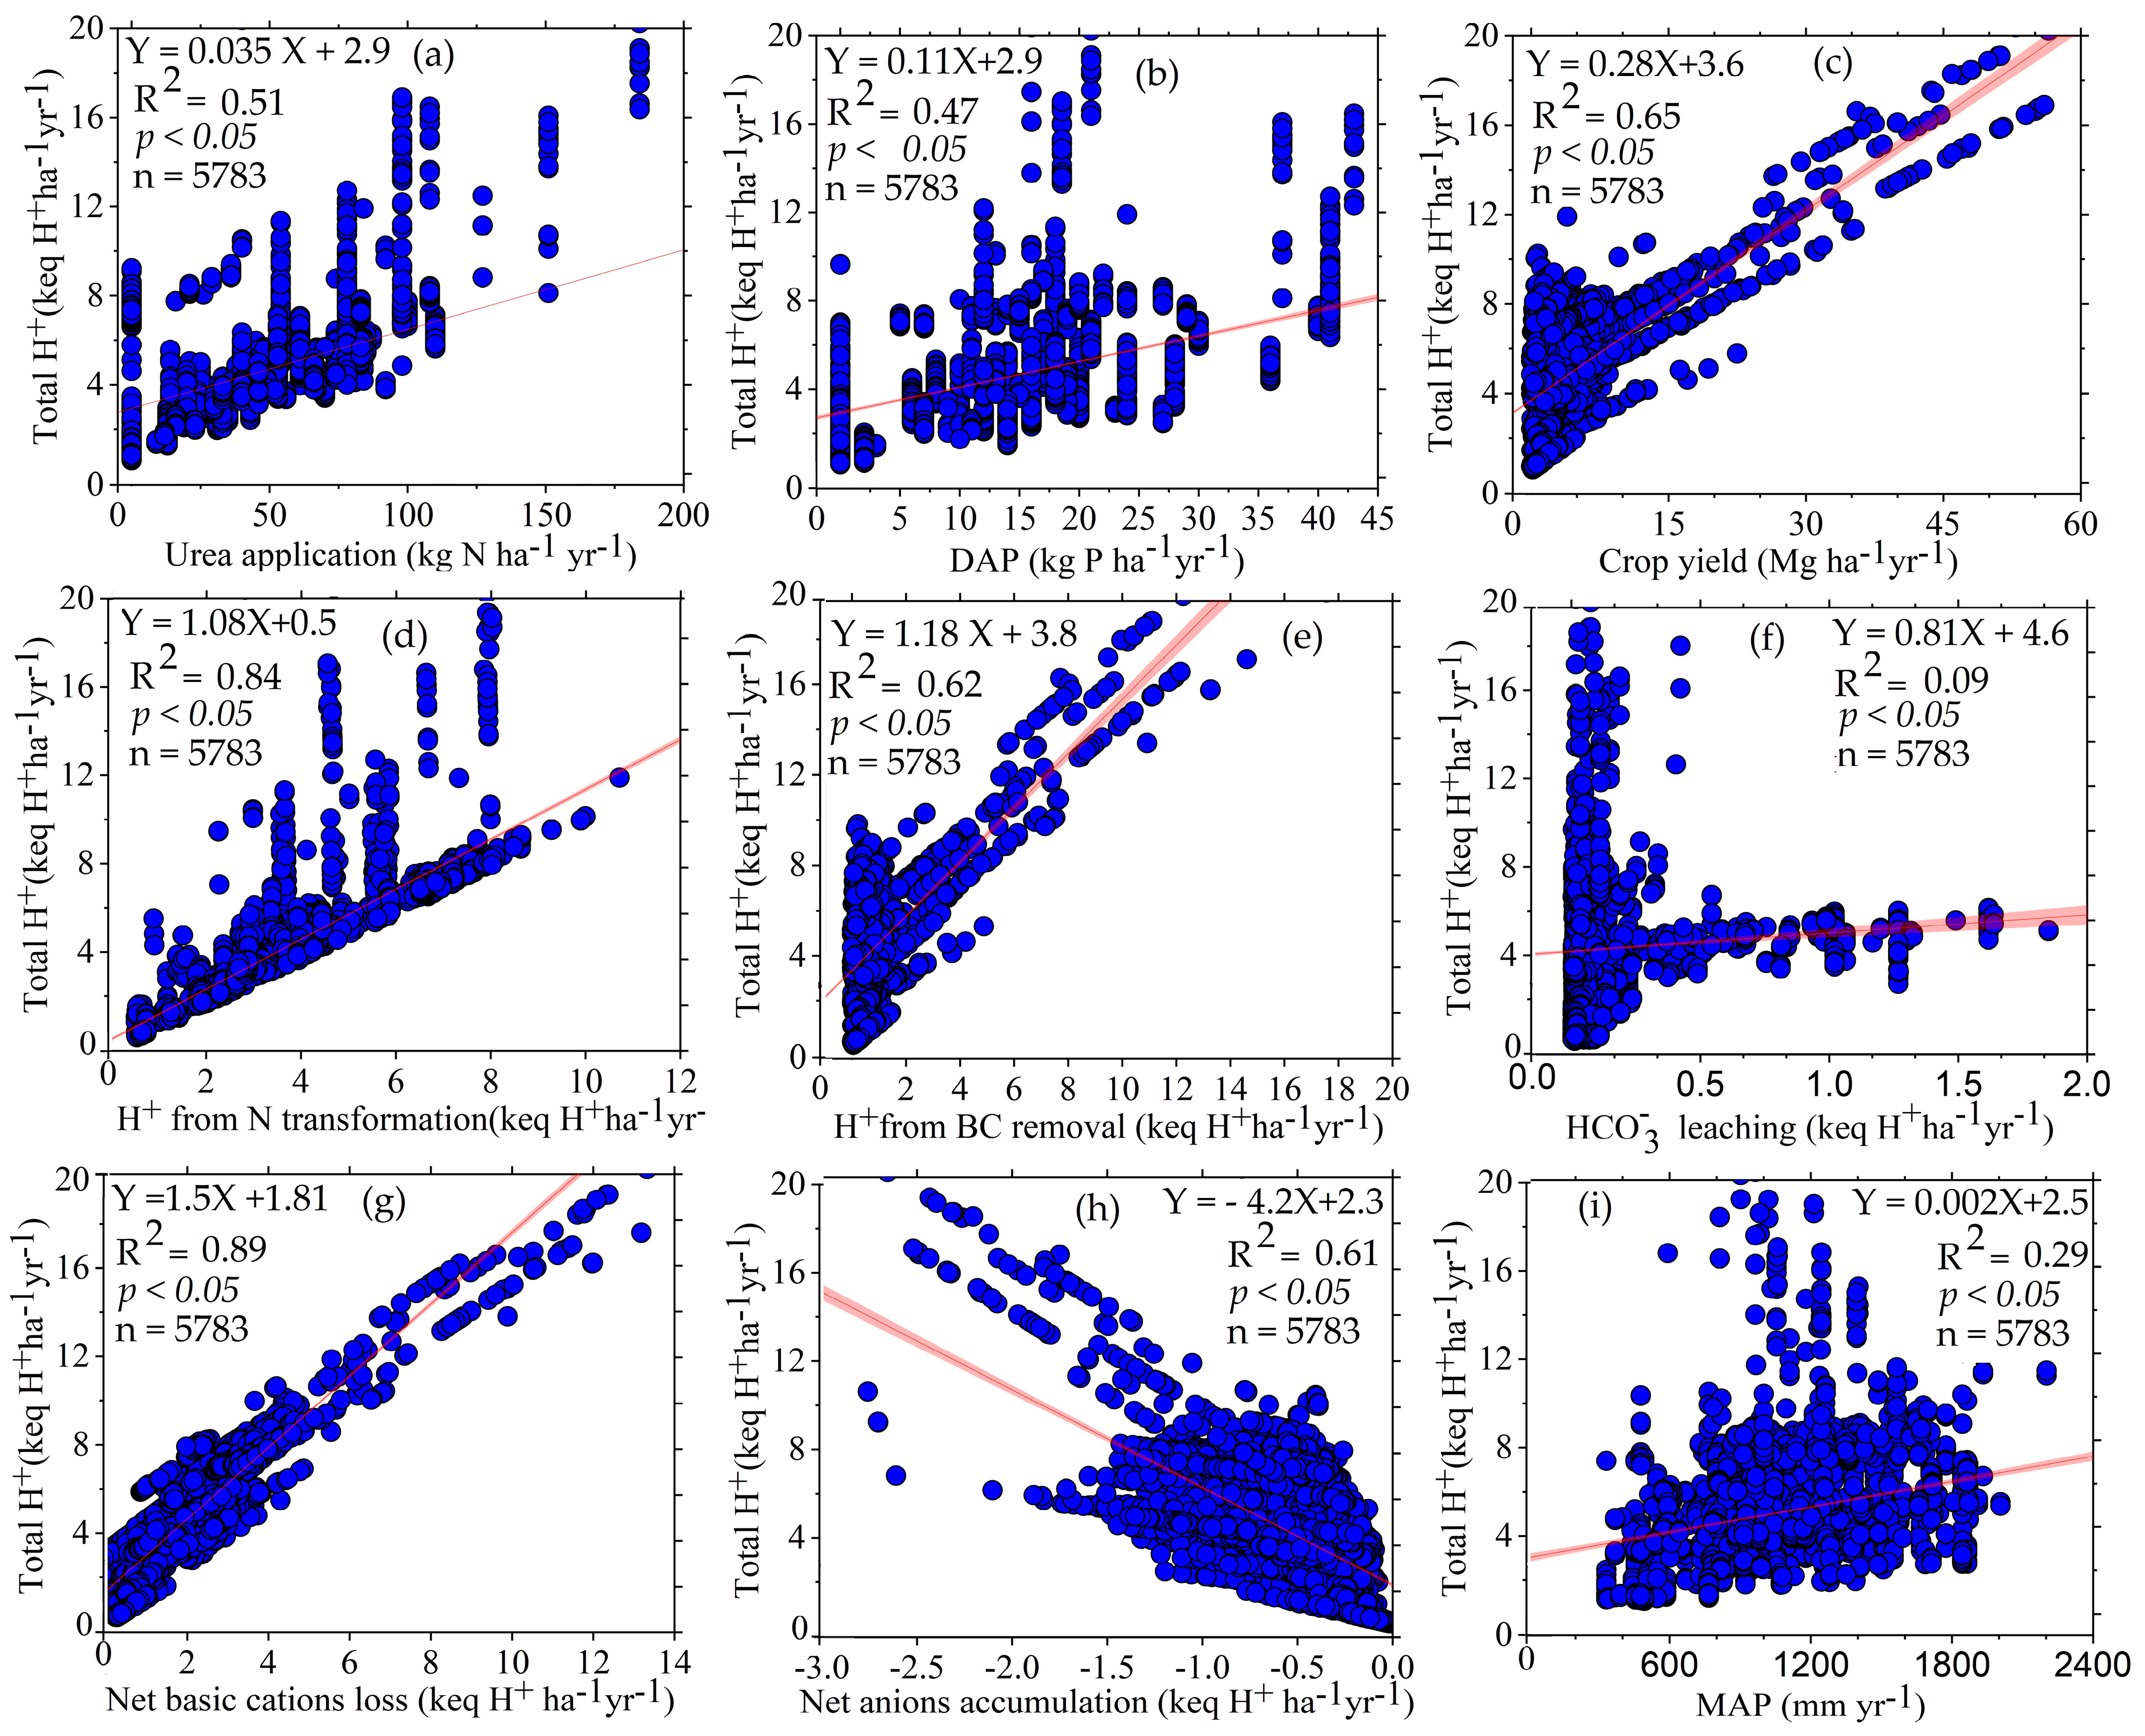
3.3. Relationship between Protons Produced (H+) and Its Factors

The soil acidification (H+) was positively associated with the urea application rate (kg N ha−1 yr−1) (p < 0.05, R2 = 0.51, Figure 7a), with DAP (p < 0.05, R2 = 0.41, Figure 7b), with crop yield (p < 0.05, R2 = 0.65, Figure 7c). There was a strong relationship between soil acidification and N transformation (p < 0.05, R2 = 0.84, Figure 7d). The relationship of soil acidification with N transformation was higher than basic cation removal from crop harvest (cations in crop yield and residues minus anion concentration in crop yield and residues) (p < 0.05, R2 = 0.62, Figure 7e). The relationship of H+ produced with bicarbonate leaching was not significant (p > 0.05, R2 = 0.09, Figure 7f). The net basic cation loss was identified as the main driver of soil acidification in SSA due to its higher strong significant relationship with soil acidification compared to other soil acidification factors (p < 0.05, R2 = 0.89, Figure 7g). This study also revealed that the net accumulation of anions in Sub-Saharan Africa had a strong negative relationship with soil acidification (p < 0.05, R2 = 0.61, Figure 7h) while the mean annual precipitation also influenced soil acidification (p < 0.05, R2 = 0.29, Figure 7i).

4. Discussion

The extent to which soil acidification occurs is determined by several factors, including N fate and the amounts of base cations added and lost from the cropland. In Sub-Saharan Africa, optimized fertilizer rate increased crop yield through nutrient transformation and assimilation. In this study, soil acidification was driven by H+ from net basic cation loss rather than H+ from N transformations. At first, we discussed how soil acidification in Sub-Saharan Africa is influenced by N transformation and net basic cation loss. Next, we discussed about how accurate the model was and uncertainties of produced soil acidification maps.

4.1. N Transformation and Basic Cation Budget

Increased crop yields were observed as a result of optimizing the fertilizer rate, manure application, and atmospheric deposition, all of which provided abundant major nutrients (NPK) and other micro nutrients for plant growth (Table 2) [12,46]. Normally, it has been shown that the over fertilization of ammonium-based fertilizers accelerates nitrification and enhances high NO3 leaching, and N transformation processes, which have been found to be the main drivers of soil acidification [47].
Our results revealed that it was not the case because we found that under optimized fertilizer use, net basic cation loss was the main driver of soil acidification in Sub-Saharan Africa (Figure 5).
The main processes of net basic cation loss were basic cation removal and basic cation leaching, with mean values of 1.93 and 1.83 keq ha−1yr−1, respectively. Nitrate leaching explains how basic cations leach as soil particles want to keep their electric charges, NO3¯ ions frequently combine with positively charged base cations (Ca2+, K+, Mg2+, Na+) in soils; consequently, NO3 leaching depletes base cations [48]. The amount of soil nutrients lost varies greatly with precipitation, soil properties (mainly soil texture), and the crops grown, as nutrient loss occurs when infiltration exceeds soil water holding capacity of a given soil [3]. The banana cropping system, for instance, lost more than 79 kg N, 63 kg K, 31 kg K, and 40 kg Mg ha−1 yr−1 in West Africa, which has a tropical humid climate (MAP > 1569 mm yr−1), and Acrisols and Luvisols (with low activity clay) [2]. It has also been demonstrated that N leaching varies by land use class and is more prevalent in cropland than in other land use classes [49]. The depletion of basic cations hastens soil acidification because these basic cations act as a buffer against soil acidification in tropics [2,14]. Furthermore, net basic cation loss had a stronger positive relationship with soil acidification (H+ production) (p < 0.05 and R2 = 0.89), which was stronger than the relationship between N transformation and soil acidification (p < 0.05 and R2 = 0.84). This finding was also confirmed in subtropical field trials under optimized fertilizer use [37,50]. Our findings also confirmed that acidification in SSA cropping systems is primarily caused by N cycle effects rather than C cycle effects (Figure 2a). Optimized N fertilizer use increased crop yield and available nitrate, contributing to high basic cation uptake and nitrate leaching [6]. Our findings aligned with other studies in SSA cropping systems, which demonstrated that the risk of acidification due to the N cycle increases when soil N status is raised by applying fertilizers or using N-fixing legumes to increase productivity, which results in nitrate accumulation in deep soil and nitrate leaching [51]. N leaching is a major problem across SSA, as shown by the fact that up to 85% of N output from Ferralsols continuously cropped to maize in Togo was lost to leaching [52] and in the northern Nigerian savannah with a MAP of 939 mm yr−1, Oikeh et al. [53] indicated that 60 kg N ha−1 was lost from under a maize crop that followed maize, while 150 kg N ha−1 was lost when the maize crop followed soybeans and the losses were attributed mainly to the leaching of nitrate. As previously discussed, NO3 leaching from N addition causes the direct loss of basic cations and promotes the decline of no calcareous soil acid-buffering mechanisms, and increases soil acidification [39,50]. We can therefore state with confidence that, when fertilizer use was optimized in SSA cropping systems, net basic cation loss was the main driver of soil acidification because the increased basic cation uptake by crops and high nitrate leaching which promotes basic cation leaching. As we discussed above, nitrate leaching enhances the leaching of basic cations in order to keep the balance of electric charges on soil colloids [6,54].
It is also important to remember that ammonium-based fertilizers always produce secondary soil acidity in cropland [55,56]. This effect was also found in our results, which showed that ammonium-based fertilizers had a positive relationship with soil acidification (Figure 7a,b). Urea application rate (kg N ha−1 yr−1) had a significant positive relationship with H+ (p < 0.05, R2 = 0.51; Figure 7a) and DAP and soil acidification (p < 0.05, R2 = 0.41; Figure 7b). However, the relationship between crop yield and H+ produced was higher than the effect of ammonium-based fertilizers (p < 0.05, R2 = 0.65, Figure 3c). This is another fact which convinced us to conclude that crop removal and basic cation leaching were dominant contributors to soil acidification rather than N transformation processes under optimized fertilizer use in SSA cropland. This was not a surprise because it has been found also that basic cation loss is the main driving factor in an optimized fertilizer use system [37].

4.2. Model Performances, Soil Acidification Patterns, and Uncertainties Assessment

The low errors of soil pH model (RMSE = 0.11 pH unit) and high errors of soil acidification (RMSE = 2.1 keq H+ ha−1yr−1) can both be explained by selected environmental covariates for ensemble machine learning use (“rf” and “xgbDART”). This performance is satisfactory because the results of our prediction were what we expected based on the distribution of training data and selected environmental covariates proposed (Figure 3). Our findings are related to the results of Zhou et al. [57] and Uwiragiye et al. [26] who reported that the choice of predictive models and covariates influence prediction accuracy. In addition, the use of ensemble machine learning increased the model accuracy as that ensemble machine learning increased up to 15% of R2 and decreased RMSE and MAE by 15% compared to the use of the single model [58]. The errors of the soil acidification model seem to be high (RMSE = 2.1 keq H+ ha−1 yr−1) but they were acceptable as they were related to the coefficient of determination (R2 = 65%) which means that the model explained only 65% of soil acidification. Compared to the other literature, this performance is acceptable because it is higher compared to other findings. For example, Hounkpatin et al. [59] reported a low R2 of 14% for soil organic C modelling in Burkina Faso and Mponela et al. [60] reported a low R2 for soil NPK nutrient content prediction in Malawi (R2: 14%, 28%, and 21%, respectively) using the Random forest algorithm, The R2 values reported by Uwiragiye et al. [26] for soil NKP depletion in Rwanda (R2 = 62%, 58%, and 58%, respectively) which were lower than the accuracy we achieved with ensemble machine learning (R2 = 71%, 61% for soil pH and H+); furthermore, it has been shown that a lower R2 is a common characteristic of statistical prediction methods [61]. The spatial pattern of soil acidification was driven by crop yield, soil bulk density, soil organic carbon, clay content, and the precipitation of the wettest quarter (Figure 3). The most important environmental covariates overall were climate variables (40.5%), soil properties (35%), topographic features (11%), human activities (9%), and parent materials (4%) which showed that the SCORPAN guidelines were followed in the digital soil mapping approach [40]. However, the high standard deviation of soil acidification can be explained by the lower influence of anthropogenic activities and increasing the accuracy of the H+ model would involve more covariates related to human activities such as agriculture land use.

4.3. Implications and Practical Recommendations

To feed the rapidly growing population, SSA needs to increase the fertilizer application rates and crop yield. Our study indicates that soil acidification could be a big challenge in most of the SSA countries (Figure 6c). Liming, maximizing nitrate uptake, minimizing basic cation removal and redistribution, efficient and balanced nitrogen fertilization, crop residue return, manure application, use of biochar, acid-tolerant genotypes, and management of cation/anion uptake are ways to ameliorate soil acidity [7,62].
Nitrate leaching from the topsoil is a major cause of topsoil acidification. Thus, efficient utilization of soil nitrate by plant roots in deeper layers reduces subsoil acidification. It has also been shown that crop nitrate uptake and the use of nitrate fertilizers can reduce soil acidification and increase subsoil pH [63,64]. Noble et al. [62] suggested that a practical method for reducing subsoil acidity in sugarcane production is the formation of Ca (NO3)2 via lime and ammonium-based fertilizers, followed by nitrate leaching and the preferential uptake of nitrate. Recycling crop residues has been proposed as a solution to reduce soil acidification. Straws high in alkalinity and low in nitrogen, such as peanut and faba bean, can cause a significant rise in soil pH, whereas straws high in nitrogen, such as pea and soybean, can cause only a moderate rise in soil pH, owing to H+ production by nitrification and improved mineralization of organic N [7,65,66].
Acid-tolerant cultivars are a promising alternative to liming and other acid-neutralizing practices by selecting species and genotypes with low excess cations in the products, low acid production, and high capacity to absorb soil nitrate may provide an option to reduce subsoil acidification [67,68]. Seven basic food crop species with a high level of acid soil tolerance in tropics are Cassava (Manihot esculenta), Cowpea (Vigna unguiculata), Peanut (Arachis hypogaea), Pigeon pea (Cajanus cajan), Plantain (Musa paradisiaca), Potato (Solanum tuberosum), and Rice (Oryza sativa) [67,69]. Manure application can temporarily raise soil pH by adding basic cations back to soils and facilitating the decarboxylation of organic anions, the ammonification of labile organic N in manure, and the formation of Al–organic matter complexes [13,62]. Biochar, in addition to manure, has been shown to be an effective method for reducing soil acidity. This is because biochar has a higher percentage of alkaline ash and the ability to neutralize produced H+ in soil solution [48,70,71].

5. Conclusions

In Sub-Saharan Africa, optimized fertilizer rate increased crop yield through nutrient transformation and assimilation. Our results revealed that proton production rates ranged from 1.80 to 12.0 keq H+ ha−1 yr−1, depending on different cropping systems. The top four agricultural systems with the highest H+ production were cassava (12.0 keq H+ ha−1 yr−1), banana (9.88 keq H+ ha−1 yr−1), Irish potatoes (8.89 keq H+ ha−1 yr−1), and soybeans (7.81 keq H+ ha−1 yr−1). H+ from net basic cation loss drove soil acidification more than H+ from N transformations, bicarbonate leaching, basic cation uptake, and net anion accumulation. The high contribution of net basic cation loss was explained by high basic cation uptake by crops and leaching, whereas optimized ammonium-based fertilizer (urea and diammonium phosphate) increased crop yield, nitrification, and nitrate leaching. We recommend that maximizing nitrate uptake, minimal basic cation removal and redistribution, increasing nitrogen use efficiency, recycling plant residues to the soil, manure application, use of biochar, acid-tolerant genotypes, and management of cation/anion balance in soil could significantly reduce acidification risks.

Supplementary Materials

The following supporting information can be downloaded at: https://www.mdpi.com/article/10.3390/agronomy13030632/s1, Table S1: Soil acidification processes, Table S2: Element concentrations in crop harvest, crop residues and related parameters in crop removal calculation, Table S3: Calculations of elements (ions) from kg ha−1 yr−1 to keq ha−1 yr−1, Table S4: Environmental covariates used for modelling. References [72,73,74,75,76,77] are cited in the Supplementary Materials.

Author Contributions

Conceptualization, Y.U. and J.Z.; methodology, Y.U.; software, Y.U., M.J.Y.N. and M.Y.; validation, Y.U., M.J.Y.N., M.Y. and A.S.E.; formal analysis, Y.U., M.J.Y.N., M.Y. and A.S.E.; investigation, Y.U. and A.S.E.; resources, Y.U., M.J.Y.N., M.Y. and A.S.E.; data curation, Y.U., M.J.Y.N., M.Y. and A.S.E.; writing—original draft preparation, Y.U.; writing—review and editing, Y.U., A.S.E., J.Z.; M.J.Y.N. and Z.C., visualization, Y.U., A.S.E.; supervision, J.Z. and Z.C.; project administration, J.Z. and Z.C.; funding acquisition, J.Z. and Z.C. All authors have read and agreed to the published version of the manuscript.

Funding

This research was funded by National Natural Science Foundation of China: No. 42277343. National Key R.&D Program of China: No. 2017YFD0200106; 111 Project: No. B12007.

Data Availability Statement

Data available upon request.

Conflicts of Interest

The authors declare no conflict of interest.

References

  1. De Pauw, E.F. The Management of Acid Soils in Africa. Outlook Agric. 1994, 23, 11–16. [Google Scholar] [CrossRef]
  2. Sanchez, P.A. Soils of the Tropics. In Properties and Management of Soils in the Tropics; Cambridge University Press: Cambridge, UK, 2019; pp. 82–119. [Google Scholar] [CrossRef]
  3. Weil, R.R.; Brady, N.C. The Nature and Properties of Soils, 15th ed.; Pearson: Columbus, OH, USA, 2016; ISBN 978-0-13-325448-8. [Google Scholar]
  4. Bolan, N.S.; Hedley, M.J.; White, R.E. Processes of soil acidification during nitrogen cycling with emphasis on legume based pastures. Plant Soil 1991, 134, 53–63. [Google Scholar] [CrossRef]
  5. Helyar, K.; Porter, W. Soil Acidification, its Measurement and the Processes Involved. In Soil Acidity and Plant Growth; Elsevier: Amsterdam, The Netherlands, 1989; pp. 61–101. [Google Scholar] [CrossRef]
  6. Hedley, M.; Bolan, N. Role of Carbon, Nitrogen, and Sulfur Cycles in Soil Acidification. In Handbook of Soil Acidity; Taylor Francis Group: Abingdon, UK, 2003. [Google Scholar] [CrossRef]
  7. CaiXan, T.; Rengel, Z. Role of Plant Cation/Anion Uptake Ratio in Soil Acidification. In Handbook of Soil Acidity; Taylor Francis Group: Abingdon, UK, 2003. [Google Scholar]
  8. Vanlauwe, B.; Kihara, J.; Chivenge, P.; Pypers, P.; Coe, R.; Six, J. Agronomic use efficiency of N fertilizer in maize-based systems in sub-Saharan Africa within the context of integrated soil fertility management. Plant Soil 2010, 339, 35–50. [Google Scholar] [CrossRef]
  9. Takala, B. Soil Acidity and Its Management Options in Western Ethiopia: Review. J. Environ. Earth Sci. 2019, 9, 27–35. [Google Scholar] [CrossRef]
  10. Zingore, S.; Mutegi, J.K.; Agesa, B.; Tamene, L.; Kihara, J.; Zingore, S.; Mutegi, J.K.; Agesa, B.; Tamene, L.; Kihara, J.; et al. Soil Degradation in Sub-Saharan Africa and Crop Production Options for Soil Rehabilitation. Better Crops 2015, 99, 24–26. [Google Scholar]
  11. Chianu, J.N.; Chianu, J.N.; Mairura, F. Mineral fertilizers in the farming systems of sub-Saharan Africa. A review. Agron. Sustain. Dev. 2011, 32, 545–566. [Google Scholar] [CrossRef] [Green Version]
  12. Wortmann, C.S.; Milner, M.; Kaizzi, K.C.; Nouri, M.; Cyamweshi, A.R.; Dicko, M.K.; Kibunja, C.N.; Macharia, M.; Maria, R.; Nalivata, P.C.; et al. Maize-nutrient response information applied across Sub-Saharan Africa. Nutr. Cycl. Agroecosyst. 2017, 107, 175–186. [Google Scholar] [CrossRef]
  13. Cai, Z.; Wang, B.; Xu, M.; Zhang, H.; He, X.; Zhang, L.; Gao, S. Intensified soil acidification from chemical N fertilization and prevention by manure in an 18-year field experiment in the red soil of southern China. J. Soils Sediments 2014, 15, 260–270. [Google Scholar] [CrossRef]
  14. Sanchez, P.A. Properties and Management of Soils in the Tropics. Soil Sci. 1977, 124, 187. [Google Scholar] [CrossRef]
  15. Abruna, F.; Pearson, R.W.; Elkins, C.B. Quantitative Evaluation of Soil Reaction and Base Status Changes Resulting from Field Application of Residually Acid-Forming Nitrogen Fertilizers. Soil Sci. Soc. Am. J. 1958, 22, 539–542. [Google Scholar] [CrossRef]
  16. Juo, A.S.R.; Dabiri, A.; Franzluebbers, K. Acidification of a kaolinitic Alfisol under continuous cropping with nitrogen fertilization in West Africa. Plant Soil 1995, 171, 245–253. [Google Scholar] [CrossRef]
  17. Stumpe, J.M.; Vlek, P.L.G. Acidification Induced by Different Nitrogen Sources in Columns of Selected Tropical Soils. Soil Sci. Soc. Am. J. 1991, 55, 145–151. [Google Scholar] [CrossRef]
  18. Bai, Y.; Wang, Y. Spatial Variability of Soil Chemical Properties in a Jujube Slope on the Loess Plateau of China. Soil Sci. 2011, 176, 550–558. [Google Scholar] [CrossRef]
  19. Hengl, T.; Miller, M.A.E.; Križan, J.; Shepherd, K.D.; Sila, A.; Kilibarda, M.; Antonijević, O.; Glušica, L.; Dobermann, A.; Haefele, S.M.; et al. African soil properties and nutrients mapped at 30 m spatial resolution using two-scale ensemble machine learning. Sci. Rep. 2021, 11, 6130. [Google Scholar] [CrossRef]
  20. Hounkpatin, K.O.; Bossa, A.Y.; Yira, Y.; Igue, M.A.; Sinsin, B.A. Assessment of the soil fertility status in Benin (West Africa)—Digital soil mapping using machine learning. Geoderma Reg. 2021, 28, e00444. [Google Scholar] [CrossRef]
  21. Kamamia, A.W.; Vogel, C.; Mwangi, H.M.; Feger, K.-H.; Sang, J.; Julich, S. Mapping soil aggregate stability using digital soil mapping: A case study of Ruiru reservoir catchment, Kenya. Geoderma Reg. 2021, 24, e00355. [Google Scholar] [CrossRef]
  22. Kempen, B.; Dalsgaard, S.; Kaaya, A.K.; Chamuya, N.; Ruipérez-González, M.; Pekkarinen, A.; Walsh, M.G. Mapping topsoil organic carbon concentrations and stocks for Tanzania. Geoderma 2019, 337, 164–180. [Google Scholar] [CrossRef]
  23. Leenaars, J.; Elias, E.; Wösten, J.; Ruiperez-González, M.; Kempen, B. Mapping the major soil-landscape resources of the Ethiopian Highlands using random forest. Geoderma 2019, 361, 114067. [Google Scholar] [CrossRef]
  24. Sindayihebura, A.; Ottoy, S.; Dondeyne, S.; Van Meirvenne, M.; Van Orshoven, J. Comparing digital soil mapping techniques for organic carbon and clay content: Case study in Burundi’s central plateaus. Catena 2017, 156, 161–175. [Google Scholar] [CrossRef]
  25. Leenaars, J.G.; Claessens, L.; Heuvelink, G.B.; Hengl, T.; González, M.R.; van Bussel, L.G.; Guilpart, N.; Yang, H.; Cassman, K.G. Mapping rootable depth and root zone plant-available water holding capacity of the soil of sub-Saharan Africa. Geoderma 2018, 324, 18–36. [Google Scholar] [CrossRef]
  26. Uwiragiye, Y.; Ngaba, M.J.Y.; Zhao, M.; Elrys, A.S.; Heuvelink, G.B.; Zhou, J. Modelling and mapping soil nutrient depletion in humid highlands of East Africa using ensemble machine learning: A case study from Rwanda. Catena 2022, 217, 106499. [Google Scholar] [CrossRef]
  27. Dewitte, O.; Jones, A.; Spaargaren, O.; Breuning-Madsen, H.; Brossard, M.; Dampha, A.; Deckers, J.; Gallali, T.; Hallett, S.; Jones, R.; et al. Harmonisation of the soil map of Africa at the continental scale. Geoderma 2013, 211–212, 138–153. [Google Scholar] [CrossRef] [Green Version]
  28. Peel, M.C.; Finlayson, B.L.; McMahon, T.A. Updated world map of the Köppen-Geiger climate classification. Hydrol. Earth Syst. Sci. 2007, 11, 1633–1644. [Google Scholar] [CrossRef] [Green Version]
  29. Meyer, H.; Pebesma, E. Predicting into unknown space? Estimating the area of applicability of spatial prediction models. Methods Ecol. Evol. 2021, 12, 1620–1633. [Google Scholar] [CrossRef]
  30. Zanaga, D.; van de Kerchove, R.; de Keersmaecker, W.; Souverijns, N.; Brockmann, C.; Quast, R.; Wevers, J.; Grosu, A.C.; Paccini, A.; Vergnaud, S.; et al. ESA WorldCover 10 m 2020 V100; International Institute for Applied Systems Analysis: Laxenburg, Austria, 2021. [Google Scholar]
  31. Ghimire, R.; Machado, S.; Bista, P. Soil pH, Soil Organic Matter, and Crop Yields in Winter Wheat–Summer Fallow Systems. Agron. J. 2017, 109, 706–717. [Google Scholar] [CrossRef] [Green Version]
  32. Laouali, D.; Delon, C.; Adon, M.; Ndiaye, O.; Saneh, I.; Gardrat, E.; Dias-Alves, M.; Tagesson, T.; Fensohlt, R.; Galy-Lacaux, C. Source contributions in precipitation chemistry and analysis of atmospheric nitrogen deposition in a Sahelian dry savanna site in West Africa. Atmos. Res. 2021, 251, 105423. [Google Scholar] [CrossRef]
  33. FAO; Lesschen, J.P.; Stoorvogel, J.; Smaling, E. FAO Scaling Soil Nutrient Balances. Enabling Mesolevel Applications for African Realities; FAO: Rome, Italy, 2004. [Google Scholar]
  34. Zhu, Q.; de Vries, W.; Liu, X.; Hao, T.; Zeng, M.; Shen, J.; Zhang, F. Enhanced acidification in Chinese croplands as derived from element budgets in the period 1980–2010. Sci. Total. Environ. 2018, 618, 1497–1505. [Google Scholar] [CrossRef] [Green Version]
  35. Tarkalson, D.D.; Payero, J.O.; Hergert, G.W.; Cassman, K.G. Acidification of Soil in a Dry Land Winter Wheat-sorghum/corn-fallow Rotation in the Semiarid U.S. Great Plains. Plant Soil 2006, 283, 367–379. [Google Scholar] [CrossRef] [Green Version]
  36. Zhu, Q.; Liu, X.; Hao, T.; Zeng, M.; Shen, J.; Zhang, F.; De Vries, W. Modeling soil acidification in typical Chinese cropping systems. Sci. Total. Environ. 2018, 613–614, 1339–1348. [Google Scholar] [CrossRef] [Green Version]
  37. Hao, T.; Liu, X.; Zhu, Q.; Zeng, M.; Chen, X.; Yang, L.; Shen, J.; Shi, X.; Zhang, F.; de Vries, W. Quantifying drivers of soil acidification in three Chinese cropping systems. Soil Tillage Res. 2021, 215, 105230. [Google Scholar] [CrossRef]
  38. De Vries, W.; Breeuwsma, A. The relation between soil acidification and element cycling. Water Air Soil Pollut. 1987, 35, 293–310. [Google Scholar] [CrossRef]
  39. Dong, Y.; Yang, J.-L.; Zhao, X.-R.; Yang, S.-H.; Zhang, G.-L. Contribution of different proton sources to the acidification of red soil with maize cropping in subtropical China. Geoderma 2021, 392, 114995. [Google Scholar] [CrossRef]
  40. McBratney, A.; Santos, M.M.; Minasny, B. On digital soil mapping. Geoderma 2003, 117, 3–52. [Google Scholar] [CrossRef]
  41. Meyer, H.; Reudenbach, C.; Hengl, T.; Katurji, M.; Nauss, T. Improving performance of spatio-temporal machine learning models using forward feature selection and target-oriented validation. Environ. Model. Softw. 2018, 101, 1–9. [Google Scholar] [CrossRef]
  42. Deane-Mayer, Z.A.; Knowles, J. Ensembles of Caret Models, R Package CaretEnsemble, Version 2.0.1. 2019. Available online: https://cran.r-project.org/web/packages/caretEnsemble/caretEnsemble.pdf (accessed on 26 January 2023).
  43. Arrouays, D.; Grundy, M.G.; Hartemink, A.E.; Hempel, J.W.; Heuvelink, G.B.; Hong, S.Y.; Lagacherie, P.; Lelyk, G.; McBratney, A.B.; McKenzie, N.J.; et al. GlobalSoilMap. In Advances in Agronomy; Elsevier: Amsterdam, The Netherlands, 2014; pp. 93–134. [Google Scholar] [CrossRef]
  44. Hengl, T.; Nussbaum, M.; Wright, M.N.; Heuvelink, G.B.M.; Gräler, B. Random forest as a generic framework for predictive modeling of spatial and spatio-temporal variables. PeerJ 2018, 6, e5518. [Google Scholar] [CrossRef] [Green Version]
  45. Poggio, L.; de Sousa, L.M.; Batjes, N.H.; Heuvelink, G.B.M.; Kempen, B.; Ribeiro, E.; Rossiter, D. SoilGrids 2.0: Producing soil information for the globe with quantified spatial uncertainty. Soil 2021, 7, 217–240. [Google Scholar] [CrossRef]
  46. Berge, H.T.; Hijbeek, R.; van Loon, M.; Rurinda, J.; Tesfaye, K.; Zingore, S.; Craufurd, P.; van Heerwaarden, J.; Brentrup, F.; Schröder, J.; et al. Maize crop nutrient input requirements for food security in sub-Saharan Africa. Glob. Food Secur. 2019, 23, 9–21. [Google Scholar] [CrossRef]
  47. Guo, J.H.; Liu, X.J.; Zhang, Y.; Shen, J.L.; Han, W.X.; Zhang, W.F.; Christie, P.; Goulding, K.W.T.; Vitousek, P.M.; Zhang, F.S. Significant Acidification in Major Chinese Croplands. Science 2010, 327, 1008–1010. [Google Scholar] [CrossRef] [Green Version]
  48. Bolan, N.; Sarmah, A.K.; Bordoloi, S.; Bolan, S.; Padhye, L.P.; Van Zwieten, L.; Sooriyakumar, P.; Khan, B.A.; Ahmad, M.; Solaiman, Z.M.; et al. Soil acidification and the liming potential of biochar. Environ. Pollut. 2023, 317, 120632. [Google Scholar] [CrossRef]
  49. Elrys, A.S.; Uwiragiye, Y.; Zhang, Y.; Abdel-Fattah, M.K.; Chen, Z.-X.; Zhang, H.-M.; Meng, L.; Wang, J.; Zhu, T.-B.; Cheng, Y.; et al. Expanding agroforestry can increase nitrate retention and mitigate the global impact of a leaky nitrogen cycle in croplands. Nat. Food 2022, 4, 109–121. [Google Scholar] [CrossRef]
  50. Dong, Y.; Yang, J.-L.; Zhao, X.-R.; Yang, S.-H.; Mulder, J.; Dörsch, P.; Peng, X.-H.; Zhang, G.-L. Soil acidification and loss of base cations in a subtropical agricultural watershed. Sci. Total Environ. 2022, 827, 154338. [Google Scholar] [CrossRef]
  51. Randall, P.J.; Abaidoo, R.C.; Hocking, P.J.; Sanginga, N. Mineral Nutrient Uptake and Removal By Cowpea, Soybean and Maize Cultivars in West Africa, and Implications for Carbon Cycle Effects on Soil Acidification. Exp. Agric. 2006, 42, 475–494. [Google Scholar] [CrossRef]
  52. Poss, R.; Saragoni, H. Leaching of nitrate, calcium and magnesium under maize cultivation on an oxisol in Togo. Nutr. Cycl. Agroecosyst. 1992, 33, 123–133. [Google Scholar] [CrossRef]
  53. Oikeh, S.O.; Chude, V.O.; Carsky, R.J.; Weber, G.K.; Horst, W.J. Legume Rotation in The Moist Tropical Savanna: Managing Soil Nitrogen Dynamics and Cereal Yields in Farmers’ Fields. Exp. Agric. 1998, 34, 73–83. [Google Scholar] [CrossRef]
  54. Kunhikrishnan, A.; Thangarajan, R.; Bolan, N.S.; Xu, Y.; Mandal, S.; Gleeson, D.B.; Seshadri, B.; Zaman, M.; Barton, L.; Tang, C.; et al. Chapter One—Functional Relationships of Soil Acidification, Liming, and Greenhouse Gas Flux. In Advances in Agronomy; Sparks, D.L., Ed.; Elsevier: Amsterdam, The Netherlands, 2016; Volume 139, pp. 1–71. [Google Scholar]
  55. Rowell, D.L.; Wild, A. Causes of soil acidification: A summary. Soil Use Manag. 1985, 1, 32–33. [Google Scholar] [CrossRef]
  56. Hao, T.; Zhu, Q.; Zeng, M.; Shen, J.; Shi, X.; Liu, X.; Zhang, F.; de Vries, W. Impacts of nitrogen fertilizer type and application rate on soil acidification rate under a wheat-maize double cropping system. J. Environ. Manag. 2020, 270, 110888. [Google Scholar] [CrossRef]
  57. Zhou, T.; Geng, Y.; Chen, J.; Pan, J.; Haase, D.; Lausch, A. High-resolution digital mapping of soil organic carbon and soil total nitrogen using DEM derivatives, Sentinel-1 and Sentinel-2 data based on machine learning algorithms. Sci. Total Environ. 2020, 729, 138244. [Google Scholar] [CrossRef]
  58. Hengl, T.; De Jesus, J.M.; Heuvelink, G.B.M.; Gonzalez, M.R.; Kilibarda, M.; Blagotić, A.; Shangguan, W.; Wright, M.N.; Geng, X.; Bauer-Marschallinger, B.; et al. SoilGrids250m: Global gridded soil information based on machine learning. PLoS ONE 2017, 12, e0169748. [Google Scholar] [CrossRef] [Green Version]
  59. Hounkpatin, O.K.; de Hipt, F.O.; Bossa, A.Y.; Welp, G.; Amelung, W. Soil organic carbon stocks and their determining factors in the Dano catchment (Southwest Burkina Faso). Catena 2018, 166, 298–309. [Google Scholar] [CrossRef]
  60. Mponela, P.; Snapp, S.; Villamor, G.B.; Tamene, L.; Le, Q.B.; Borgemeister, C. Digital soil mapping of nitrogen, phosphorus, potassium, organic carbon and their crop response thresholds in smallholder managed escarpments of Malawi. Appl. Geogr. 2020, 124, 102299. [Google Scholar] [CrossRef]
  61. Heuvelink, G.B.M.; Angelini, M.E.; Poggio, L.; Bai, Z.; Batjes, N.H.; Van den Bosch, R.; Bossio, D.; Estella, S.; Lehmann, J.; Olmedo, G.F.; et al. Machine learning in space and time for modelling soil organic carbon change. Eur. J. Soil Sci. 2020, 72, 1607–1623. [Google Scholar] [CrossRef]
  62. Raza, S.; Zamanian, K.; Ullah, S.; Kuzyakov, Y.; Virto, I.; Zhou, J. Inorganic carbon losses by soil acidification jeopardize global efforts on carbon sequestration and climate change mitigation. J. Clean. Prod. 2021, 315, 128036. [Google Scholar] [CrossRef]
  63. Rengel, Z.; Tang, C.; Raphael, C.; Bowden, J.W. Understanding subsoil acidification: Effect of nitrogen transformation and nitrate leaching. Soil Res. 2000, 38, 837–849. [Google Scholar] [CrossRef]
  64. Adams, F.; Pearson, R.W. Neutralizing Soil Acidity under Bermudagrass Sod. Soil Sci. Soc. Am. J. 1969, 33, 737–742. [Google Scholar] [CrossRef]
  65. Noble, A.D.; Bramley, R.G.V.; Wood, A.W.; Hurney, A.P. Sugarcane and Soil Acidity—Why We Should Be Worried? In Proceedings of the ASSCT—Australian Society of Sugar Cane Technologists, Cairns, QL, Australia, 29 April–2 May 1997. [Google Scholar]
  66. Wang, N.; Xu, R.-K.; Li, J.-Y. Amelioration of an acid ultisol by agricultural by-products. Land Degrad. Dev. 2010, 22, 513–518. [Google Scholar] [CrossRef]
  67. Kochian, L.V.; Piñeros, M.A.; Liu, J.; Magalhaes, J.V. Plant Adaptation to Acid Soils: The Molecular Basis for Crop Aluminum Resistance. Annu. Rev. Plant Biol. 2015, 66, 571–598. [Google Scholar] [CrossRef]
  68. Tang, C.; Diatloff, E.; Rengel, Z.; McGann, B. Growth response to subsurface soil acidity of wheat genotypes differing in aluminium tolerance. Plant Soil 2001, 236, 1–10. [Google Scholar] [CrossRef]
  69. Sánchez, P.A.; Salinas, J.G. Low-Input Technology for Managing Oxisols and Ultisols in Tropical America. In Advances in Agronomy; Elsevier: Amsterdam, The Netherlands, 1981; Volume 34, pp. 279–406. [Google Scholar] [CrossRef]
  70. Ghorbani, M.; Amirahmadi, E.; Zamanian, K. In-situ biochar production associated with paddies: Direct involvement of farmers in greenhouse gases reduction policies besides increasing nutrients availability and rice production. Land Degrad. Dev. 2021, 32, 3893–3904. [Google Scholar] [CrossRef]
  71. Shi, R.-Y.; Ni, N.; Nkoh, J.N.; Li, J.-Y.; Xu, R.-K.; Qian, W. Beneficial dual role of biochars in inhibiting soil acidification resulting from nitrification. Chemosphere 2019, 234, 43–51. [Google Scholar] [CrossRef]
  72. Hengl, T.; Heuvelink, G.B.M.; Kempen, B.; Leenaars, J.G.B.; Walsh, M.G.; Shepherd, K.D.; Sila, A.; MacMillan, R.A.; De Jesus, J.M.; Tamene, L.; et al. Mapping Soil Properties of Africa at 250 m Resolution: Random Forests Significantly Improve Current Predictions. PLoS ONE 2015, 10, e0125814. [Google Scholar] [CrossRef]
  73. Zomer, R.J.; Xu, J.; Trabucco, A. Version 3 of the Global Aridity Index and Potential Evapotranspiration Database. Sci. Data 2022, 9, 409. [Google Scholar] [CrossRef]
  74. Hartmann, J.; Moosdorf, N. Global Lithological Map Database v1.0 (Gridded to 0.5° Spatial Resolution). PANGAEA 2012. [Google Scholar] [CrossRef]
  75. Nguyen, P.; Shearer, E.J.; Tran, H.; Ombadi, M.; Hayatbini, N.; Palacios, T.; Huynh, P.; Braithwaite, D.; Updegraff, G.; Hsu, K.; et al. The CHRS Data Portal, an Easily Accessible Public Repository for PERSIANN Global Satellite Precipitation Data. Sci. Data 2019, 6, 180296. [Google Scholar] [CrossRef] [Green Version]
  76. Bouwman, A.F. Direct Emission of Nitrous Oxide from Agricultural Soils. Nutr. Cycl. Agroecosystems 1996, 46, 53–70. [Google Scholar] [CrossRef]
  77. Galloway, J.N.; Dentener, F.J.; Capone, D.G.; Boyer, E.W.; Howarth, R.W.; Seitzinger, S.P.; Asner, G.P.; Cleveland, C.C.; Green, P.A.; Holland, E.; et al. Nitrogen Cycles: Past, Present, and Future. Biogeochemistry 2004, 70, 153–226. [Google Scholar] [CrossRef]
Figure 1. Distribution of OFRA field trials in land and use and cover of Sub-Saharan Africa (a), Climate zones of selected 16 countries under optimized fertilizer recommendation rate in Africa (OFRA) (b), Af: Tropical rainforest, Am: Tropical monsoon, Aw: Tropical Savannah, BSh: Arid Steppe Hot, BSk: Arid steppe cold, BWh: Arid desert hot, BWk: Arid desert cold, Cfa: Temperate hot summer without dry season, Cfb: Temperate warmer summer without dry season, Csa: Temperate dry summer and hot summer, Csb: Temperate dry summer and warm summer, Cwa: Temperate warm and hot summer, Cwb: Temperate warm summer [28]. Land use and land cover was extracted from the European Space Agency (ESA) WorldCover 10 m 2020 product [30]. OFRA refers to optimizing fertilizer recommendations in Africa.
Agronomy 13 00632 g001
Figure 2. Variation of soil acidification (H+) in different cropping systems (a) and soil H+ production and absorption by net basic cation loss and net anion accumulation (b) in different cropping systems.
Agronomy 13 00632 g002
Figure 3. Covariates selection and covariates importance: Figure (a) represents root mean square error (RMSE) for different numbers of covariates included in the ensemble machine learning models for soil pH and soil acidification rate as determined by recursive feature elimination. A green coloured circle and blue coloured circle represent the optimal number of covariates for soil acidification rate (32 covariates) and soil pH (22 covariates), respectively. Figures (b,c) represent the relative importance of selected environmental covariates (in figure (a)) for soil acidification rate and soil pH predictions, respectively. %IncMSE stands for the increase in mean standard errors. (Abbreviations in Figures (b,c) see environmental covariates list in Table S4). BC is basic cations, BIO4 is temperature seasonality, BIO16 is precipitation of wettest quarter, BIO12 is mean annual precipitation, CEC is cation exchange capacity, TWI is topographic wetness index, ExA is exchangeable acidity, BIO13 is precipitation of the wettest month, NPK is the summation of NPK fertilizer, ETo is crop evapotranspiration, BD is soil bulk density, BIO2 is mean diurnal range, BIO11 is mean temperature of the coldest quarter, BIO 18 is precipitation of the warmest quarter, SOC is soil organic carbon, BIO7 is annual temperature range, Lith is the parent material, BIO1 is the mean annual temperature, BIO3 is Isothermality, BIO14 is precipitation of driest month, and BIO9 is the mean temperature of the driest quarter.
Agronomy 13 00632 g003
Figure 4. Model performance evaluation of soil pH and soil acidification: soil pH model performance (a) and soil acidification model performance (b), RMSE: root mean squared errors, MAE: mean absolute errors, R2: coefficient of determination and n: number of field trials, the red line is the prediction line and the black line is the 1:1 line.
Agronomy 13 00632 g004
Figure 5. Spatial prediction of soil pH and soil acidification: upper, median, and upper soil pH (left side) and lower, median, and upper soil acidification (keq H+ha−1yr−1) (right side).
Agronomy 13 00632 g005
Figure 6. Uncertainties assessment of predicted soil pH and soil acidification: prediction soil pH (a), standard deviation map of soil pH (pH unit) (b), soil acidification map (c) and standard deviation map of soil acidification (keq H+ ha−1 yr−1) (d).
Agronomy 13 00632 g006
Figure 7. Relationships of soil acidification (H+) and its drivers: relationship of total H+ with urea application rate (a), with diammonium phosphate application rate (b), with crop yield (c),with N transformation (N deposition, N hydrolysis, nitrification, and N leaching) (d), with basic cation removal (basic cation minus anion crop uptake) (e), with bicarbonate leaching (f), with net basic cation loss (g), with net anion accumulation (h), with mean annual precipitation (MAP) (i). The pink area refers to the 95% confidence interval around the regression line and n is the number of observations.
Agronomy 13 00632 g007
Table 1. Soil properties and crop water requirement.
Parameters (n = 5783)MeanStdMinMax
pH6.020.544.908.00
Exchangeable acidity (Al3+ + H+) (cmol kg−1)1.121.410.007.21
Exchangeable base (cmol kg−1)13.448.792.0051.00
Cation exchange capacity CEC (cmol kg−1)19.3112.023.0065.00
Bulk density (kg m3)1289.93150.15895.001720.00
Clay (%)29.7212.474.0061.00
Sand (%)47.1516.6717.0087.00
Silt (%)23.147.237.0042.00
Soil organic carbon (%)2.191.460.2010.70
Calcium carbonate (cmol kg−1)3.545.900.0046.67
Mean annual precipitation (mm yr−1)1093.02359.24331.002202.00
Crop evapotranspiration (mm yr−1)158.8138.1878.67255.75
Min: minimum, Max: maximum, Std: standard deviation, %: percentage, n = number of field trials in OFRA.
Table 2. Descriptive statistics of mineral fertilizer use, manure, nutrient deposition, and crop yield of different cropping systems in Sub-Saharan cropland.
Cropping SystemsUrea
(kg ha−1yr−1)
DAP
(kg ha−1yr−1)
KCl
(kg ha−1yr−1)
Manure
(kg ha−1yr−1)
BC Dep
(kg ha−1yr−1)
N Dep
(kg ha−1yr−1)
S Dep
(kg ha−1yr−1)
N Fix
(kg ha−1yr−1)
Yield
(Mg ha−1yr−1)
MeanStdMeanStdMeanStdMeanStdMeanStdMeanStdMeanStdMeanStdMeanStd
Banana40.004.5016.002.5039.002.40228.3020.5019.802.585.030.6610.681.395.000.0020.8217.69
Barley40.311.9119.870.800.000.00172.0320.4617.796.144.521.569.593.315.000.002.821.42
Beans35.6233.6816.204.7211.2712.89272.1573.3022.316.665.671.6912.033.595.000.001.350.93
Cassava45.7213.9118.9411.2828.569.02170.1274.0122.544.335.731.1012.162.335.000.0029.1415.04
Groundnut4.2217.5711.478.4510.088.78146.4987.2616.565.274.211.348.932.8480.000.001.070.58
Maize68.7921.5216.0311.9314.8613.13240.78161.5321.225.535.391.4111.442.985.000.003.821.92
Millet17.5124.226.846.350.000.00127.2296.2914.998.333.812.128.094.495.000.001.420.91
Peas10.6619.865.377.6110.148.68143.78176.4013.415.193.411.327.232.805.000.000.980.93
Potato, Irish68.2933.0626.9714.5432.8614.86336.4472.6822.855.005.811.2712.322.705.000.0017.0610.21
Rice80.9022.8320.669.5612.8817.31226.72108.8319.295.114.901.3010.402.7625.000.004.151.56
Sorghum40.1116.6514.617.896.867.45170.8385.0817.255.984.391.529.303.235.000.002.231.41
Soybean6.8113.7513.825.502.684.28232.58183.2721.564.755.481.2111.632.5674.7819.131.310.76
Teff61.000.0028.000.000.000.00164.6950.0015.534.703.951.198.382.535.000.001.421.09
Wheat65.7923.2315.082.872.875.12242.8699.2219.145.024.871.2810.322.715.000.002.871.54
Mean SSA46.6218.3316.426.7112.297.42205.3593.4918.875.334.801.3510.182.8716.771.376.464.00
DAP: Diammonium phosphate, KCl: Potassium Chloride, BC dep: Sum of basic cation deposition (Ca2+, Mg2+, K+), N dep: Wet nitrogen deposition.
Table 3. Descriptive statistics of annual proton (H+) production rates for the main cropping systems in Sub-Saharan Africa.
Different Sources and Neutralizing Processes of Protons (keq H+ ha−1 yr−1) in Different Cropping Systems in SSA
Cropping SystemsnN TransBC InputsAnions InputsHCO3leBC UptakeAnions UptakeBCleNleANCAnANCCatTotal H+Soil ANC
MeanStDMeanStDMeanStDMeanStDMeanStDMeanStDMeanStDMeanStDMeanStDMeanStDMeanStDMeanStD
Banana272.940.081.460.040.110.010.030.017.246.150.330.280.870.650.050.05−0.220.156.652.289.880.056.430.11
Barley783.160.120.430.10.050.020.390.380.20.10.20.121.850.320.10.01−0.150.071.620.173.550.251.470.05
Beans5092.370.560.820.380.080.020.120.290.690.410.240.141.490.340.090.02−0.160.081.360.382.940.431.20.06
Cassava725.581.481.20.330.10.020.080.047.633.941.310.681.60.860.10.06−1.210.358.031.7112.00.766.820.25
Groundnuts2476.910.550.650.320.060.030.070.040.490.270.170.093.550.280.240.02−0.110.063.390.297.30.33.280.05
Maize21204.071.140.960.440.080.030.110.241.110.620.560.322.010.550.130.04−0.480.182.160.544.730.691.680.13
Millet5201.431.190.380.370.040.020.040.030.550.420.190.150.80.60.050.04−0.150.090.970.461.830.610.820.07
Pea2151.310.830.970.550.060.020.110.210.580.460.20.160.930.570.050.04−0.140.090.540.531.800.520.40.07
Potato, I2144.991.271.560.280.120.020.060.094.632.780.790.481.930.420.130.03−0.670.255.031.168.890.684.330.18
Potato, S281.410.220.680.070.060.010.020.023.20.990.550.170.810.290.050.02−0.490.093.330.454.080.122.840.07
Rice4046.081.140.940.620.070.030.060.061.280.480.650.242.630.490.180.03−0.580.142.970.536.770.62.390.1
Sorghum5102.850.820.730.450.060.020.210.431.010.640.350.221.570.610.090.03−0.290.121.850.573.720.631.560.09
Soybean2277.350.70.630.220.070.010.060.050.610.350.210.123.860.380.260.03−0.140.073.840.327.810.383.70.05
Sunflower171.450.10.610.190.050.020.070.050.310.190.110.070.860.130.050−0.060.050.560.171.720.080.50.03
Teff1714.270.090.390.070.040.010.540.340.440.340.220.172.430.330.130.01−0.180.092.480.255.030.222.30.06
Wheat4233.790.780.590.240.060.020.270.380.880.470.450.242.080.50.120.02−0.390.132.370.44.490.581.980.09
Mean57823.700.690.810.290.070.020.140.171.931.160.410.231.830.460.110.03−0.340.133.760.645.410.432.50.09
N trans: nitrogen transformation processes (Urea hydrolysis, DAP nitrification, N deposition and N leaching), inputs: addition from chemical fertilizers, manure and atmospheric deposition, uptake: concertation in crop yield and residues, le: leaching, BC: basic cations (Ca2+, Mg2+, K+), Anions: Cl, SO42−, PO42−) and N: nitrogen, ANCAn: Anion accumulations, ANCCat: net basic cation loss, Soil ANC: the change in total soil acid neutralizing capacity.
Disclaimer/Publisher’s Note: The statements, opinions and data contained in all publications are solely those of the individual author(s) and contributor(s) and not of MDPI and/or the editor(s). MDPI and/or the editor(s) disclaim responsibility for any injury to people or property resulting from any ideas, methods, instructions or products referred to in the content.

