Article

Use of Multivariate Analysis in Screening for Drought Tolerance in Ornamental Asteraceae Species

1
Department of Forestry, University of Agricultural Sciences and Veterinary Medicine Cluj-Napoca, 3–5 Manastur Street, 400372 Cluj-Napoca, Romania
2
Institute for the Conservation and Improvement of Valencian Agrodiversity (COMAV), Universitat Politècnica de València, Camino de Vera s/n, 46022 Valencia, Spain
3
CREA—Council for Agricultural Research and Economics, Research Centre for Agriculture and Environment, I-40128 Bologna, I-00184 Rome, Italy
4
Department of Botany, Miranda House, University of Delhi, Delhi 110007, India
5
Department of Horticulture and Landscape, University of Agricultural Sciences and Veterinary Medicine Cluj-Napoca, 3–5 Manastur Street, 400372 Cluj-Napoca, Romania
6
Mediterranean Agroforestry Institute (IAM), Universitat Politècnica de València, Camino de Vera s/n, 46022 Valencia, Spain
*
Authors to whom correspondence should be addressed.
Agronomy 2023, 13(3), 687; https://doi.org/10.3390/agronomy13030687
Submission received: 31 January 2023 / Revised: 23 February 2023 / Accepted: 24 February 2023 / Published: 26 February 2023

Abstract

:
Asteraceae is one of the families with a large number of ornamental plants. Climate change imposes the need to select species that are more tolerant to changing environmental conditions, especially drought. In this study, we compared the performance under water stress of six species belonging to different tribes of Asteraceae with different geographical origins. Young plants obtained after seed germination were subjected to intermediate water stress (irrigation with half the water amount used in control treatments) and severe water stress (no irrigation at all) for one month. Growth variables and biochemical stress markers were determined to assess the effects on the plants of the stress treatments. Multivariate analysis tools were used to rank species according to their tolerance. Three species were relatively more susceptible to water stress, Callistephus chinensis, Xerochrysum bracteatum, and Calendula officinalis, whereas Leucanthemum vulgare, Glebionis carinata, and Ageratum houstonianum were more tolerant. Our study indicated that the last two species, which are registered as invasive in some geographic areas, possess a larger phenotypic plasticity. Principal component analysis (PCA) combined with canonical variation analysis (CVA) proved optimal statistical methods for analysing species of diverse origins and belonging to different genera of a large family, such as the Asteraceae.

1. Introduction

Asteraceae (formerly Compositae) represent one the most diverse families of flowering plants, including an estimated number of 25,000–35,000 species, which represents ~10% of the angiosperms. The family has a cosmopolitan distribution, with species on all continents, including Antarctica [1], adapted to nearly all types of habitats. The highest richness in species is found in prairies, steppes, montane regions, Mediterranean climate areas, and even deserts, but they are rare in tropical wet forests. The family is characterised by a vast diversity of habits, from annual to perennial herbs, shrubs, vines, trees, and epiphytes. The evolutionary success of composites is related to their unique floral and fruit traits, i.e., the capitulum or floral head formed by the compound receptacle, to which numerous florets are tightly attached, and the fruits, which generally present a pappus favouring their dispersal and defence against herbivory [2]. The family has a monophyletic origin, with all species sharing the same basic floral structure, but it is hugely diverse, including species with many differences in the size of their floral structures, degree of petal fusion, symmetry, and colour [2,3]. This enormous diversity, along with its habits and ecological adaptability, makes this family one of the most popular in ornamental horticulture and landscaping [4], besides their economic and medicinal value.
The ornamental plants sector is confronted nowadays with two major issues: first, global warming, which will affect horticultural production worldwide [5], and second, the increased risk of invasion enhanced by climate change [6]. Floriculture was already a source of introduction of alien species [7]. More than half of the alien naturalised floras were introduced as ornamentals [8], and in all areas of the world, most invasive species derived from ornamental horticulture [9]. The success of the naturalisation of exotic plants, a preliminary step to invasion risk, depends largely on the species’ climatic niche. Although the climatic requirements of plants do not generally differ from the native to the introduced range, the climate is currently changing due to global warming. This may favour future invaders that are not yet problematic but could thrive in the new climatic conditions [10].
On the other hand, global warming represents a challenge for adapting ornamental horticulture to the new climatic conditions [11,12], and screening for cultivars that are more drought-tolerant, i.e., demanding a lower water input or being better adapted to extreme weather conditions, is receiving increased interest [13,14]. An essential source for xero-gardening and xero-landscaping is also represented by naturally drought-tolerant native species [15,16].
The present study aimed to compare the responses to two levels of water stress in six ornamental species of Asteraceae with different geographic origins and risks of invasiveness. All species belong to the subfamily Asteroideae Lindley. Two are closely related taxonomically, as they belong to the same tribe, Anthemideae, and were formerly included in the same genus: (i) Glebionis carinata (Schousb.) Tzvelev, also known by its synonyms Ismelia carinata (Schousb.) Sch. Bip and Chrysanthemum carinata (Schousb.), and (ii) Leucanthemum vulgare Lam. (syn. Chrysanthemum leucanthemum L.). G. carinata is an annual species with origin in northern Africa [17], reported only as naturalised but not invasive [18]. It has fast growth and showy capitula, making it very popular for mass planting. L. vulgare is a perennial native to Europe and Central Asia. It is popular as an ornamental and medicinal plant, introduced outside its native range in temperate regions of eastern Asia and North America, but also in warmer climates at higher altitudes. It is catalogued as invasive in the USA, Canada, India, New Zealand, and Australia [18].
Ageratum houstonianum Mill. (syn. A. mexicanum Sweet) belongs to the tribe Eupatorieae and is native to Mexico and Central America [19]. The species became a popular ornamental soon after its discovery, and by the end of the 18th century, it was already reported as a weed in hotbeds in England [18]. It easily spreads by escaping from gardens and is naturalised in North and South America, the Caribbean, Africa, Asia, Europe, and Oceania [18]. Ageratum houstonianum has been included in the list of alien weeds in South Africa [20], is a common weed of sugar cane crops in Queensland, and is also registered as invasive in Hawaii, Cuba, New Zealand, China, and Taiwan [18].
Calendula officinalis L. belongs to the tribe Calenduleae Cass. Although its origin is uncertain, it is considered native to southern Europe, from Spain to France and Italy. It is naturalised on several continents [18] but was only reported as a species with a low risk of invasion from China [21].
Callistephus chinensis Nees belongs to the Astereae tribe and is native to China, Japan, and Korea. The species had been subjected to intensive breeding and selection with the principal objective of producing “double-flowered” plants [22]. Although naturalised on different continents, it is not reported as invasive [23].
Finally, Xerochrysum bracteatum (Vent.) Tzvelev (syn. Helichrysum bracteatum (Vent.) Andrews) belongs to the Gnaphalieae tribe and is native to Australia and Tasmania [24,25], is naturalised outside its native range, but is only rarely reported as invasive [26].
The study of the responses of these species to water stress can provide important information regarding their suitability to different regions by considering the possible alteration of environmental conditions due to climate change, as well as by taking into account the risk of increasing their invasive potential as a result.
Firstly, we propose to classify the species from the most resistant to the least tolerant to drought based on morphological growth parameters and to relate the results to their invasiveness. Secondly, based on biochemical analyses, we intend to understand the fundamental mechanism that confers tolerance and, if possible, to identify an optimal biochemical marker to assess the level of stress suffered by the plants.

2. Materials and Methods

2.1. Plant Material

This study used six ornamental Asteraceae species, some with a high invasive potential [18]. Ageratum houstonianum Mill. (Figure 1a), commonly known as floss flower, blue mink, or blueweed, is an annual or short-lived perennial herb, erect or decumbent, 0.3–1 m high, with ovate to triangular leaves, and blue flowerheads (sometimes white, pinkish, or purple) in dense corymbs [27]. Shorter varieties are excellent as bedding plants, edgers, rock gardens, and container plants. Taller varieties are also used as cut flowers [28].
Calendula officinalis L. (Figure 1b), the pot marigold, is an annual or short-lived perennial species growing up to 80 cm tall, with stems procumbent to erect, occasionally woody at the base. The leaves are simple and oblong-lanceolate, and the inflorescences are yellow [27]. It is grown in bedding displays, borders, or pots, but it is also used as a medicinal and culinary plant for flavouring food.
Callistephus chinensis Nees (Figure 1c), the China aster, is a semi-hard annual reaching 20–80 cm in height, with strongly dentate leaves with capitula in shades of white to pink, red, blue, violet, purple, and yellow. It is used in floral beds, borders, and cottage gardens, or in pots and containers [28].
Glebionis carinata (Schousb.) Tzvelev (Figure 1d), known as painted daisy, is a 10–30 cm high annual plant, with yellowish or reddish ligulate flowers, dark-colored or whitish at the base. It is used for borders, flower beds, containers, and also in fresh-cut arrangements due to its long-lasting flowers [28].
Leucanthemum vulgare Lam. (Figure 1e), commonly known as oxeye daisy or marguerite, is an erect, somewhat weedy, rhizomatous perennial that grows up to 1 m. Its leaves are undivided or have a few lobes, and capitula are formed by white ray floret ligules and numerous yellow disc florets [27]. Due to its long-lasting bloom, it is used in borders, cottage gardens, and wild gardens, or as cut flowers [28].
Xerochrysum bracteatum (Vent.) Tzvelev (Figure 1f), is a short-lived tender perennial or annual, 20–80 cm high, commonly called strawflower or paper daisy. Capitula have a central yellow disk surrounded by glossy, papery, rigid, straw-like bracts in yellow, orange, red, pink, or white. It is popular for rock gardens, for edging or containers, and taller varieties for borders. It is excellent for fresh-cut and dried flowers [28].
The seeds utilised as starting material were provided by a commercial supplier (Vilmorin Seed Generation, Paris, France). The seeds were germinated for ten days in standard Petri dishes (ø = 85 mm) in a growth chamber under controlled conditions of 12 h light/12 h dark at 25 °C. Seedlings were individually placed in 12 cm diameter pots filled with a mixture of commercial peat and perlite (3:1), watered regularly with tap water, and transferred to a greenhouse with natural light, 63% relative humidity, and a temperature range of 19–25 °C.

2.2. Drought Treatments and Growth Parameters

Five weeks after transplanting, when the plantlets were fully developed and the soil moisture was ca. 60%, five pots per species and treatment (five biological replicas) were placed into plastic trays (10 pots per tray) and randomly selected for the following treatments: control (CON—plants watered twice a week with 1.5 L tap water/tray), intermediate water stress (IWS—plants watered twice a week with 0.75 L/tray), and severe water stress (SWS—no irrigation at all).
After four weeks, when the soil moisture of the water-stressed plants had decreased to 5–8%, plants were harvested and processed for further biochemical analysis. The aerial shoot was separated from the underground root, the latter was thoroughly cleaned with a brush, and both roots and shoots were weighed and measured separately.
Morphological parameters such as the number of leaves, root length, shoot length, fresh and dry weight of roots and shoots, and root and shoot water content were determined for all individual plants (n = 5 per species and treatment).
For each plant, part of the aerial material and the entire root were separately weighed (fresh weight, FW), dried for 72 h at 65 °C, and weighed again (DW). The water content was determined as
WC% = [(FW − DW)/FW] × 100
Samples of fresh plant material (0.05–0.1 g) were frozen in liquid N2, stored at −75 °C in properly labelled 2 mL Eppendorf tubes, and used for the biochemical analyses. Samples of dry material were kept in paper bags at room temperature.

2.3. Photosynthetic Pigments

Photosynthetic pigments were extracted from samples of ground fresh shoot material (ca. 0.05 g) with 1 mL of ice-cold 80% acetone (v/v) by mixing in a rocker shaker for 24 h in darkness. The samples were centrifuged at 13,300× g for 10 min at 4 °C. The supernatant was diluted 10-fold with 80% acetone, and the absorbance was measured at 470 nm, 646 nm, and 663 nm. The concentrations of chlorophyll a (Chl a), chlorophyll b (Chl b), and carotenoids (Caro) were calculated according to Lichtenthaler and Wellburn [29] and expressed in mg g−1 DW.

2.4. Quantification of Proline

The quantification of proline (PRO) was carried out according to Bates et al. [30]. Samples of ground fresh shoot material (ca. 0.5 g) were extracted in 0.5 mL of a 3% (w/v) aqueous sulphosalicylic acid solution and mixed with 0.5 mL of acid ninhydrin. The samples were incubated in a water bath for 1 h at 95 °C, cooled on ice for 10 min, and then extracted with 3 mL of toluene. The absorbance of the organic phase was measured at 520 nm, using toluene as the blank. Samples with known PRO concentrations were assayed in parallel to obtain a standard curve. PRO contents were expressed as µmol g−1 DW.

2.5. Determination of MDA and Antioxidant Compounds

For the determination of malondialdehyde (MDA), total flavonoids (TF), and total phenolic compounds (TPC), 0.05–0.10 g of ground fresh shoot material were extracted with 2 mL of 80% methanol, and the samples were centrifuged at 13,300× g at 4 °C for 15 min. The supernatants were transferred to fresh Eppendorf tubes and stored at −20 °C. MDA quantification followed a published procedure [31]; the methanol extracts were mixed with 0.5% thiobarbituric acid (TBA) in 20% trichloroacetic acid (TCA)—or with 20% TCA without TBA for the controls—and then incubated for 15 min at 95 °C in a water bath. The reactions were stopped on ice, and the samples were centrifuged at 13,300× g for 10 min at 4 °C. Finally, the absorbance of the supernatants was measured at 532 nm. After subtracting the non-specific absorbance at 600 and 440 nm, MDA concentrations were calculated by applying the equations described by Hodges et al. [31], based on the molar extinction coefficient of the MDA–TBA adduct at 532 nm (ε532 = 155 mM−1 cm−1).
TF determination was done according to the method published by Zhishen et al. [32], based on the nitration with NaNO2 of aromatic compounds containing a catechol group, followed by reaction with AlCl3 at basic pH. After the reaction, the absorbance of the sample was measured at 510 nm, and TF concentrations were expressed as equivalents of catechin (mg eq. C g−1 DW), used as the standard to obtain a calibration curve.
TPC quantification was performed by reacting the methanolic extracts with the Folin–Ciocalteu reagent in the presence of Na2CO3 [33]. The reaction mixtures were incubated for 90 min at room temperature in the dark, and the absorbance was measured at 765 nm. Gallic acid (GA) was used as the standard, and TPC concentrations were expressed as GA equivalents (mg eq. GA g−1 DW).

2.6. Statistical Analyses

A one-way analysis of variance (ANOVA) was performed to estimate the effects of the stress treatments on the analysed traits for each species. Before the analysis of variance, the normality of data was checked by the Shapiro–Wilk test and the homogeneity of variance using the Levene test. In case that ANOVA assumption failed, we employed an arcsin transformation for percentage values and a log transformation for the remaining values. The post-hoc Tukey HSD test was used to assess the differences if the null hypothesis was rejected, at a p-value of 0.05 (p < 0.05). The ANOVA was performed by using SPSS Statistics statistical software (IBM SPSS Statistics, Chicago, IL, USA).
Three PCAs were executed to explain the maximum amount of variation in the data set under control (PCAcon), intermediate water stress (PCAiws), and severe water stress (PCAsws) conditions and downsize the data redundancy with as little loss of information as possible. The 17 measured traits (FWs, FWr, DWs, DWr, WCs, WCr, TDW, Ln, SL, RL, Chl a, Chl b, Caro, PRO, MDA, TF, TPC) were used as active quantitative variables, whereas the six studied species (A. houstonianum, C. officinalis, C. chinensis, G. carinata, L. vulgare, and X. bracteatum) were set as supplementary categorical variables, i.e., variables that were not involved in the PCs determination. The data from the intermediate and severe water-stressed plants were expressed as variation versus their respective controls, as explained above. The quantitative variables were scaled to unit variance before the analysis to prevent some variables from becoming dominant because of their large measurement units. The correlation matrix of the scaled data was then diagonalised to obtain a set of eigenvectors and eigenvalues, used to identify the principal components of the data. The p-values of the Pearson correlation coefficients between the traits and the first two PCs of each PCA are displayed in Table S1 of the Supplementary Materials. The eigenanalysis is shown in Figure S1 in the Supplementary Materials. As a complement, a canonical variate analysis (CVA) was employed to profile the six species of interest under control (CVAcon), intermediate (CVAiws), and severe water stress (CVAsws), maximising the discrimination between the group means while minimising the variation within the groups.
The 100(1 − α) confidence region for each group was represented by a circle centered at the respective group mean with squared radii equal to the appropriate upper percentage point of the χ2 distribution divided by the number of observations in each group (n), ( χ ^ 2 _ ( α , r ) / n ) , where r is the number of canonical variate dimensions considered. Given a probability level α = 0.05, these confidence circles are the region in the CVA space within which approximately 95% per cent of the samples belonging to a given group are expected to be found.
The 100(1 − α) tolerance regions of the whole population were constructed in the same way as the confidence regions, but since the variability being assessed is due to individuals rather than group means, the radius of the α% tolerance circle is ( χ ^ 2 _ ( α , r ) )   rather than ( χ ^ 2 _ ( α , r ) / n ) . The tolerance region for the population mean is a region in the CV space where the population mean will fall α% of times when a sample is taken from the population and a canonical variation analysis is conducted. The coefficients of linear discriminants of each CVA are shown in Table S2 of the Supplementary Materials.
For both the univariate and multivariate analysis, the data from the intermediate water-stressed and severe water-stressed plants were expressed as percent variation versus their respective controls, except for WCs and WCr, as they are percentage values.
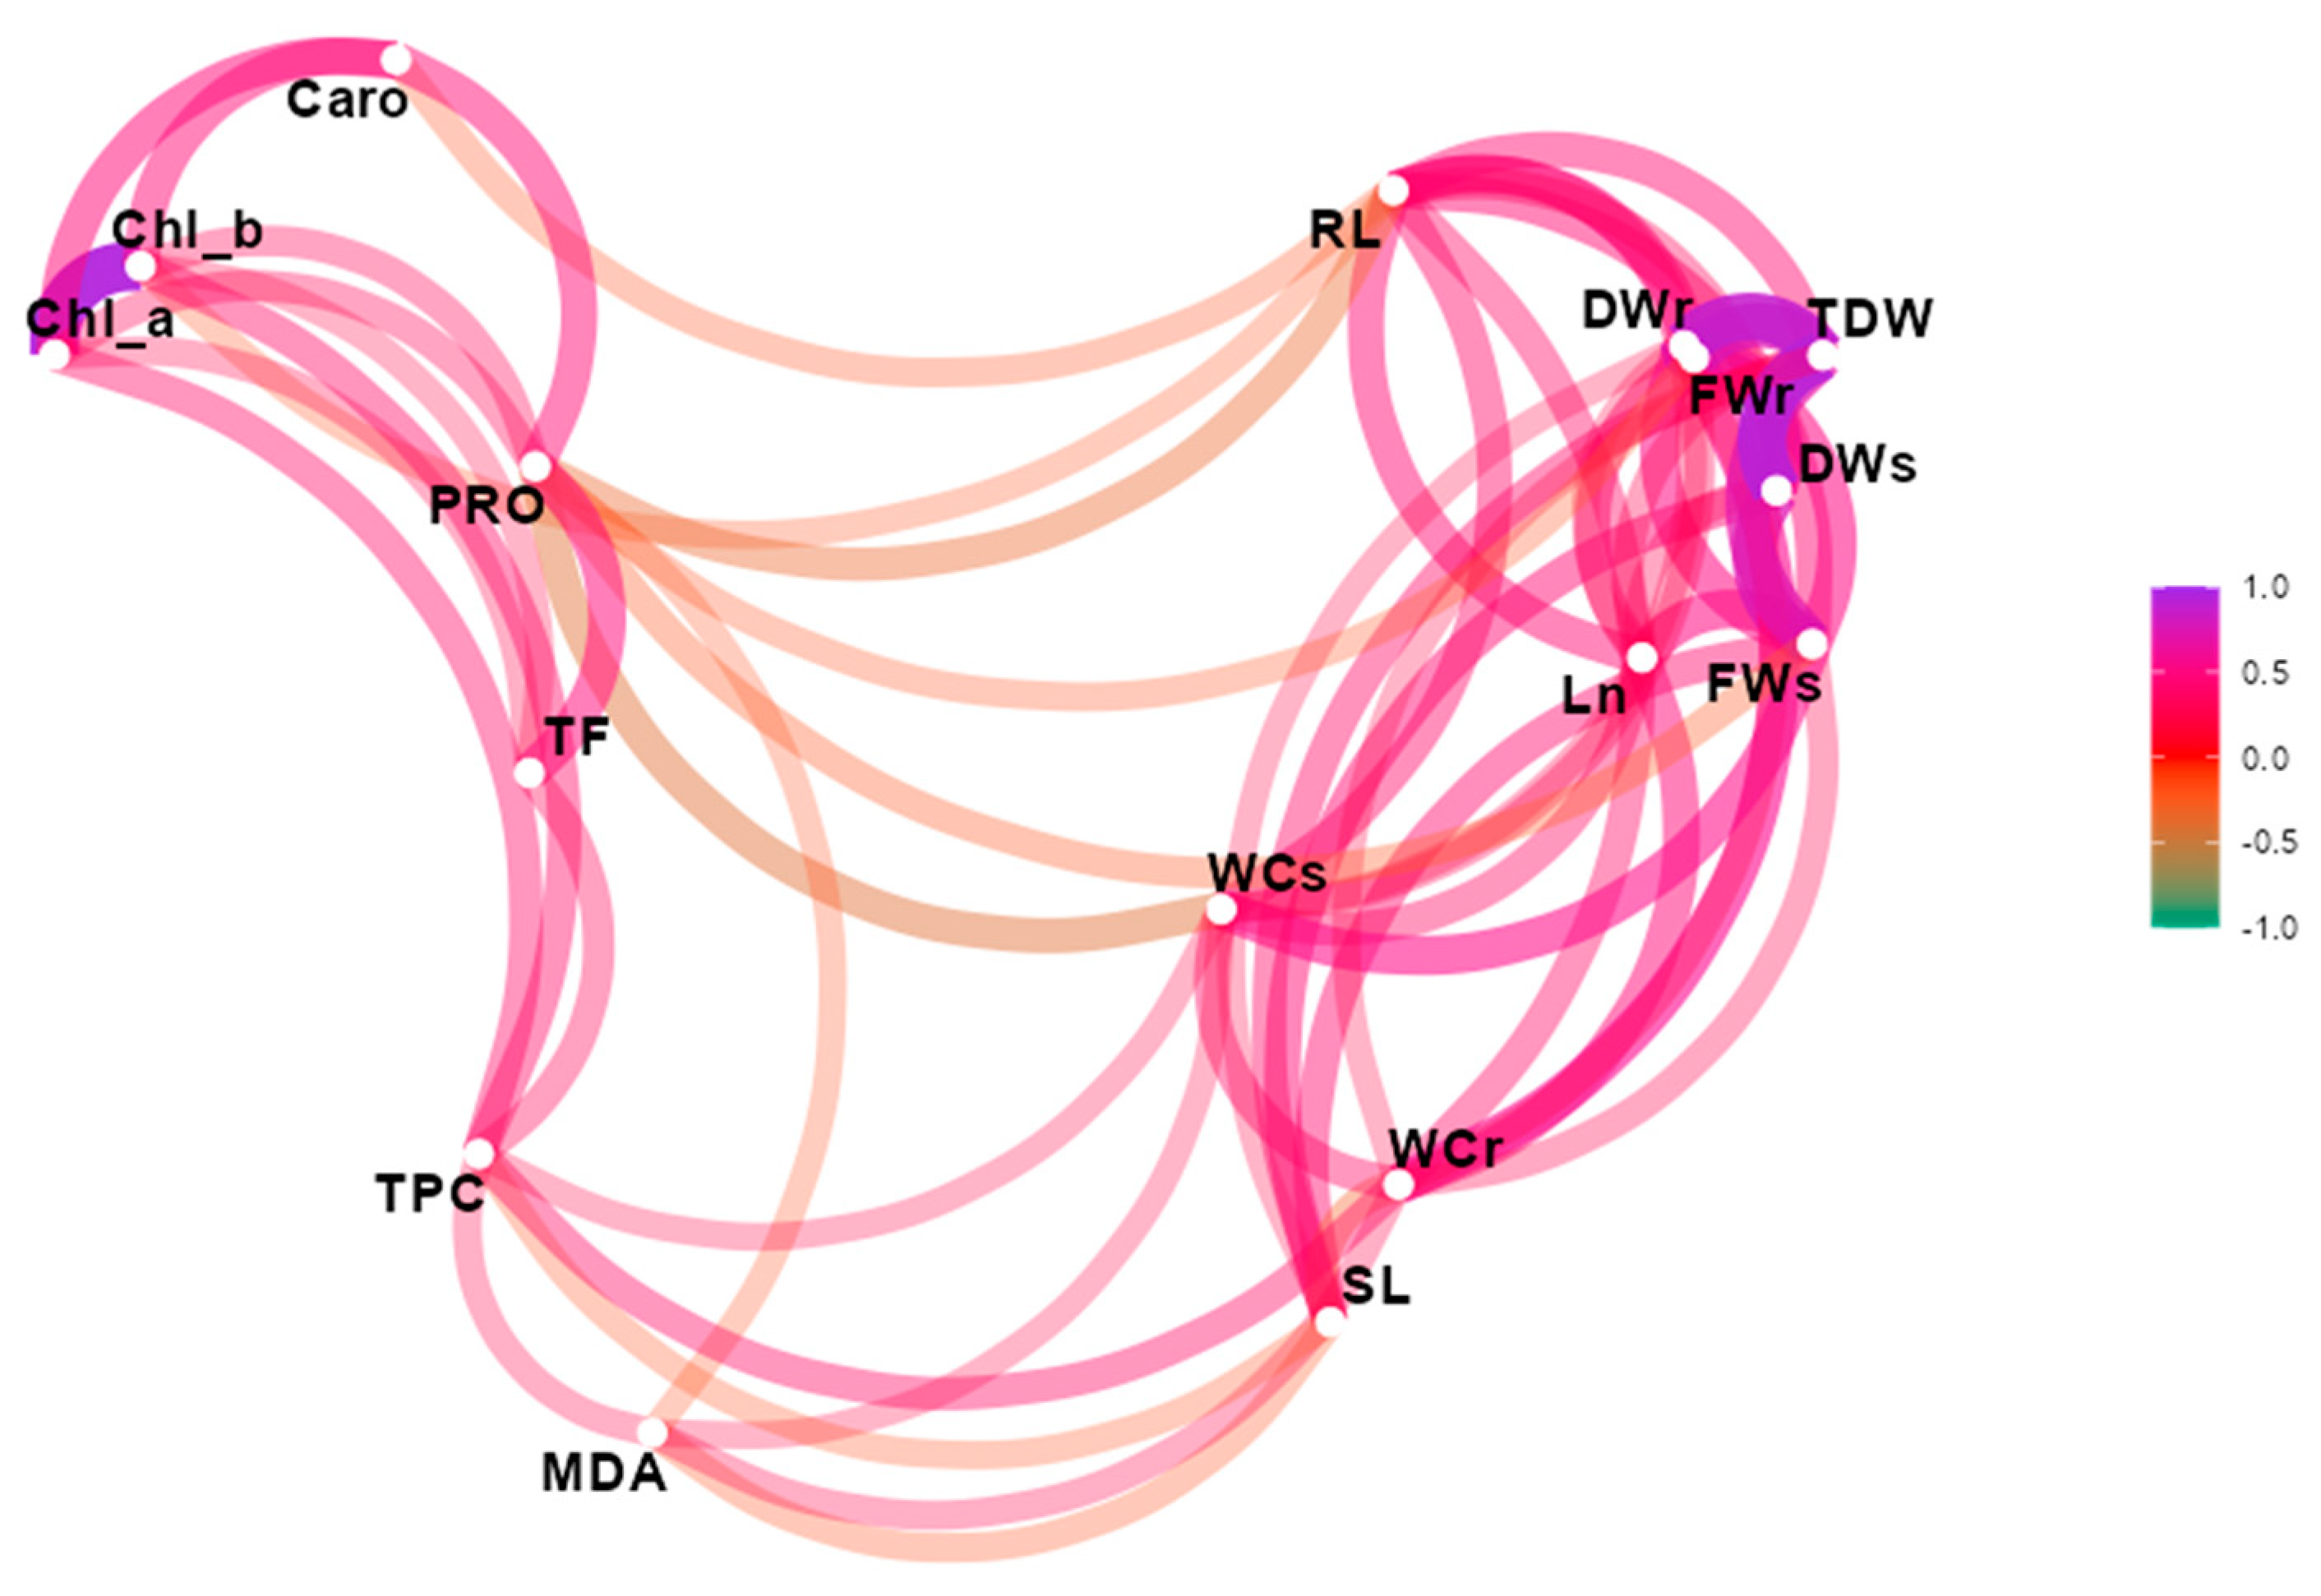
The relationships among the traits under control, intermediate, and severe water stress were assessed through one correlation network analysis, computing the pairwise Pearson’s correlation at α = 0.05. For this last analysis, the data were directly used as they are, and not expressed as a variation relative to the control.
The PCA and CVA analysis were performed with the libraries Stats [34], FactoMineR [35], and MASS [36] of the R 4.2.2 statistical software and were graphically represented using the packages ggplot2 [37] and ggforce [38]. The correlation networks were calculated and drawn using the corrplot [39].

3. Results

3.1. Effect of Water Stress on Growth Parameters

The growth of the six selected species was affected by water stress, but as expected, the most visible effects were those induced by severe water stress (SWS) when plants did not receive any irrigation for one month.
One of the first drought effects is the reduction of plant growth. As there is variation in the morphology of the six species under study, the effects of the water-stress treatments were analysed with transformed values by considering the mean values in the control (Table 1). Even in the absence of stress, in the control treatment, the six species had different growth rates. In terms of shoot length at the end of the experiment, the tallest plants were those of C. officinalis, with a mean shoot length of ca. 25 cm, and the shortest were L. vulgare and X. bracteatum, with 10 and 11 cm, respectively. Root length varied only a little between species, but their fresh weight reached 6 g in A. houstonianum vs. only 1.4 g in C. officinalis. The differences in root weight were not so marked upon drying, as C. officinalis had a very low water content in roots, i.e., less than 40%. More differences were registered in the fresh weight of shoots with more than double weight in C. officinalis (19.4 g) than in A. houstonianum, which had the lowest mean at 8 g. The highest total dry weight was recorded in X. bracteatum due to having the lowest water content in roots and shoots.
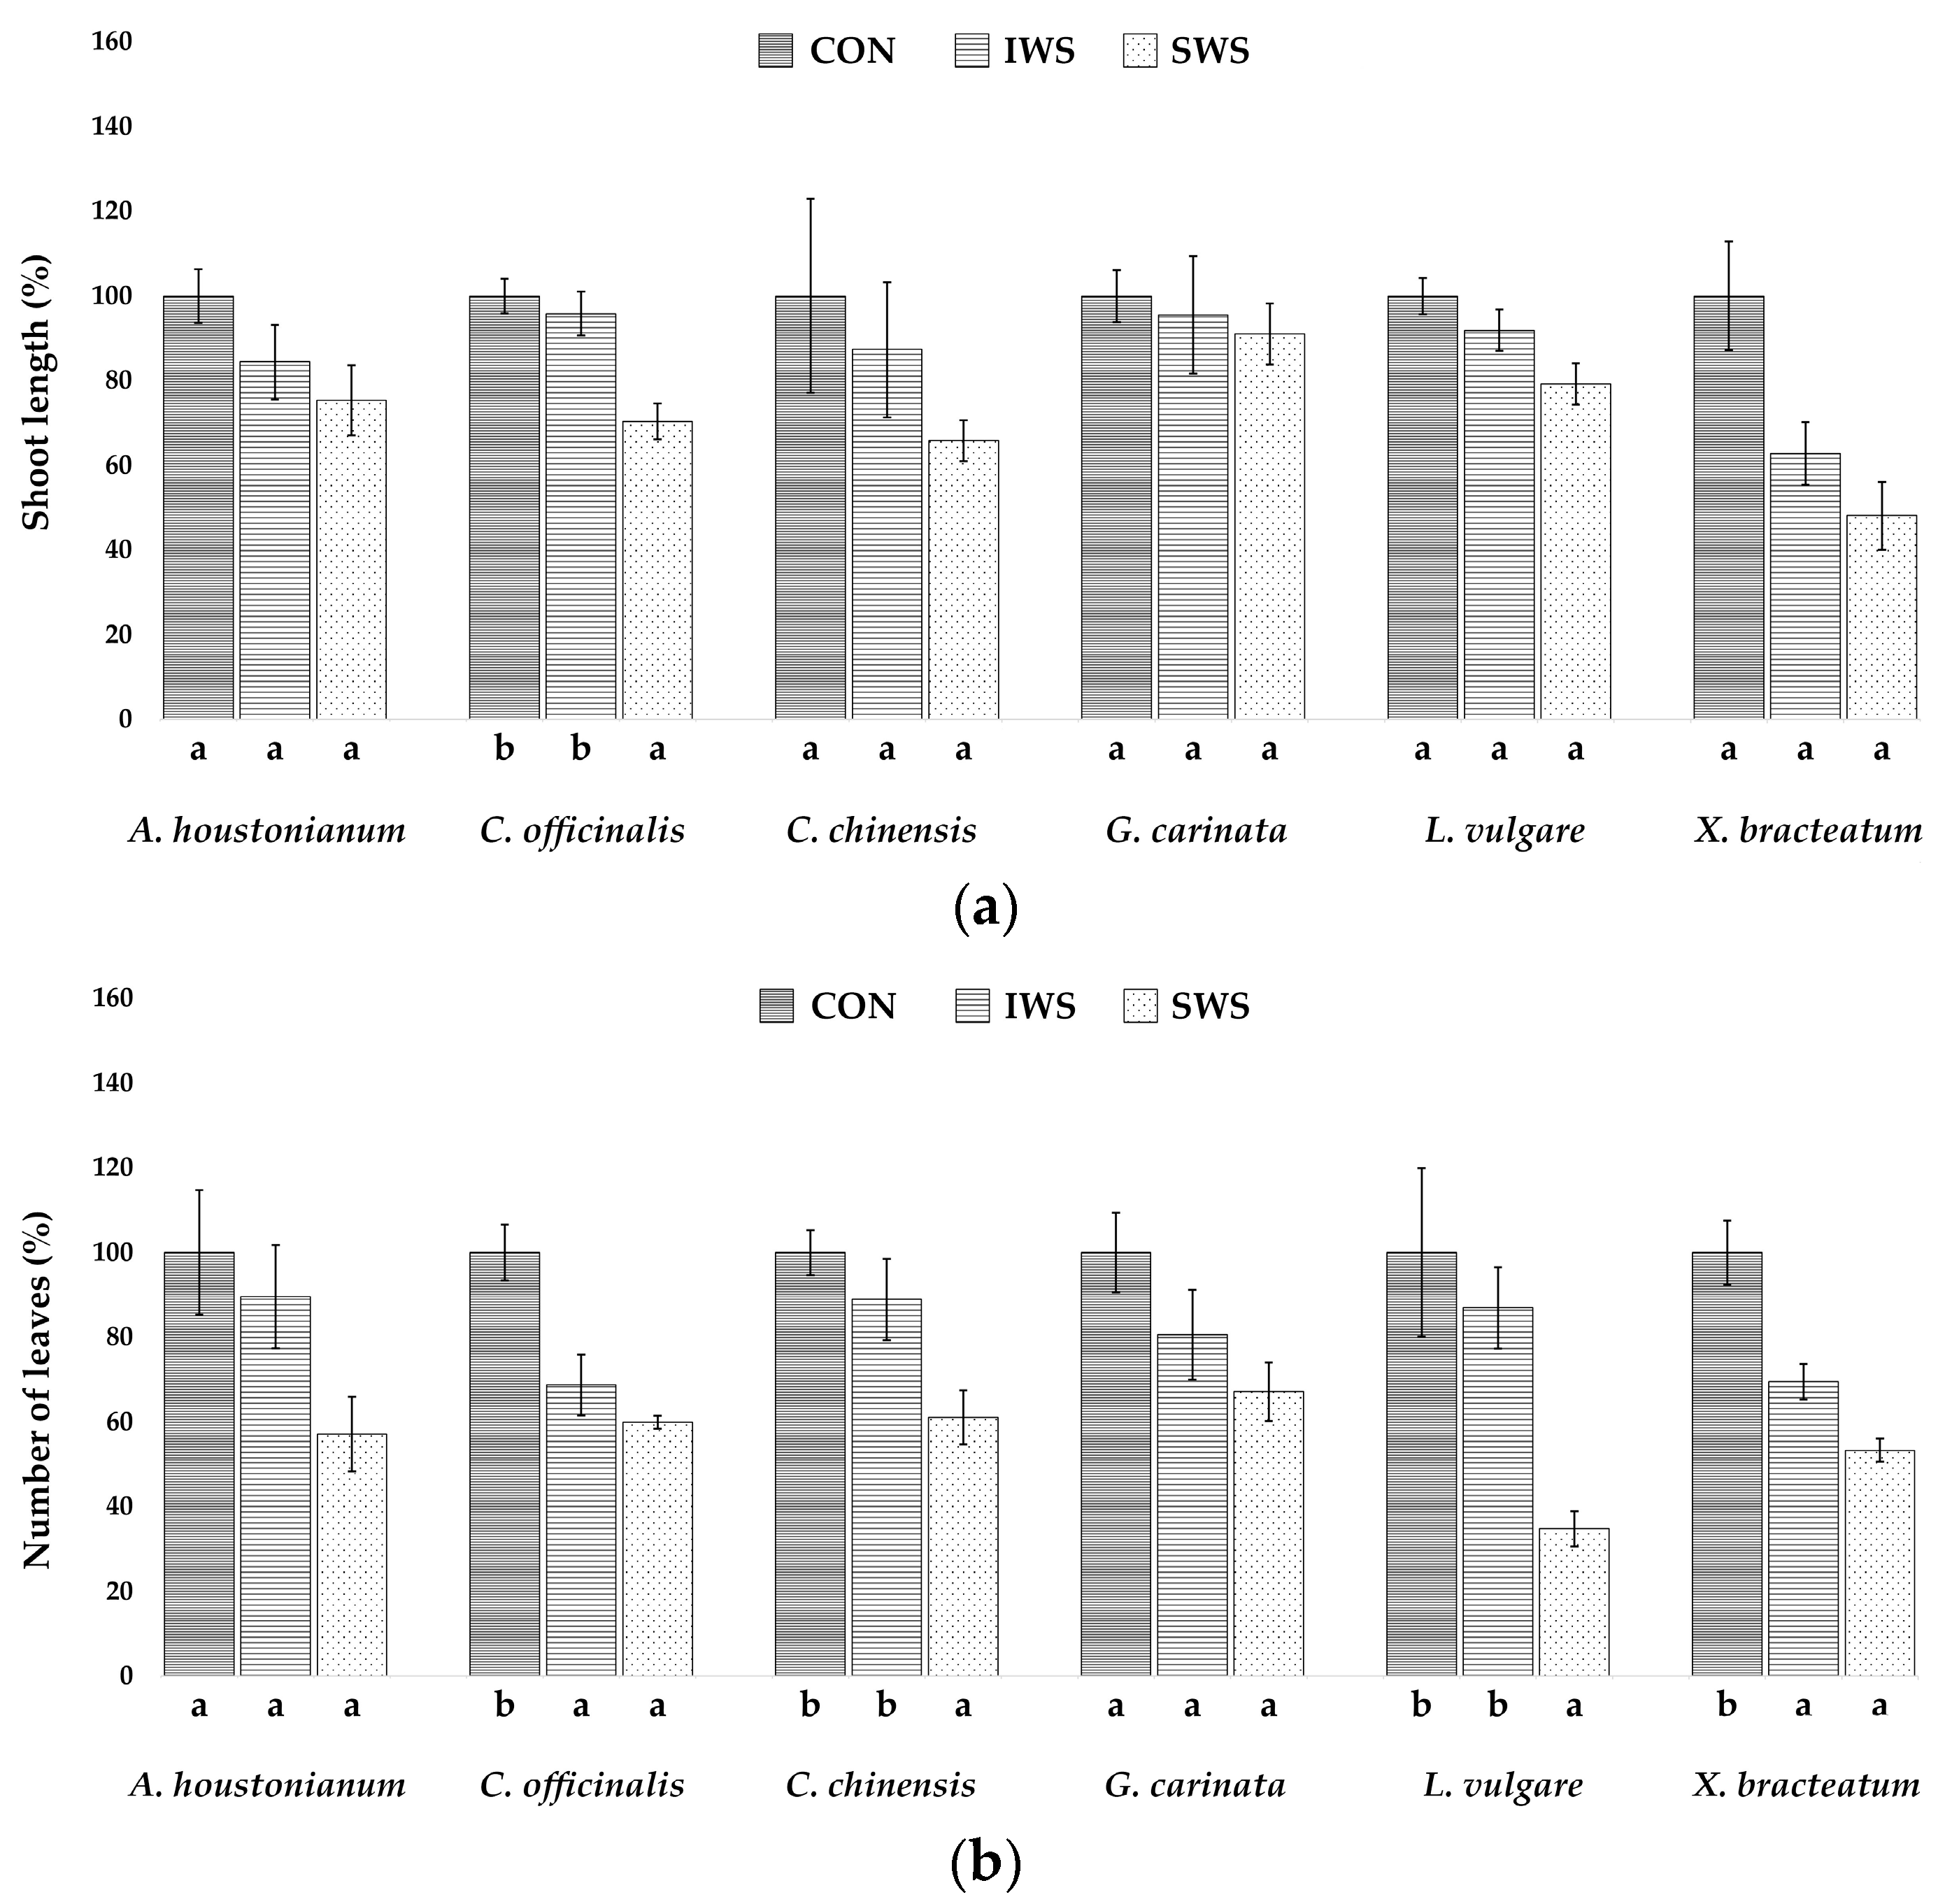
When analysing the effect of the two levels of water stress on the shoot length, only plants of C. officinalis (which had the longest shoots in control) subjected to severe water stress treatment showed a significant reduction (Figure 2a).
The species C. officinalis and X. bracteatum were the most affected in the number of leaves (Figure 2b), with a significant reduction with respect to the control observed already in the intermediate stress treatment. Under severe stress conditions, C. chinensis and L. vulgare plants also suffered a significant loss of leaves, whereas no significant effect was found in A. houstonianum and G. carinata.
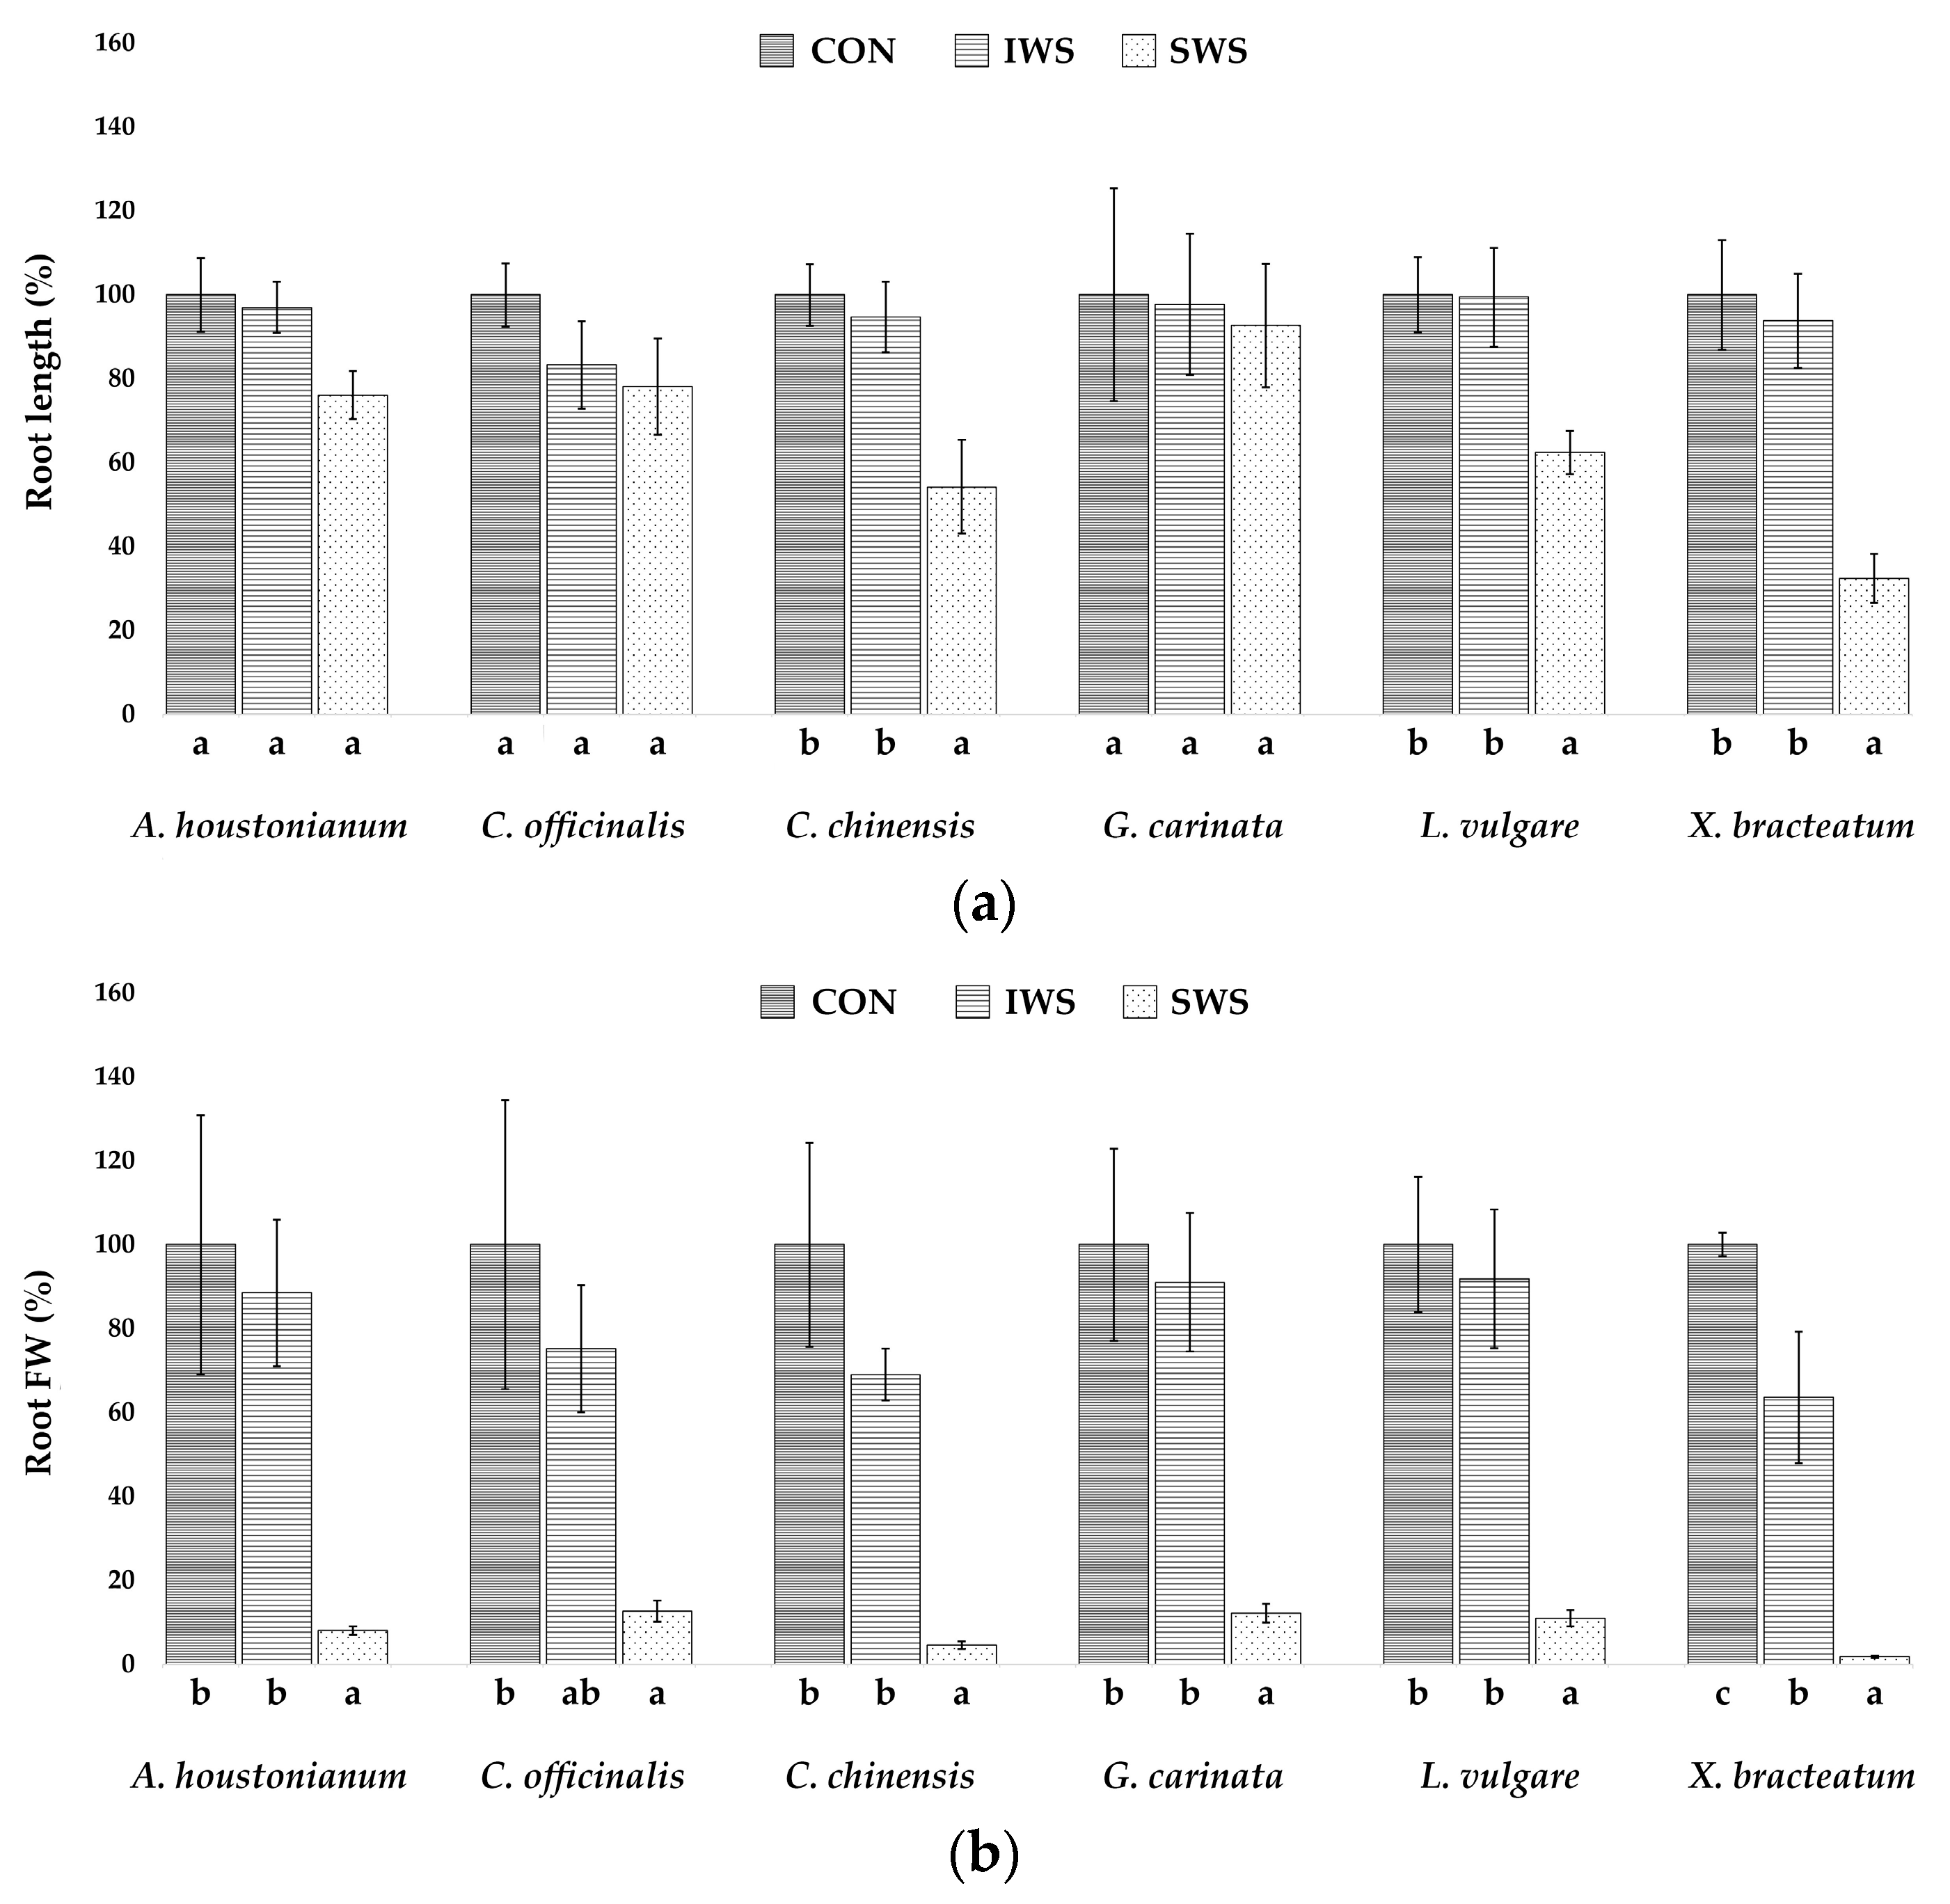
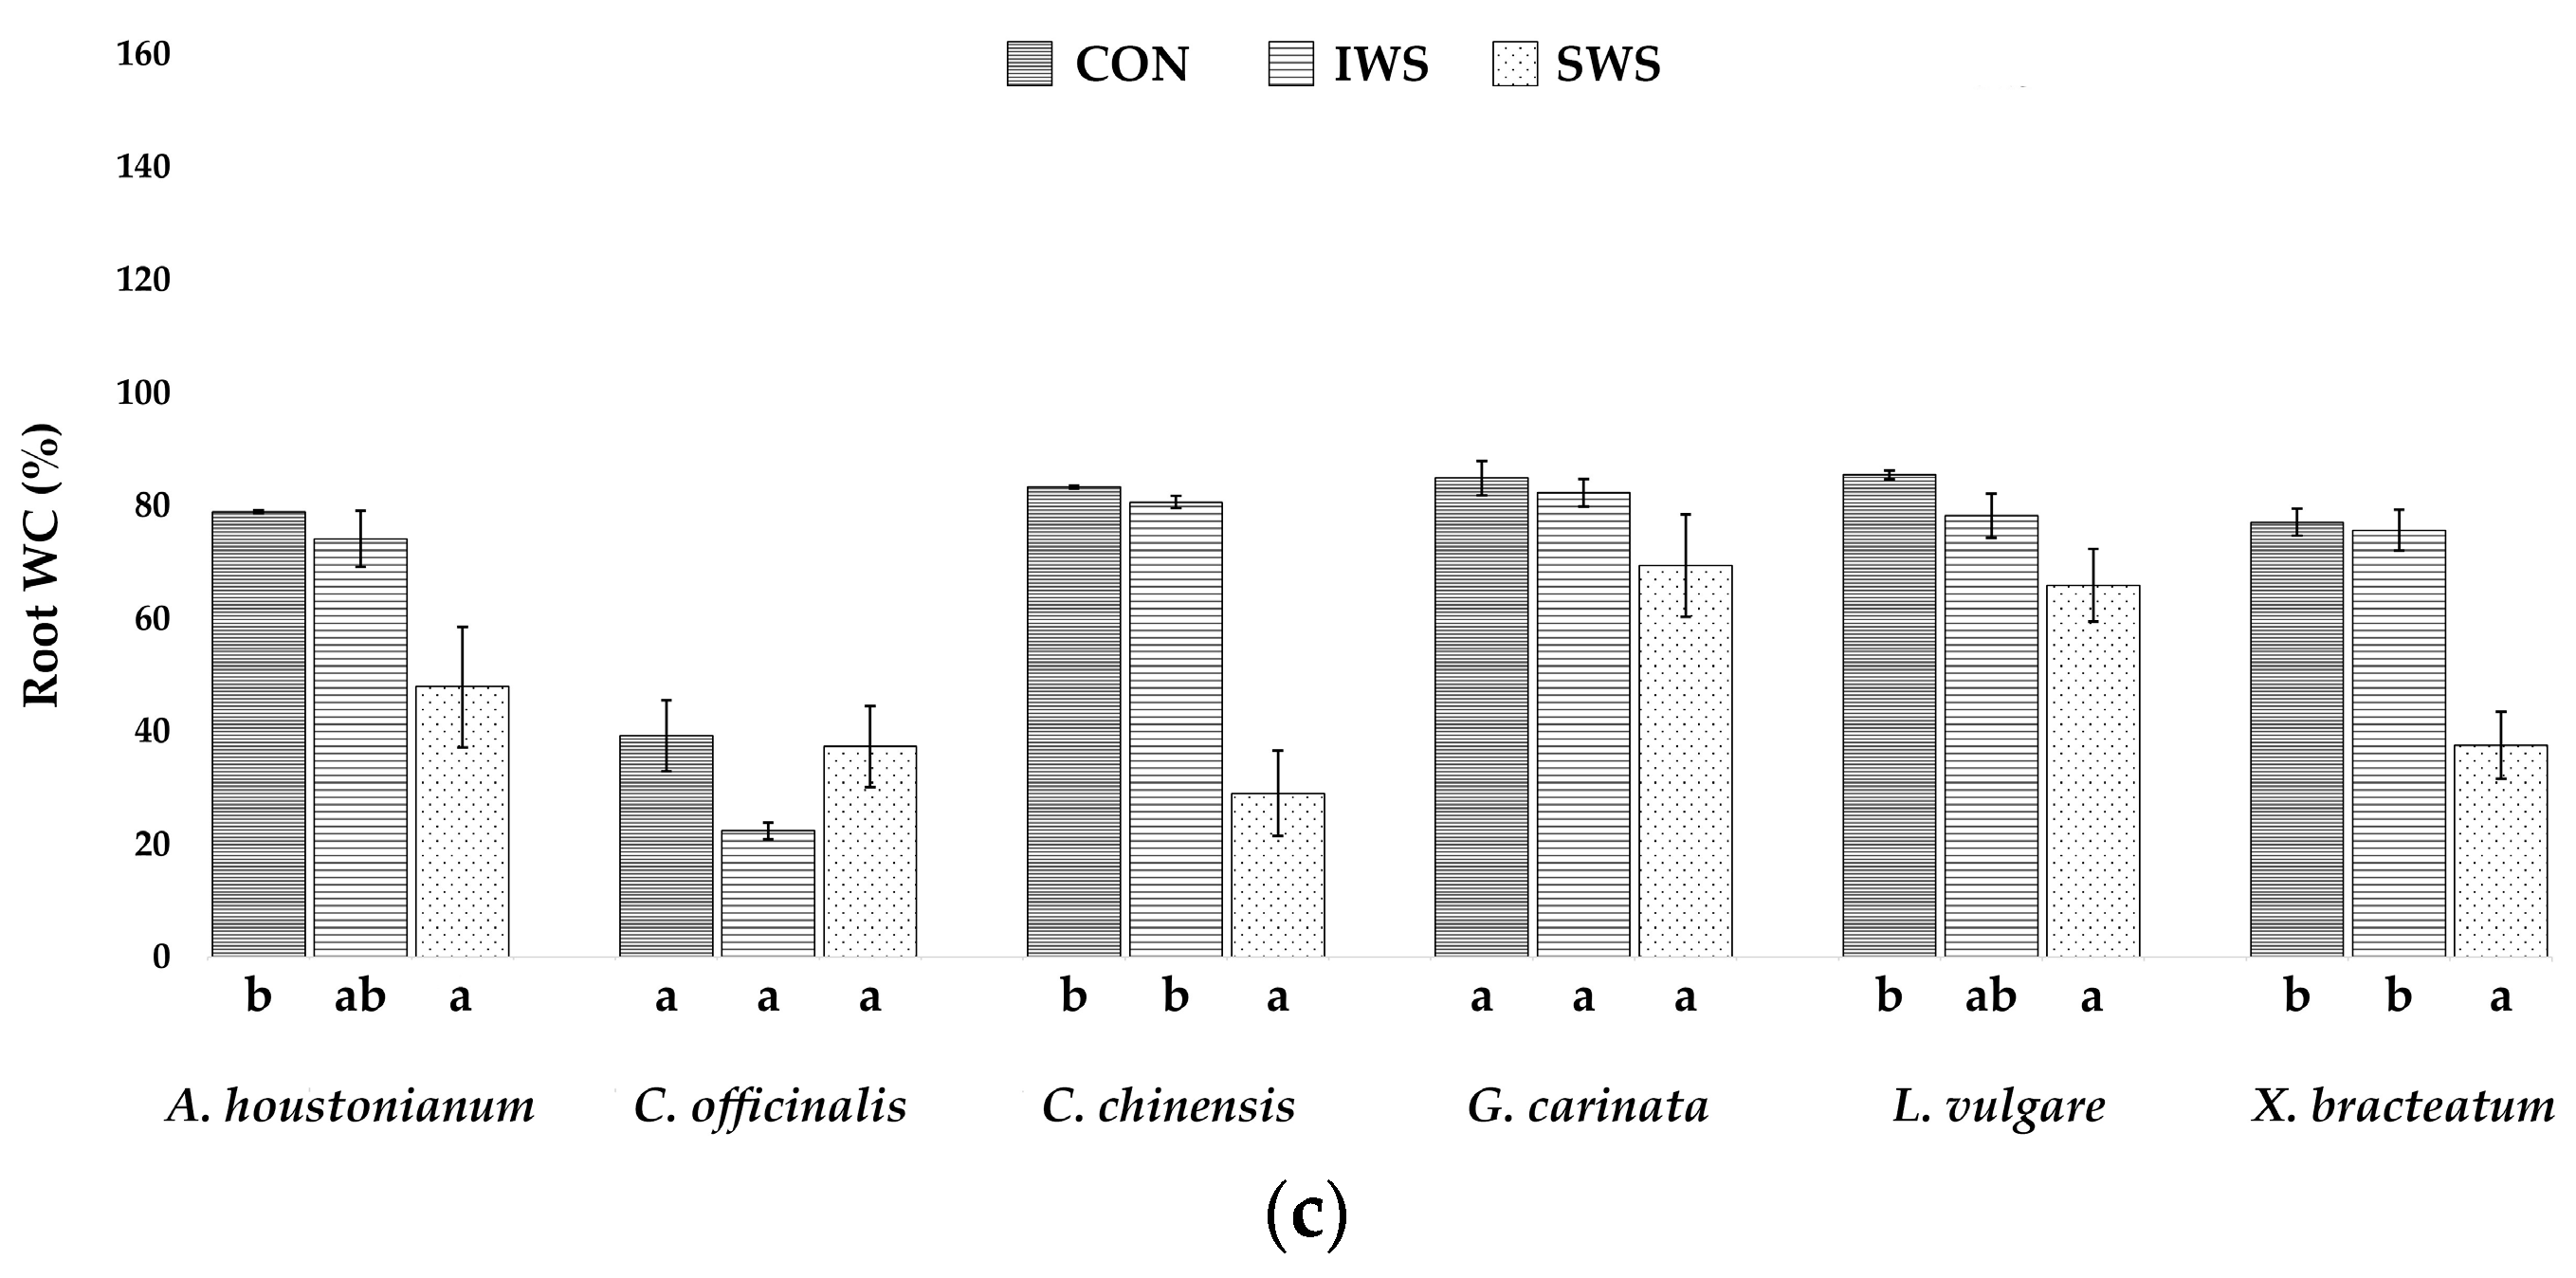
Root length was not affected by the intermediate stress treatment in any of the six species and decreased significantly under severe water stress only in plants of C. chinensis, L. vulgare, and X. bracteatum (Figure 3a). Root FW mean values decreased in all species in the IWS treatment, although the difference with the non-stressed controls was statistically significant only for X. bracteatum, with a reduction of about 40% of the control. On the other hand, root FW was significantly reduced in all species when subjected to severe water stress; here again, X. bracteatum appeared to be the most affected, with a reduction of over 95% of the control (Figure 3b). All selected species showed relative resistance to drought-induced root dehydration, as no significant WC reduction was observed in any of them in the IWS treatment. However, under severe stress conditions, C. chinensis and X. bracteatum plants did show a significant reduction of root WC (Figure 3c), indicating that the decrease of root FW observed in these species (Figure 3b) was partly due to loss of water.
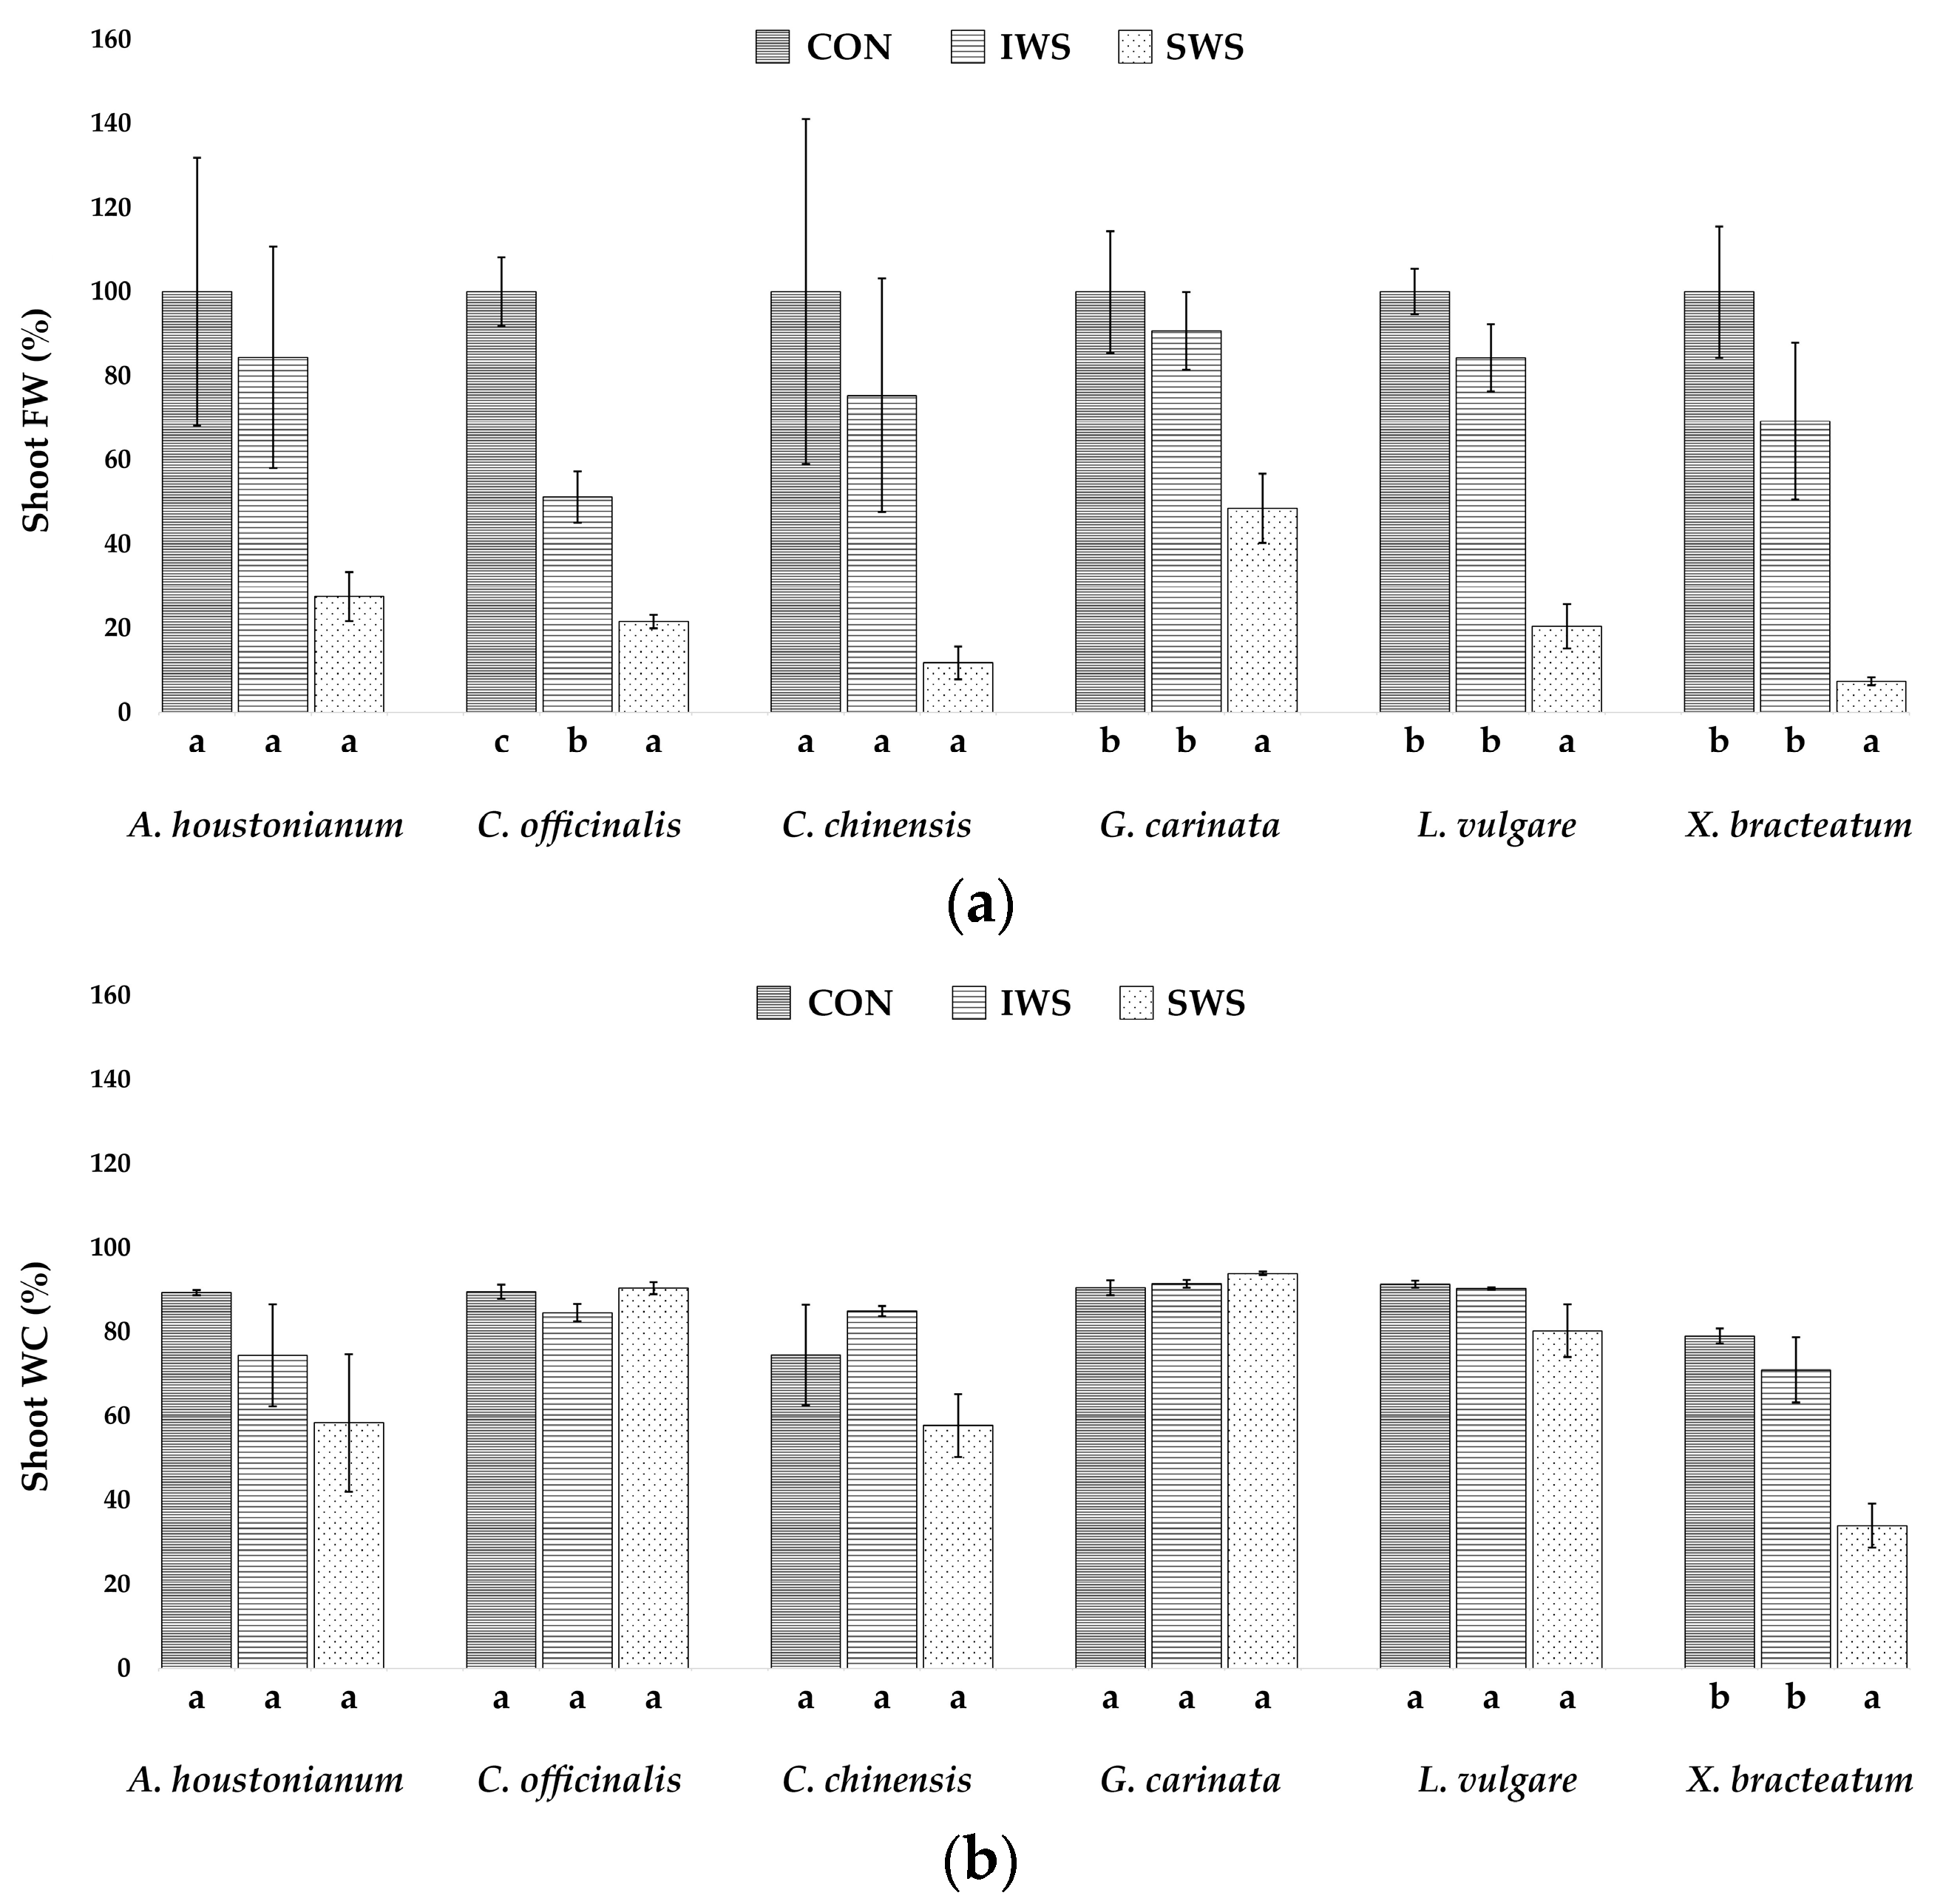
Mean shoot FW values decreased in all six selected species, roughly in parallel to the applied water stress intensity. For example, the IWS treatment induced reductions from 10% in G. carinata and L. vulgare to over 30% in X. bracteatum, whereas under SWS conditions, these percentages ranged from ca. 50% in G. carinata to over 90% in X. bracteatum. However, partly due to the variability of the individual measurements reflected in the large SE values, many of these differences with the non-stressed plants were not statistically significant. Thus, under intermediate water stress, shoot FW reduction was significant only in C. officinalis, whereas the SWS treatment induced reductions in all species except A. houstonianum and C. chinensis (Figure 4a). Shoots were even more resistant than roots to water stress-induced dehydration. Only X. bracteatum showed a significant water loss, and only in the SWS treatment (Figure 4b).
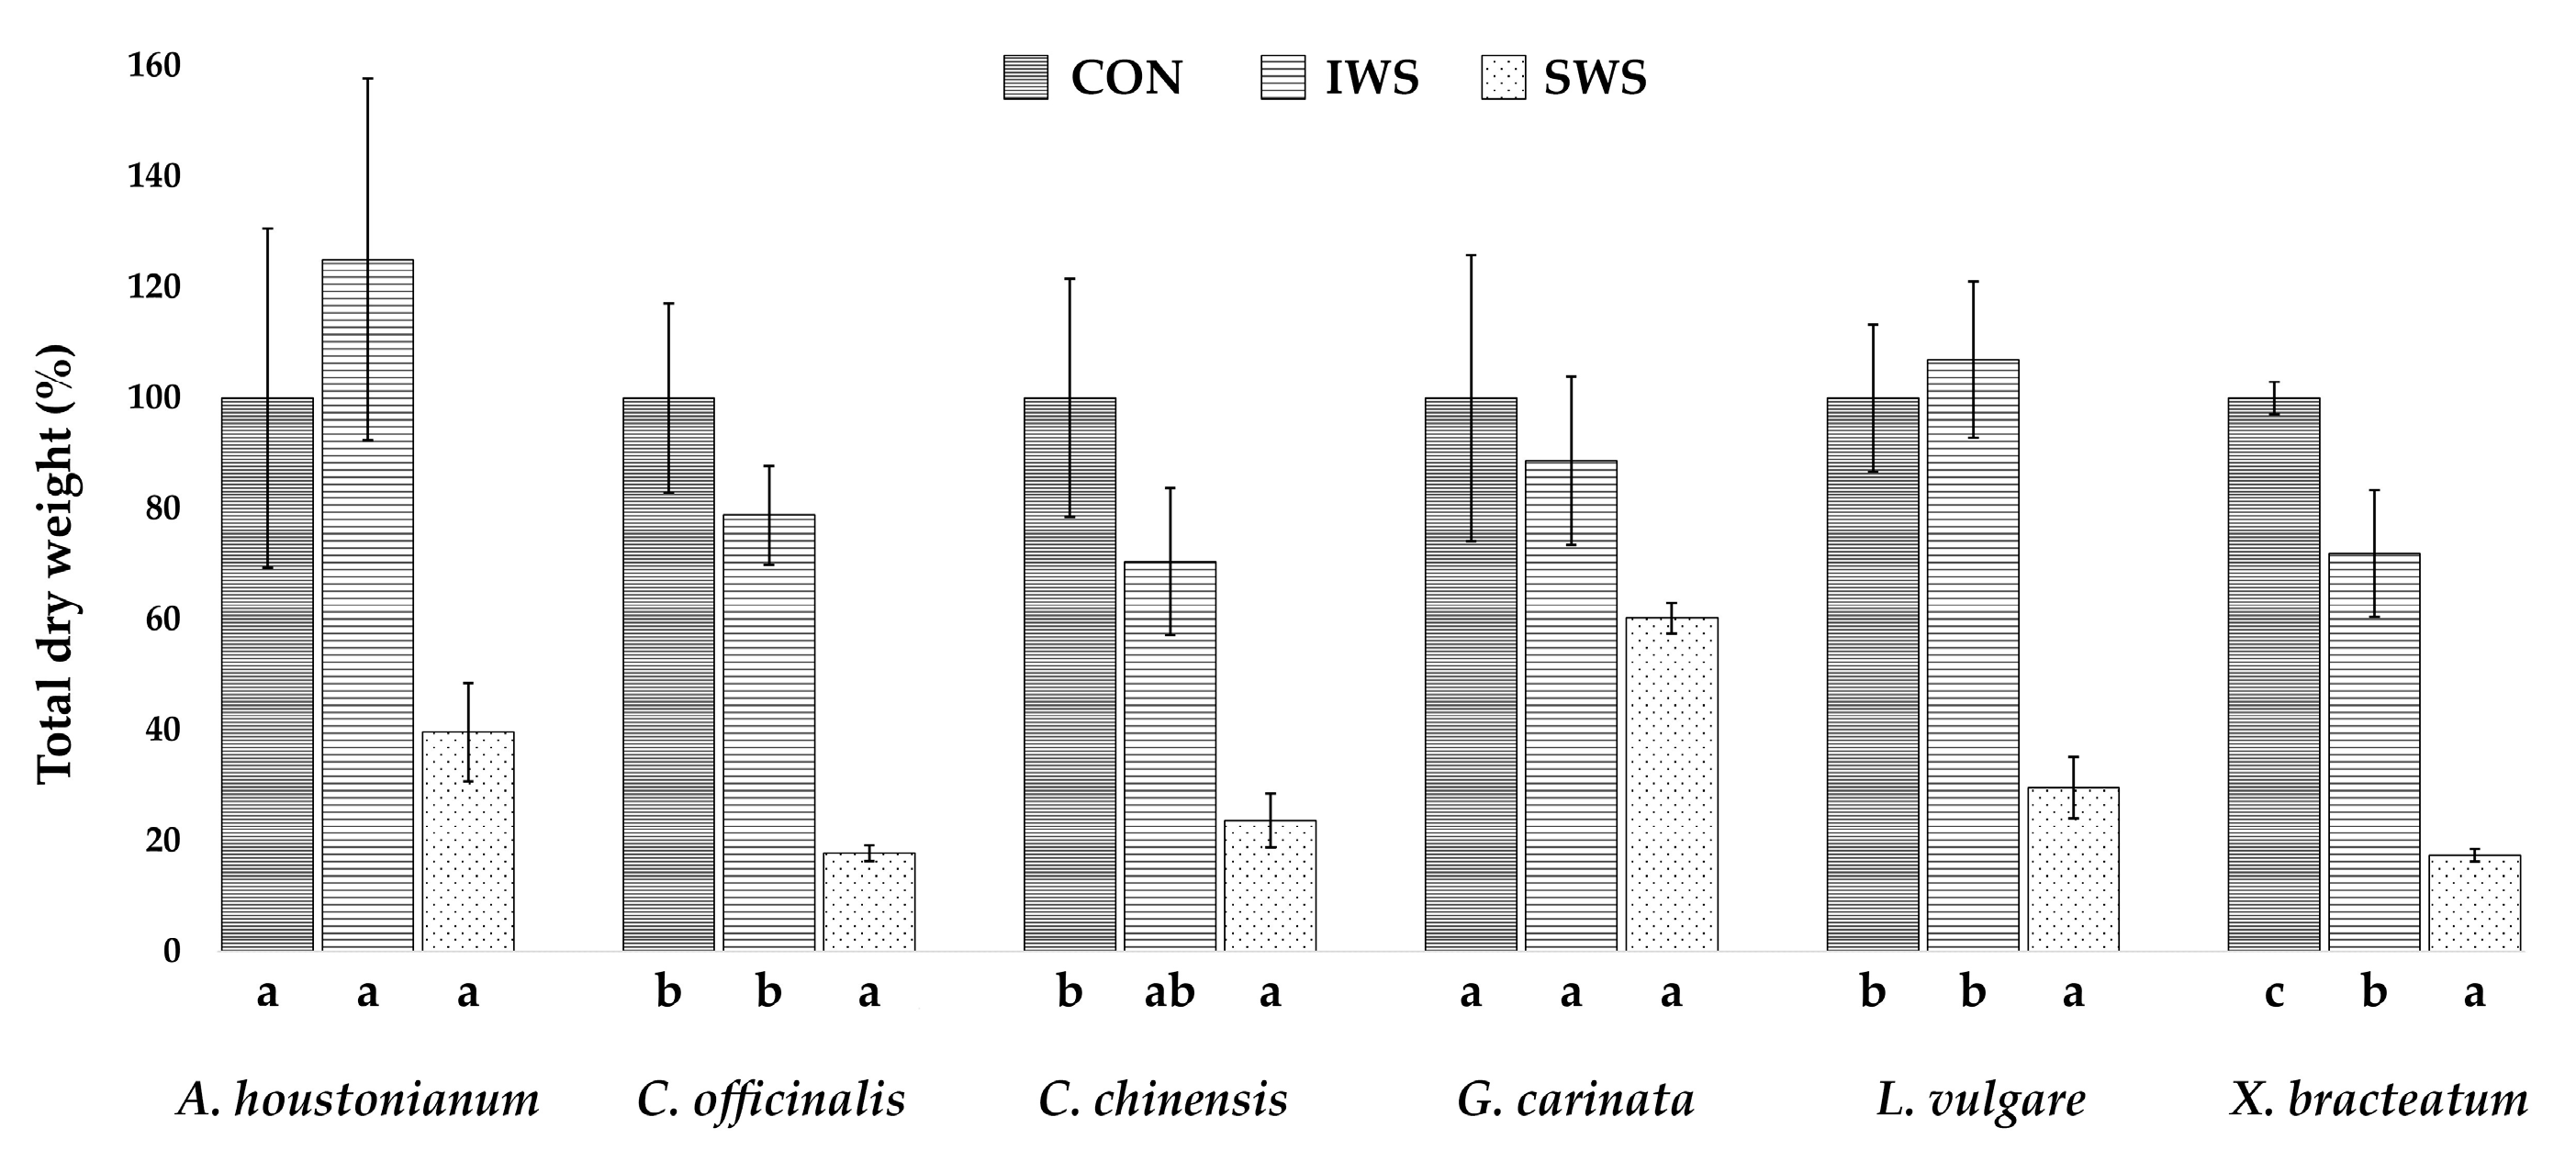
In terms of the total dry weight reduction, the strongest effect of water stress was observed in X. bracteatum, in which DW was significantly reduced by ca. 30% of the control in the intermediate and over 80% in the severe water stress treatment. On the other hand, G. carinata showed the lowest reductions: 10% and 40% of the control for the IWS and SWS treatment, respectively (Figure 5). Here again, the high variability of the individual measurements was the cause that, in some species, relatively large differences between mean values were not statistically significant; for example, in A. houstonianum under severe water stress conditions (Figure 5).

3.2. Biochemical Analysis

Photosynthetic pigments, namely chlorophylls a and b and total carotenoids, were quantified in the shoots of all harvested plants. Only slight, non-significant fluctuations were recorded for the three compounds in all analysed species, except chlorophyll b in C. officinalis, which showed an increase in the plants subjected to severe water stress (Table 2).
Mean proline contents increased in all species in response to the water stress treatments. The differences with the average control values were not statistically significant in the IWS treatment, except for C. officinalis, but were significant for all species under severe water stress conditions. Exceptionally high PRO values were registered in X. bracteatum both in control and under water stress conditions, compared to the other five species; however, its relative increment in plants subjected to the SWS treatment was only 1.6-fold, whereas in A. houstonianum, PRO contents increased ca. 17-fold compared to the control. All other species showed intermediate increments, between 3- and 6-fold, approximately (Table 2).
Shoot concentrations of MDA, selected as a suitable oxidative stress biomarker, were similar—ranging from ca. 400 to 500 nmol g−1 DW—in non-stressed plants of all species, except L. vulgare, which had between 2.5- and 3-fold higher MDA concentrations than the other taxa. In no case, however, did MDA contents vary significantly in response to the stress treatments, indicating that, under the experimental conditions used, water stress did not generate oxidative stress as a secondary effect. Consequently, we did not detect any significant change in the levels of antioxidant metabolites, such as total phenolic compounds or flavonoids (Table 2).

3.3. Multivariate Analysis of Data

We performed three principal component analyses (PCA) to map the main axes of variance within the measured data under control (PCAcon), intermediate water stress (PCAiws), and severe water stress (PCAsws) conditions. We also conducted three canonical variation analyses (CVA) in conjunction with PCA. CVA is a multivariate analysis technique with higher power in separating similar groups and maximising the discrimination instead of the variability.
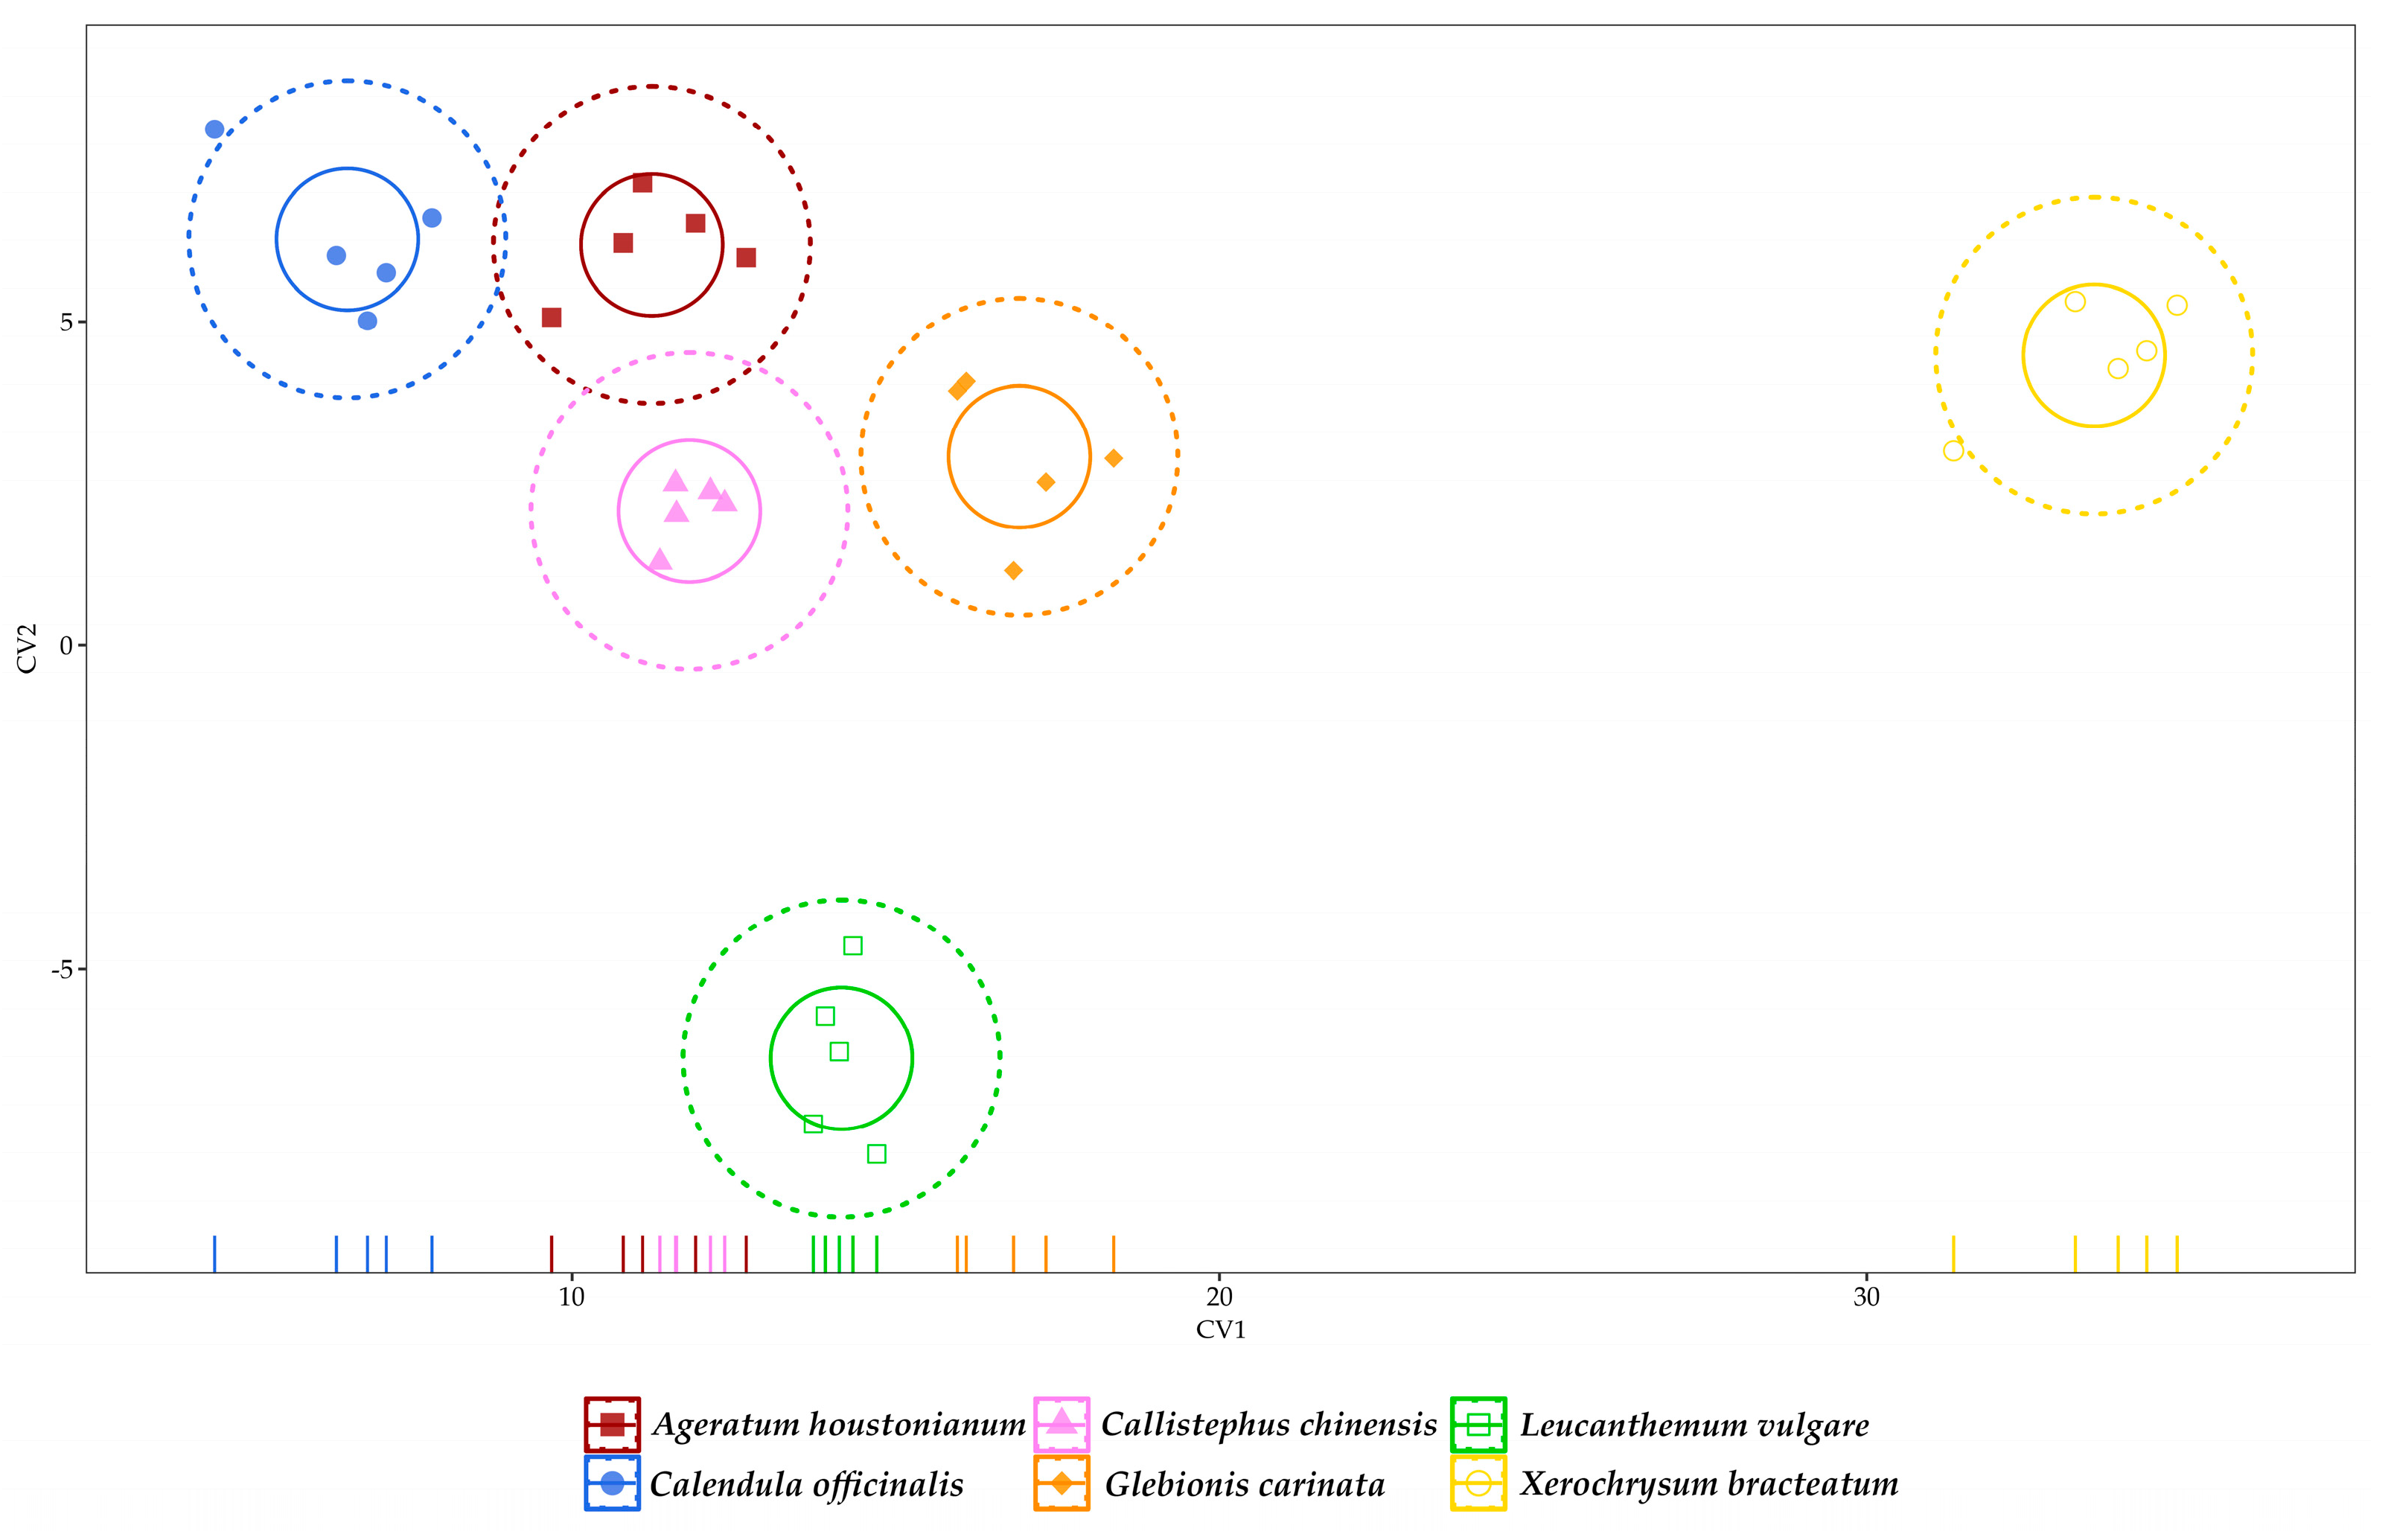
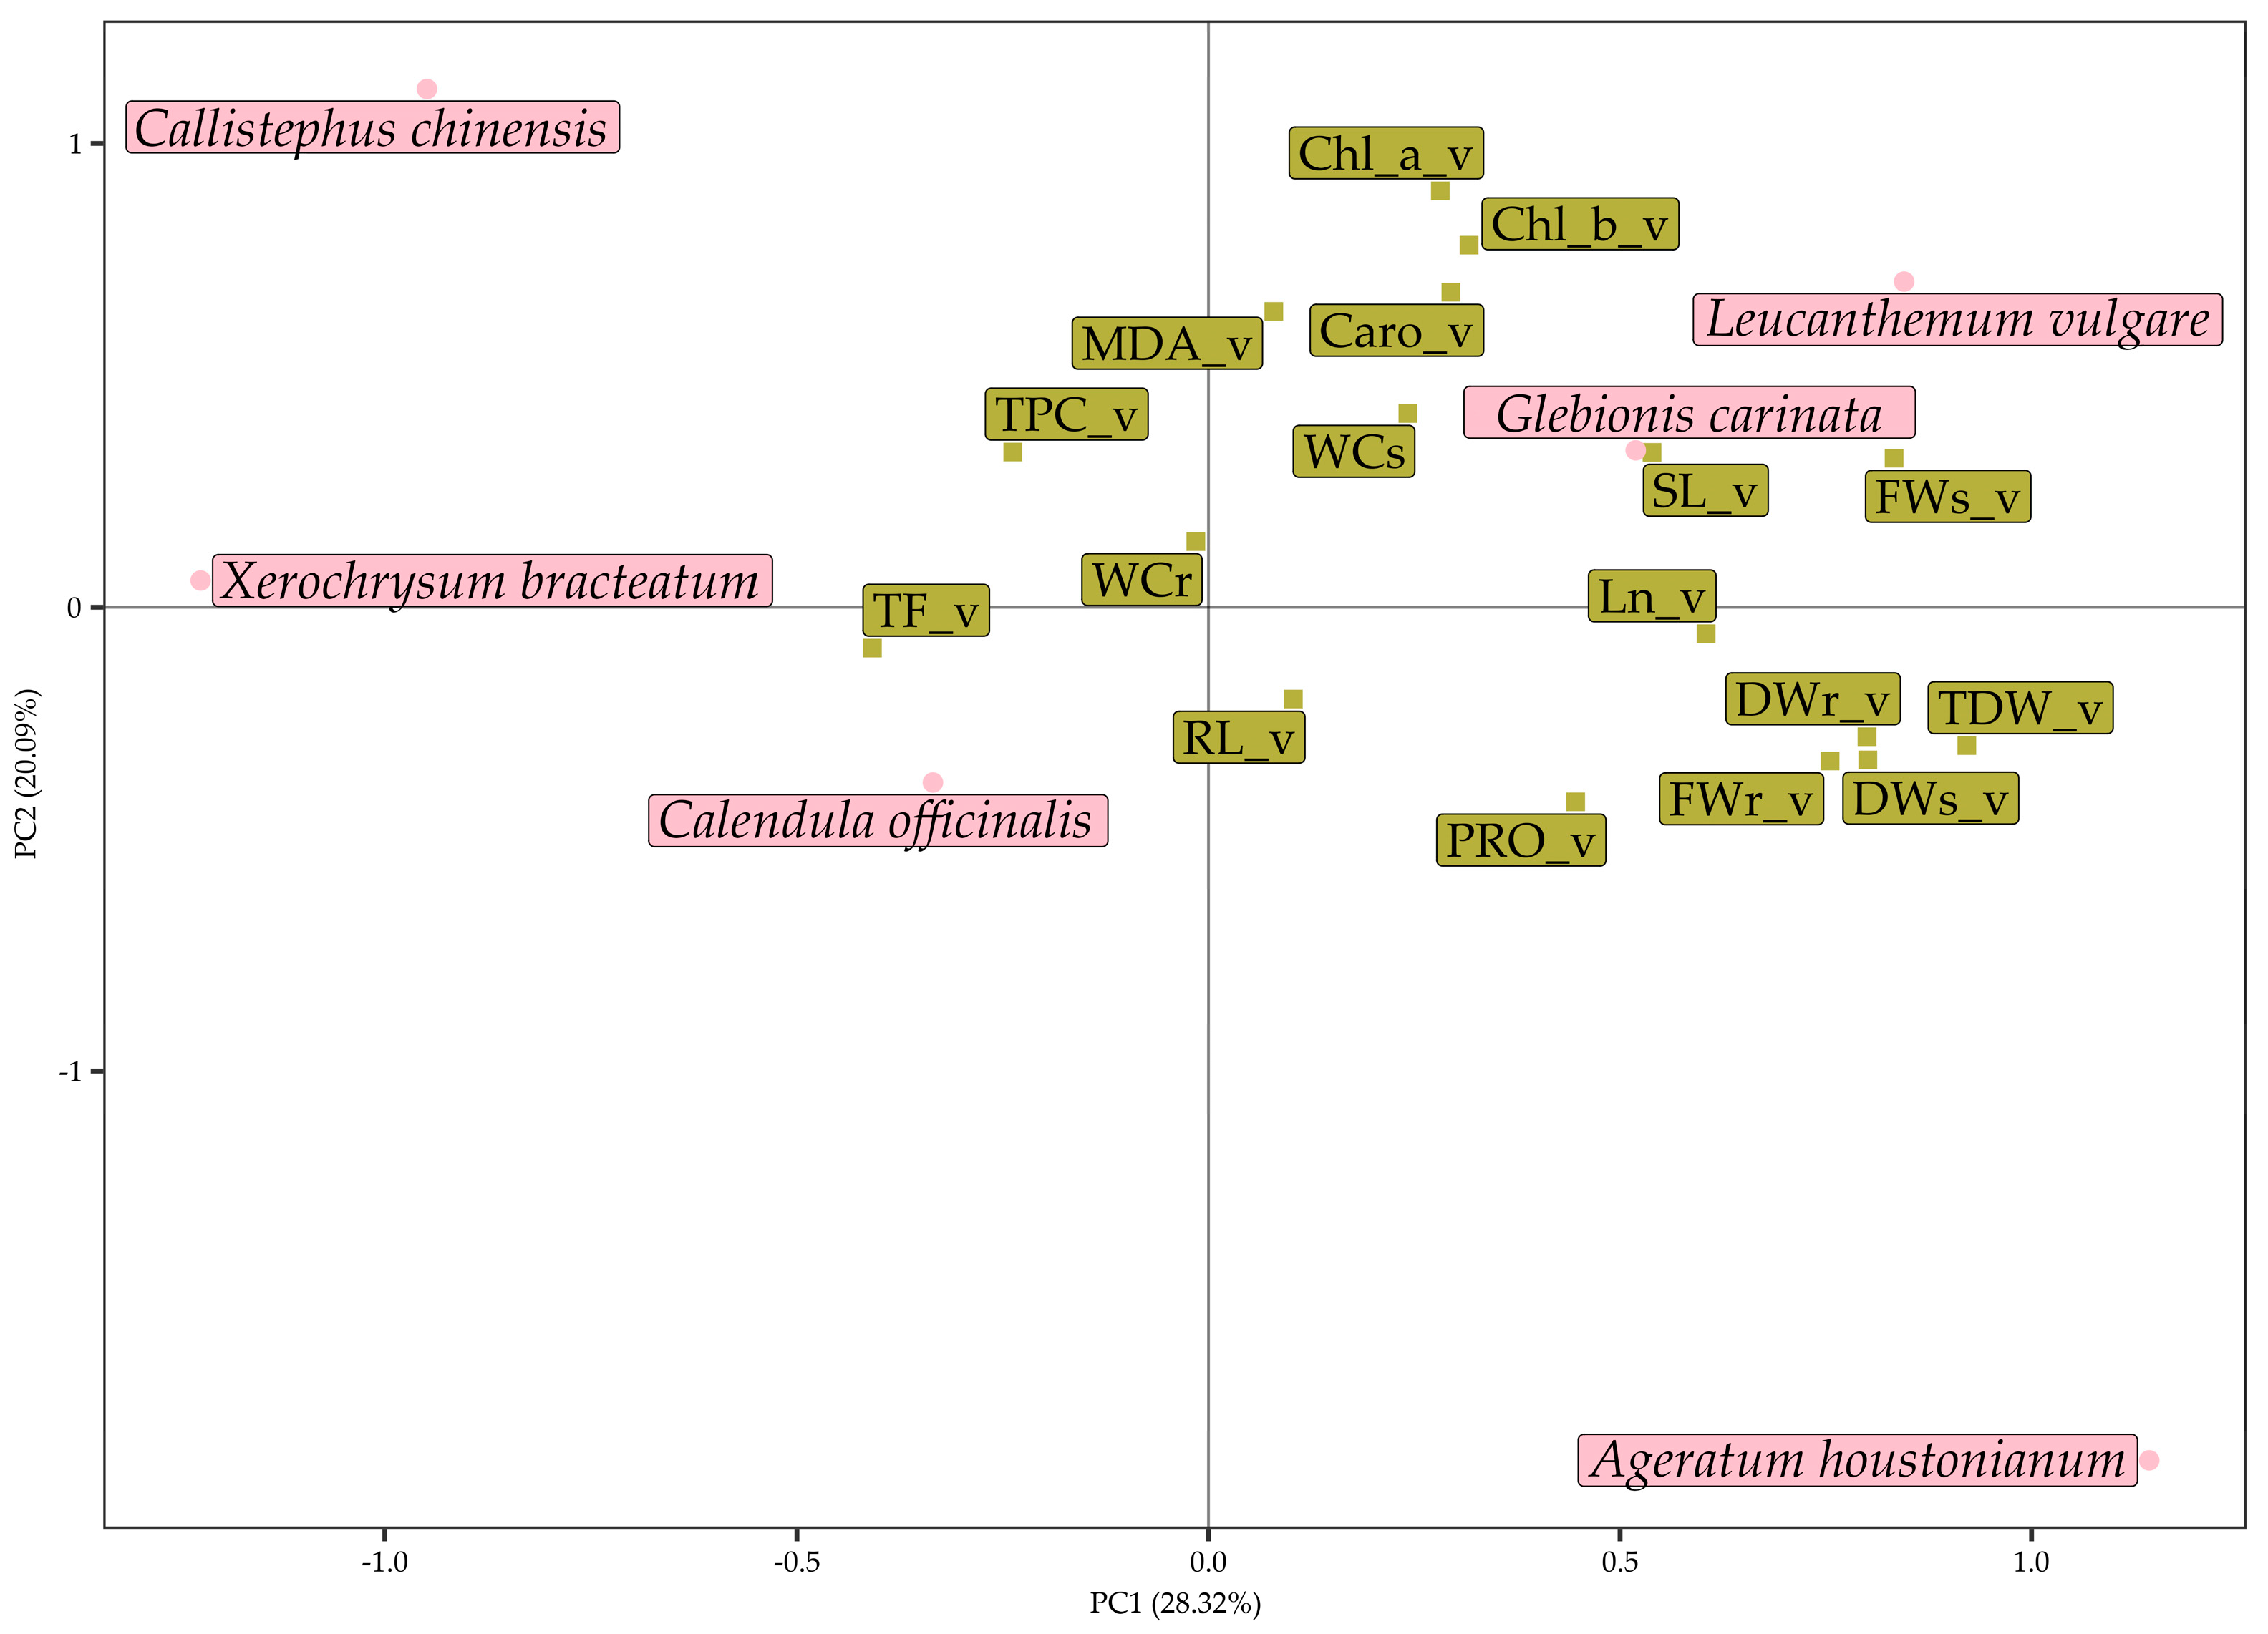
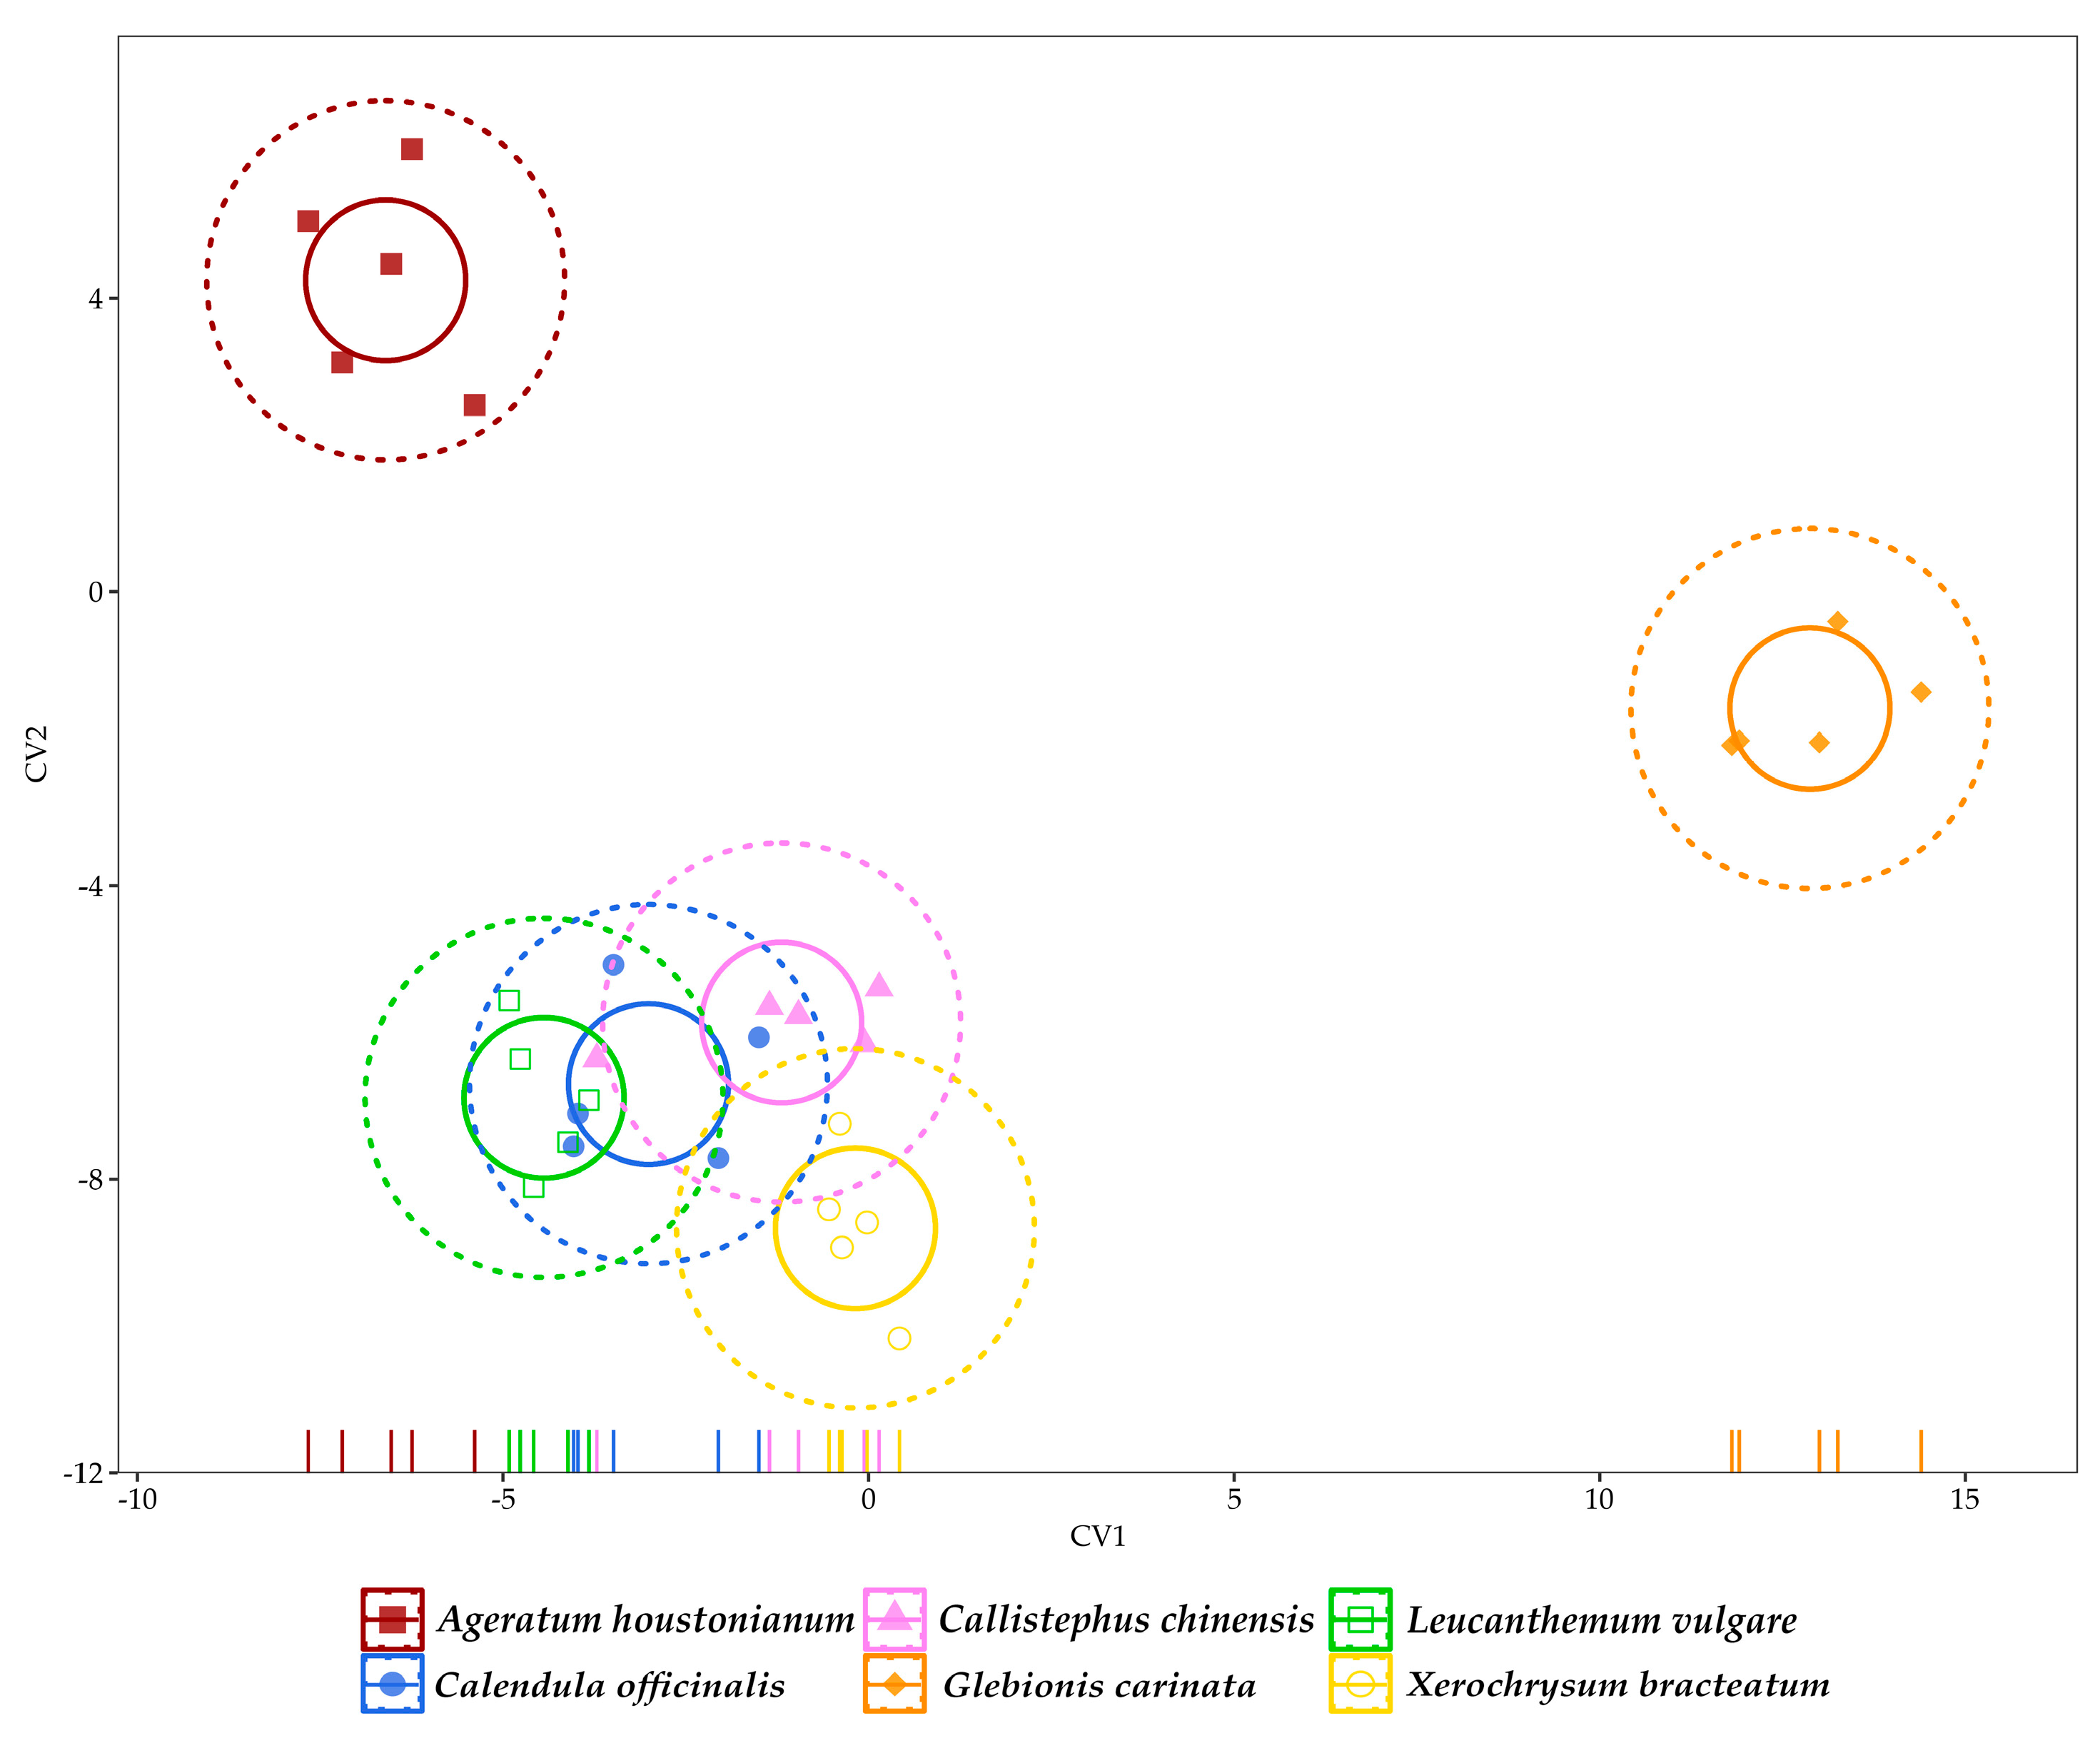
Through the PCAcon (Figure 6) and the CVAcon (Figure 7), we could discern the species-specific characteristics that distinguish the six species under analysis. In the PCAcon biplot, X. bracteatum is located in the upper right corner, on the positive side of PC1, in the same direction as the barycentres of proline, total phenolic compounds, and leaf pigments, being the species with the highest concentration of pigments, proline, and flavonoids. Another three species, A. houstonianum, L. vulgare, and G. carinata are also located on the positive side of PC1. The first one is characterised by the highest content in phenolic compounds, whereas the other two are characterised by the highest water content in the above- and below-ground organs and by the highest number of leaves. The barycentres of C. officinalis and C. chinensis are placed on the negative side of PC1, in the upper and lower quadrant, respectively. The first species is noticeable for having the highest shoot length and shoot fresh and dry biomass. Callistephus chinensis, instead, stands out for having the highest root length and the lowest pigments and proline contents.
The CVAcon results revealed that X. bracteatum and L. vulgare are the most distinct species in the light of the analysed variables. In contrast, the remaining four species appeared to be more similar to each other, being positioned closely together in the canonical variate space. From the analysis of the absolute coefficient of linear discriminants (Table S2 of the Supplementary Material), the content of carotenoids and chlorophyll b, the shoot dry weight, and the shoot length are the most important predictor variables in distinguishing the six studied species.
In PCAiws (Figure 8), the first component, explaining 28.3% of the data variance, represents the mild water-stress symptoms observed under intermediate drought-stress conditions. The six species results split into two groups, with L. vulgare, G. carinata, and A. houstonianum on the left side of PC1, being the species that retained the highest biomass and water content, and C. chinensis, X. bracteatum, and C. officinalis located on the negative side of PC1, being the species that experienced a slightly higher drop in growth and final biomass. The second PC, explaining 20.1% of the data variance, separated C. officinalis and A. houstonianum, which were placed on the PC2 negative side, from the four remaining species. Indeed, these two species are distinguished for having the highest accumulation of proline and the lowest production of MDA. On the other hand, C. chinensis and X. bracteatum, located in the positive left side of PC2, strongly correlated with the production of phenolic and flavonoid compounds; however, they were not as effective as proline in suppressing MDA production. Finally, L. vulgare and G. carinata, located on the positive right side of PC2, were characterised by having the highest pigment content.
The CVAiws results (Figure 9) indicated that the responses that stood out the most under intermediate water-stress conditions were those of C. officinalis, A. houstonianum, and X. bracteatum; the responses of the three remaining species, which are partially overlapping in the CVA biplot, are less differentiable. The analysis of the absolute coefficients of linear discriminants (Table S2) showed that the most valuable variables for species discrimination under intermediate water stress were the root water content, the root fresh and dry weight, and the leaf number. In contrast, the biochemical traits were less suitable in discerning the plants’ responses to stress.
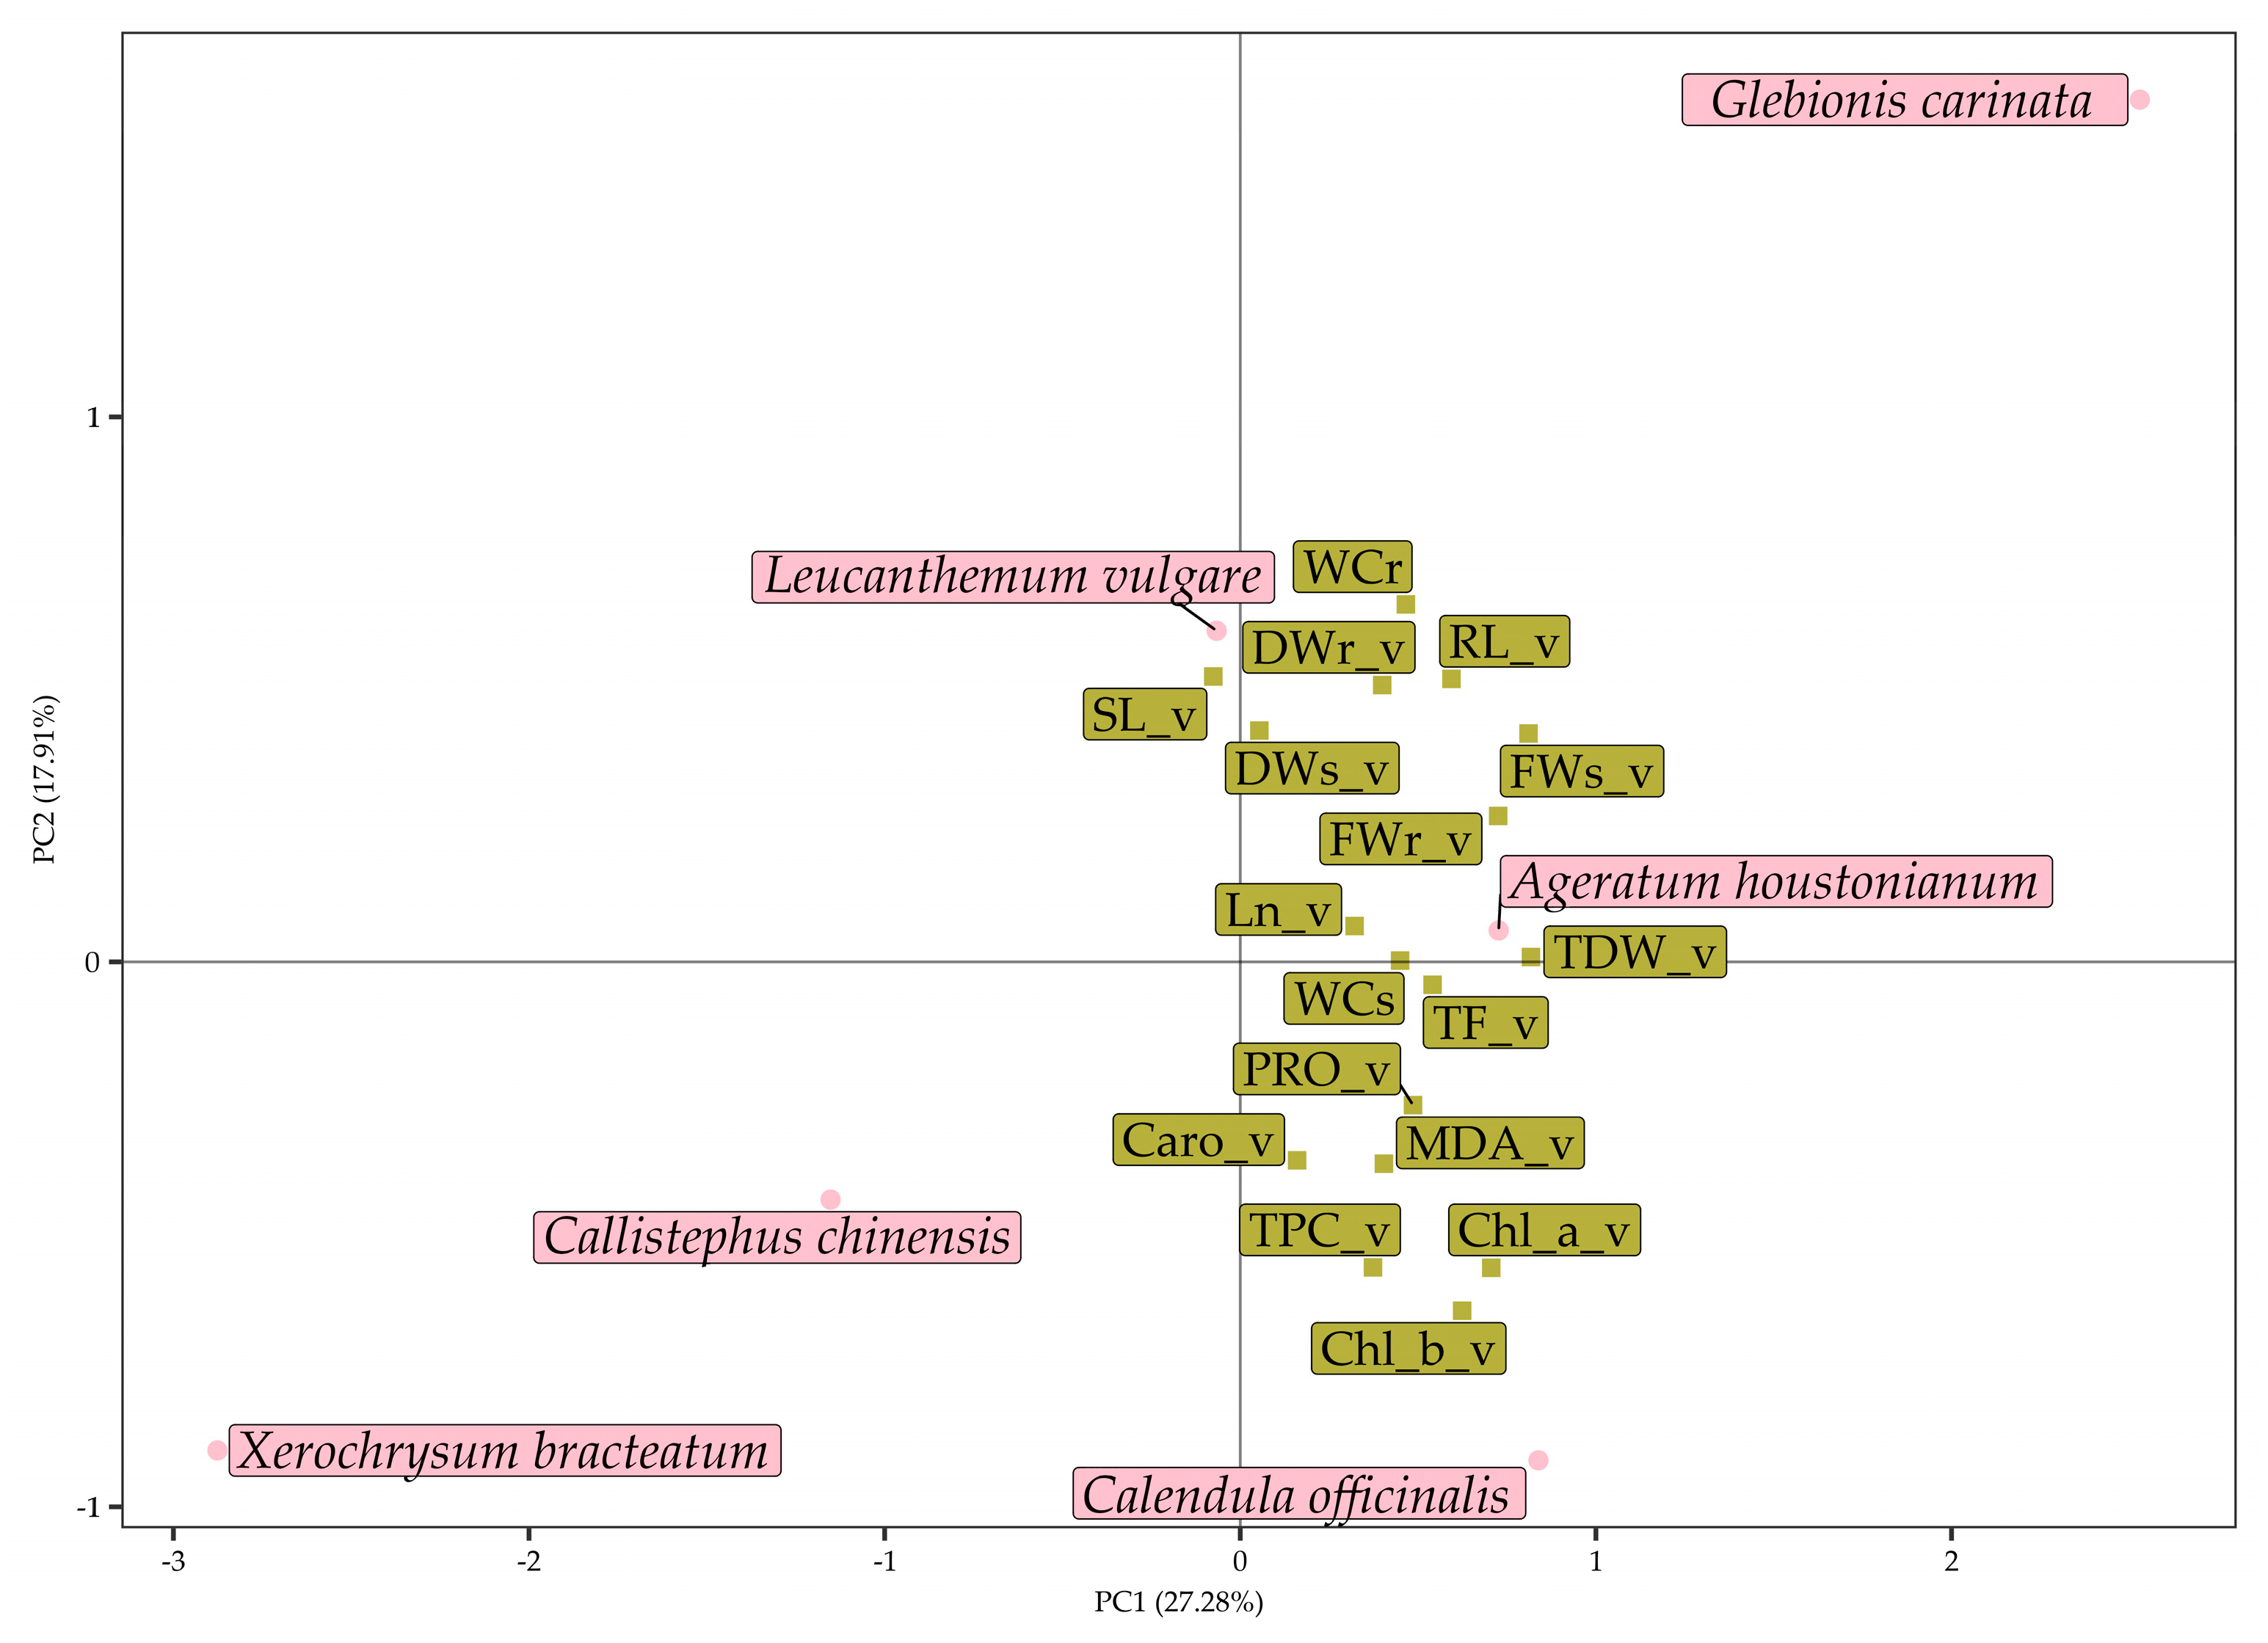
In PCAsws, the PC1 and the PC2 explained 27.3% and 17.9% of the database variance, respectively (Figure 10). Once again, the first component synthesised the water-stress-related symptoms. As in the previous case, the species appeared to separate into two groups, with G. carinata, C. officinalis and A. houstonianum on the positive side of PC2, and C. chinensis, X. bracteatum, and L. vulgare on the opposite side, although the latter falls almost at the axis intersection. Indeed, the plants belonging to the first group, together with L. vulgare, were the species that exhibited the highest ability to keep morphological development, moisture retention, and biomass production under complete water withholding. In G. carinata, C. officinalis, and A. houstonianum, the pigment contents even increased. Instead, C. chinensis and X. bracteatum had the most stunted growth.
The CVAsws results (Figure 11) hinted that the response to complete withholding of irrigation was very similar in G. carinata, C. officinalis, L. vulgare, and C. chinensis, since they are strongly overlaid in the CVA biplot, whereas the responses of A. houstonianum and in X. bracteatum were the most differentiated. Once again, the morphological variables—i.e., the root and shoot fresh and dry weight and water content, and the shoot length—were the most appropriate to assess the species differentiation. In contrast, the contents of osmolytes, antioxidant compounds, and oxidative stress markers were less effective in distinguishing the species under investigation.
The entire dataset, including all the stress levels and all six species, was used to build a network correlation plot (Figure 12) to get a comprehensive overview of the correlations between the parameters. The plants’ fresh weight positively and strongly correlated to the plant water content, both at the root and the shoot level. The proline content negatively correlated with the root and shoot fresh weight and with the root dry weight and length. Indeed, a higher concentration of this osmoprotective compound was found in plants subjected to the highest levels of drought stress, in which the growth and development were the most restrained. On the other hand, the proline content positively correlated with the content of the three photosynthetic pigments, Chl a, Chl b, and Caro, suggesting that the accumulation of this compound limited the pigments’ oxidation. This hypothesis is reinforced by the negative correlation between proline and MDA, implying that the production of the first compound reduced oxidative damage under water stress. A weaker positive correlation was observed between the three photosynthetic pigments and total phenolic compounds and flavonoids, which indicates that these antioxidant metabolites also contributed to the protection of the photosynthetic pool, albeit to a lesser extent. The negative correlation between the photosynthetic pigments and the root length (RL) may imply that, under restrained water availability, the plants favoured the development of roots, to the detriment of the photosynthetic organs, to increase water uptake.

4. Discussion

The most general effect of stress on plants is the suppression of growth as they divert their resources, including energy and metabolic precursors, away from primary metabolism and biomass buildup to activate particular defence mechanisms [40,41]. The limitation of plant growth imposed by low water availability is mainly due to the reduction of plant carbon balance, which is largely dependent on photosynthesis [42]. Almost all plants close their stomata in response to drought stress to prevent transpirational water loss [43]. The reduction in CO2 absorption caused by stomatal closure causes a comparable fall in photosynthesis. Non-stomatal restrictions on photosynthesis, such as protein degradation, reduced Rubisco activity, and decreased photosystem II quantum efficiency are observed when drought stress is more severe [44]. Accordingly, after one month of complete withholding of irrigation, all investigated species showed significant growth suppression. However, not all species reacted to stress similarly, with some exhibiting a more considerable decline in particular parameters. For instance, both C. officinalis and X. bracteatum underwent the same significant loss in their total dry weight; however, the length and root biomass of C. officinalis were not as significantly impacted as those of X. bracteatum.
It is also necessary to consider the variability of morphological characteristics in the absence of stress. Some species, like C. officinalis, seem to invest more of their growth resources in the aerial part, while others, such as A. houstonianum, rely more on the roots. Therefore, it is difficult to identify a single growth criterion that can be used to rank the six investigated species according to their tolerance to water stress. A comparison of straightforward growth metrics is often adequate for closely related genotypes, such as varieties or cultivars of one species or even species belonging to the same genus. Some examples include permanent wilting in cowpea [45], roots system size in barley [46], reduction of fresh shoots biomass accumulation in Juncus [47], foliar dehydration in Limonium [48], reduction of leaf area and leaf fresh weight in eggplants and its hybrids [49], and shoot and leaf dry weight in wild relatives of eggplant [50], amongst others. However, in addition to growth characteristics, physiological, biochemical, and more recently, omics approaches are also considered when screening a larger number of more distant genotypes for drought resistance [51,52,53,54,55,56,57] (amongst many others). Within species or genera of Asteraceae, growth parameters were often combined with other traits, such as reproductive fitness [58] or physiological [59] or biochemical characteristics [14].
In this work, we examined several morphological characteristics of vegetative growth along with a few specific, readily observable biochemical markers. However, for the appropriate interpretation of the outcomes of these experiments, we had to rely on multivariate analysis tools due to the genetic variations across species belonging to distinct tribes of the broad Asteraceae family, with diverse geographic origins and ecological optima. Multivariate analysis is any simultaneous examination of more than two variables [60], which allows the graphical display of the interface between various samples and variables [61]. In the analysis of plant responses to drought, principal component analysis (PCA) has been used frequently to identify the variables that are most important for explaining the variation in the data or to identify patterns of species co-occurrence [62,63,64,65,66]. Canonical variate analysis (CVA) seeks to identify linear combinations of predictor variables that best distinguish between different categories of a response variable. In plant studies, CVA can be used to identify the characteristics or traits that strongly differentiate the response of various species to external abiotic stressors, such as drought [67,68]. In summary, CVA allows researchers to simultaneously look at multiple factors and identify which ones are most important to distinguish between different species. This information can be helpful in various applications, such as crop breeding, genetic improvement, crop management, and environmental planning [69].
Multivariate analysis was performed separately for control, intermediate, and severe water-stress treatments. Plants in the control treatment were separated mainly by biochemical parameters, such as outstanding concentrations of proline in X. bracteatum or high concentrations of phenolic compounds in A. houstonianum. Other species were separated mostly due to morphological traits, such as C. officinalis with the highest length, or C. chinensis with both morphological and biochemical parameters, having the highest root length and the lowest content of pigments and proline. The CVAcon revealed that X. bracteatum and L. vulgare were the most distinct species.
The multivariate analysis that was performed with parameter values that were transformed into percentages of the corresponding controls allowed for the distinction of the more tolerant species. In the intermediate stress group, the number of leaves, the fresh and dry weight of the roots, and the root water content were the characteristics that were most relevant for identifying the more tolerant species, whereas biochemical traits were less effective. This could be explained by the fact that plants in this treatment experienced only moderate stress, which may not be sufficient to activate some biochemical response mechanisms, even if an impact on growth and development can be observed. The species C. chinensis and X. bracteatum were the most negatively affected by mild water stress. Regarding responses to severe water stress, A. houstonianum and X. bracteatum were identified as the most tolerant and the most sensitive species, respectively. Glebionis carinata, C. officinalis, and A. houstonianum were also included in the more tolerant category, whereas X. bracteatum, C. chinensis, and L. vulgare were among the least tolerant. Once more, growth reduction was more reliable than the variation of the biochemical indicators for classifying species according to their relative tolerance to water stress.
Although there are differences in the concentrations of the biochemical compounds analysed in the six species, only proline showed a notable significant increase under stress. Still, considering proline as a suitable indicator of tolerance to water stress is difficult when dealing with diverse species. This typical osmolyte found in plants, as in other organisms, accumulates in response to a range of abiotic stresses, including salinity and drought [70,71]. Proline acts as an “osmoprotectant” in addition to its function in cellular osmotic adjustment. This physiological role is accomplished by directly stabilising proteins and sub-cellular structures such as membranes, scavenging free radicals, buffering redox potential, reducing cellular acidosis, and acting as a signaling molecule in stress responses [72,73]. Because proline performs such multiple functions, it stands to reason that its accumulation would increase a plant’s ability to withstand stress, and numerous studies on closely related genotypes of crops [74,75] and wild species [76,77] have shown this to be the case. However, other comparative studies showed a negative correlation between proline levels and stress tolerance, that is, increased proline accumulation under stress in the less tolerant genotypes [63,78,79]. Many plant species accumulate proline as a general “response” to abiotic stress; however, proline may or may not be engaged in stress tolerance mechanisms, depending on the species. In our case, the correlation network revealed a high positive correlation between the proline and photosynthetic pigment contents, confirming the active role of this compound not only in the plant osmoregulation but also in scavenging oxidative stress on photosystems, as further demonstrated by the negative correlation with MDA concentration.
The species with invasive potential were found to be those more tolerant to water stress, except L. vulgare, which was more severely affected by one month of complete withholding of irrigation. The other invasives, A. houstonianum and G. carinata, proved to better tolerate severe water stress than the remaining species, regardless of their native range. The phenotypic plasticity of invasive species, which may play a significant role in their success in invading new habitats, has been reported in studies for some time [80,81,82,83]. Plants can exhibit plasticity for a wide range of characteristics and in response to a variety of environmental factors. In certain circumstances, adaptive flexibility may boost survival and reproduction, increasing invasion success [84].

5. Conclusions

This comparative study on ornamental species belonging to different tribes of the Asteraceae family, with different geographic origins and ecological characteristics, revealed the utility of using multivariate analysis methods, specifically principal component analysis (PCA) and canonical variation analysis (CVA) for screening drought tolerance. Using only a few morphological or biochemical markers is unsuitable due to the large differences between taxa. It will also be inappropriate in similar comparative studies including species that are not closely related genetically. The multivariate analysis performed allowed for the distinction of the more drought-tolerant species A. houstonianum, G. carinata, and L. vulgare from the more susceptible C. officinalis, C. chinensis, and X. bracteatum. The group of the more tolerant species included the two reported as invasive outside their native range (A. houstonianum and L. vulgare).

Supplementary Materials

The following supporting information can be downloaded at https://www.mdpi.com/article/10.3390/agronomy13030687/s1, Figure S1: Eigenanalysis of PCAcon, PCAiws, and PCAsws; Table S1: Correlation coefficients between the first two PCs and the variables included in PCAcon, PCAiws, and PCAsws. Table S2: Coefficients of linear discriminants for CVAcon, CVAiws, and CVAsws.

Author Contributions

Conceptualization, O.V. and A.F.S.; methodology, D.M.M., M.F.S. and R.S.; software, R.C.; validation, R.C., A.F.S. and R.E.S.; formal analysis, R.C.; investigation, D.M.M., M.F.S. and R.S.; resources, O.V. and A.F.S.; data curation, D.M.M. and R.C.; writing—original draft preparation, D.M.M., R.C. and R.S.; writing—review and editing, M.B., A.F.S., R.E.S. and O.V.; visualization, D.M.M. and R.C.; supervision, A.F.S. and O.V.; project administration, A.F.S. and O.V.; funding acquisition, A.F.S. and O.V. All authors have read and agreed to the published version of the manuscript.

Funding

This research received no external funding.

Data Availability Statement

All data are contained within the manuscript and the ‘Supplementary Materials’.

Acknowledgments

D.M.M. is supported by a fellowship as Ph.D. student from the Doctoral School of the University of Agricultural Sciences and Veterinary Medicine in Cluj-Napoca. R.S. is thankful to the Department of Science and Technology, Government of India, for providing a SIRE fellowship (SIR/2022/000435).

Conflicts of Interest

The authors declare no conflict of interest.

References

  1. Lewis Smith, R.I.; Richardson, M. Fuegian plants in Antarctica: Natural or anthropogenically assisted immigrants? Biol. Invasions 2011, 13, 1–5. [Google Scholar] [CrossRef]
  2. Mandel, J.R.; Dikow, R.B.; Siniscalchi, C.M.; Thapa, R.; Watson, L.E.; Funk, V.A. A fully resolved backbone phylogeny reveals numerous dispersals and explosive diversifications throughout the history of Asteraceae. Proc. Natl. Acad. Sci. USA 2019, 116, 14083–14088. [Google Scholar] [CrossRef] [PubMed] [Green Version]
  3. Elomaa, P.; Zhao, Y.; Zhang, T. Flower heads in Asteraceae-recruitment of conserved developmental regulators to control the flower-like inflorescence architecture. Hortic. Res. 2018, 5, 36. [Google Scholar] [CrossRef] [PubMed] [Green Version]
  4. Nikolić, M.; Stevović, S. Family Asteraceae as a sustainable planning tool in phytoremediation and its relevance in urban areas. Urban For. Urban Green. 2015, 14, 782–789. [Google Scholar] [CrossRef]
  5. Snyder, R. Climate change impacts on water use in horticulture. Horticulturae 2017, 3, 27. [Google Scholar] [CrossRef] [Green Version]
  6. Dullinger, I.; Wessely, J.; Bossdorf, O.; Dawson, W.; Essl, F.; Gattringer, A.; Klonner, G.; Kreft, H.; Kuttner, M.; Moser, D.; et al. Climate change will increase the naturalization risk from garden plants in Europe. Glob. Ecol. Biogeogr. 2017, 26, 43–53. [Google Scholar] [CrossRef] [Green Version]
  7. Hayden Reichard, S.; White, P. Horticulture as a pathway of invasive plant introductions in the United States: Most invasive plants have been introduced for horticultural use by nurseries, botanical gardens, and individuals. BioScience 2001, 51, 103–113. [Google Scholar] [CrossRef]
  8. van Kleunen, M.; Essl, F.; Pergl, J.; Brundu, G.; Carboni, M.; Dullinger, S.; Early, R.; González-Moreno, P.; Groom, Q.J.; Hulme, P.E.; et al. The changing role of ornamental horticulture in alien plant invasions. Biol. Rev. 2018, 93, 1421–1437. [Google Scholar] [CrossRef]
  9. Hulme, P.E.; Brundu, G.; Carboni, M.; Dehnen-Schmutz, K.; Dullinger, S.; Early, R.; Essl, F.; González-Moreno, P.; Groom, Q.J.; Kueffer, C.; et al. Integrating invasive species policies across ornamental horticulture supply chains to prevent plant invasions. J. Appl. Ecol. 2018, 55, 92–98. [Google Scholar] [CrossRef]
  10. Haeuser, E.; Dawson, W.; van Kleunen, M. The effects of climate warming and disturbance on the colonization potential of ornamental alien plant species. J. Ecol. 2017, 105, 1698–1708. [Google Scholar] [CrossRef] [Green Version]
  11. Darras, A.I. Implementation of Sustainable Practices to Ornamental Plant Cultivation Worldwide: A Critical Review. Agronomy 2020, 10, 1570. [Google Scholar] [CrossRef]
  12. Eftekhari, M.S. Impacts of climate change on agriculture and horticulture. In Climate Change; Springer International Publishing: Cham, Switzerland, 2022; pp. 117–131. [Google Scholar] [CrossRef]
  13. Caser, M.; Ruffoni, B.; Scariot, V. Screening for drought tolerance in Salvia spp. and Helichrysum petiolare: A way to select low maintenance ornamental plants. Acta Hortic. 2012, 953, 239–246. [Google Scholar] [CrossRef]
  14. Cicevan, R.; Al Hassan, M.; Sestras, A.F.; Prohens, J.; Vicente, O.; Sestras, R.E.; Boscaiu, M. Screening for drought tolerance in cultivars of the ornamental Genus Tagetes (Asteraceae). PeerJ 2016, 4, e2133. [Google Scholar] [CrossRef] [Green Version]
  15. Franco, J.A.; Martínez-Sánchez, J.J.; Fernández, J.A.; Bañón, S. Selection and nursery production of ornamental plants for landscaping and xerogardening in semi-arid environments. J. Hortic. Sci. Biotechnol. 2006, 81, 3–17. [Google Scholar] [CrossRef]
  16. Juan Vicedo, J.; Laguna, E.; Ríos, S.; Casas, J. Ornamental potential of the coastal plant Lapiedra martinezii Lag. (Amaryllidaceae): The role of its revalorization in xero-gardening and ex-situ conservation. Nereis Interdiscip. Ibero-Am. J. Methods Model. Simul. 2021, 13, 211–226. [Google Scholar] [CrossRef]
  17. Ali, A.A.; El-Shanawani, M.A.; Khalifa, A.A.; Mohammad, M.A. Macro- and micromorphology of the leaves, stems and flowers of Chrysanthemum carinatum L. Bull. Pharm. Sci. 2010, 33, 141–168. [Google Scholar] [CrossRef]
  18. CABI. Invasive Species Compendium; CAB International: Wallingford, UK, 2022; Available online: www.cabi.org/isc (accessed on 30 November 2022).
  19. Johnson, M.F. A monograph of the genus Ageratum L. (Compositae-Eupatorieae). Ann. Missouri Bot. Gard. 1971, 58, 6–88. [Google Scholar] [CrossRef]
  20. SANBI, 2016. South African National Biodiversity Institute (SANBI). Declared Weeds & Alien Invader Plants. Available online: https://www.plantzafrica.com/miscell/aliens1.htm (accessed on 15 December 2022).
  21. Xie, G.; Chen, W.; Lin, M.; Zheng, Y.; Guo, P.; Zheng, Y. Ecological risk assessment with MCDM of some invasive alien plants in China. In Cutting-Edge Research Topics on Multiple Criteria Decision Making, Proceedings of the 20th International Conference, MCDM 2009, Chengdu, China, June 21–26 2009; Shi, Y., Wang, S., Peng, Y., Li, J., Zeng, Y., Eds.; Springer: Berlin/Heidelberg, Germany, 2009. [Google Scholar] [CrossRef]
  22. Halevy, A.B. Handbook of Flowering, 1st ed.; CRC Press: Boca Raton, FL, USA, 1985. [Google Scholar] [CrossRef]
  23. Almeida, J.D.D.; Freitas, H. Exotic naturalized flora of continental Portugal—A reassessment. Bot. Complut. 2006, 30, 117–130. [Google Scholar]
  24. Brown, E.A. New South Wales Flora Online: Xerochrysum Bracteatum. Royal Botanic Gardens & Domain Trust: Sydney, Australia. Available online: https://plantnet.rbgsyd.nsw.gov.au/ (accessed on 15 December 2022).
  25. Baker, M.L.; de Salas, M.F. A Census of the Vascular Plants of Tasmania and Index to the Student’s Flora of Tasmania and Flora of Tasmania Online; Tasmanian Herbarium, Tasmanian Museum and Art Gallery: Hobart, TAS, Australia, 2013; ISBN 978-1-921599-73-6. [Google Scholar]
  26. Ramasamy, S.; Rajendran, A. Occurrence of major invasives in Nilgiri Biosphere Reserve, India: Perspective and prospective. Aliens Invasive Species Bull. 2012, 32, 42–44. [Google Scholar]
  27. Missouri Botanical Garden. Plant Finder. Available online: http://www.missouribotanicalgarden.org/plantfinder/plantfindersearch.aspx (accessed on 21 February 2023).
  28. Wilson, A. Flora of Australia, Volume 37. Asteraceae; ABRS/CSIRO: Melbourne, Australia, 2015; 668p.
  29. Lichtenthaler, H.K.; Wellburn, A.R. Determinations of total carotenoids and chlorophylls a and b of leaf extracts in different solvents. Biochem. Soc. Trans. 1983, 11, 591–592. [Google Scholar] [CrossRef] [Green Version]
  30. Bates, L.S.; Waldren, R.P.; Teare, I.D. Rapid determination of free proline for water-stress studies. Plant Soil 1973, 39, 205–207. [Google Scholar] [CrossRef]
  31. Hodges, D.M.; DeLong, J.M.; Forney, C.F.; Prange, R.K. Improving the thiobarbituric acid-reactive-substances assay for estimating lipid peroxidation in plant tissues containing anthocyanin and other interfering compounds. Planta 1999, 207, 604–611. [Google Scholar] [CrossRef]
  32. Blainski, A.; Lopes, G.; Mello, J. Application and analysis of the Folin Ciocalteu method for the determination of the total phenolic content from Limonium brasiliense L. Molecules 2013, 18, 6852–6865. [Google Scholar] [CrossRef] [PubMed] [Green Version]
  33. Zhishen, J.; Mengcheng, T.; Jianming, W. The determination of flavonoid contents in mulberry and their scavenging effects on superoxide radicals. Food Chem. 1999, 64, 555–559. [Google Scholar] [CrossRef]
  34. R Core Team. R: A Language and Environment for Statistical Computing. R Foundation for Statistical Computing, 2013, Vienna, Austria. Available online: https://www.R-project.org/ (accessed on 22 November 2022).
  35. Lê, S.; Josse, J.; Husson, F. FactoMineR: An R package for multivariate analysis. J. Stat. Softw. 2008, 25, 1–18. [Google Scholar] [CrossRef] [Green Version]
  36. Venables, W.N.; Ripley, B.D. Modern Applied Statistics with S, 4th ed.; Springer: New York, NY, USA, 2002; ISBN 0-387-95457-0. [Google Scholar]
  37. Wickham, H. ggplot2: Elegant Graphics for Data Analysis [Internet]; Springer: New York, NY, USA, 2016; Available online: https://ggplot2.tidyverse.org (accessed on 22 November 2022).
  38. Pedersen, T. ggforce: Accelerating ‘ggplot2’. R Package Version 0.4.1, 2022. Available online: https://CRAN.R-project.org/package=ggforce (accessed on 22 November 2022).
  39. Taiyun, W.; Viliam, S. R Package ‘Corrplot’: Visualization of a Correlation Matrix Version 0.92. 2021. Available online: https://github.com/taiyun/corrplot (accessed on 22 November 2022).
  40. Munns, R.; Tester, M. Mechanisms of salinity tolerance. Annu. Rev. Plant Biol. 2008, 59, 651–681. [Google Scholar] [CrossRef] [Green Version]
  41. Gupta, B.; Huang, B. Mechanism of Salinity tolerance in plants: Physiological, biochemical, and molecular characterization. Int. J. Genomics 2014, 2014, 701596. [Google Scholar] [CrossRef] [Green Version]
  42. Flexas, J.; Medrano, H. Energy dissipation in C3 plants under drought. Funct. Plant Biol. 2002, 29, 1209–1215. [Google Scholar] [CrossRef]
  43. Alscher, R.G.; Cumming., J.R. Stress Responses in Plants: Adaptation and Acclimation Mechanisms; Wiley-Liss: New York, NY, USA, 1990; p. 407. [Google Scholar]
  44. Sun, J.; Gu, J.; Zeng, J.; Han, S.; Song, A.; Chen, F.; Fang, W.; Jiang, J.; Chen, S. Changes in leaf morphology, antioxidant activity and photosynthesis capacity in two different drought-tolerant cultivars of Chrysanthemum during and after water stress. Sci. Hortic. 2013, 161, 249–258. [Google Scholar] [CrossRef]
  45. Singh, B.B.; Mai-Kodomi, Y.; Terao, T. A simple screening method for drought tolerance in cowpea. Indian J. Genet. Plant Breed. 1999, 59, 211–220. [Google Scholar]
  46. Chloupek, O.; Dostál, V.; Středa, T.; Psota, V.; Dvořáčková, O. Drought tolerance of barley varieties in relation to their root system size. Plant Breed. 2010, 129, 630–636. [Google Scholar] [CrossRef]
  47. Al Hassan, M.; Chaura, J.; Donat-Torres, M.P.; Boscaiu, M.; Vicente, O. Antioxidant responses under salinity and drought in three closely related wild monocots with different ecological optima. AoB Plants 2017, 9, plx009. [Google Scholar] [CrossRef]
  48. Al Hassan, M.; Estrelles, E.; Soriano, P.; López-Gresa, M.P.; Bellés, J.M.; Boscaiu, M.; Vicente, O. Unraveling salt tolerance mechanisms in halophytes: A comparative study on four mediterranean Limonium species with different geographic distribution patterns. Front. Plant Sci. 2017, 8, 1438. [Google Scholar] [CrossRef] [Green Version]
  49. González-Orenga, S.; Plazas, M.; Ribera, E.; Pallotti, C.; Boscaiu, M.; Prohens, J.; Vicente, O.; Fita, A. Transgressive biochemical response to water stress in interspecific eggplant hybrids. Plants 2023, 12, 194. [Google Scholar] [CrossRef]
  50. Plazas, M.; González-Orenga, S.; Nguyen, H.T.; Morar, I.M.; Fita, A.; Boscaiu, M.; Prohens, J.; Vicente, O. Growth and antioxidant responses triggered by water stress in wild relatives of eggplant. Sci. Hortic. 2022, 293, 110685. [Google Scholar] [CrossRef]
  51. Kumar, A.; Singh, D.P. Use of physiological indices as a screening technique for drought tolerance in oilseed Brassica species. Ann. Bot. 1998, 81, 413–420. [Google Scholar] [CrossRef] [Green Version]
  52. Vanhove, A.C.; Vermaelen, W.; Panis, B.; Swennen, R.; Carpentier, S.C. Screening the banana biodiversity for drought tolerance: Can an in vitro growth model and proteomics be used as a tool to discover tolerant varieties and understand homeostasis. Front. Plant Sci. 2012, 3, 176. [Google Scholar] [CrossRef] [Green Version]
  53. Zhang, H.; Ni, Z.; Chen, Q.; Guo, Z.; Gao, W.; Su, X.; Qu, Y. Proteomic responses of drought-tolerant and drought-sensitive cotton varieties to drought stress. Mol. Genet. Genom. 2016, 291, 1293–1303. [Google Scholar] [CrossRef]
  54. Belluau, M.; Shipley, B. Predicting habitat affinities of herbaceous dicots to soil wetness based on physiological traits of drought tolerance. Ann. Bot. 2017, 119, 1073–1084. [Google Scholar] [CrossRef] [Green Version]
  55. Cuimei, Z.; Shangli, S.; Zhen, L.; Fan, Y.; Guoli, Y. Drought tolerance in alfalfa (Medicago sativa L.) varieties is associated with en-hanced antioxidative protection and declined lipid peroxidation. J. Plant Physiol. 2019, 232, 226–240. [Google Scholar] [CrossRef]
  56. Gambetta, G.A.; Herrera, J.C.; Dayer, S.; Feng, Q.; Hochberg, U.; Castellarin, S.D. The physiology of drought stress in grapevine: Towards an integrative definition of drought tolerance. J. Exper. Bot. 2020, 71, 4658–4676. [Google Scholar] [CrossRef] [PubMed]
  57. Pipatsitee, P.; Tisarum, R.; Samphumphuang, T.; Kongpugdee, S.; Taota, K.; Eiumnoh, A.; Cha-Um, S. Evaluation of water deficit tolerance in maize genotypes using biochemical, physio-morphological changes and yield traits as multivariate cluster analysis. Not. Bot. Horti Agrobo. 2022, 50, 12572. [Google Scholar] [CrossRef]
  58. Rajakaruna, N.; Bradfield, G.E.; Bohm, B.A.; Whitton, J. Adaptive differentiation in response to water stress by edaphic races of Lasthenia californica (Asteraceae). Int. J. Plant Sci. 2003, 164, 371–376. [Google Scholar] [CrossRef] [Green Version]
  59. Mráz, P.; Tarbush, E.; Müller-Schärer, H. Drought tolerance and plasticity in the invasive knapweed Centaurea stoebe s.l. (Asteraceae): Effect of populations stronger than those of cytotype and range. Ann. Bot. 2014, 114, 289–299. [Google Scholar] [CrossRef] [PubMed] [Green Version]
  60. Hair, F.F.; Anderson, R.E.; Tatham, R.L.; Black, W.C. Multivariate Data Analysis, 5th ed.; Prentice-Hall Inc.: Upple Saddle River, NJ, USA, 1998; pp. 239–325. [Google Scholar]
  61. Nielsen, J.P.; Munck, L. Evaluation of malting barley quality using exploratory data analysis. I. Extraction of information from micromalting data of spring and winter barley. J. Cereal Sci. 2003, 38, 173–180. [Google Scholar] [CrossRef]
  62. Ahmed, K.; Shabbir, G.; Ahmed, M.; Shah, K.N. Phenotyping for drought resistance in bread wheat using physiological and biochemical traits. Sci. Total Environ. 2020, 729, 139082. [Google Scholar] [CrossRef]
  63. Arteaga, S.; Yabor, L.; Díez, M.J.; Prohens, J.; Boscaiu, M.; Vicente, O. The use of proline in screening for tolerance to drought and salinity in common bean (Phaseolus vulgaris L.) genotypes. Agronomy 2020, 10, 817. [Google Scholar] [CrossRef]
  64. Zou, J.; Hu, W.; Li, Y.; He, J.; Zhu, H.; Zhou, Z. Screening of drought resistance indices and evaluation of drought resistance in cotton (Gossypium hirsutum L.). J. Integr. Agric. 2020, 19, 495–508. [Google Scholar] [CrossRef]
  65. Conti, V.; Romi, M.; Parri, S.; Aloisi, I.; Marino, G.; Cai, G.; Cantini, C. Morpho-physiological classification of italian tomato cultivars (Solanum lycopersicum L.) according to drought tolerance during vegetative and reproductive growth. Plants 2021, 10, 1826. [Google Scholar] [CrossRef]
  66. Aminzadeh, B.; Sani, B.; Alizadeh, B.; Mozaffari, H. Identification of drought tolerant oilseed rape genotypes using multivariate analysis. J. Crop Breed. 2002, 14, 75–84. [Google Scholar]
  67. Budzinski, I.G.F.; de Moraes, F.E.; Cataldi, T.R.; Franceschini, L.M.; Labate, C.A. Network analyses and data integration of proteomics and metabolomics from leaves of two contrasting varieties of sugarcane in response to drought. Front. Plant Sci. 2019, 10, 1524. [Google Scholar] [CrossRef] [Green Version]
  68. Kamphorst, S.H.; Gonçalves, G.M.B.; Do Amaral, A.T.; De Lima, V.J.; Leite, J.T.; Schmitt, K.F.M.; Dos Santos, D.R.; Santos, J.S.; De Oliveira, F.T.; Corrêa, C.C.G.; et al. Screening of popcorn genotypes for drought tolerance using canonical correlations. Agronomy 2020, 10, 1519. [Google Scholar] [CrossRef]
  69. Legendre, P.; Birks, H.J.B. From Classical to canonical ordination. In Tracking Environmental Change Using Lake Sediments; Springer: Dordrecht, The Netherlands, 2012; pp. 201–248. [Google Scholar]
  70. Szabados, L.; Savouré, A. Proline: A multifunctional amino acid. Trends Plant Sci. 2010, 15, 89–97. [Google Scholar] [CrossRef]
  71. Kaur, G.; Asthir, B. Proline: A key player in plant abiotic stress tolerance. Biol. Plant. 2015, 59, 609–619. [Google Scholar] [CrossRef]
  72. Hayat, S.; Hayat, Q.; Alyemeni, M.N.; Wani, A.S.; Pichtel, J.; Ahmad, A. Role of proline under changing environments: A review. Plant Signal. Behav. 2012, 7, 1456–1466. [Google Scholar] [CrossRef] [Green Version]
  73. Ghosh, U.K.; Islam, M.N.; Siddiqui, M.N.; Cao, X.; Khan, M.A.R. Proline, a multifaceted signalling molecule in plant responses to abiotic stress: Understanding the physiological mechanisms. Plant Biol. 2022, 24, 227–239. [Google Scholar] [CrossRef]
  74. Mafakheri, A.; Siosemardeh, A.; Bahramnejad, B.; Struik, P.C.; Sohrabi, Y. Effect of drought stress on yield, proline and chloro-phyll contents in three chickpea cultivars. Aust. J. Crop Sci. 2010, 8, 580–585. [Google Scholar]
  75. Mwadzingeni, L.; Shimelis, H.; Tesfay, S.; Tsilo, T.J. Screening of bread wheat genotypes for drought tolerance using phenotypic and proline analyses. Front. Plant Sci. 2016, 7, 1276. [Google Scholar] [CrossRef] [Green Version]
  76. Al Hassan, M.; López-Gresa, M.P.; Boscaiu, M.; Vicente, O. Stress tolerance mechanisms in Juncus: Responses to salinity and drought in three Juncus species adapted to different natural environments. Funct. Plant Biol. 2016, 43, 949. [Google Scholar] [CrossRef]
  77. Al Hassan, M.; Pacurar, A.; López-Gresa, M.P.; Donat-Torres, M.P.; Llinares, J.V.; Boscaiu, M.; Vicente, O. Effects of salt stress on three ecologically distinct Plantago species. PLoS ONE 2016, 11, e0160236. [Google Scholar] [CrossRef] [Green Version]
  78. Chen, Z.; Cuin, T.; Zhou, M.; Twomei, A.; Naidu, B.; Shabala, S. Compatible solute accumulation and stress-mitigating effects in barley genotypes contrasting in their salt tolerance. J. Exp. Bot. 2007, 58, 4245–4255. [Google Scholar] [CrossRef] [PubMed] [Green Version]
  79. Kozminska, A.; Al Hassan, M.; Hanus-Fajerska, E.; Naranjo, M.A.; Vicente, O.; Boscaiu, M. Comparative analysis of water deficit and salt tolerance mechanisms in Silene. S. Afr. J. Bot. 2018, 117, 193–206. [Google Scholar] [CrossRef]
  80. Baker, H.G. The evolution of weeds. Annu. Rev. Ecol. Syst. 1974, 5, 1–24. [Google Scholar] [CrossRef]
  81. Davidson, A.M.; Jennions, M.; Nicotra, A.B. Do invasive species show higher phenotypic plasticity than native species and, if so, is it adaptive? A meta-analysis. Ecol. Lett. 2011, 14, 419–431. [Google Scholar] [CrossRef]
  82. Granata, M.U.; Bracco, F.; Catoni, R. Phenotypic plasticity of two invasive alien plant species inside a deciduous forest in a strict nature reserve in Italy. J. Sustain. For. 2020, 39, 346–364. [Google Scholar] [CrossRef]
  83. Fakhr, M.A.; Mazrou, Y.S.A.; Ellmouni, F.Y.; ElSaied, A.; Elhady, M.; Elkelish, A.; Nour, I.H. Investigating the phenotypic plasticity of the invasive weed Trianthema portulacastrum L. Plants 2021, 11, 77. [Google Scholar] [CrossRef]
  84. Griffith, A.B.; Andonian, K.; Weiss, C.P.; Loik, M.E. Variation in phenotypic plasticity for native and invasive populations of Bromus tectorum. Biol. Invasions 2014, 16, 2627–2638. [Google Scholar] [CrossRef] [Green Version]
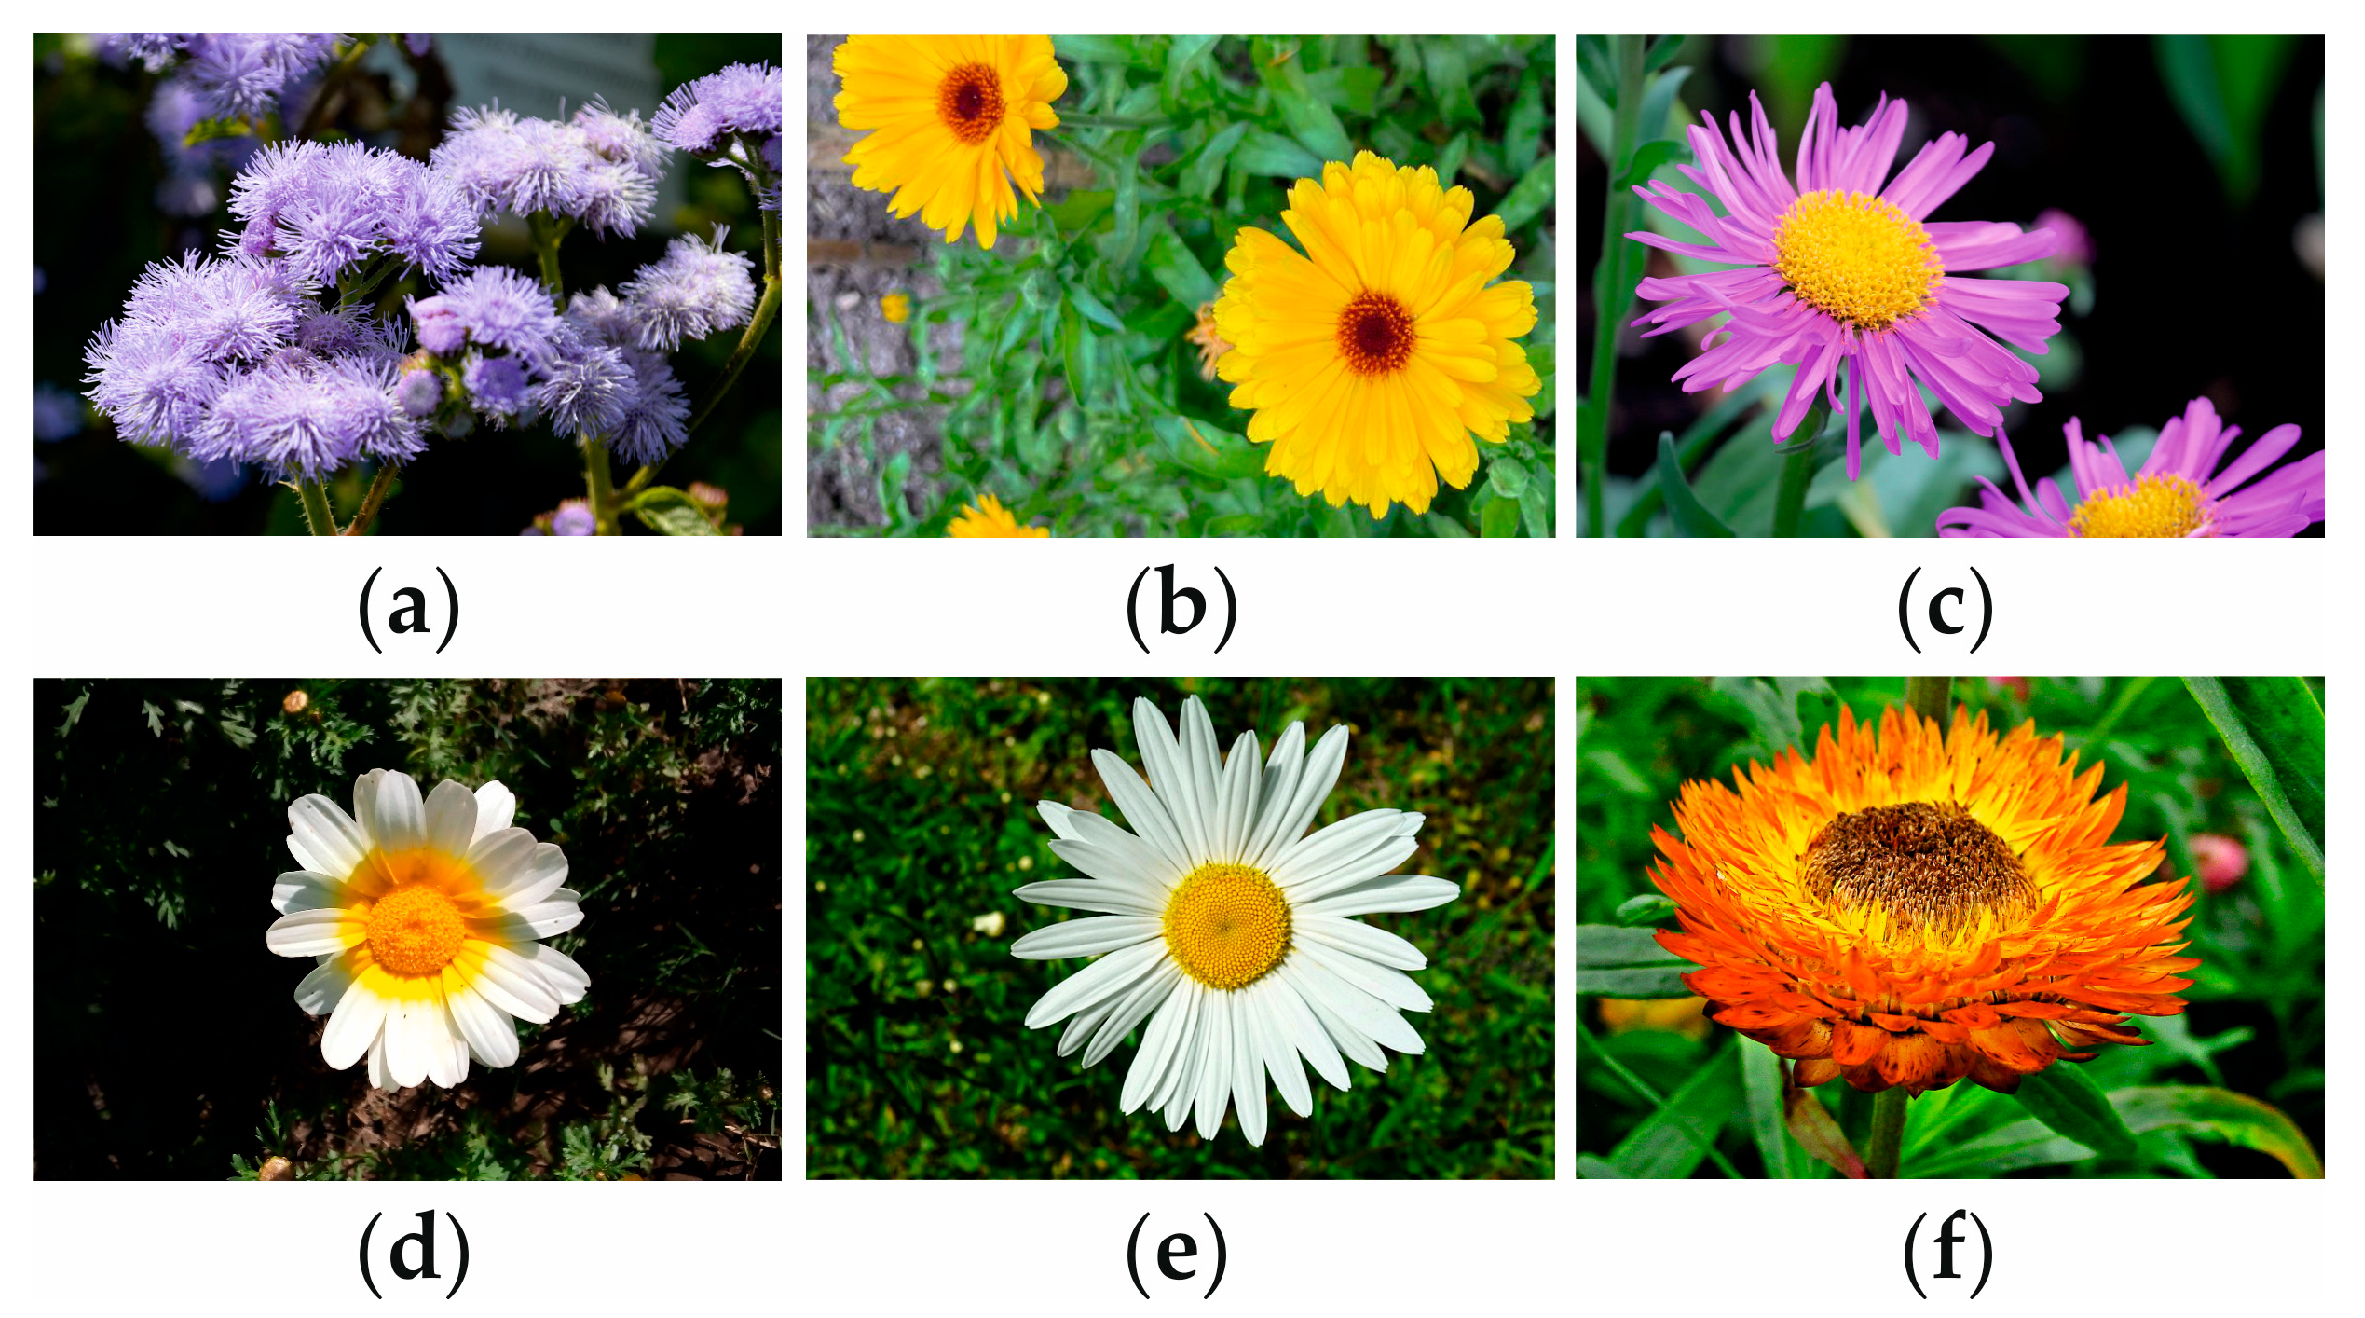
Figure 1. The six ornamental Asteraceae species studied: Ageratum houstonianum (a), Calendula officinalis (b), Callistephus chinensis (c), Glebionis carinata (d), Leucanthemum vulgare (e), Xerochrysum bracteatum (f).
Agronomy 13 00687 g001
Figure 2. Effect of water stress on the shoot length (a) and number of leaves (b) in the six investigated Asteraceae species. Bars indicate mean values with SE (n = 5) of percentage relative to the control averages for each species, shown in Table 1. Different lowercase letters indicate significant differences between treatments (CON—control, IWS—intermediate water stress, and SWS—severe water stress) per species, according to the Tukey test (p < 0.05).
Agronomy 13 00687 g002
Figure 3. Effect of water stress on the root length (a), fresh weight (FW) (b) and water content (WC) (c) in the six Asteraceae species. Bars indicate mean values with SE (n = 5) of percentage relative to the control averages for each species, shown in Table 1. Different lowercase letters indicate significant differences between treatments (CON—control, IWS—intermediate water stress, and SWS—severe water stress) per species, according to the Tukey test (p < 0.05).
Agronomy 13 00687 g003aAgronomy 13 00687 g003b
Figure 4. Effect of water stress on the shoot fresh weight (FW) (a) and water content (WC) (b) in the six Asteraceae species. Bars indicate mean values with SE (n = 5) of percentage relative to the control averages for each species, shown in Table 1. Different lowercase letters indicate significant differences between treatments (CON—control, IWS—intermediate water stress, and SWS—severe water stress) per species, according to the Tukey test (p < 0.05).
Agronomy 13 00687 g004
Figure 5. Effect of water stress on the total dry weight in the six Asteraceae species. Bars indicate mean values with SE (n = 5) of percentage relative to the control averages for each species, shown in Table 1. Different lowercase letters indicate significant differences between treatments (CON—control, IWS—intermediate water stress, and SWS—severe water stress) per species, according to the Tukey test (p < 0.05).
Agronomy 13 00687 g005
Figure 6. PCAcon biplot. Pink circles indicate the barycentres of the six studied species, whereas the green squares represent the 17 measured traits under control conditions (i.e., no drought stress). Abbreviations: shoot fresh weight (FWs), shoot dry weight (DWs), root fresh weight (FWr), root dry weight (DWr), total dry weight (TDW), shoot water content (WCs), root water content (WCr), shoot length (SL), root length (RL), leaf number (Ln), chlorophyll a (Chl a), chlorophyll b (Chl b), carotenoids (Caro), proline (PRO), total flavonoids (TF), total phenolic compounds (TPC), malondialdehyde (MDA).
Agronomy 13 00687 g006
Figure 7. CVAcon biplot. Different colours and shapes distinguish individuals from different group species. The solid inner circles represent the 95% tolerance region for the population mean; the outer dotted circles represent the 95% confidence region of the group means. The coloured rugs above the x-axis represent the projection of the individuals belonging to each group.
Agronomy 13 00687 g007
Figure 8. PCAiws biplot. Pink circles indicate the barycentres of the six studied species, whereas the green squares represent the 17 measured traits under intermediate water stress conditions (i.e., no drought stress). Abbreviations: shoot fresh weight (FWs), shoot dry weight (DWs), root fresh weight (FWr), root dry weight (DWr), total dry weight (TDW), shoot water content (WCs), root water content (WCr), shoot length (SL), root length (RL), leaf number (Ln), chlorophyll a (Chl a), chlorophyll b (Chl b), carotenoids (Caro), proline (PRO), total flavonoids (TF), total phenolic compounds (TPC), malondialdehyde (MDA).
Agronomy 13 00687 g008
Figure 9. CVAiws biplot. Different colours and shapes distinguish individuals from different group species. The solid inner circles represent the 95% tolerance region for the population mean; the outer dotted circles represent the 95% confidence region of the group means. The coloured rugs above the x-axis represent the projection of the individuals belonging to each group.
Agronomy 13 00687 g009
Figure 10. PCAsws biplot. Pink circles indicate the barycentres of the six studied species, whereas the green squares represent the 17 measured traits under severe water stress conditions (i.e., no drought stress). Abbreviations: shoot fresh weight (FWs), shoot dry weight (DWs), root fresh weight (FWr), root dry weight (DWr), total dry weight (TDW), shoot water content (WCs), root water content (WCr), shoot length (SL), root length (RL), leaf number (Ln), chlorophyll a (Chl a), chlorophyll b (Chl b), carotenoids (Caro), proline (PRO), total flavonoids (TF), total phenolic compounds (TPC), malondialdehyde (MDA).
Agronomy 13 00687 g010
Figure 11. CVAsws biplot. Different colours and shapes distinguish individuals from different group species. The solid inner circles represent the 95% tolerance region for the population mean; the outer dotted circles represent the 95% confidence region of the group means. The coloured rugs above the x-axis represent the projection of the individuals belonging to each group.
Agronomy 13 00687 g011
Figure 12. Correlation network diagram displaying significant correlations (p < 0.05) between the 17 measured traits under control, intermediate, and severe water-stress conditions for the six species under analysis. Each node depicts a variable, and highly correlated variables are clustered together. Each path represents a correlation between the two traits it joins. A violet path indicates a positive correlation, and a green path indicates a negative correlation. Only significant correlations are illustrated. The width and transparency of the stripes express the strength of the correlation (wider and less transparent = stronger correlation). Abbreviations: shoot fresh weight (FWs), shoot dry weight (DWs), root fresh weight (FWr), root dry weight (DWr), total dry weight (TDW), shoot water content (WCs), root water content (WCr), shoot length (SL), root length (RL), leaf number (Ln), chlorophyll a (Chl a), chlorophyll b (Chl b), carotenoids (Caro), proline (PRO), total flavonoids (TF), total phenolic compounds (TPC), malondialdehyde (MDA).
Agronomy 13 00687 g012
Table 1. Growth parameters of non-stressed plants from the control treatment in the selected species. Mean values followed by SE, n = 5. Abbreviations: shoot length (SL), leaf number (Ln), root length (RL), root fresh weight (FWr), root dry weight (DWr), root water content (WCr), shoot fresh weight (FWs), shoot dry weight (DWs), shoot water content (WCs), total dry weight (TDW).
ParameterA. houstonianumC. officinalisC. chinensisG. carinataL. vulgareX. bracteatum
SL (cm)16.6 ± 1.024.8 ± 0.914.3 ± 3.215.5 ± 0.910.1 ± 0.411.3 ± 1.4
Ln15.4 ± 2.216.0 ± 1.018.0 ± 0.940.2 ± 3.723.0 ± 4.521.0 ± 1.5
RL (cm)29.7 ± 2.627.9 ± 2.135.0 ± 2.534.0 ± 8.632.3 ± 2.929.3 ± 3.8
FWr (g)6.3 ± 1.91.4 ± 0.45.1 ± 1.24.5 ± 1.05.4 ± 0.84.6 ± 0.1
DWr (g)1.3 ± 0.30.8 ± 0.20.8 ± 0.10.6 ± 0.20.8 ± 0.11.0 ± 0.1
WCr (%)78.9 ± 0.239.2 ± 6.283.3 ± 0.284.8 ± 3.085.4 ± 0.777.0 ± 2.3
FWs (g)8.0 ± 2.519.4 ± 1.58.5 ± 3.514.0 ± 2.017.3 ± 0.910.3 ± 1.6
DWs (g)0.8 ± 0.22.0 ± 0.31.3 ± 0.31.3 ± 0.31.5 ± 0.12.0 ± 0.1
WCs (%)89.3 ± 0.589.5 ± 1.674.5 ± 11.890.4 ± 1.791.2 ± 0.879.0 ± 1.7
TDW (g)2.1 ± 0.62.8 ± 0.42.2 ± 0.42.0 ± 0.52.3 ± 0.33.1 ± 0.0
Table 2. Effect of intermediate water stress (IWS) and severe water stress (SWS) on the measured photosynthetic pigments, osmolytes, and antioxidant compounds. Mean values ± SE (n = 5) of chlorophylls a and b (Chl a and Chl b), carotenoids (Caro), proline (PRO), malondialdehyde (MDA), total phenolic compounds (TPC), and total flavonoids (TF) contents. Different lowercase letters indicate significant differences between treatments for each species and measured parameter, according to the Tukey test (p < 0.05). GA: gallic acid; C: catechin.
ParameterTreatmentA.
houstonianum
C.
officinalis
C.
chinensis
G.
carinata
L.
vulgare
X.
bracteatum
Chl a
(mg g−1 DW)
CON6.5 ± 0.8 a5.6 ± 1.2 a4.4 ± 1.1 a4.3 ± 1.0 a6.3 ± 0.3 a9.0 ± 2.6 a
IWS4.4 ± 0.5 a4.6 ± 0.6 a4.5 ± 1.2 a4.5 ± 0.4 a6.1 ± 0.5 a7.2 ± 0.8 a
SWS8.7 ± 4.5 a9.4 ± 2.1 a3.8 ± 0.2 a6.2 ± 0.3 a4.5 ± 0.7 a7.5 ± 0.3 a
Chl b
(mg g−1 DW)
CON2.0 ± 0.1 a1.6 ± 0.2 a1.4 ± 0.4 a1.7 ± 0.5 a2.4 ± 0.1 a4.2 ± 1.9 a
IWS1.4 ± 0.0 a1.6 ± 0.2 a1.3 ± 0.3 a1.8 ± 0.2 a2.2 ± 0.2 a2.5 ± 0.3 a
SWS4.6 ± 3.1 a3.7 ± 0.7 b1.3 ± 0.1 a2.6 ± 0.1 a1.8 ± 0.2 a3.5 ± 0.1 a
Caro
(mg g−1 DW)
CON1.2 ± 0.1 a0.7 ± 0.1 a0.6 ± 0.1 a0.9 ± 0.2 a0.8 ± 0.1 a1.3 ± 0.3 a
IWS0.8 ± 0.1 a0.7 ± 0.1 a0.7 ± 0.1 a0.8 ± 0.1 a1.1 ± 0.2 a1.3 ± 0.1 a
SWS1.3 ± 0.8 a1.2 ± 0.2 a0.8 ± 0.0 a1.8 ± 0.6 a0.7 ± 0.1 a3.1 ± 1.7 a
PRO
(µmol g−1 DW)
CON3.2 ± 1.3 a6.5 ± 2.9 a2.5 ± 0.3 a8.0 ± 2.3 a3.2 ± 1.0 a98.0 ± 13.6 a
IWS14.5 ± 3.6 a31.9 ± 5.9 b1.2 ± 0.3 a28.0 ± 8.9 ab2.1 ± 0.5 a137.8 ± 12.0 ab
SWS53.9 ± 11.7 b40.9 ± 5.1 b13.3 ± 2.6 b43.0 ± 3.8 b9.4 ± 2.1 b154.9 ± 12.4 b
MDA
(nmol g−1 DW)
CON427.0 ± 56.6 a395 ± 41.6 a502.9 ± 131.3 a458.9 ± 142.5 a1281.3 ± 184.4 a428.7 ± 53.6 a
IWS372.9 ± 82.4 a308.8 ± 42.2 a537.0 ± 137.1 a421.4 ± 124.2 a1283.6 ± 226.8 a499.1 ± 100.4 a
SWS716.9 ± 216.3 a347.8 ± 48.9 a249.2 ± 52.2 a326.0 ± 124.4 a2033.7 ± 479.9 a244.9 ± 24.7 a
TF
(mg eq. C g−1 DW)
CON22.5 ± 5.5 a5.6 ± 1.0 a7.1 ± 2.4 a3.0 ± 0.6 a8.7 ± 1.6 a53.3 ± 14.4 a
IWS10.8 ± 3.0 a3.7 ± 0.5 a19.4 ± 7.3 a4.4 ± 0.9 a7.6 ± 1.3 a54.9 ± 11.8 a
SWS7.6 ± 5.0 a5.2 ± 0.6 a8.4 ± 2.7 a5.2 ± 0.7 a5.7 ± 0.6 a23.8 ± 4.1 a
TPC
(mg eq. GA g−1 DW)
CON26.8 ± 5.0 a8.1 ± 1.1 a13.5 ± 3.3 a13.9 ± 4.2 a11.4 ± 1.2 a14.0 ± 4.2 a
IWS16.3 ± 4.6 a6.5 ± 0.2 a18.9 ± 5.2 a11.3 ± 1.3 a14.3 ± 2.3 a16.6 ± 1.4 a
SWS16.9 ± 8.0 a7.4 ± 0.9 a12.6 ± 1.8 a10.5 ± 3.5 a12.6 ± 2.4 a9.4 ± 1.5 a
Disclaimer/Publisher’s Note: The statements, opinions and data contained in all publications are solely those of the individual author(s) and contributor(s) and not of MDPI and/or the editor(s). MDPI and/or the editor(s) disclaim responsibility for any injury to people or property resulting from any ideas, methods, instructions or products referred to in the content.