Article

Dynamic Optimization of Greenhouse Tomato Irrigation Schedule Based on Water, Fertilizer and Air Coupled Production Function

1
School of Water Conservancy, North China University of Water Resources and Electric Power, Zhengzhou 450046, China
2
Institute of Plant Nutrition, Agricultural Resources and Environmental Science, Henan Academy of Agricultural Sciences, Zhengzhou 450002, China
*
Author to whom correspondence should be addressed.
Agronomy 2023, 13(3), 776; https://doi.org/10.3390/agronomy13030776
Submission received: 31 January 2023 / Revised: 4 March 2023 / Accepted: 6 March 2023 / Published: 7 March 2023

Abstract

:
A vegetable water production function has been one of the most significant parameters to improve the use efficiency and economic benefit of agricultural water in the greenhouse. Meanwhile, aerated irrigation unlocks the high yield potential for greenhouse crop production. Thus, water, fertilizer and air coupled production function is proposed for the optimization of the irrigation scheme during the greenhouse tomato growth period. Two seasons of greenhouse tomato experiments were conducted under aerated subsurface drip irrigation (ASDI). There were three nitrogen application rates (N1, 120 kg ha−1; N2, 180 kg ha−1; N3, 240 kg ha−1) and three aeration rates with dissolved oxygen (DO) in irrigation water (A2, 15 mg L−1; A3, 40 mg L−1 and A1, 5 mg L−1 in the non-aeration treatment) in the first crop season, while three irrigation rates of soil moisture content (W1, 50–60% field capacity; W2, 60–70% field capacity; W3, 70–80% field capacity) and two aeration rates with DO in irrigation water (25 mg L−1 and 5 mg L−1) in the second crop season. The potential yield function of tomato was constructed, and the water sensitivity index was resolved. The production function of greenhouse tomato under water, fertilizer, and air coupled irrigation was established based on the Jensen function. The water allocation scheme under multiple irrigation quotas was optimized by the dynamic programming (DP) method. The results showed that with the elapse of crop growth stages, the cumulative curve of the water sensitivity index showed an S-shaped curve, which first rose slowly and then fast, and eventually tended to be stable. The optimized irrigation increased the yield by 4.25% averagely compared with the irrigation method of fixed moisture content interval, while the crop yield in the optimized ASDI increased by 26.13% compared with non-aeration treatment. In summary, the optimal combination was the aeration rate DO of 24.55mg L−1 in irrigation water and nitrogen application rate of 281.43 kg ha−1, and the irrigation quota of 420 mm. The net yield increased by 11,012 USD ha−1 in a single crop season when compared with the non-aeration treatment. The results would provide a reference method for the optimization of technical parameters of water—fertilizer—air coupled irrigation.

1. Introduction

China has only half the world’s water resources per unit of arable land. In 2021, the total agricultural water use in China was 364.43 billion m3, accounting for 61.5% of the total national water use [1]. However, in some water shortage areas, the overdevelopment of agriculture and the low efficiency of water use have further aggravated the regional water shortage and caused ecological and environmental degradation. To solve the contradiction between water shortage and irrigation water increase, it is urgent to reduce irrigation water consumption and developed efficient water-saving irrigation technology. Subsurface drip irrigation (SDI) is very popular due to its high irrigation efficiency and water use efficiency (WUE). However, the rhizosphere saturation wetting fronts [2] lead to a low oxygen diffusion rate and poor soil aeration [3], restricting the crop yield increase [4]. Through the delivery of the microbubbles or water-air mixture to the rhizosphere, aerated subsurface drip irrigation (ASDI) can alleviate the weak soil permeability caused by long-term SDI, improve crop hypoxia [5] and increase soil enzyme activity, thus increasing crop yield [6] and fruit quality [7]. Numerous studies have shown that ASDI can promote growth and increase crop yield, such as tomato [8], pepper [9], cucumber and melon [10]. Tomato has become one of the most popular vegetables worldwide because of its high nutrition and large cultivation area [11,12]. However, tomatoes are both sensitive to soil moisture and the inter-root hypoxic stress because intensive cropping and mechanical compaction reduce the soil fertility [13]. Scientific and rational irrigation and fertilization practices are of vital importance for high fruit quality, and efficient production and sustainable agricultural development. However, few studies have been reported on the effect of ASDI on yield under different water and fertilizer management.
The crop water production function (WPF) can be used to quantify the relationship between crop water consumption and yield, and it is an effective method to increase crop yield, reduce water use, and ensure the cost-effectiveness of agricultural water use [14]. It is of great significance for crop irrigation management and high quality, and efficient production to reflect crop water demand patterns through water sensitivity at different cropping stages [15]. Some research work have been done on water production functions, and the current water production models mainly include the full-fertility linear Stewart model, the full-fertility nonlinear Hiler-Clark model, the growth stage with the addition of Blank, the Paredes model and the growth stage with multiplication of Jensen model. Among them, the Jensen model has been widely used because of its advantages in the fitting effect and simple structure. By the comparison of five commonly used crop water production functions, Ren et al. [16] suggested that the Jensen model could accurately describe the potato water production function in the Yang-Huang irrigation area in Ningxia, China. A water production function for pepper using the Jensen model by Wang et al. [17] indicated that a soil water content at 75–85% field capacity during the flowering period can ensure high pepper yield. These studies divided the crop growth process into 3–5 stages, and there were some problems in this discrete treatment. The subdivisions of crop growth stage affected the size and stability of the derived moisture sensitivity index, as well as the number of experimental treatments [18]. Wang et al. [19] proposed a winter wheat moisture sensitivity index to eliminate the contradiction between the number of stage divisions and the proposed scheme by using a crop growth function. Based on the Jensen, a multiplicative model combined with the water deficit index of root-weighted soil water effectiveness was established by Wu et al. [20] showed a good accuracy in predicting crop yield and the optimization of winter wheat irrigation system.
However, few water production functions can be directly applied to yield prediction because both nitrogen application and aeration rate affect the maximum crop yield. Based on water production function and on consideration of the influence of nitrogen dosage, some researchers established a dynamic water and nitrogen production function by introducing nitrogen effect function instead of potential yield, and obtained better fitting on tomato [21]. This also provides an idea for the construction of water production function under ASDI. However, these studies only obtained the appropriate water cut interval or irrigation amount in the limited experimental scheme, and no solution was proposed for the optimization of irrigation water allocation during the growth period. Given that optimization models have been widely used in the planning and crop management [22,23,24], various optimization techniques, including linear programming, nonlinear programming and dynamic programming, can be used to resolve the optimal solutions for some objective function problems with constraints. If the water, fertilizer and air coupled production function is combined with the water balance equation, the output objective function is established. Then the optimal water allocation strategy with multiple irrigation quotas can be obtained.
In general, previous research includes the effects of water and nitrogen on tomato yield and production function, but there are few literatures on the optimization of irrigation systems, the crop yield projection and economic benefit through production function, especially under ASDI conditions. Here, it is assumed that similar to the nitrogen application rate, the aeration rate will only affect the potential yield but not alter the phase moisture sensitivity index. The fertilizer—air yield regression formula combined with the water production function can be used to predict the crop yield. Two seasons of greenhouse experiments were conducted under ASDI in Henan province, China. Two irrigation methods and soil moisture treatments at various growth stages were set to study the effects of ASDI on the water consumption characteristics and crop yield of greenhouse tomato. Specifically, this study aims to (1) establish water, fertilizer, and air coupled production functions of tomato water regulation at different growth stages based on the Jensen model; (2) resole the maximum potential yield of fertilizer and air combination parameters, and subdivide the crop growth stage by water sensitive index curve; (3) optimize the water distribution scheme of tomato high yield under multiple irrigation quotas via dynamic programming method, and thus provide the theoretical basis for the popularization and application of ASDI in greenhouse cultivation.

2. Materials and Methods

2.1. Overview of the Study Area

The experiments were conducted in the modern greenhouse (113.47′20.15″ E, 34.47′ 5.91″ N) at the Agricultural High-Efficient Water Use Test Site of North China University of Water Resources and Hydropower, located in Zhengzhou Henan Province, China (34°47′ N, 113°46′ E, altitude 110.4 m). In the first crop season, the tomato seedlings were transplanted on 9 March 2019, and harvested on 10 July 2019. In the second crop season, the tomato seedlings were transplanted on 14 September 2021, and harvested on 13 January 2022. The study area belongs to a temperate continental climate, with a long-term annual mean air temperature of 17.1 °C. The annual mean precipitation is 630 mm, 2400 annual sunshine hours, and 220 d frost free period. The solar greenhouse is a ridge-type structure that spans 9.6 m and has a bay of 4 m, for a total area of 537.6 m2. As is common for the area, the greenhouse is configured east–west to trap maximize solar radiation. It is equipped with a meteorological observation station inside the greenhouse, fans and wet curtains are installed both in the south and north site to adjust the air temperature and humidity.

2.2. Experimental Materials

The tested soil was clay loamy soil. At the 0–40 cm soil depths, pH was 7.32, with soil organic matter content 20.84 g kg−1, soil nitrate nitrogen 49.81 mg kg−1, ammonium nitrogen 3.07 mg kg−1, available potassium 3.42 mg kg−1, available phosphorus 9.98 mg kg−1. The average bulk density of soil in the 0–40 cm depth layer was 1.37 g cm−3. The average field capacity was 30.02% by mass. The soil particle composition was as follows: sand particle mass fraction (0.02–2 mm), 42.54%; silt particle mass fraction (0.002–0.02 mm), 36.51%, and clay particle mass fraction (<0.002 mm), 20.95%. The tested tomato variety Solanum lycopersicon L. was “Dongsheng 6876”.

2.3. Experimental Design

2.3.1. Field Management and Water, Fertilizer and Air Treatment

The tomato seedlings in both crop seasons were transplanted at 4—leaf or 5—leaf and 1 heart. The seedlings were watered well on the day of transplanting, the film was covered two weeks after transplanting, the vines were hanged when the plant height reached 30–40 cm, and the plants were topped when they had three ears of fruit. The potential yield experiment was conducted in 2019, and the deficit irrigation experiment was conducted in 2021. The division of tomato growth period was shown in Table 1.
During the first crop season in 2019, two rates of aeration (ASDI) were set at 15 and 40 mg L−1 dissolved oxygen (DO) in irrigation water, which were named A2 and A3. A control treatment (CK) was irrigated with of groundwater A1 (DO at 5 mg L−1). Three rates of nitrogen application were set at 120, 180 and 240 kg ha−1, named N1, N2 and N3, respectively. There were 10 repetitions in each treatment. Irrigation event was carried out every 5–10 d to ensure that the water content of the treated soil was above 70% of the field capacity. The irrigation amount is the cumulative evaporation from a standard evaporator with a diameter of 20 mm for the whole cropping period. A micro-nano bubble generator produces pure oxygen using the principle of pressure swing adsorption separation to yield ultra-high pure oxygen (99.99%), and DO in aeration water was produced through the circulation in an external water storage tank. The aeration rate of irrigation amount can be changed by adjusting the opening of the valve. The water outlet of the circulating aerator was connected to the main water supply pipe and equipped with a pressure gauge and a DO value probe. Thus, the water-air mixture with the target aeration rate was delivered to the soil in the crop root zone via SDI system.
In the second crop season in 2021, ASDI (DO at 25 mg L−1) and non-aeration treatment (DO at 5 mg L−1) were set up. Three growth stages included seedling stage, flowering and fruit-setting stage and maturity stage. The growth stage adopted an orthogonal experimental design with three irrigation rates (soil moisture content is 70–80%, 60–70% and 50–60% of field capacity, respectively), and three non-aeration treatments (T1, T4, T6) are set in comparison with ASDI (T8, T11, T12). There were 12 treatments in the experiment, and 10 replicates for each treatment. Irrigation was conducted every 5–10 d to ensure that the water content of all treated soil was within the range. The test design was shown in Table 2. The nitrogen application rate was 240 kg ha−1.
Both the tomato experiments were conducted in planting bucket and were fully buried to simulate the microenvironment for crop growth in the field. The planting bucket was cylindrical, 30 cm in diameter and 40 cm in height. One plant is transplanted in each bucket, with 30 cm in spacing and 80 cm in rows. A Netafim dripper (NETAFIM (Beijing) Agricultural Technology Co., Ltd.) was buried about 15 cm from the soil surface in the center of each bucket. The irrigation pressure was 0.1 MPa, and the rated flow rate of the dripper was 2.7 L h−1.
The sources of N, P and K fertilizers used in the two experiments were urea (N ≥ 46%), calcium phosphate (P2O5 ≥ 16%) and potassium sulfate (K2O ≥ 52%) respectively. The split of nitrogen fertilizer was applied at 5 times at the rate of 1/8, 1/8, 1/4, 1/4, 1/4 of the total nitrogen fertilizer on the 10th, 25th, 46th, 60th and 70th d after transplantation. As a base fertilizer, the potassium fertilizer dosage was 200 kg ha−1, and the phosphate fertilizer dosage was 160 kg ha−1.

2.3.2. Calculation of Soil Moisture Content and Crop Water Consumption

Soil Moisture Content

The moisture content could be determined every 5–10 d to guide irrigation. Soil samples in soil profile with a soil depth of 0–40 cm was taken by soil drill in every 10 cm, and soil moisture content was determined by drying method. For example, the soil moisture dynamics in the soil wetting layer was taken as the irrigation basis by setting the soil wetting layer 20 cm at seedling stage, 30 cm at the flowering and fruit-setting stage, and 40 cm at the maturity period, and the soil moisture dynamics within 0–40 cm was used for calculating the crop water consumption [17]. When the soil moisture reaches or approaches the lower limit of the soil moisture content, the soil should be irrigated immediately to the upper limit of soil moisture. Irrigation was calculated by the following formula:
M = 10 γ i h i θ i m θ i
where M is the irrigation amount, mm; γi is the dry bulk density of the soil in layer i, g cm−3; hi is the thickness of soil layer i, cm; θim is the upper limit of mass soil water content in the soil layer i, %; θi is the mass soil moisture content, %.

Crop Water Consumption

The water demand of tomato crops is calculated by the soil water balance equation, and the calculation formula is:
E r = 10 j = 1 n r j H j W j 1 W j 2 + M + P + K C
where Er is the crop water consumption in a certain period, mm; j is the number of soil layer; Hj is the thickness of soil layer j, cm; rj is the soil bulk density of layer j, g cm−3; Wj1, Wj2 are the mass soil moisture content in the j layer soil at the beginning and end of a certain measurement period, %; M is the irrigation amount in the time interval, mm; P is the rainfall in a certain period of time, mm; K is the recharge of deep water, mm; C is the deep leakage, mm. There is no rain in the greenhouse, and no deep-water supply and leakage in the bucket as well. So, P, K and C are all set to 0. Simplify the above formula as below:
E r = 10 j = 1 n r j H j W j 1 W j 2 + M

Tomato Yield and Water and Nitrogen Use Efficiency

After entering to the maturity stage of tomato, four plants were selected for labeling, and then picked on by on when it was ripe. The quality of single harvest was recorded with 0.01 g electronic balance, the yield per plant was calculated after the harvest of fruit, and the unit yield Y was converted by the area of the bucket-loaded plot. The WUE and nitrogen partial productivity (NPFP) are:
W U E = Y / E T c × 100
P F P N = Y / N × 1000
where WUE is water use efficiency, kg m−3; Y is the total output, t ha−1; ETc is the crop water consumption, mm. PFPN is the partial productivity of nitrogen fertilizer, kg kg−1; N is the total fertilizer input during whole growth period, kg ha−1.

2.4. Research Methods

2.4.1. Production Function Model of Water, Fertilizer and Air

The Jensen water production function was constructed based on the experimental data in the second crop season, and the formula is as bellows:
Y a Y m = i = 1 n E T a E T m i λ i
where: Ya is the actual yield under deficit irrigation conditions, t ha−1; Ym is the yield of full irrigation during the whole growth period, t ha−1; ETa is the actual evapotranspiration at a certain growth stage, mm; ETm is the evapotranspiration of sufficient irrigation at a certain growth stage, mm; i is the number of stages, i = 1, 2, 3; n is the number of stages during the whole growth period of tomato, and n = 3 in this experiment; λi is tomato water sensitivity index.
Previous studies have shown that the nitrogen application rate only affects the potential yield, and there is no significant influence on the water sensitivity index [19]. The experiment assumes that there is a similar effect of aeration rate, and which is demonstrated in the results. Because the relationship between yield, aeration rate and nitrogen application rate are in the form of quadric surface, the maximum evapotranspiration in the whole growth stage is the potential evapotranspiration, and the maximum yield is the potential yield. By fitting the potential yield function in the first quarter, the tomato production function of water, fertilizer and air coupled irrigation could be obtained.
Y a Y m ( O N ) = i = 1 n E T a E T m i λ i
Y m ( O N ) = a O 2 + b N 2 + c O N + d O + e N + f
where Ym is the yield of various oxygen and nitrogen rates under full irrigation.
Through the cumulative curve of water sensitivity index, the discrete water sensitivity index was transformed into a function that changed continuously over time, and the calculation error of the water consumption in the adjacent growth period was eliminated. The formula is as bellows:
Z t i = t = 0 n λ ( t ) = C 1 + e A B t
where i is the serial number of growth stage; n is the number of the subdivisions of growth period; Z(ti) is the cumulative value of crop water sensitivity index at different stages before the t time; t is the number of days since the transplanting to the beginning of each growth stage; A, B, C are the parameters to be determined.

2.4.2. Optimization of Irrigation System by Dynamic Programming

Dynamic programming (DP) is a method to preview strategy and test decision periodically. It has a good effect on solving the multi-stage decision problems. Dynamic programming model has been used to evaluate irrigation scheduling or scheduling model [25]. The objective function is:
Y a = Y m ( O N ) × i = 1 n E T a E T m i λ i
where: Ym is the optimum aeration rate and the highest yield under the nitrogen application rate obtained by seeking the extreme value of Formula (8); λi is the water sensitivity index of tomato in multiple growth stages divided by the cumulative curve of water sensitivity index; In this paper, when optimizing the irrigation system, n is the number of subdivisions in the whole growth period.
Constraints:
0 m i q i i = 1 n m i = Q E T i m i E T i E T m i 1
where: mi is the irrigation amount in stage i, mm; qi is the available irrigation amount at the beginning of stage i, mm; Q is irrigation quota in the whole growth stage, mm; ETi is the minimum water consumption of stage i, mm; ETmi is the maximum water consumption (potential evaporation) at stage i, mm.

2.4.3. Statistical Analysis Technique

All experimental data were collected and analyzed in Excel 2019, and irrigation water distribution was optimized by the excel solver. The undetermined parameters in the potential yield formula were solved by SPSS 25.0 software (SPSS Inc., Chicago, IL, USA); Duncan’s new complex polar difference method was used to test the significance and analyze the variance of interaction at p < 0.05. The sensitivity index of growth period was calculated by the least square method of Matlab 2018b software (MathWorks, Natick, MA, USA). All images were drawn by Origin2021 (Origin Lab Corp. Redmond, MA, USA).

3. Results and Analysis

3.1. Effect of ASDI on Water Consumption and Yield of Tomato

In the second season, the tomato yield ranged from 44.54 to 75.10 t ha−1 (Table 3). The highest crop yield 75.10 t ha−1 occurred in T11 with ASDI and high moisture content in the whole growth period, which was 68.62% higher than that of T1 with low moisture content in seedling stage and flowering stage under non-aeration drip irrigation. The influencing factors on tomato yield ranked in descending order was: moisture content in flowering and fruit-setting stage (c) > moisture content in maturity stage (d) > aeration rate (a) > moisture content in seedling stage (b). The optimal scheme is “C3D3A2B2”, that is, the water content is 60–70% at seedling stage, 70–80% at flowering and fruit setting stage, 70–80% at maturity stage, and the aeration amount is 25 mg L−1 DO in irrigation water. The maintained of high soil moisture content during flowering, fruit setting and maturity is beneficial to high yield of tomato. With the increase of soil moisture content at seedling stage, tomato yield first increased and then decreased slightly. Moreover, the yield in ASDI increased when compared with non-aeration treatment. Specifically, the yield of T11 treatment with high water content in the whole growth period is 20.39% higher than that of T4 treatment. The yield of T8 with low water in seedling stage and flowering stage and high water in maturity stage was 16.26% higher than that of T1. Compared with T6 treatment, the yield in T12 treatment with high water content in seedling stage, low water content in flowering stage and in maturity stage also increased by 14.46%.
Table 4 showed the water consumption and water and nitrogen use efficiency of tomatoes in each treatment. The analysis showed that the crop WUE in each water-air coupled irrigation treatment in descending order was T10 > T12 > T8 > T7 > T9 > T11 > T5 > T6 > T4 > T1 > T3 > T2. The partial productivity of nitrogen fertilizer in descending order was T11 > T9 > T4 > T7 > T3 > T2 > T12 > T8 > T10 > T5 > T6 > T1. On the whole, WUE decreased with the increase of crop water consumption during the whole growth period, while NPFP increased with the increase of water consumption. WUE and NPFP in ASDI improved compared with non-aeration drip irrigation. The average WUE and partial productivity of nitrogen fertilizer were 16.35 kg m−3 and 23.08 kg m−3, 213.96 kg kg−1 and 245.23 kg kg−1, respectively. When compared with T4 treatment, WUE in T11 with sufficient water supply increased by 11.36% and NPFP increased by 20.39%. When compared with T1 treatment, WUE in T8 with low water in the early and middle stages increased by 41.06% and NPFP increased by 16.26%. Although the irrigation amount in T12 reduced at the middle and late stage, the WUE increased by 54.86% and NPFP increased by 14.46% when compared with T6.

3.2. The Establishment of Water, Fertilizer and Air Coupled Production Function Based on the Jensen Model

The Jensen model, as a static model of water production function, is widely used at present. Taking the yield as the dependent variable and the evapotranspiration stage as the independent variable at each growth, the relationship between them under deficit irrigation at various growth stage was analyzed. Some studies combined with nitrogen effect using the Jensen model to obtain a water-nitrogen coupled production model. The effects of nitrogen application rate and ASDI aeration rate on yield is considered in this experiment. In order to investigate the influence of nitrogen application rate and aeration rate on yield, the effect function of air and nitrogen was introduced into the water production function to study the interaction of water, fertilizer and air, so as to establish the production function model of water, fertilizer and air under ASDI.
According to the yield data in the interaction test of aeration rate and nitrogen fertilizer of greenhouse tomato in the first season (Figure 1), the relationship between yield Ym(O·N) and nitrogen application amount N and aeration rate O was fitted by binary quadratic regression, and the effect function of air and nitrogen (R2 = 0.9227) under ASDI was obtained.
Y m ( O N ) = 0.043 O 2 0.0007 N 2 + 2 . 111 O + 0.394 N 2.054
Then, Matlab was applied by calling the least square method through the above formula and the data under the water deficit treatment of greenhouse tomatoes (T1–T12). The sensitivity index cumulative curve (13) was fitted by SPSS. Taking the maximum evapotranspiration at each growth stage as the potential evapotranspiration ETm and the theoretical value calculated by the fertilizer-air production function as the potential crop yield Ym, the tomato production function under the water, fertilizer and air coupled irrigation (14) was obtained. On the premise that the aeration rate would exert no significantly influence on the water sensitivity index of tomato in each stage, the experiment first calculated the growth stages of non-aeration (T1–T6) treatment and aeration (T7–T12) treatment, then the cumulative sensitivity index of the three stages under aeration and non-aeration mode obtained was 0.6105 and 0.7398, respectively. The sensitivity index at the flowering and fruit-setting stage was the largest, and that at the seedling stage and maturity stage was relatively small.
Z t i = 0.693 1 + e 2.641 0.041 t
Y a = ( 0.043 O 2 0.0007 N 2 + 2 . 111 O + 0.394 N 2.054 ) · E T 1 E T m 1 0.1740 E T 2 E T m 2 0.2756 E T 3 E T m 3 0.1856
From Figure 1, it was indicated that the parameters A, B and C of the water sensitivity index accumulation curve were 2.641, 0.041 and 0.693 respectively. The water sensitivity index of tomato in different growth stages ranked in descending order: flowering and fruit setting stage (λ2 = 0.2756), maturity stage (λ3 = 0.1856), seedling stage (λ1 = 0.1740). The growth period of flowering and fruit-setting period was vigorous. If the soil moisture content was too low at this stage, the water deficit would exert a great impact on the yield.
According to the curve analysis of the cumulative function of water sensitivity index in Figure 2, the water sensitivity index of plant tomato showed an S-shaped curve. The curve firstly increased slowly and then rapidly with the time elapse of transplanting days, and tended to be flat in the end. Before harvesting, the cumulative value of water sensitivity index of tomato was close to 0.64. Since the date of transplanting, the cumulative sensitivity index increased by 0.050, 0.090, 0.129, 0.138, 0.109 and 0.066 in every 20 d. The fastest growing stage occurred during the 44th–84th d after transplanting, with a cumulative increase of 0.269, which occurred at the period from the middle and late flowering and fruit setting to the early maturity stage. During this period, tomato plants grew vigorously, the transpiration of leaves was strong, and the water demand rised. When applying water to tomato during this stage, the pollination and fruit setting rate of buds would be affected [21], thus influencing the yield. Therefore, high soil moisture content should be ensured in the flowering period during 44th–84th d after transplanting.
After the establishment of the model, its reliability should be verified, and four plants were randomly selected again for each treatment to calculate the yield. The results of rechecking the model with yield data are shown in Table 5. There was a small difference between the calculated and the measured yield in each treatment. The model fitting coefficient R2 was 0.895, the crop yield root mean square error (RMSE) was 2.88 t ha−1 between the calculated and the measured yield, and the average relative error (MRE) was 4.83%. It showed that the model could well reflect the relationship between tomato yield and water consumption under a given nitrogen application rate in combination with the aeration rate. To intuitively reflect the changes in crop yield with irrigation parameters (irrigation quota, aeration rate and N application rate), the relationship between crop yield and irrigation parameters was drawn after constructing the productivity function (Figure 3). According to the analysis, the region with a high yield of crops looked like a quarter ellipsoid. In order to ensure a high yield, the irrigation quota needs to be above 350 mm, and the suitable range is 20–30 mg L−1 of aeration rate and 250–320 kg ha−1 of N application rate.

3.3. The Optimization of Water, Fertilizer and Air Coupled Irrigation Scheme

After the production function model was established, the best irrigation strategy of water, fertilizer and air coupled irrigation was further sought. Firstly, the partial derivative of the fertilizer-air effect function Formula (9) was obtained, and when the aeration amount was 24.55 mg L−1 DO in irrigation water and the nitrogen application amount was 281.43 kg ha−1, the maximum tomato yield was 79.30 t ha−1, which was regarded as the potential yield Ym under full irrigation. The growth period of tomato was subdivided with 20 d as a time step, and the whole duration after transplanting were divided into 6 stages, so as to realize refined irrigation. The water sensitivity index λi (Table 6) of each stage was calculated by the cumulative curve in Figure 2, and the irrigation constraint conditions was set according to the measured water consumption. The evapotranspiration intensity in various stage should not exceed the potential evapotranspiration, so the single irrigation amount should not exceed the maximum water consumption ETmi at this stage. In order to avoid excessive drought and crop withering, the single irrigation amount should not be lower than the minimum water consumption ETi at this stage. The allocation of irrigation quota with the highest yield under different irrigation quotas was obtained by programming solution.
The parameters of aeration rate, nitrogen application rate, ETmi and water sensitivity index λi at each stage were substituted into Formula (7), and the objective function was simplified:
Y a = 79.30 · m 1 5 0.0504 m 2 51 0.0897 m 3 82 0.1290 m 4 97 0.1384 m 5 96 0.1087 m 6 86 0.0710
After setting the objective function and constraint conditions in the excel table, the maximum output Ya was iteratively solved according to the excel solver tool. When the nitrogen application rate is 281.43 kg ha−1, the optimal water distribution scheme under different irrigation quotas was shown in Table 7. Considering that 5 mm is the minimum unit of single irrigation in actual production, the irrigation volume at each stage is an integer multiple of 5 during optimization calculation. Take the irrigation quota of 200 mm as an example. The maximum yield achieved at the irrigation volume of 5, 35, 45, 50, 40 and 25 mm at various growth stages. Thus, the ASDI yield reached 53.92 t ha−1, and the relative yield was 0.68, which means that the yield reaches 68% of full irrigation (irrigation quota ≥ 420 mm), while the yield of non-aeration treatment was 42.75 t ha−1. The predicted yield went up with the increase of irrigation quota, but when the irrigation quota in ASDI increased from 200 to 400 mm, the estimated yield would increase by 6.97, 6.47, 5.80 and 4.68 t ha−1, respectively, with each increase of 50 mm. It could be seen that the marginal diminishing effect of yield was improved by the increase of irrigation amount while keeping the aeration rate and nitrogen application rate unchanged. With the increase of irrigation quota, the yield-increasement under ASDI increased compared with non-aeration treatment. When irrigation quota was 200 mm, the crop yield in ASDI increased by 11.17 t ha−1, while when irrigation quota was 400mm, the crop yield in ASDI increased by 16.12 t ha−1. In addition, when compared with the yield difference between the DP optimized irrigation and the irrigation method with fixed soil moisture content, the water allocation under the deficit irrigation experiment was simulated (Figure 4). The results showed that the crop yield in DP increased by 4.66% on average under non-aeration treatments, 3.85% under ASDI treatments, and 4.25% under 12 treatments.
By comparing the optimal water distribution scheme, the effects of different water distribution schemes on tomato yield and economic benefits were obtained (Table 8). The net income was affected by the output due to the lower unit price of irrigation water. With the increase of irrigation quota, the yield and output value increased and the net income also increased. During one single crop season, the net income in the full irrigation (irrigation quota at 420 mm) under ASDI increased by 11,012 USD ha−1 compared with non-aeration treatment. In a single crop season, the net income at the irrigation quota of 200 mm under ASDI increased by 7183 USD ha−1 when compared to the non-aeration treatment.

4. Discussion

The tomato production function of water-fertilizer-air coupled irrigation was mainly affected by three parameters: nitrogen application, aeration and stage irrigation. Adding the proper amount of nitrogen fertilizer was the necessary practice to enhance crop yield [27]. At first, the potential yield increased rapidly with the increase of nitrogen application, then the growth rate slowed down gradually. There was no negative increase in yield at 240 kg ha−1 nitrogen application, and a turning point might occur at a higher nitrogen application rate. Excessive nitrogen application would reduce crop yield, nitrogen use efficiency and Nitrogen productivity [28]. Apart from nitrogen application, aeration also significantly affected tomato yield, as aerated irrigation created a good environment for crop root system respiration [29]. Lei et al. [30] indicated that ASDI could affect the root morphology of pepper in the greenhouse and significantly promoted yield and nitrogen utilization efficiency. Zhu et al. [31] and Wei et al. [32] also indicated that ASDI increased tomato yield and further increased IWUE compared with underground drip irrigation. The results of this test showed that compared with non-aeration treatment, the yield of ASDI could be increased by 20.39% with high water during the whole growth period. With low water at the early and middle stages and high water at the maturity stage, the yield could be increased by 16.26%. If there is high water at the seedling stage, medium water at the flowering stage and low water at the maturity stage, the yield could also be increased by 14.46%. It could be seen that the effects of ASDI on the yield increase of tomatoes were not identical at different growth stages and with different water content. Because the same aeration rate had a different ability to improve soil aeration under different soil water content. Plants at the seedling stage were small and need less oxygen. Rhizosphere air did not have dominant effect on the plant. Compared with non-aeration treatment, both WUE and NPFP were increased in aerated treatment. This was due to the improvement of soil aeration by ASDI, which improved the respiration capacity of soil microorganisms and roots [33], and increased the uptake of water and nitrogen by roots [30], thus enhancing plant growth and the utilization efficiency of water and nitrogen. At the same time, the effect of soil aeration on yield was similar to that of nitrogen application, which was positive at a low rate and negative at a high rate. It was generally believed that moderate aeration had the most obvious effect on yield increase [34]. Because the aeration rate and secondary coefficient of nitrogen application were negative, and nitrogen application and aeration would exert a negative impact on yield when they exceeded a certain value. The test indicated that the maximum yield could reach 79.30 t ha−1 when aeration rate was 24.55 mg L−1 DO in irrigation water and nitrogen application rate was 281.43 kg ha−1. Nitrogen application rate and aeration rate both affect potential yield. When these two parameters were determined, the upper limit of tomato production capacity was determined accordingly. The actual yield would also be affected by water consumption at the growth stage, even under the same irrigation quota because of different stage sensitivity indices. Rational irrigation could increase the absorption and utilization of soil water and nutrients by vegetables. Numerous studies had shown that water deficit could seriously reduce tomato yield [35], but regulating deficit within a certain stage and range had little effect on tomato yield [36,37]. According to water stress at growth stage, drought stress at flowering and fruit-setting stage resulted in the most significant decrease in yield, and yield of low water treatment decreased by 17.04 t ha−1 compared with high water treatment. Because drought crops had certain adaptability to drought, damage caused by drought stress could be reduced by changing their physiological process or regulating the growth of organs under water stress [38]. Moderate water stress at the nutrient growth stage (seedling stage) could effectively control crop growth, regulate the nutrient uptake and photosynthates, and thus increase the distribution proportion of fruit weight [39]. It was consistent with the sensitivity index strength shown in the model. It was noteworthy that the test results did not show that irrigation water volume increased in high water treatment but yield decreased correspondingly [40], possibly because the high-water treatment in this experiment was still within the reasonable range of soil moisture content and did not exert a negative impact on yield.
There is a default assumption that nitrogen application and aeration would only affect potential crop yields while do not change the stage water sensitivity index of crops in the water-fertilizer-air function. Therefore, the effect of irrigation water distribution on crop yield could be quantitatively evaluated under the interaction of aeration rate and nitrogen application. Wang et al. [19,21] showed that the amount of nitrogen applied would not affect the water sensitivity index, and the changing trend and cumulative level of sensitive index of aeration and non-aeration treatment were basically the same. A small amount of error was unavoidable in the division of three growth periods [18]. This might indicate that water sensitivity indices were less susceptible to changes in agricultural practices. In this test, the water sensitivity index of the tomato in each growth period ranked int descending order: flowering and the fruit set period, the maturity period, and the seedling period. This is consistent with the research results by Zhang et al. [41]. The division of growth periods, plant varieties and soil types might bring about some differences. The most sensitive stage of tomato to water stress was the flowering stage and fruit stage. To eliminate the influence caused by growth period division, Mao et al. fitted the water sensitivity index [42] of winter wheat with a Logistic curve and used it for programming solution. Li et al. [21] established a cumulative curve of the sensitivity index of greenhouse tomatoes, which grew rapidly after 40 d of transplanting, and obtained better accuracy compared with the measured values. The cumulative curve of the water sensitivity index in this test was S-shaped, which showed a slower growth in the early stage (0–44 d), fast growth in the middle stage (44–84 d), and slow and stable growth in the late stage (84–112 d). This might be due to the incomplete restoration of root system function and low plant transpiration and water requirement in the seedling stage shortly after planting. The reduction of the irrigation quota properly did not cause the decline in yield, but also facilitated the crop root elongation at this stage [43]. After 44 d of transplanting, the cumulative curve increased rapidly, this might be the reason that the tomato entered the vigorous period of vegetative growth and reproductive growth, and the first fruits began to expand and the second fruit grew. Thus, tomato was more sensitive to water deficit and the water sensitivity index peaked at this stage. Water deficit would affect fruit enlargement, reduce fruit weight and consequently reduce yield. Meanwhile, water deficit also accelerated plant premature senescence and reduced the yield. After 84 d of transplanting, the water requirement of tomato decreased with the harvest of fruit, plant aging and withering of bottom leaves [44]. Water deficit could improve tomato quality without exerting significantly negative impact on yield at the maturity stage [45].
DP was used in this study to evaluate optimal irrigation strategies for tomatoes based on yield and water consumption. Specifically, irrigation quotas were allocated based on water demand and water sensitivity indices at plant growth stages. Each strategy maximized yield while water consumption was limited by a specified maximum. Based on the production function of water, fertilizer and air coupled irrigation, the tomato high-yield scheme under insufficient irrigation was analyzed. Guided by irrigation amount in time step of 20 d, the irrigation allocation under the irrigation quota of 200, 250, 300, 350 and 400 mm was obtained through DP. With the increase of irrigation quota, water consumption at different stages was gradually satisfied, and the order illustrated the importance of water at this stage. The results in Table 7 showed that stage water sensitivity index should be taken into account in water distribution, and stage potential evaporation ETmi could affect priority. The minimum λ and the minimum potential evaporation (5 mm) were the first to be satisfied in the first stage between 1st and 20th d after transplanting. With the increase of irrigation quota to more than 300 mm, water requirement in the second stage was also reached 51 mm. When the water quota was increased to 350 mm, the water requirement of three stages with a large sensitivity index and low water requirement was satisfied. The potential evaporation in the following three stages had little difference (85–97 mm), and the water consumption in the fourth and fifth stages between 350 and 400 mm was satisfied. The water allocation priority in stage 6 was the lowest, and only when the irrigation quota reached 420 mm full irrigation, the water consumption could be satisfied. This was obviously consistent with the sequence of phase water sensitivity index λ4 = 0.1384 > λ5 = 0.1087 > λ6 = 0.0710. The economic benefits of tomatoes under different water distribution schemes were analyzed. The economic benefit was mainly determined by the yield output. The larger the irrigation quota was, the higher the yield and net income was. When compared with non-aeration treatment, the average net income in ASDI increased by 7183–11,012 USD ha−1 per crop season, and it increased with the increase of irrigation quota. Due to the low unit price of agricultural water and maximization of the output, adequate irrigation (420 mm) was probably used by local farmers in areas with convenient water intake. For areas with difficult water intake or incomplete supporting facilities and low irrigation guarantee rates, the optimized water distribution scheme in Table 7 would be adopted to reduce losses. Compared with the irrigation strategy with a fixed water content range, the irrigation strategy optimized by DP had a higher yield and required less irrigation water. This method was easy to operate and can be calculated in Excel. It could also divide growth stages more finely according to the water sensitivity index curve, which had certain guiding significance for production practice.

5. Conclusions

In this study, a greenhouse tomato production function of water, fertilizer and air coupled irrigation was put forward based on the Jensen function. The model has a good accuracy (R2= 0.895) and can be used to predict tomato yield. Based on the resolution of the water sensitivity index at seedling stage, flowering and fruit-setting stage and maturity stage. In addition, six growth stages of tomato were subdivided with 20 d as a time step, and a high-yield scheme under multiple irrigation quotas was formulated by combining the dynamic programming method with the model. The research provides a reference method for maximizing agricultural net income with the optimal water allocation scheme. The main conclusions are as follows:
(i)
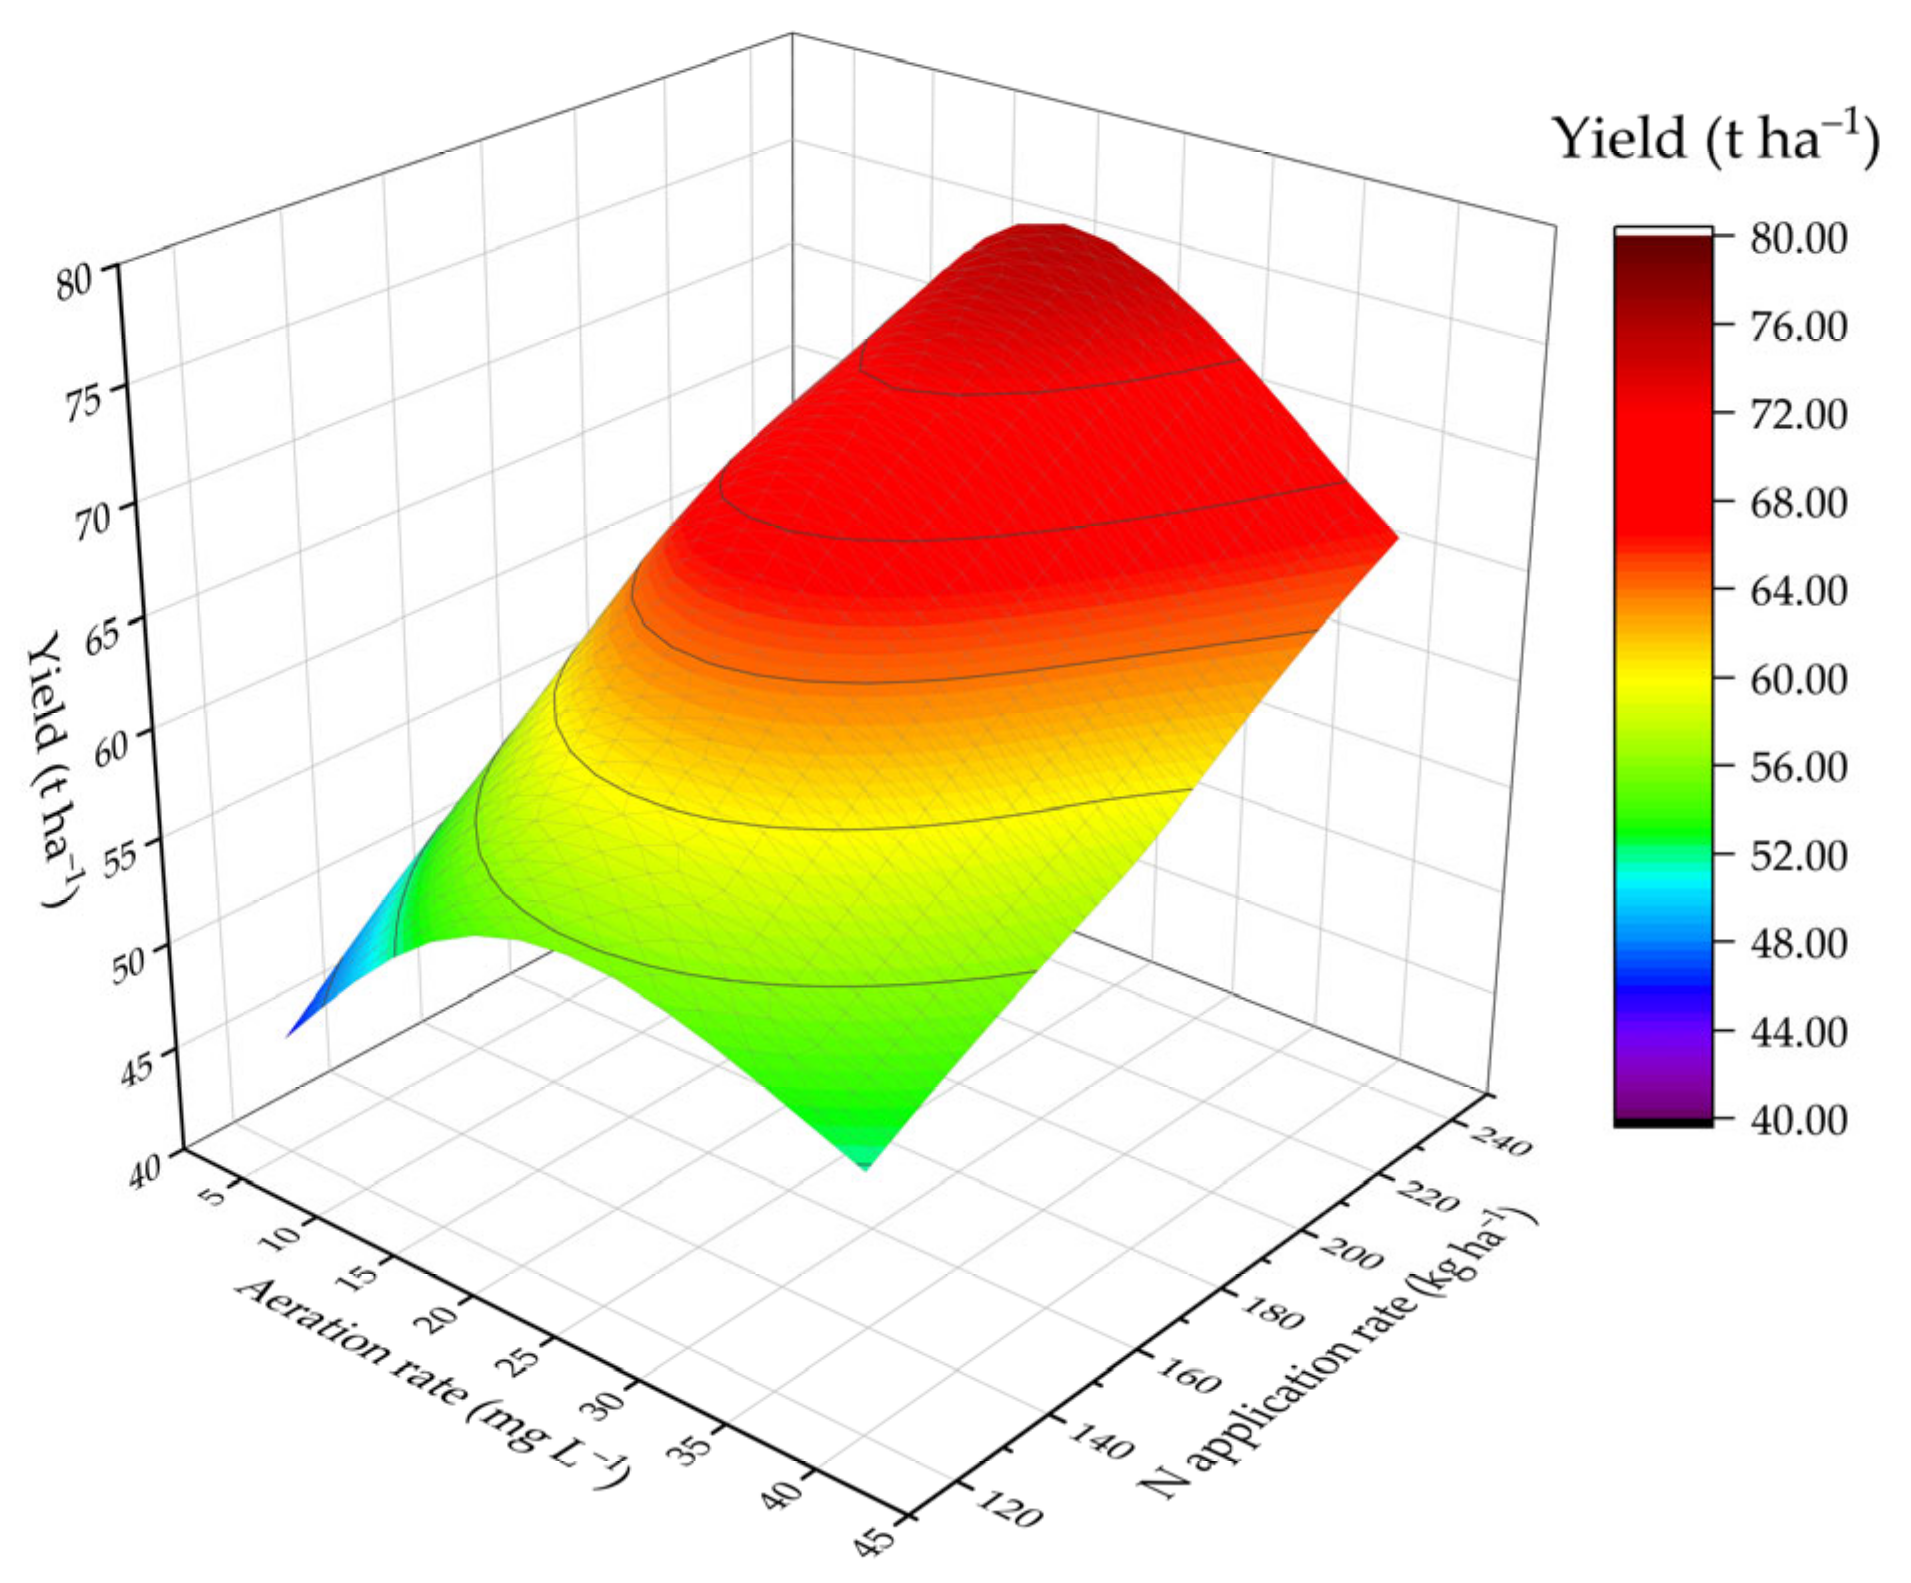
The aeration rate of 24.55 mg L−1 DO in irrigation water and the nitrogen application rate of 281.43 kg ha−1 is the best combination scheme under ASDI.
(ii)
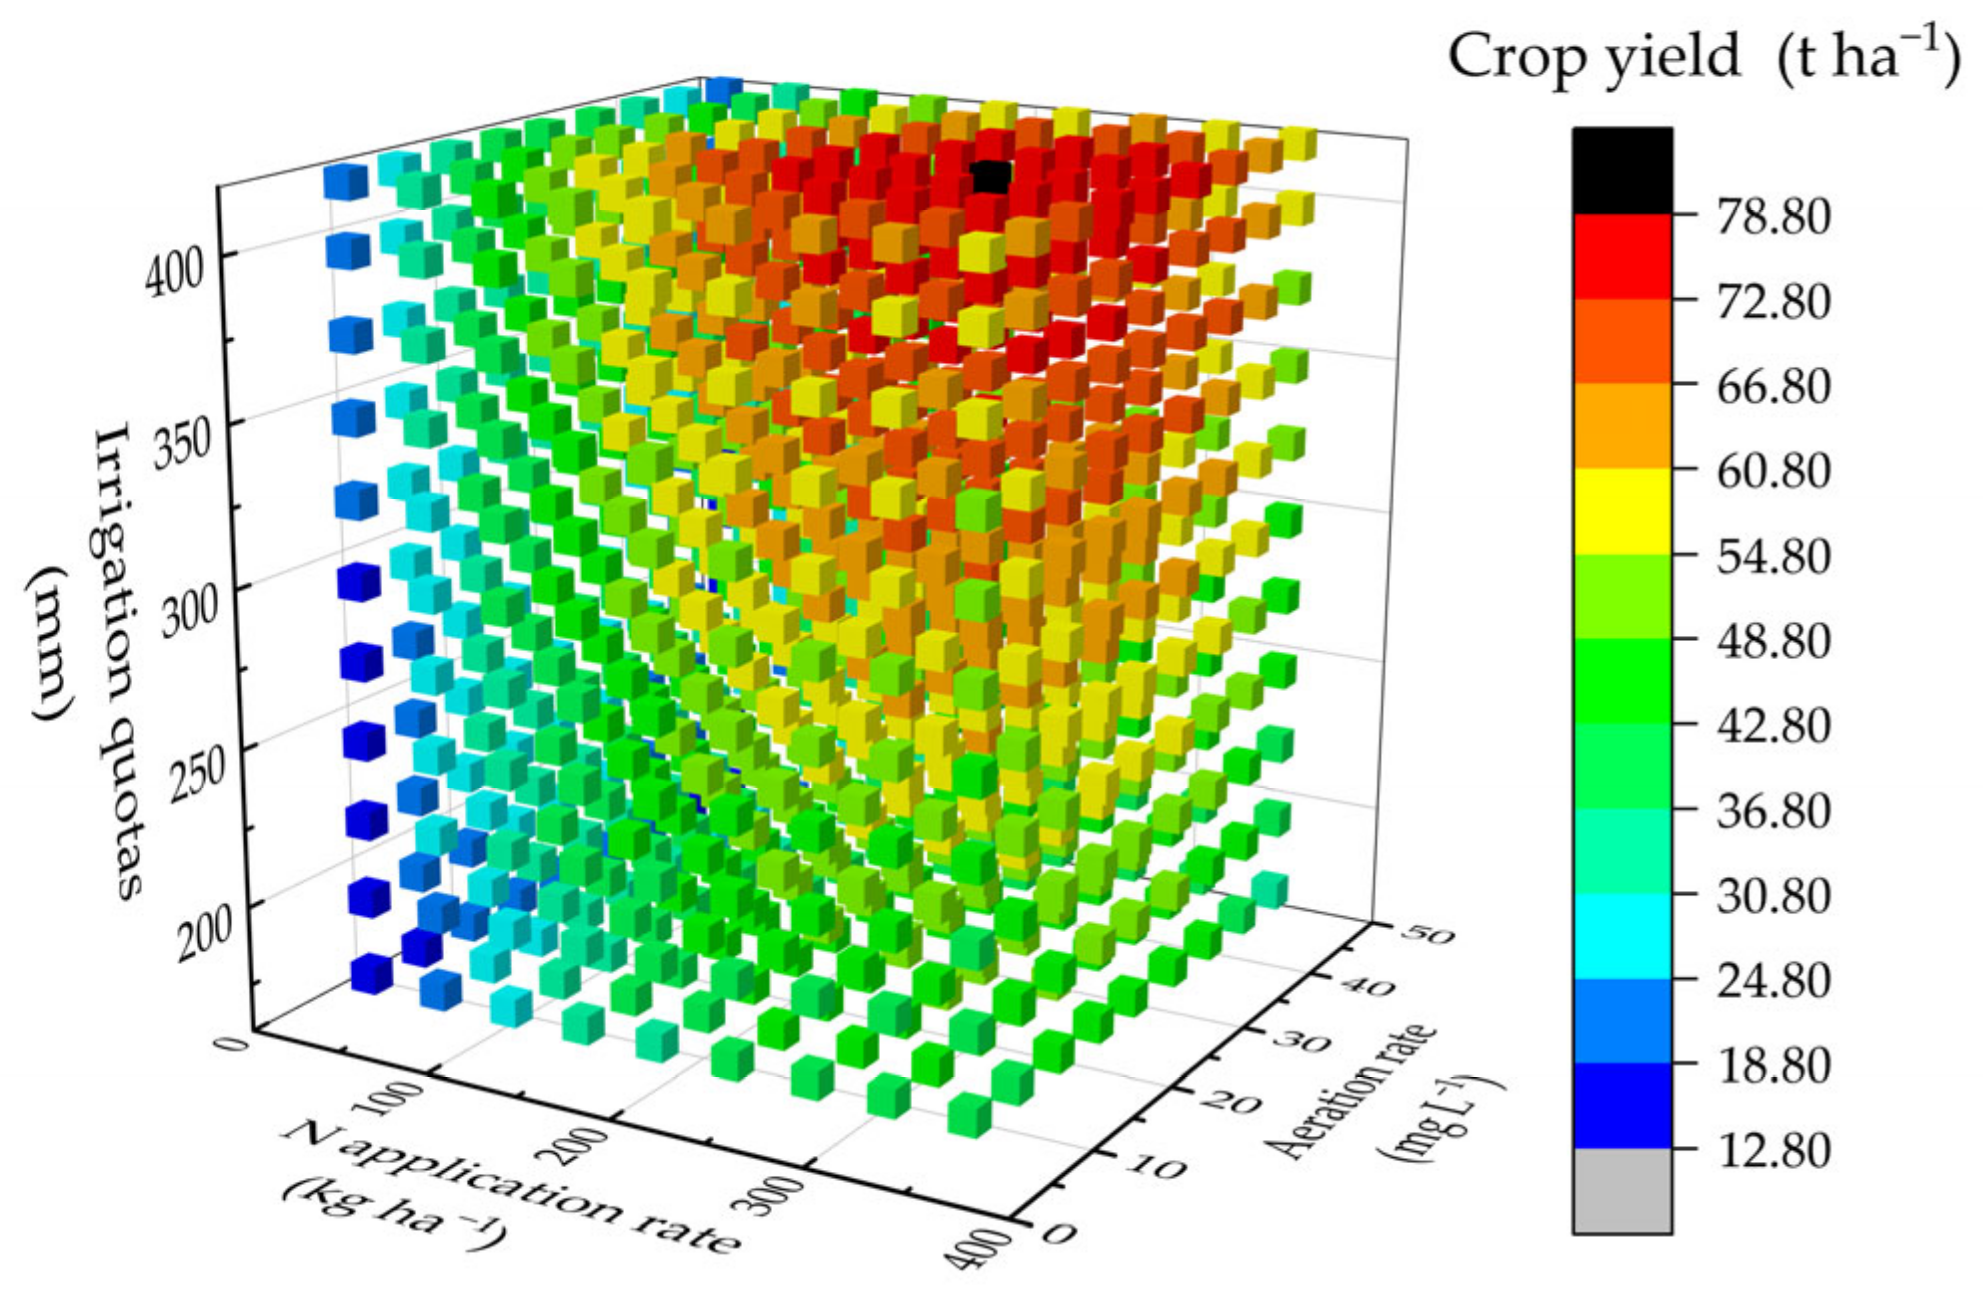
In areas where irrigation can be ensured, an irrigation quota of 420 mm was recommended to maximize the yield. When compared with non-aeration treatment, the net yield in ASDI increased by 11,012 USD ha−1 per crop season on average.
The results could provide a reference method for the optimization of technical parameters of water—fertilizer—air coupled irrigation. Further study should be done to verify the applicability of the model under the field conditions and to offset the uncertainty of other factors, such as price fluctuation.

Author Contributions

Conceptualization, H.L. and H.P.; software, Y.H.; writing—review and editing, Y.L.; data curation, C.J.; visualization, Z.X.; supervision, J.D. and X.L., project administration, D.L. All authors have read and agreed to the published version of the manuscript.

Funding

This research was funded by National Natural Science Foundation of China (No. 52079052), the Science and Technology Research Plan in Henan province (No. 212102110032), Major Science and Technology Innovation Project in Shandong, Key Research & Development Plan (No. 2019JZZY010710), China. Innovative Education Program for Graduate Students at North China University of Water Resources and Electric Power, China (No. YK–2021–59).

Institutional Review Board Statement

Not applicable.

Informed Consent Statement

Not applicable.

Data Availability Statement

Data are contained within the article.

Acknowledgments

We fully appreciate the editors and all anonymous reviewers for their constructive comments on this manuscript. We would like to express our warm thanks for the English improvement to Chen Yingying from North China University of Water Resources and Electric Power.

Conflicts of Interest

The authors declare no conflict of interest. The funders had no role in the design of the study; in the collection, analyses, or interpretation of data; in the writing of the manuscript; or in the decision to publish the results.

References

  1. Ministry of Water Resources of the People’s Republic of China. China Water Resources Bulletin. Available online: http://www.gov.cn/xinwen/2022-06/16/content_5695973.htm (accessed on 16 June 2022).
  2. Silberbush, M.; Gornat, B.; Goldberg, D. Effect of irrigation from a point source (trickling) on oxygen flux and on root extension in the soil. Plant Soil 1979, 52, 507–514. [Google Scholar] [CrossRef]
  3. Bhattarai, S.P.; Midmore, D.J.; Pendergast, L. Yield, water-use efficiencies and root distribution of soybean, chickpea and pumpkin under different subsurface drip irrigation depths and oxygation treatments in vertisols. Irrig. Sci. 2008, 26, 439–450. [Google Scholar] [CrossRef]
  4. Baram, S.; Weinstein, M.; Evans, J.F.; Berezkin, A.; Sade, Y.; Ben-Hur, M.; Bernstein, N.; Mamane, H. Drip irrigation with nanobubble oxygenated treated wastewater improves soil aeration. Sci. Hortic. 2022, 291, 110550. [Google Scholar] [CrossRef]
  5. Lei, H.J.; Xiao, Z.Y.; Zhang, Z.H.; Jin, C.C.; Pan, H.W.; Sun, K.P.; Xi, H.P. Effects of oxygen and nitrogen coupled irrigation on soil fertility and bacterial community under greenhouse pepper cropping system. Trans. Chin. Soc. Agric. Eng. 2021, 37, 158–166. (In Chinese) [Google Scholar]
  6. Gao, L.L.; Li, J.; Huang, H.Y.; Xiang, B.; Li, S.F.; Li, S. Effects of aerated irrigation on soil habitat factors and yield of winter potato under drip irrigation in Yunnan. Agric. Res. Arid Areas 2022, 40, 108–115. (In Chinese) [Google Scholar]
  7. Wang, X.Y.; Wang, T.Z.; Zhou, Y.P.; Xiao, Y.; Liu, Y.X.; Li, Y.K. Effects of Oxygation with micro-nano air bubbles on yield, fruit quality and irrigation-water use efficiency of muskmelon. J. Irrig. Drain. 2021, 40, 38–46. (In Chinese) [Google Scholar]
  8. Xiao, Z.; Lei, H.; Jin, C.; Pan, H.; Lian, Y. Relationship between the dynamic characteristics of tomato plant height and leaf area index with yield, under aerated drip irrigation and nitrogen application in greenhouses. Agronomy 2023, 13, 116. [Google Scholar] [CrossRef]
  9. Cui, B.; Hu, C.; Fan, X.; Cui, E.; Li, Z.; Ma, H.; Gao, F. Changes of endophytic bacterial community and pathogens in pepper (Capsicum annuum) as affected by reclaimed water irrigation. Appl. Soil Ecol. 2020, 156, 103627. [Google Scholar] [CrossRef]
  10. Zhang, Q.; Du, Y.; Cui, B.; Sun, J.; Wang, J.; Wu, M.; Niu, W. Aerated irrigation offsets the negative effects of nitrogen reduction on crop growth and water-nitrogen utilization. J. Clean. Prod. 2021, 313, 127917. [Google Scholar] [CrossRef]
  11. Lu, J.; Shao, G.; Cui, J.; Wang, X.; Keabetswe, L. Yield, fruit quality and water use efficiency of tomato for processing under regulated deficit irrigation: A meta-analysis. Agric. Water Manag. 2019, 222, 301–312. [Google Scholar] [CrossRef]
  12. Li, H.; Liu, H.; Gong, X.; Li, S.; Pang, J.; Chen, Z.; Sun, J. Optimizing irrigation and nitrogen management strategy to trade off yield, crop water productivity, nitrogen use efficiency and fruit quality of greenhouse grown tomato. Agric. Water Manag. 2021, 245, 106570. [Google Scholar] [CrossRef]
  13. Du, Y.D.; Zhang, Q.; Cui, B.-J.; Sun, J.; Wang, Z.; Ma, L.-H.; Niu, W.Q. Aerated irrigation improves tomato yield and nitrogen use efficiency while reducing nitrogen application rate. Agric. Water Manag. 2020, 235, 106152. [Google Scholar] [CrossRef]
  14. Mukherjee, D. Optimizing Water production function and deficit irrigation scheduling during extreme dry periods. J. Irrig. Drain. Eng. 2021, 147, 04021060. [Google Scholar] [CrossRef]
  15. Li, Z.K.; Liu, H.; Zhao, W.Z. Revisiting crop water production functions in terms of cross-regional applications. Chin. J. Eco-Agric. 2018, 26, 1781–1794. (In Chinese) [Google Scholar]
  16. Ren, Q.S.; Sun, Z.J.; Wang, L.; Jiao, B.Z.; Han, L. An experimental research on water production function for potato in yellow river pumping irrigation area of ningxia. Water Sav. Irrig. 2019, 2, 43–46. (In Chinese) [Google Scholar]
  17. Wang, S.J.; Zhang, H.J.; Ba, Y.C.; Wang, Y.C.; Huang, C.X.; Xue, D.X.; Li, F.Q. The study of water regulated deficit on yield component and water production function of pepper with mulched drip irrigation. Acta Agric. Boreali-Sin. 2018, 33, 217–225. (In Chinese) [Google Scholar]
  18. Han, S.J.; Liu, Q.C.; Wang, S.L.; Hu, Y.Q. Improvement and verification of cumulative function of crop water sensitive index. Trans. Chin. Soc. Agric. Eng. 2010, 26, 83–88. (In Chinese) [Google Scholar]
  19. Wang, Y.R.; Lei, Z.D.; Yang, S.X. Study on accumulation function of water sensitive index of winter wheat. J. Hydraul. Eng. 1997, 5, 29–36. (In Chinese) [Google Scholar]
  20. Wu, X.; Xu, Y.Q.; Shi, J.C.; Zhang, T.; Wang, L.C.; Xue, X.Z.; Zuo, Q. Water production function of winter wheat based on root-weighted soil water availability. Trans. Chin. Soc. Agric. Eng. 2022, 38, 124–134. (In Chinese) [Google Scholar]
  21. Li, W.L.; Sun, X.H.; Zhang, J.H.; Ma, J.J.; Guo, X.H.; Lei, T.; Sun, R.F.; Song, T. The effect of water-nitrogen coupling on water-nitrogen production functions of greenhouse tomato under mulched drip irrigation. J. Irrig. Drain. 2021, 40, 47–54. (In Chinese) [Google Scholar]
  22. Rezazadeh Baghal, S.; Khodashenas, S.R. Fuzzy number linear programming technique for design of rectangular canals. J. Irrig. Drain. Eng. 2022, 148, 04022027. [Google Scholar] [CrossRef]
  23. Yoo, D.I.; Chavas, J.P. Dynamic modeling of biotechnology adoption with individual versus social learning: An application to US corn farmers. Agribusiness 2023, 39, 148–166. [Google Scholar] [CrossRef]
  24. Tian, J.; He, G. Study on optimal design method of urban sewage collection network layout. Pol. J. Environ. Stud. 2022, 31, 1823–1836. [Google Scholar] [CrossRef] [PubMed]
  25. Epperson, J.E.; Hook, J.E.; Mustafa, Y.R. Dynamic programming for improving irrigation scheduling strategies of maize. Agric. Syst. 1993, 42, 85–101. [Google Scholar] [CrossRef]
  26. Yu, C.G.; He, Y.; Yue, H.Y.; Zhao, H.Z.; Zhao, L.J.; Li, Z.G.; Wei, X.D.; Zhang, L.L.; Li, B.S.; Sun, Z.P. Production status of fruit vegetables in solar greenhouse of northeast region and simplification pathway. China Veg. 2022, 4, 88–92. (In Chinese) [Google Scholar]
  27. Zhai, J.; Zhang, G.; Zhang, Y.; Xu, W.; Xie, R.; Ming, B.; Hou, P.; Wang, K.; Xue, J.; Li, S. Effect of the rate of nitrogen application on dry matter accumulation and yield formation of densely planted maize. Sustainability 2022, 14, 14940. [Google Scholar] [CrossRef]
  28. Bahrami, M.; Talebnejad, R.; Sepaskhah, A.R.; Bazile, D. Irrigation regimes and nitrogen rates as the contributing factors in quinoa yield to increase water and nitrogen efficiencies. Plants 2022, 11, 2048. [Google Scholar] [CrossRef] [PubMed]
  29. Lei, H.J.; Xiao, Z.Y.; Xiao, R.; Yang, H.G.; Pan, H.W. Effect of water-fertilizer-gas coupled drip irrigation on greenhouse tomato growth and fruit quality. Agric. Res. Arid Areas 2020, 38, 168–175. (In Chinese) [Google Scholar]
  30. Lei, H.J.; Jin, C.C.; Pan, H.W.; Xiao, Z.Y.; Sun, K.P. Integrative effects of irrigation and aeration on root morphology, yield and quality of pepper. Trans. Chin. Soc. Agric. Mach. 2022, 53, 344–352. (In Chinese) [Google Scholar]
  31. Zhu, Y.; Cai, H.J.; Song, L.B.; Shang, Z.H.; Chen, H. Comprehensive evaluation of different oxygation treatments based on fruit yield and quality of greenhouse tomato. Sci. Agric. Sin. 2020, 53, 2241–2252. (In Chinese) [Google Scholar]
  32. Wei, C.L.; Wang, Z.H.; Zhang, J.Z.; Zhu, Y.; Qin, C. Comprehensive evaluation of aerated irrigation treatment based on yield and quality of processing tomato. J. Arid Land Resour. Environ. 2022, 36, 122–127. (In Chinese) [Google Scholar]
  33. Zhu, Y.; Cai, H.J.; Song, L.B.; Chen, H. Oxygation improving soil aeration around tomato root zone in greenhouse. Trans. Chin. Soc. Agric. Eng. 2017, 33, 163–172. (In Chinese) [Google Scholar]
  34. Jin, C.; Pan, H.; Lei, H.; Xiao, Z.; Sun, K. Effects of aerated irrigation and nitrogen application on tomato yield and nitrogen absorption in greenhouse environment. Fresenius Environ. Bull. 2022, 31, 8150–8160. [Google Scholar]
  35. Cantore, V.; Lechkar, O.; Karabulut, E.; Sellami, M.H.; Albrizio, R.; Boari, F.; Stellacci, A.M.; Todorovic, M. Combined effect of deficit irrigation and strobilurin application on yield, fruit quality and water use efficiency of “cherry” tomato (Solanum lycopersicum). Agric. Water Manag. 2016, 167, 53–61. [Google Scholar] [CrossRef]
  36. Nangare, D.D.; Singh, Y.; Kumar, P.S.; Minhas, P.S. Growth, fruit yield and quality of tomato (Lycopersicon esculentum Mill.) as affected by deficit irrigation regulated on phenological basis. Agric. Water Manag. 2016, 171, 73–79. [Google Scholar] [CrossRef]
  37. Wang, D.; Kang, Y.; Wan, S. Effect of soil matric potential on tomato yield and water use under drip irrigation condition. Agric. Water Manag. 2007, 87, 180–186. [Google Scholar] [CrossRef]
  38. Sun, T.G.; Zhang, M.J.; Ma, T.Y.; Zhai, Y.; Li, X. Physiological and biochemical mechanism of exogenous spermidine improving drought resistance in melon seedlings under drought stress. North. Hortic. 2022, 12, 34–39. (In Chinese) [Google Scholar]
  39. Yang, S.; Song, Y.Q.; Li, J.; Chen, C.; Li, L.L. Regulated deficit irrigation technique and its application on fruit trees. North. Hortic. 2015, 11, 176–179. (In Chinese) [Google Scholar]
  40. Zhai, C.; Zhang, N.; Xiao, Y.; Zhou, H.P.; Xiao, C.H.; Meng, Y.C. Experiment on crop coefficient and water productivity of main grain crops under drip irrigation in Xinjiang. J. Arid Land Resour. Environ. 2021, 35, 162–167. (In Chinese) [Google Scholar]
  41. Zhang, H.J.; Zhang, J.D. Periodical water production function of processing tomato (Solanum lycopersicum) subjected to water deficit in an arid environment. Appl. Mech. Mater. 2014, 641–642, 196–200. [Google Scholar] [CrossRef]
  42. Mao, X.M.; Shang, S.H. Application of 0-1 programming model on optimization of crop deficit irrigation schedule. Trans. Chin. Soc. Agric. Mach. 2014, 45, 153–158. (In Chinese) [Google Scholar]
  43. Cui, Y.; Chen, S.; Chai, R.Y.; Jin, J.L.; Hu, T.T.; Qiu, Y. Responsive analysis of tomato yield to soil moisture during different growth stage. Agric. Res. Arid Areas 2015, 33, 14–21. (In Chinese) [Google Scholar]
  44. Zheng, J.; Zhu, C.Y.; Qi, X.Y.; Wei, J.F.; Yang, S.H.; Sun, Q. The effects of irrigation with diluted biogas slurry on growth, yield and fruit quality of tomato. J. Irrig. Drain. 2022, 41, 64–71. (In Chinese) [Google Scholar]
  45. Mitchell, J.P.; Shennan, C.; Grattan, S.R.; May, D.M. Tomato fruit yields and quality under water deficit and salinity. J. Am. Soc. Hortic. Sci. 1991, 116, 215–221. [Google Scholar] [CrossRef] [Green Version]
Figure 1. Yield response curved surface of tomato under fertilizer-air coupled irrigation in 2019.
Agronomy 13 00776 g001
Figure 2. Water sensitive index accumulation curve.
Agronomy 13 00776 g002
Figure 3. Crop production diagram of water-fertilizer-air coupled irrigation.
Agronomy 13 00776 g003
Figure 4. The yield difference between DP optimized irrigation and the fixed soil moisture content irrigation.
Agronomy 13 00776 g004
Table 1. Division of tomato growth period.
Experimental
Item
Tomato Growth
Period
Start DateEnd DatePost–Transplant Period (d)Days of Growth Period (d)
The first crop season in 2019
(Potential yield
experiment)
Seeding stage9 March 20192 April 20191–2525
Flowering and fruit bearing stage3 April 201917 April 201926–4015
Fruit expanding stage18 April 201921 May 201941–7434
Maturity stage22 May 201910 July 201975–12450
The second crop
season in 2021
(Deficit irrigation
experiment)
Seedling stage14 September 202115 October 20211–3232
Flowering and fruit bearing stage16 October 20214 December 202133–8250
Maturity stage5 December 202113 January 202283–12240
Table 2. Experimental design.
Potential Yield ExperimentalDeficit Irrigation Experimental
TreatmentAeration Rate
(mg·L−1)
N application Rate
(kg·ha−1)
TreatmentAeration Rate
(mg·L−1)
Seedling
Stage
Flowering and Fruit
Bearing Stage
Maturity
Stage
A1N35240T15W1W1W3
A2N315240T25W1W3W1
A3N340240T35W2W2W3
A1N25180T45W3W3W3
A2N215180T55W3W1W2
A3N240180T65W3W2W1
A1N15120T725W1W2W2
A2N115120T825W1W1W3
A3N140120T925W2W3W2
T1025W2W1W1
T1125W3W3W3
T1225W3W2W1
Table 3. Range analysis of yield.
TreatmentAeration Rate (mg L−1)Soil Moisture Content at Seedling StageSoil Moisture Content during Flowering and Fruit Bearing StageSoil Moisture Content in Maturity StageYield
(t ha−1)
T1111344.54 ± 1.39 g
T2113153.51 ± 3.45 de
T3122355.31 ± 2.89 d
T4133362.38 ± 1.19 bc
T5131246.85 ± 1.53 efg
T6132145.5 ± 2.08 fg
T7212257.71 ± 2.43 cd
T8211351.78 ± 1.35 def
T9223268.41 ± 3.11 b
T10221148.06 ± 1.27 efg
T11233375.1 ± 1.7 a
T12232152.09 ± 1.34 def
1 Mean value51.3551.8847.8149.79
2 Mean value58.8657.2652.6557.65
3 Mean value56.3864.8557.82
range7.515.3717.048.03
Primary and secondary factors3412
Optimal schemeC3D3A2B2
Note: The orthogonal test factor rates were coded. 1, 2 and 3 represented the three rates of soil water content at seedling stage, flowering and fruiting stage, and maturity stage, which were 50–60%, 60–70% and 70–80%. In aeration rate, 1 represents 5 mg L−1 in non-aeration treatment, and 2 represents 25 mg L−1 DO concentration in aerated irrigation water, respectively. A, B, C and D represent the aeration rate, soil water content at seedling stage, soil water content at flowering and fruiting stage, and soil water content in maturity stage, respectively. — means there is no such rate. Yield was expressed as mean ± standard error, and different letters in the same column indicated significant difference at p < 0.05.
Table 4. The crop water consumption and nitrogen utilization rate of tomato.
TreatmentsSeedling Stage ET (mm)Flowering and Fruit Bearing Stage ET (mm)Maturity Stage
ET (mm)
ET during Whole Growth Period (mm)WUE
(kg m−3)
NPFP
(kg kg−1)
T117.59 ± 0.42 bc112.97 ± 5.26 d147.56 ± 5.58 b278.11 ± 11.15 c16.03 ± 0.41 hi185.58 ± 5.8 g
T217.02 ± 0.42 bc213.44 ± 10.13 a137.24 ± 5.09 b367.7 ± 14.81 ab14.53 ± 0.34 j222.97 ± 14.37 de
T328.07 ± 1.72 a164.13 ± 7.58 b165.56 ± 6.46 a357.76 ± 15.45 b15.46 ± 0.37 i230.47 ± 12.06 d
T431.71 ± 2.26 a201.98 ± 9.53 a141.02 ± 5.27 b374.72 ± 12.9 ab16.67 ± 0.27 gh259.93 ± 4.94 bc
T531.1 ± 2.17 a139.2 ± 6.39 c91.22 ± 2.97 d261.52 ± 11.35 cd17.93 ± 0.2 ef195.21 ± 6.37 efg
T630.92 ± 2.15 a163.18 ± 7.53 b66.24 ± 1.99 e260.34 ± 10.85 cd17.48 ± 0.34 fg189.6 ± 8.68 fg
T714.9 ± 0.54 c158.27 ± 7.29 bc108.58 ± 3.44 c281.74 ± 10.31 c20.47 ± 0.13 d240.45 ± 10.12 cd
T815.66 ± 0.47 c103.91 ± 4.93 de109.57 ± 3.79 c229.14 ± 8.59 d22.62 ± 0.31 c215.75 ± 5.63 def
T927.51 ± 1.64 a193.97 ± 9.11 a116.27 ± 4.1 c337.75 ± 14.67 b20.25 ± 0.26 d285.02 ± 12.97 b
T1021.7 ± 0.81 b88.05 ± 4.42 e53.78 ± 1.65 ef163.53 ± 3.84 e29.38 ± 0.12 a200.23 ± 5.29 efg
T1129.43 ± 1.92 a200.45 ± 9.45 a172.08 ± 6.77 a401.97 ± 14.47 a18.7 ± 0.31 e312.93 ± 7.08 a
T1228.23 ± 1.74 a112.56 ± 5.25 d51.71 ± 1.61 f192.5 ± 5.95 e27.07 ± 0.24 b217.02 ± 5.57 def
Note: Data are all expressed by mean ± standard error, and different letters in the same column indicate significant difference at p < 0.05.
Table 5. The measured and predicted crop yield of tomato.
TreatmentsActual Yield
(t ha−1)
Predicted Yield
(t ha−1)
TreatmentsActual Yield
(t ha−1)
Predicted Yield
(t ha−1)
T147.10 45.39T760.49 57.88
T250.95 53.06 T850.98 52.08
T354.79 55.75T967.75 68.99
T460.9458.53T1051.99 46.15
T545.60 48.56T1173.64 75.76
T643.6747.76T1254.73 51.32
R20.895
Root mean square error of crop yield (t ha−1)2.88
The average relative error (%)4.83
Table 6. The division of tomato growth stages.
StagesDays after Transplanting
(d)
ET i
(mm)
ETmi
(mm)
λi
11–20 3 50.0504
221–40 23510.0897
341–6035820.1290
461–8038970.1384
581–10034960.1087
6101–12222860.0710
Table 7. Optimal irrigation scheme with multiple irrigation quotas.
Irrigation
Quotas
(mm)
m1
(mm)
m2
(mm)
m3
(mm)
m4
(mm)
m5
(mm)
m6
(mm)
ASDI (O = 24.55 mg L−1)Non-Aeration Drip Irrigation (O = 5 mg L−1)
Predicted Yield
(t ha−1)
Relative Output
(−)
Predicted Yield
(t ha−1)
Relative Output
(−)
200535 45 50 40 25 53.92 0.68 42.75 0.54
250535 60 65 50 35 60.89 0.77 48.27 0.61
300550 70 75 60 40 67.36 0.85 53.40 0.67
350550 80 90 75 50 73.15 0.92 58.00 0.73
400550 80 95 95 75 77.83 0.98 61.70 0.78
420550 85 100 95 85 79.00 1.00 62.63 0.79
Table 8. Economic benefits under multiple irrigation quotas (USD ha−1).
Irrigation Quotas
(mm)
Agricultural InputOther InputASDI
(DO at 24.55 mg L−1)
Non-Aeration Treatment
(DO at 5 mg L−1)
Seedling CostPesticides and FertilizersIrrigation WaterLabor
Cost
Equipment CostDrip Belt
Cost
Output ValueTotal InputNet IncomeOutput ValueTotal InputNet Income
2003071 1815 177 11,718 1050 85 39,737 17,916 21,821 31,504 16,866 14,638
2503071 1815 221 11,718 1050 85 44,872 17,960 26,912 35,576 16,910 18,666
3003071 1815 265 11,718 1050 85 49,640 18,004 31,635 39,355 16,954 22,401
3503071 1815 310 11,718 1050 85 53,911 18,048 35,863 42,742 16,998 25,743
4003071 1815 354 11,718 1050 85 57,357 18,093 39,264 45,473 17,042 28,431
4203071 1815 371 11,718 1050 85 58,221 18,110 40,111 46,158 17,060 29,098
Note: The prices of all expenses in the table were converted into the cost or income of tomatoes per hectare in a single crop season. Tomato seedling was 7.40 USD per 100 plant, fruit 0.74 USD kg−1, urea 0.67 USD kg−1, phosphate fertilizer (calcium phosphate) 0.27 USD kg−1, potassium fertilizer (potassium sulfate) 1.08 USD kg−1. 0.09 USD m−3 for agricultural water; the labor cost was USD 23,400 ha−1 per crop season [26], the aeration generator was 22,200 USD, control range was 0.13 ha−1, and maintenance cost of 29.48 USD per crop season; drip tape was 37.73 USD km−1 lasted for 10 years.
Disclaimer/Publisher’s Note: The statements, opinions and data contained in all publications are solely those of the individual author(s) and contributor(s) and not of MDPI and/or the editor(s). MDPI and/or the editor(s) disclaim responsibility for any injury to people or property resulting from any ideas, methods, instructions or products referred to in the content.

