Article

Simulation of Potassium Availability in the Application of Biochar in Agricultural Soil

by
Charalampos Doulgeris
1,*,
Zacharenia Kypritidou
2,
Vasiliki Kinigopoulou
1 and
Evangelos Hatzigiannakis
1
1
Soil and Water Resources Institute (SWRI), Hellenic Agricultural Organisation «DEMETER», 57400 Sindos, Greece
2
Department of Economic Geology and Geochemistry, Faculty of Geology and Geo-Environment, National & Kapodistrian University of Athens, 15784 Athens, Greece
*
Author to whom correspondence should be addressed.
Agronomy 2023, 13(3), 784; https://doi.org/10.3390/agronomy13030784
Submission received: 31 January 2023 / Revised: 3 March 2023 / Accepted: 6 March 2023 / Published: 8 March 2023

Abstract

:
Nutrient availability after fertilising agricultural soils is affected by many factors, including soil moisture conditions and physicochemical properties. Herein, the availability of potassium in soil enriched with biochar is studied, considering either saturated or unsaturated moisture conditions and questioning key ion exchange approaches, such as equilibrium exchange (E.E.) and kinetic exchange (K.E.). Potassium release is simulated from a soil–biochar mixture of 0, 0.5, 1 and 2% by coupling HYDRUS-1D and PHREEQC models. The water flow, mass transport and geochemical processes are simulated for a cultivation period that imitates agronomic and environmental conditions of a common agricultural field in Northern Greece. Potassium is released gradually during the irrigation period in the case of unsaturated flow conditions as opposed to its complete release over a few days in the case of saturated flow conditions in the soil. Regarding ion-exchange processes, the soluble amount of potassium is more readily available for transport in soil solution when using the E.E. approach compared to the K.E. approach that assumes a kinetically controlled release due to interactions occurring at the solid–solution interface. The increased proportion of biochar in soil results in a doubling of available potassium. Among the four modelling schemes, although the total mass of potassium released into soil solution is similar, there is a significant variation in release time, indicating that simplified saturated conditions may lead to unrealistic estimates of nutrient availability. Further experimental work will be valuable to decrease the uncertainty of model parameter estimation in the K.E. approach.

1. Introduction

Considering the rapid population growth, climate change, extreme weather conditions and a lack of arable land, crop production must be safeguarded to mitigate a potential food crisis. For faster plant growth and greater crop yields, the soil is usually enriched in modern agriculture through inorganic fertilizers that provide the necessary nutrients [1]. However, excessive and long-term fertilization can cause soil degradation [2], nutrient leaching [3] and, consequently, groundwater pollution [4] and surface water eutrophication [5]. In addition, the efficiency of synthetic fertilizers is affected by the loss of nutrients through leaching, affecting plant nutrition and increasing the financial burden for farmers [6]. Therefore, sustainable development requires alternative, more effective and environmentally friendly fertilization strategies.
In recent years, carbon-based materials have been shown to be effective as soil amendments [7,8]. This happens because, among others, they have the potential to reduce nutrient leaching and, consequently, increase fertilization efficiency. At the same time, their environmental footprint is more favourable than that of synthetic fertilizers [9]. Biochar is a carbon-rich solid formed by the thermal decomposition of biomass under conditions of a limited presence or a complete absence of oxygen (pyrolysis). Its application has a positive effect on the physicochemical, biological and hydrodynamic properties of agricultural soils [10,11], thus positively affecting nutrient availability. In addition, it enhances the capture of carbon dioxide in the form of solid carbon to soils [12]. So far, many studies have emphasised the effect of biochar on soil and plants with respect to nutrient uptake. Particularly, it has been demonstrated that biochar enhances potassium availability through various mechanisms mainly based on the increased potassium retention capacity associated with a high porosity, surface area, and cation exchange capacity of the biochar, ultimately resulting in higher potassium absorbance by plants [13].
In agricultural soils, non-linear (non-uniform) processes of water flow and complex biogeochemical reactions take place. Several numerical models have been developed to solve saturated and/or unsaturated flow equations in conjunction with solving geochemical reactions, such as, 3DHYDROGEOCHEM [14], HP1 [15,16], RICH-PHREEQC [17], TOUGHREACT [18] and HPx [19], among others. These models have been applied to a number of studies that reported combined geochemical processes and unsaturated flow. More specifically, with the application of HP1, which is a combination of HYDRUS-1D and PHREEQC codes, Jacques et al. [20] simulated the transport of calcium, phosphorus and uranium to agricultural land where an inorganic phosphorus fertilizer is applied, as well as the transport of major cations and heavy metals [15]. The results show that fluctuations in soil moisture and, consequently, in water flow can significantly affect the mobility and availability of chemical substances and elements. Similar conclusions were drawn from the study of Leterme et al. [21] and Gai et al. [22], where the transport of mercury under unsaturated flow conditions was explored.
Despite the efforts to study the utilization of biochar in agriculture as a slow-release fertilizer and to quantify the release of nutrients into the soil, the results are often contradictory [9,23,24,25] and thus, it is required to further clarify the mechanisms of nutrient release in the soil. The nutrient potential of biochar is influenced by many factors, such as soil physicochemical properties and soil moisture. Therefore, the mechanisms of nutrient release would be reasonable to be studied under variable soil moisture conditions (i.e., under unsaturated flow conditions), even though the assumption that the soil moisture is constantly at saturated conditions greatly simplifies the analysis and is, therefore, adopted in many research efforts [26]. In addition, it is unclear whether an ion exchange approach is sufficient for agronomic applications or whether a more rigorous kinetically controlled release is required to represent key geochemical processes.
The objective of this work is to study the availability of potassium in agricultural soil/biochar mixtures under either saturated or unsaturated soil moisture conditions by examining either an equilibrium ion exchange or a kinetic ion exchange release mechanism. The coupling of HYDRUS-1D with PHREEQC enables the conjunctive study of the effect of soil moisture and geochemical processes on nutrient availability in agricultural soils. The release of potassium in unsaturated flow conditions is compared with the corresponding release in saturated flow conditions, revealing the significant effect of water flow conditions on nutrient availability. Furthermore, the equilibrium exchange approach is compared to the kinetic exchange approach and reveals the necessity of additional field experiments towards a quantitative description of nutrient release mechanisms.

2. Methodology

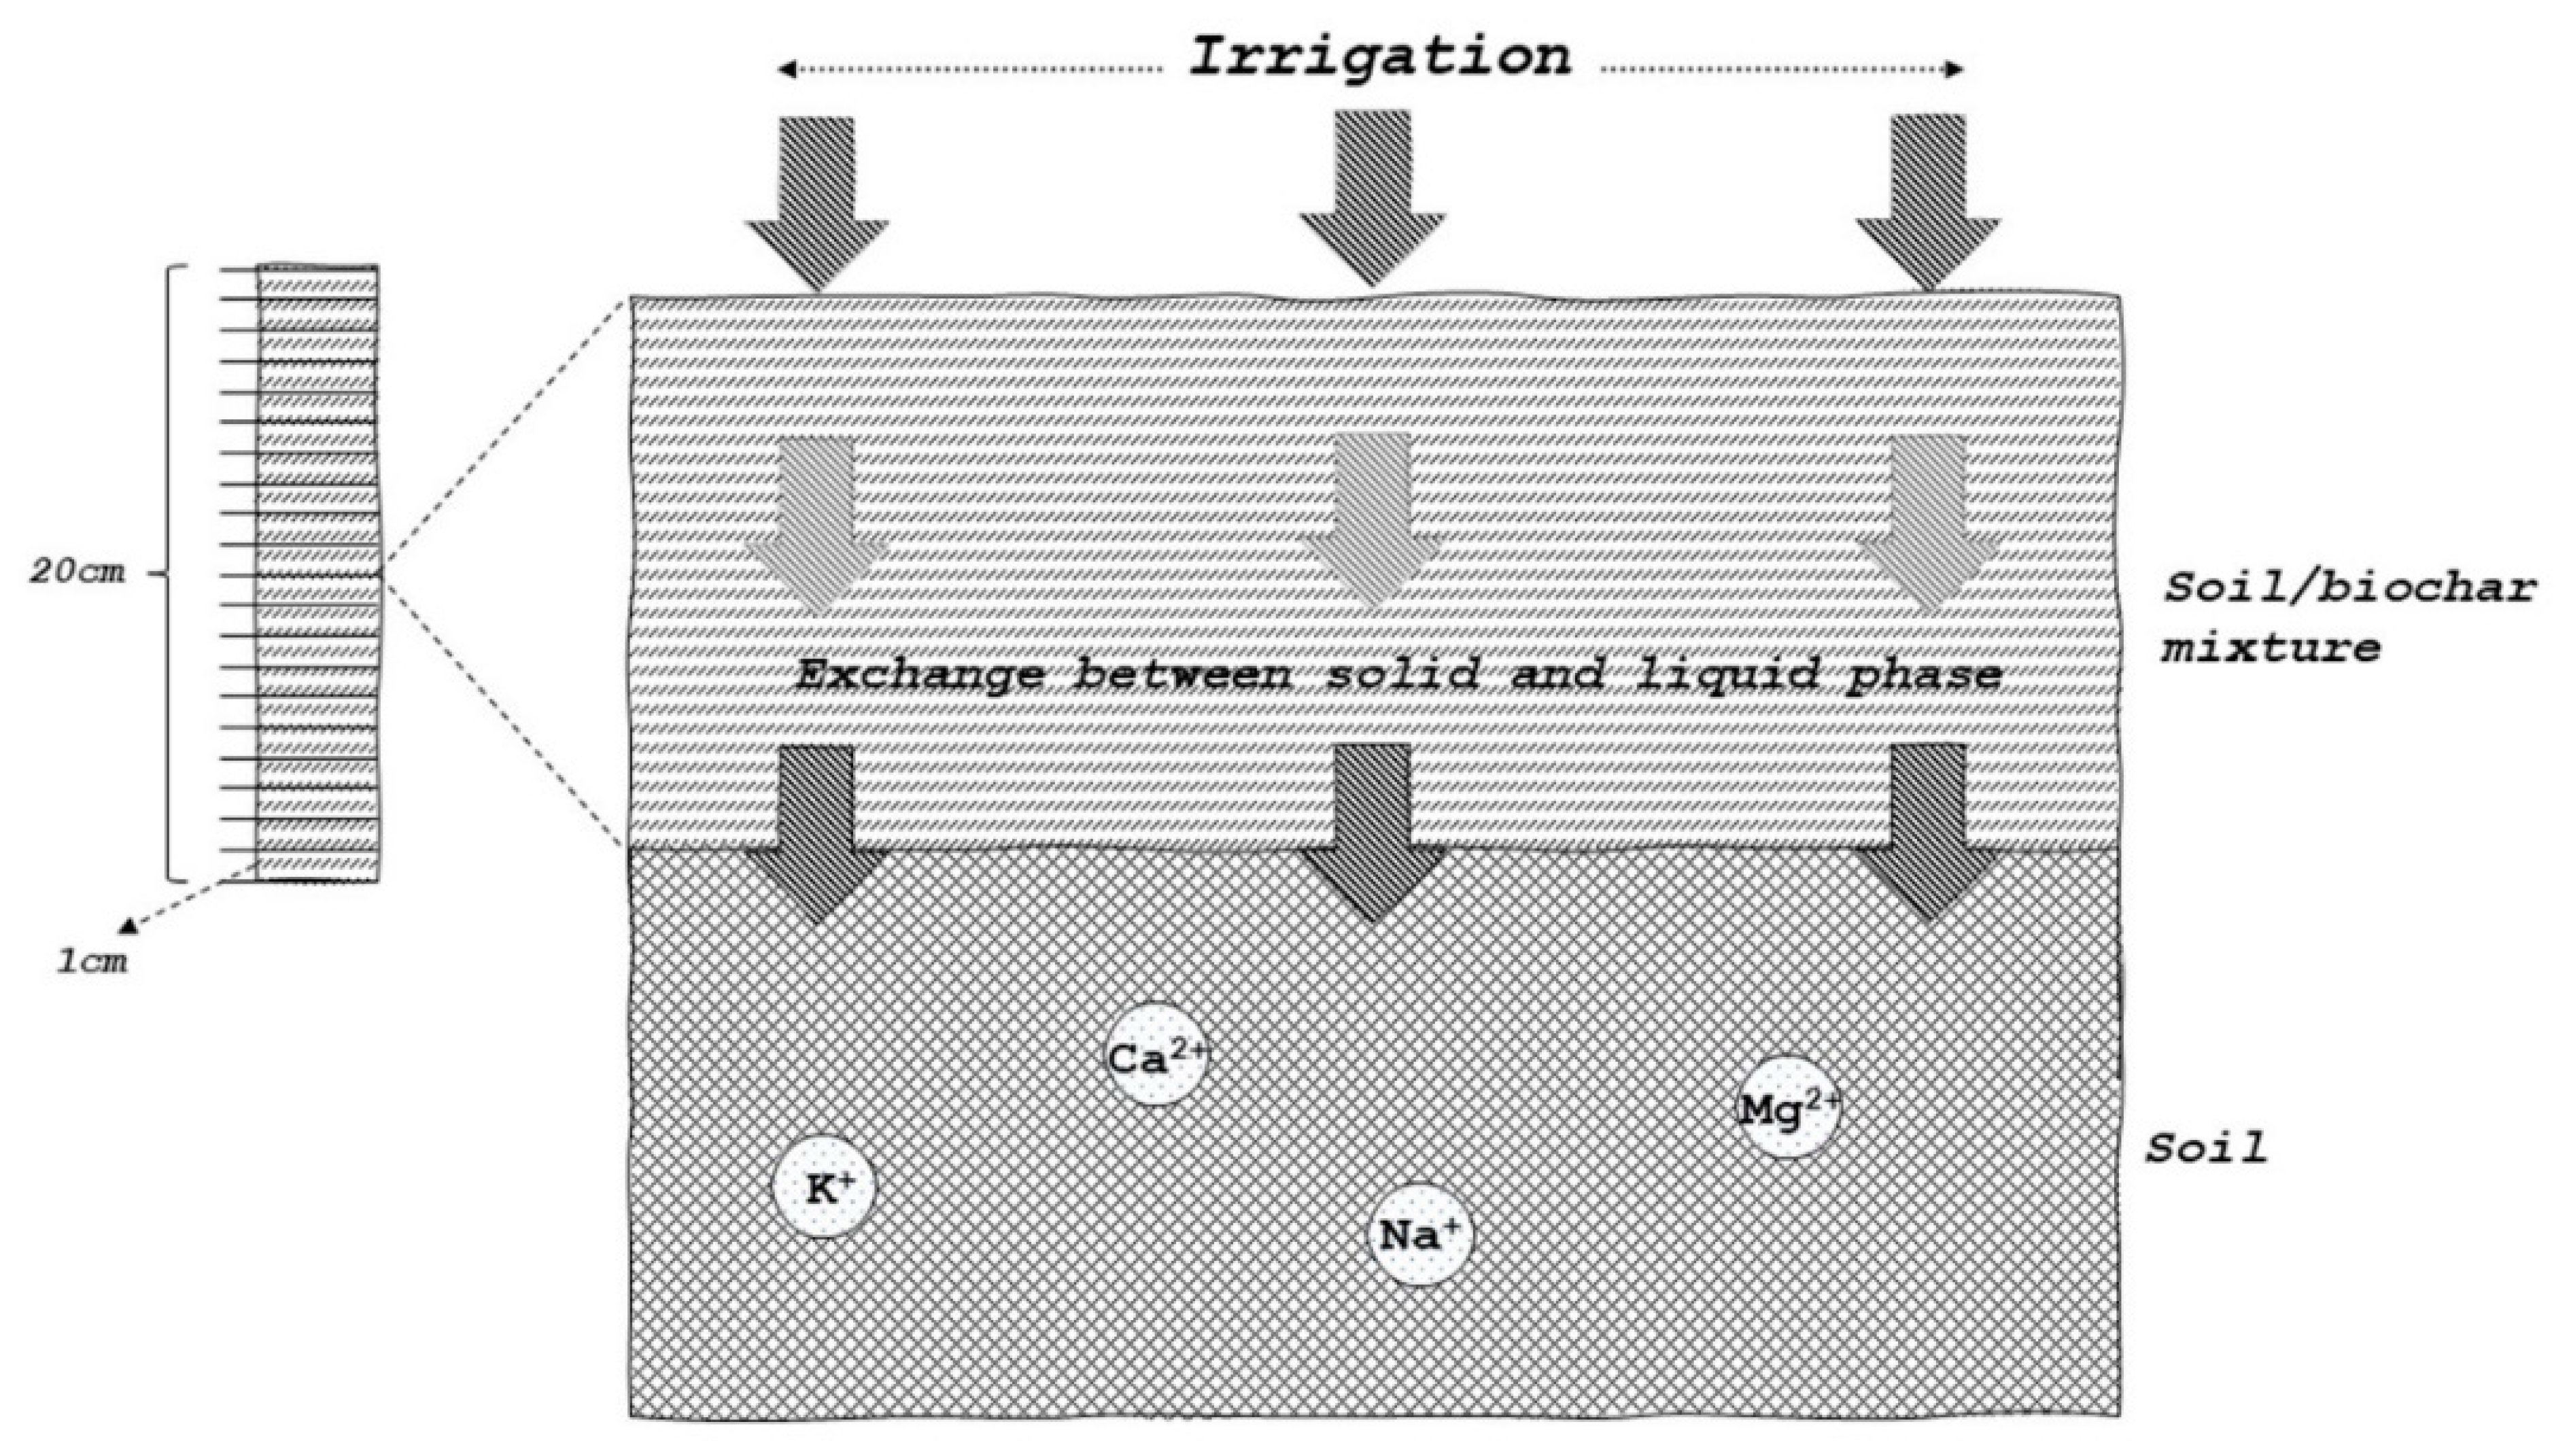
2.1. Water Flow in the Unsaturated Soil Zone

The one-dimensional, vertical, water movement in the unsaturated soil zone (vadose zone) is described with the mixed form of Richard’s equation (Equation (1)):
θ t = z [ K ( h ) ( h z + 1 ) ]
where θ is the volumetric water content (L3 L−3); h is the water pressure head (L); t is time (T); z is the vertical coordinate (L); K is the hydraulic conductivity (L T−1).
The soil hydraulic functions of van Genuchten [27], who used the pore-size distribution model of Mualem [28], are used to determine the relationship between soil moisture and the water pressure head, known as the characteristic soil curve, and the relationship between unsaturated hydraulic conductivity and soil water pressure (or soil moisture). Van Genuchten’s formulas are
θ ( h ) = { θ r + θ s θ r ( 1 + | ah | n ) m , h < 0 θ s , h 0
K ( h ) = K s S e λ [ 1 ( 1 S e 1 m ) m ] 2
S e = θ θ r θ s θ r
where θs is the saturated water content (L3 L−3); θr is the residual water content (L3 L−3); Ks is the saturated hydraulic conductivity (L T−1); Se is the effective water content; and a, n, m are parameters, where m = 1 − 1/n and λ is the pore-connectivity parameter, which is assumed to be about 0.5 as an average for many soil types.
The boundary condition at the top of the soil column, i.e., at the soil surface, is determined by the inflow of water due to irrigation and rainfall, and is expressed by the relation:
K ( h z + 1 ) = q 0 ( t )
where q0 is the net inflow or outflow [L T−1].
The boundary condition at the bottom of the soil column is simulated as a free drainage condition, and is expressed as
h z = 0
Richard’s equation (Equation (1)) could also be used to simulate the water flow in the soil zone under saturated conditions by applying appropriate boundary and initial conditions in the flow area of the soil column, such as a zero water pressure head.

2.2. Mass Transport and Geochemical Processes

The one-dimensional mass transport equation in a soil column under unsaturated flow conditions is expressed as [16]
θ c i t = z ( θ D i c i z ) qc i z + R i
where i (=1, 2, …, n) is the number of the substance in the soil solution (n is the total number of substances), c is the concentration of the substance in the solution [M L−3], D is the dispersion coefficient [L2 T−1], q is the Darcy flow [L T−1] and R is the source/sink term due to geochemical processes [M L−3 T−1].
The exchange of substances between the soil/biochar mixture and the soil solution was simulated either with the Equilibrium Exchange (E.E.) approach or the Kinetic Exchange (K.E.) approach. A comprehensive description could be found in Parkhurst and Appelo [29]. The substances considered here are K+, Na+, Ca2+ and Mg2+ ions. The E.E. approach assumes that only ion exchange reactions control the mobility of the cations within the soil/biochar column. The cations are in dynamic equilibrium within the soil solution and are readily available for exchange. The ion exchange coefficients between the different ion pairs were determined as half-reactions (X + 1/z Iz+ = I − X1/z, KI) relative to the sodium reference half-reaction (Na+ + X = NaX, KNa = 1) according to Gaines and Thomas convection [30].
On the other hand, the K.E. approach assumes a time-dependent release of nutrients from the solid surface (e.g., dissolution reactions as well as exchange reactions). Kinetic exchange can be expressed as a first-order reaction [31]:
d c dt = k ( c 0 c )
where k is the rate constant (T−1), c 0 is the initial elemental concentration in the column per mass of solid (mol/kg, M M−1) and c is the elemental concentration retained in the exchange sites of solid (mol/kg, M M−1). Therefore, the term ( c 0 c ) refers to the mobile elemental concentration that moves within the column at each time step. The rate constant, k, is determined experimentally and depends on the various retention mechanisms that occur within the solid particles of the column (exchange, sorption, precipitation of mineral phase, etc.). Following Tiruta-Barna [32], the rate constant could be determined as the ratio of the flow rate to the void volume which is equivalent to the ratio of water velocity to the soil column length [26].

2.3. Application of Biochar in the Soil

Loamy soil was collected from the upper soil layer (0–20 cm) of an agricultural field in the Sindos area (northern Greece) and fully mixed with biochar. The soil’s key characteristics are given in Table 1, in contrast with biochar characteristics. A detailed description of the laboratory methods used for the characterisation of the soil is provided in Kypritidou et al. [26]. Three cases of soil/biochar mixtures were examined, namely 0.5%, 1% and 2% of biochar, proportions that are usually met in agricultural practice.
The feedstock for the biochar used in this work was exhausted olive pomace from Tunisia. The biochar, prepared at a temperature of 450 °C, was collected from an industrial company in the Mahdia region. Pyrolysis temperature is an important parameter that influences not only the biochar production yield, but also its physico-chemical characteristics [33]. For agricultural valorisation purposes, pyrolysis temperatures between 400 °C and 500 °C are generally preferred in order to obtain respectable biochar yields (>25–30%) and sufficient bioavailable nutrient contents. According to previous work on this biomass [34], the biochar production yield at a temperature of 450 °C was evaluated to be more than 30%. Moreover, the produced biochar’s C and N content was higher than 80%, and 0.4%, respectively. The fraction of the biochar with a particle size lower than 1 mm was used during this study. Table 2 shows the concentrations of exchangeable cations in soil/biochar mixtures.

2.4. Coupling Water Flow, Mass Transport and Geochemical Processes

The amount of water applied to the soil during the irrigation period mobilises the water-soluble and exchangeable fraction of ions/nutrients (K+, Na+, Ca2+ and Mg2+) from the solid phase of the soil/biochar mixture, and is then transported downwards to the bottom of the soil column (Figure 1). The physicochemical characteristics of the irrigation water are given in Table 3. The soil hydraulic parameters, as expressed by van Genuchten water retention parameters and the saturated hydraulic conductivity, are estimated by soil texture and bulk density [35] and given in Table 4. The simulation takes place either for saturated flow or for unsaturated flow conditions. In the former case, the boundary conditions at the top and bottom of the soil column are modified and a constant pressure head (h = 0 m) is applied to ensure saturated moisture conditions in the soil column. In the latter case, the boundary conditions are expressed by Equations (5) and (6), considering at the top of the soil a typical irrigation schedule for climatic conditions similar to Northern Greece (Figure 2).
Herein, we exploit the capabilities of HP1 that couples HYDRUS-1D with PHREEQC and incorporates modules to simulate transient water flow in variably saturated porous media, transport of multiple components, and mixed equilibrium/kinetic geochemical reactions. Particularly, the simulation of water flow (Equation (1)) and nutrient mass transport (Equation (7)) is performed via the HYDRUS-1D environment. At each computational node of the one-dimensional finite element mesh, based on which the soil column is discretised in HYDRUS-1D, and for each time step of the calculations, PHREEQC (employing phreeqc.dat database) is called for the simulation of geochemical processes following either the E.E. approach or the K.E. approach. The E.E. approach assumes that the exchangeable cations (Table 2) are in equilibrium with the soil solution and that the ion exchange reactions mainly determine the cation mobility within the soil/biochar mixture. The K.E. approach assumes a kinetically controlled release of ions (Equation (8)) with a rate constant approximated by the ratio of saturated water velocity (10 cm d−1) to column length (20 cm), i.e., k = 0.5 d−1. In addition, the solution of soil column is considered to be in equilibrium with CO2, setting the partial pressure PCO2 = 10−1.5 atm, and the amount of calcite equal to 0.05 mol, as estimated from the CaCO3 equivalent in the agricultural soil (Table 1).

3. Results

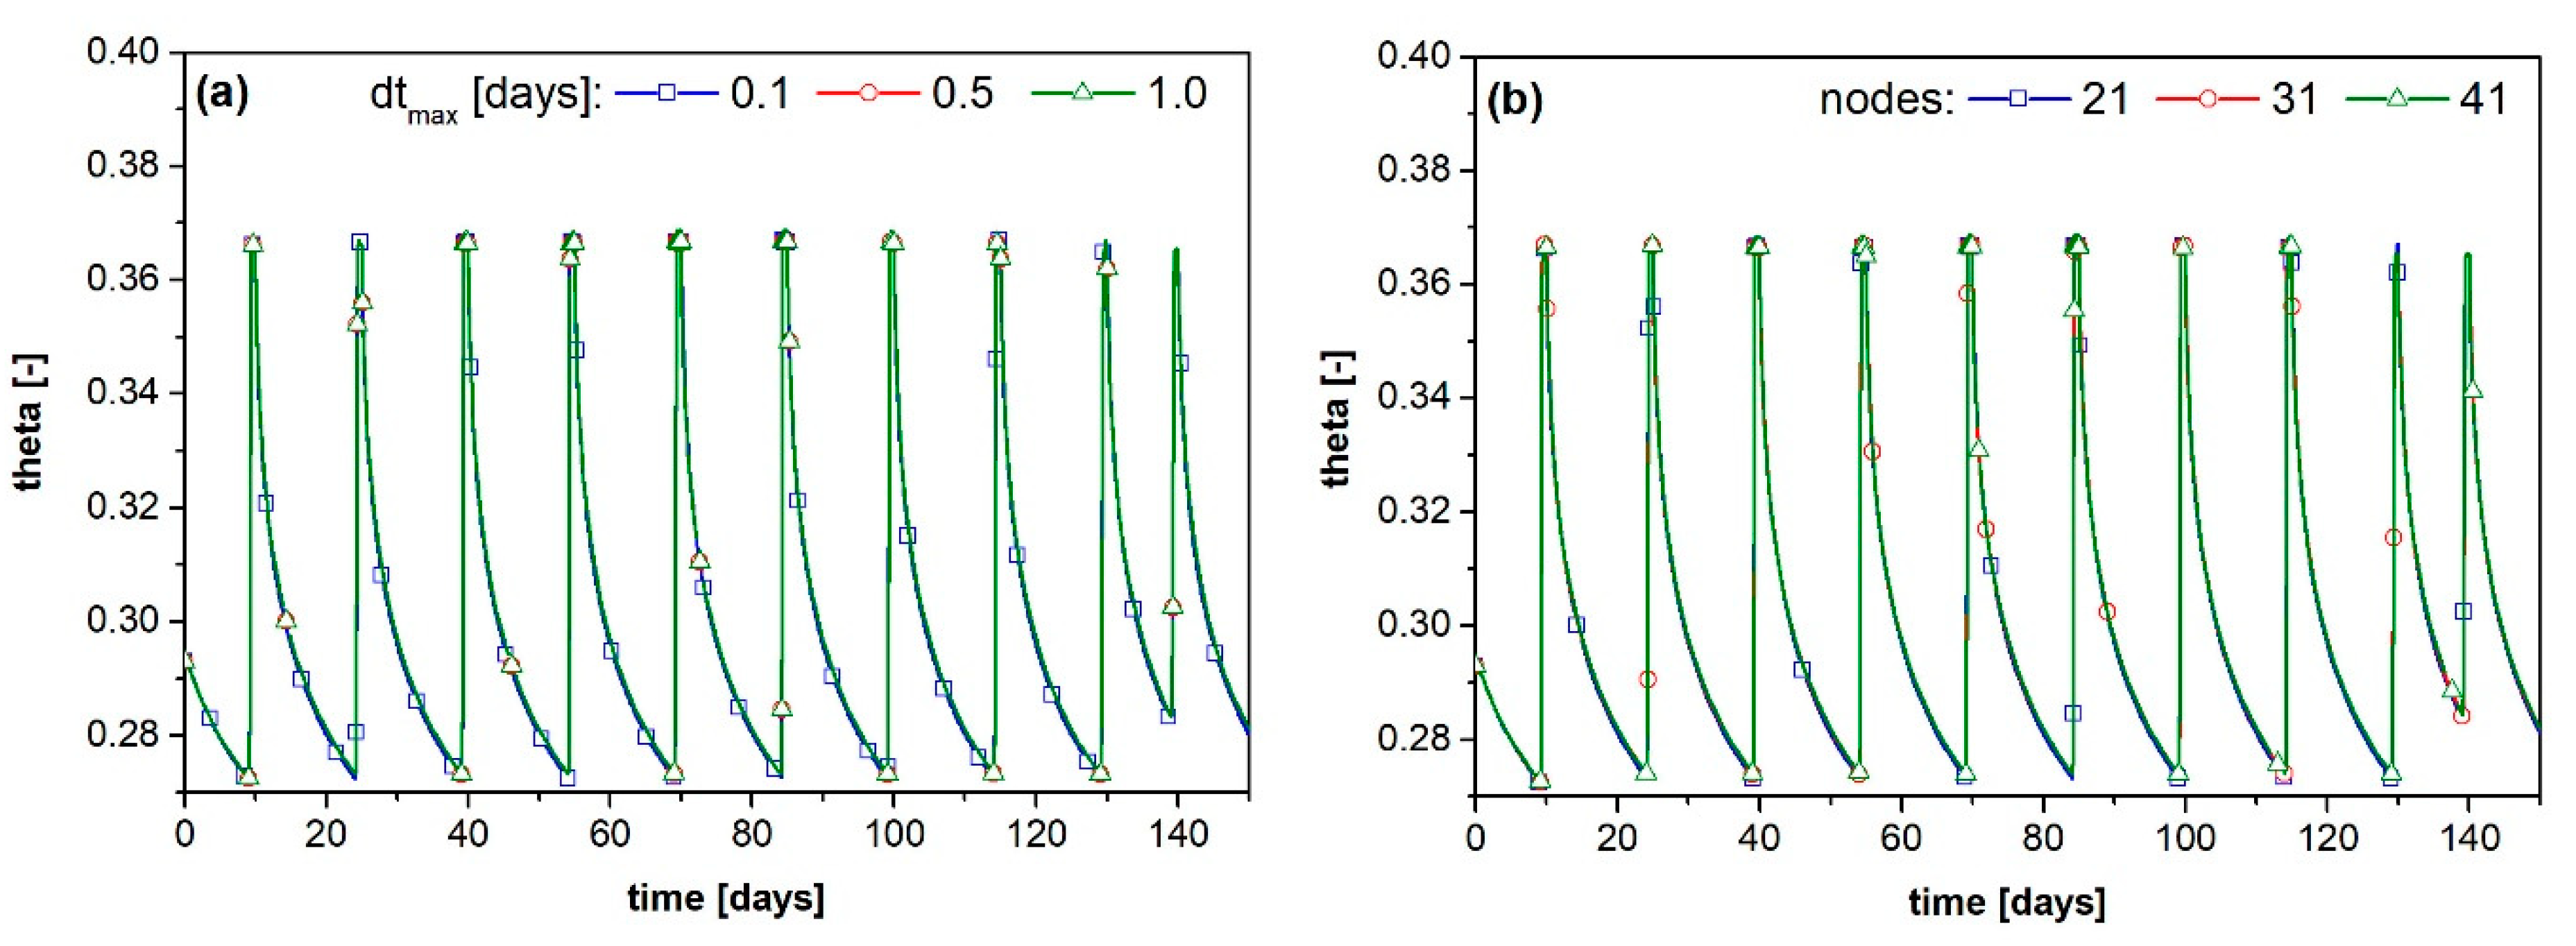
3.1. Time Step and Spatial Discretisation

The HYDRUS-1D model was applied to the first 20 cm of the soil/biochar mixture for a simulation period of 150 days. Prior to the coupling of HYDRUS with PHREEQC, the effect of the time step and the number of finite element nodes on the accuracy of the model results under unsaturated flow conditions was evaluated. Specifically, three values for the maximum time step (namely 0.1/0.5/1 day) were tested, as well as three discretisation schemes of the flow area (21/31/41 nodes). Figure 3 compares the soil moisture at the bottom of the soil column, i.e., at a distance of 20 cm from the soil surface, for the examined cases of the time step and number of nodes; we observe almost identical results with very small differences in lower soil moisture values. Thus, 1 day as the maximum time step and 21 nodes as the discretisation scheme can be selected to safely accelerate the simulation experiments hereinafter.

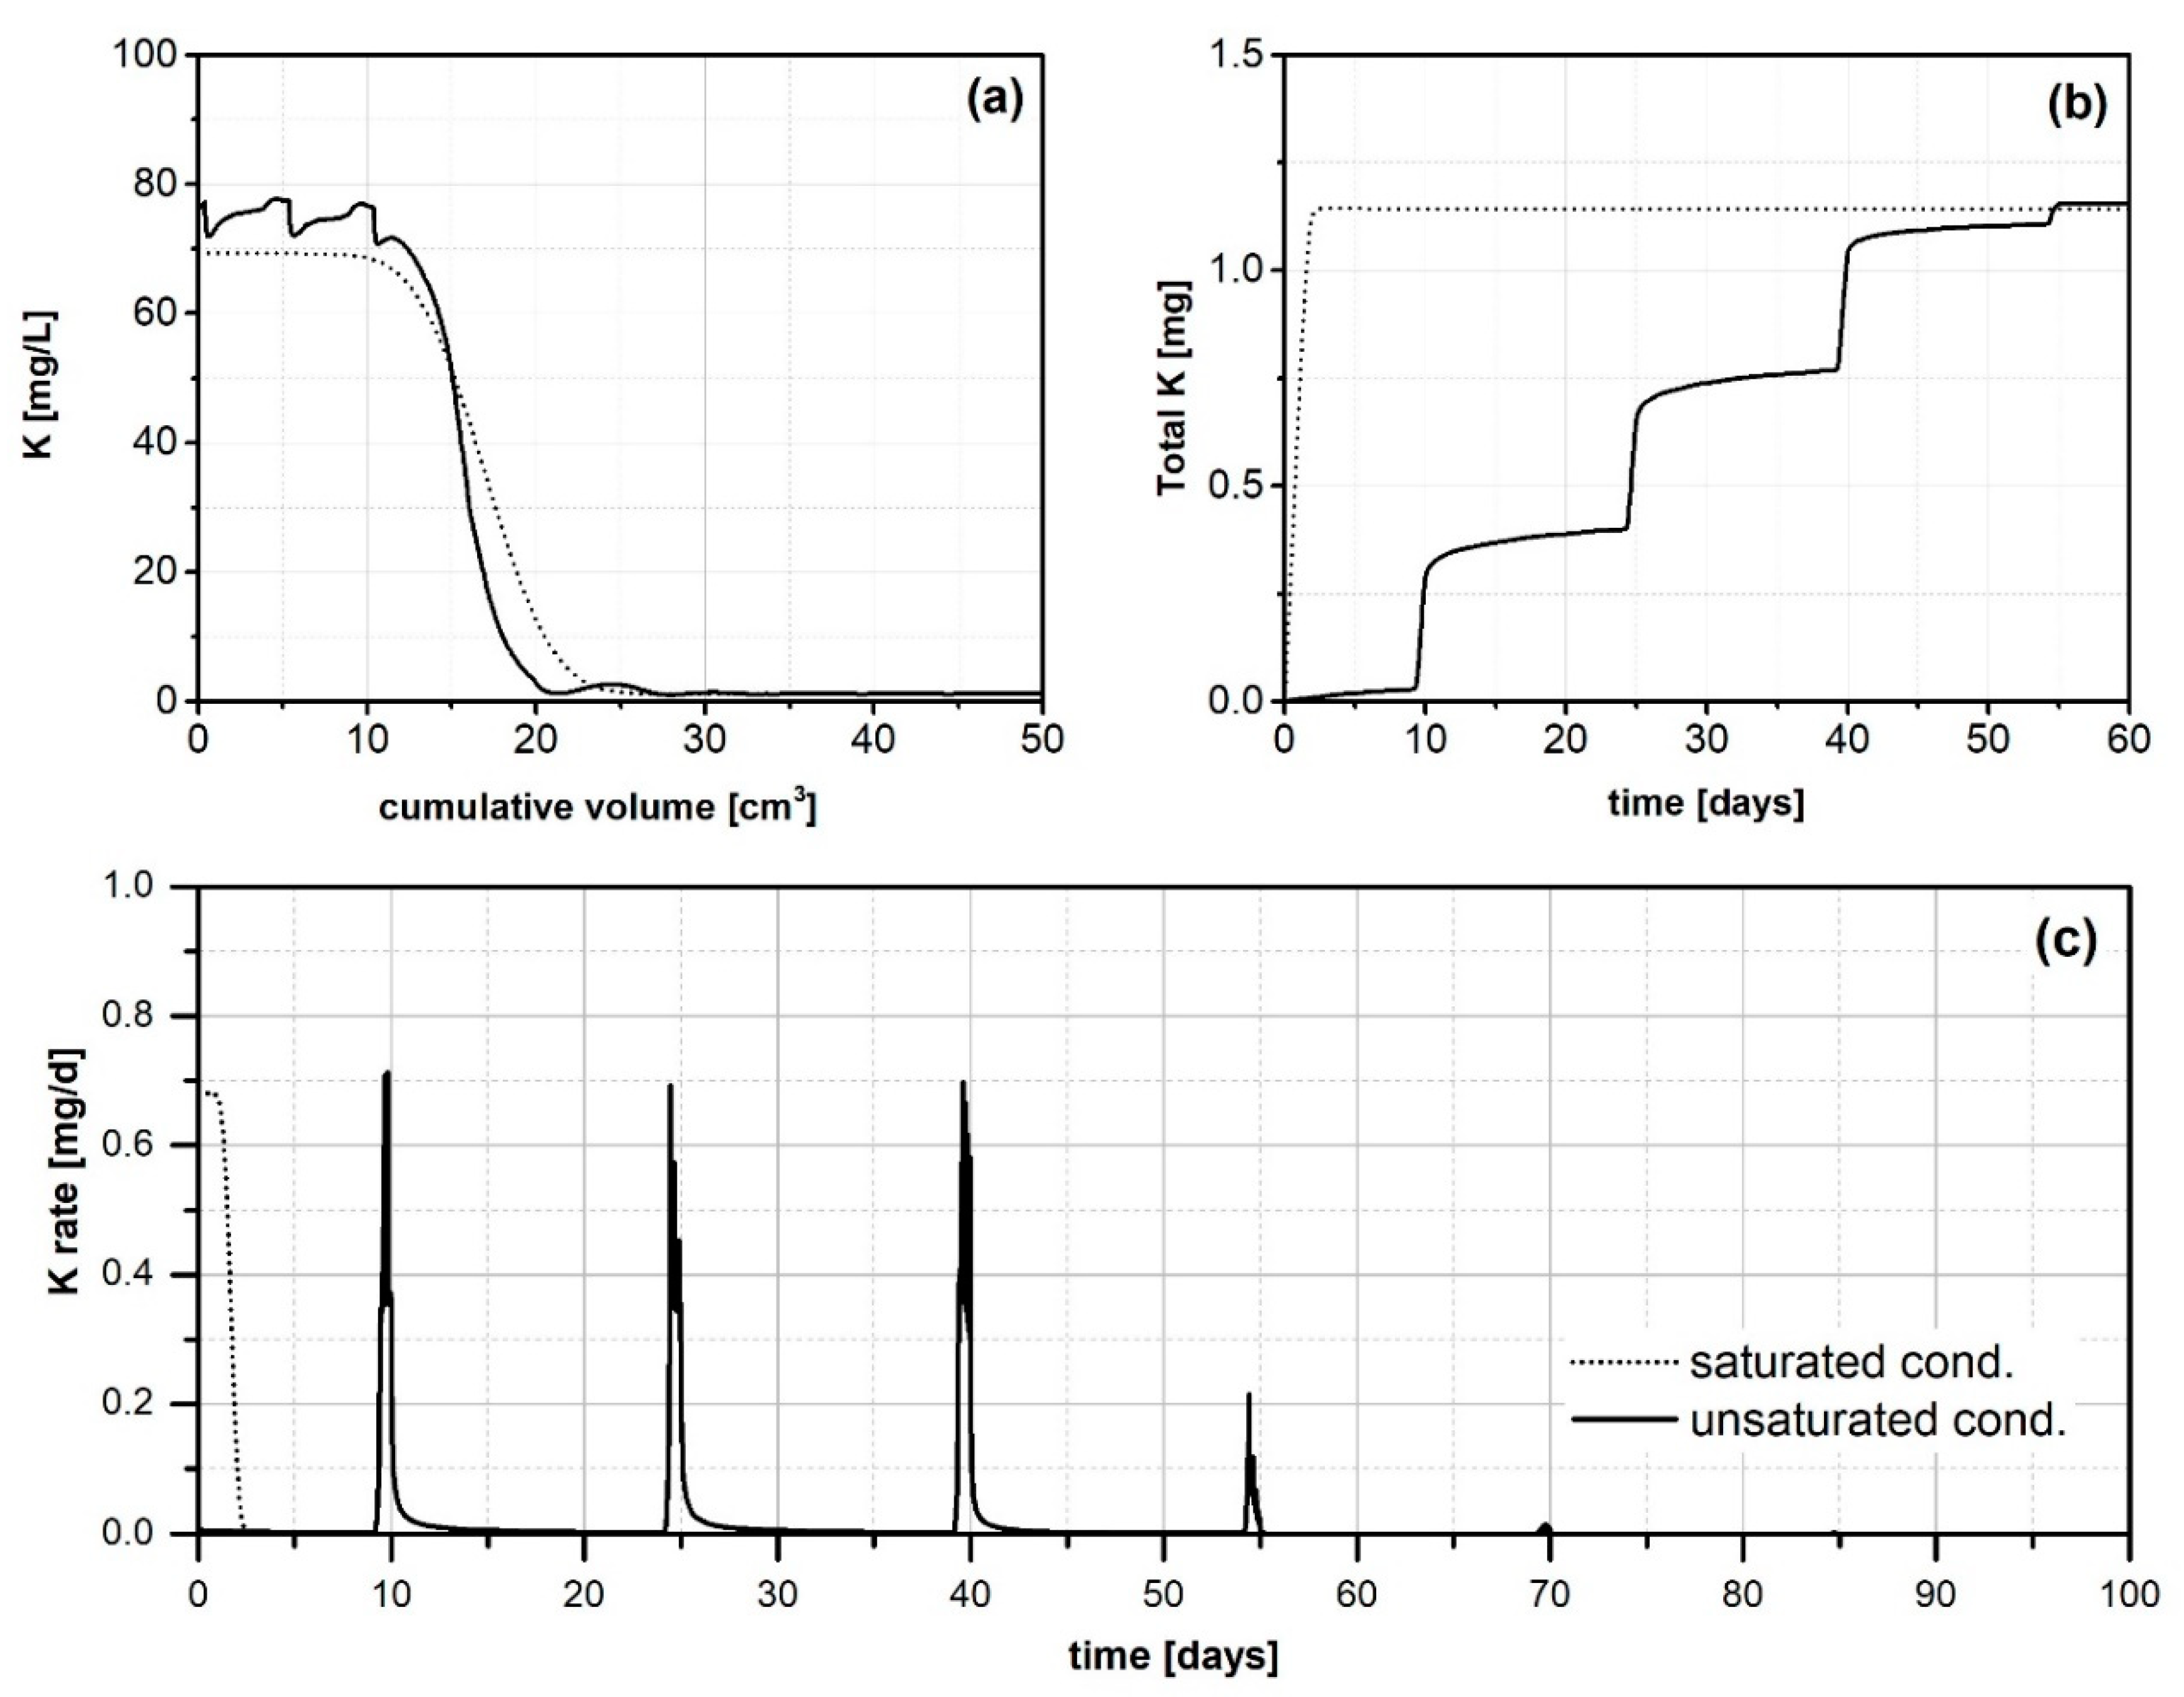
3.2. Equilibrium Exchange Approach under Saturated/Unsaturated Conditions

Figure 4 shows the concentration of potassium at the bottom of the soil column for the soil/biochar mixtures under saturated flow conditions (Figure 4a) and unsaturated flow conditions (Figure 4b), using the E.E. geochemical approach. As expected, the outflow of potassium from the first 20 cm of the soil/biochar mixture increases as the biochar material, which is quite rich in potassium, increases in the soil. Consequently, the availability of potassium in the lower part of the agricultural soil (below 20 cm) increases, which also contributes to plant nutrition. However, we notice a rapid release of the total available potassium in soil solution that is completed within 2 to 3 days under saturated flow conditions. On the contrary, in the case of unsaturated flow conditions, the release of total available potassium lasts until 55 to 70 days, depending on the amount of biochar in the soil. The fast release of the available potassium under saturated conditions indicates that the adoption of saturated flow, even though it simplifies modelling, significantly underestimates the total release time, and thus, should be avoided if realistic nutrient availability estimation in the soil is anticipated.
To further analyse the differences in potassium release among saturated and unsaturated soil moisture conditions, in Figure 5 we present a comparative evaluation of the potassium release from the first 20 cm of soil between saturated and unsaturated flow conditions, considering indicatively that the proportion of biochar in the soil is 0%. We observe that the potassium release from soil column is highly dependent on the cumulative water volume that outflows from the soil column (Figure 5a). Furthermore, the total mass of potassium released into the soil solution is practically the same for the two different water flow conditions (Figure 5b), even though there is a considerable difference in the total release time. The above observations reveal an explicit connection among the potassium release from the soil column and the water flow in the soil column, considering that the water flow under saturated conditions is approximately one order of magnitude higher compared to the corresponding flow under unsaturated conditions. This explicit connection between the potassium release and the water flow in the soil column is also clearly illustrated in Figure 5c, where we observe that in the case of unsaturated flow, potassium is gradually released into the soil solution after each irrigation dose is applied in the soil, in contrast to the the rapid total release of potassium in the case of saturated flow conditions.

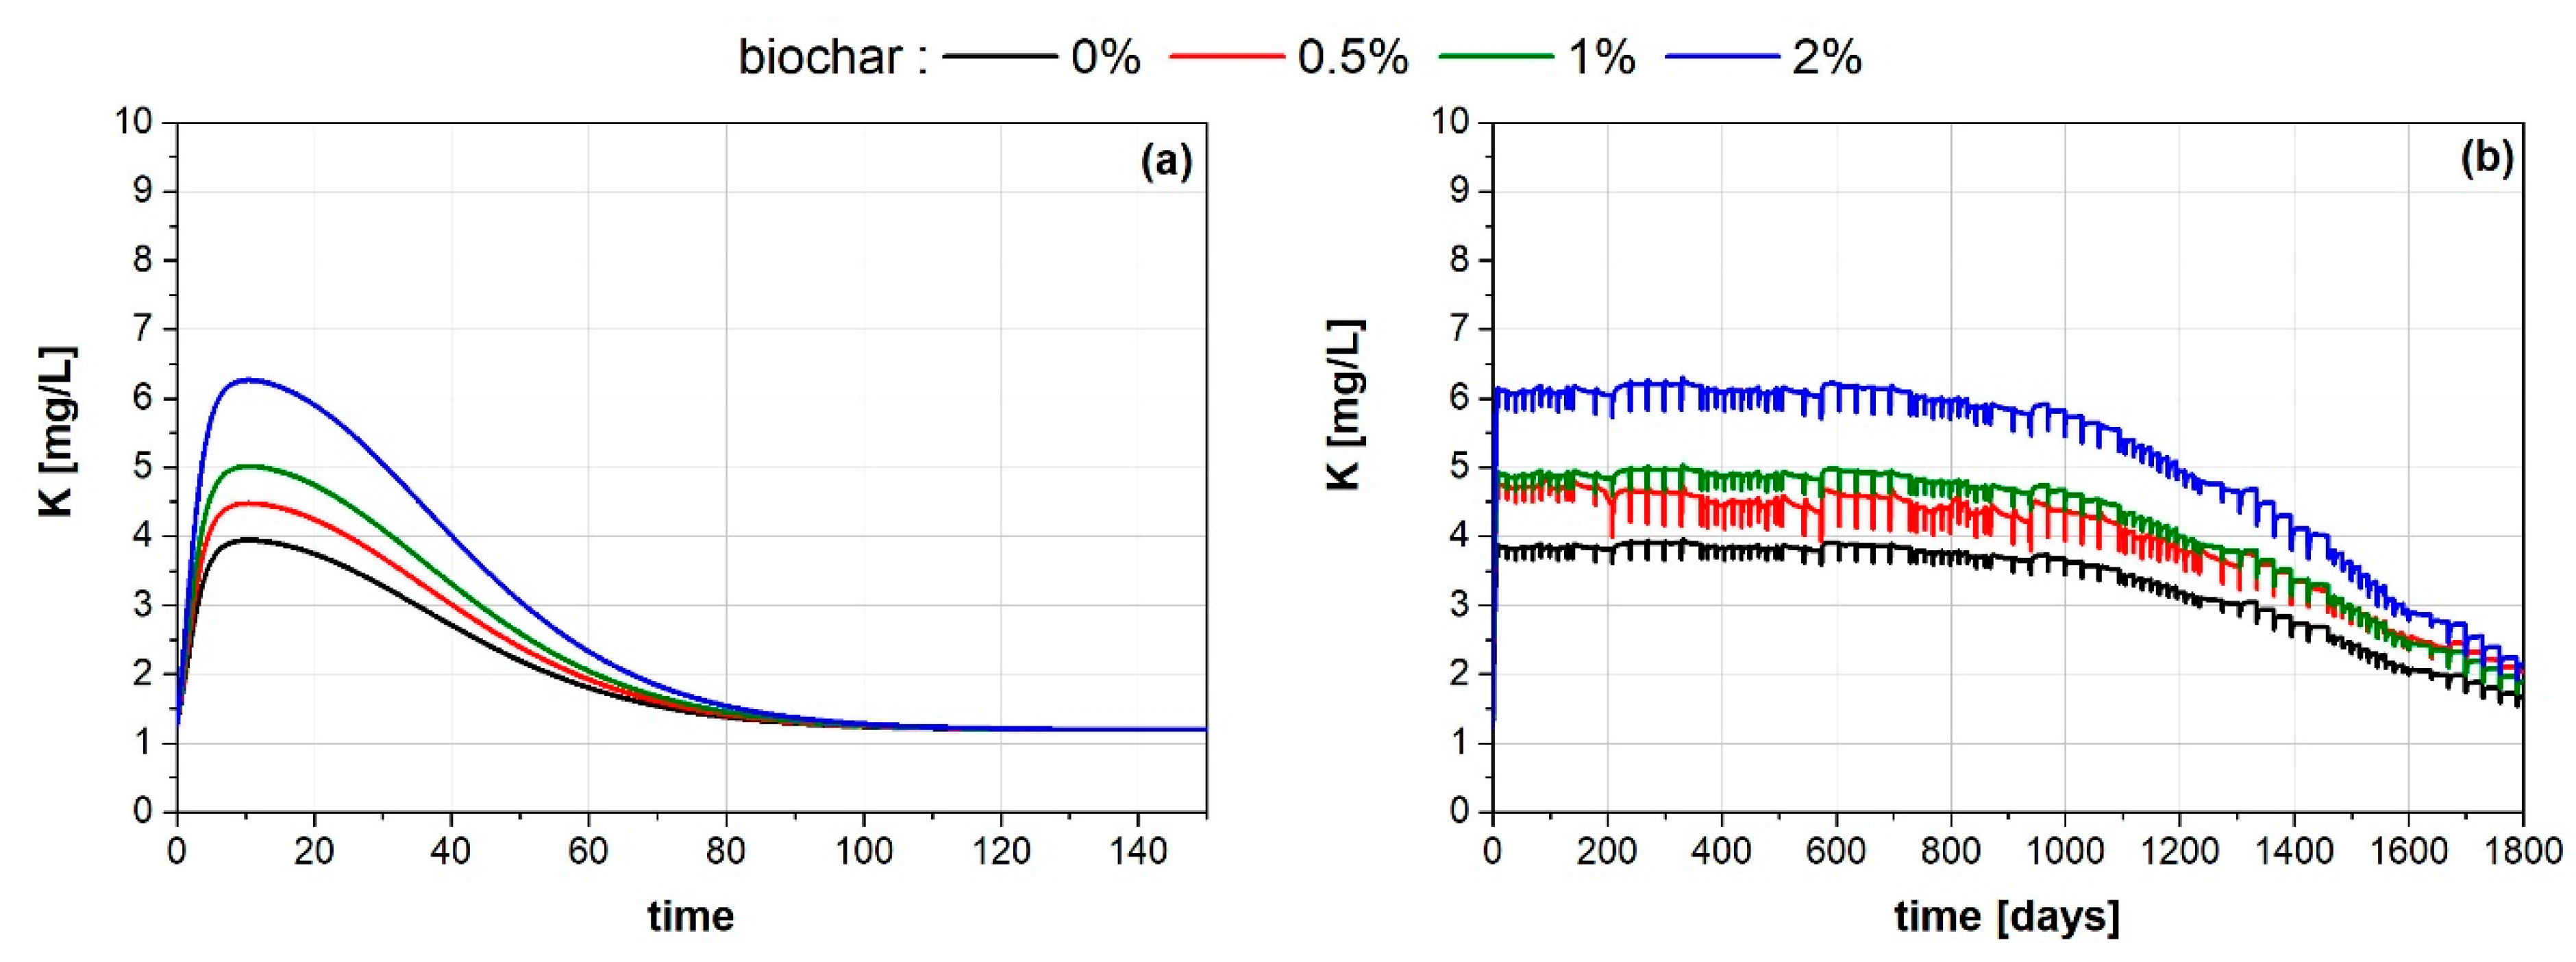
3.3. Kinetic Exchange Approach under Saturated/Unsaturated Conditions

The K.E. approach involves a time-dependent release of ions/nutrients from the soil/biochar mixture that is kinetically controlled by using a rate constant (k) equal to 0.5 d−1. Figure 6 gives the concentration of potassium at the bottom of the soil column either under saturated flow conditions (Figure 6a) or unsaturated flow conditions (Figure 6b), using the K.E. approach. Similar to the E.E. approach, for the K.E. approach we also observe a faster release of the total available potassium into the soil solution under saturated flow conditions compared to the unsaturated flow conditions, indicating again the relation between the potassium release from the soil column and the water flow in the soil column. However, comparing the potassium release of the E.E. and K.E. approaches (Figure 5 and Figure 6), either for saturated or unsaturated conditions, we observe a considerably lower concentration of potassium for a quite longer period when the K.E. approach is adopted. This indicates that potassium is more readily available for transport when adopting the E.E. approach compared to the K.E. approach, that, apart from ion exchange, additionally assumes a kinetically controlled release due to interactions occurring at the solid–solution interface. If the K.E. approach is adopted, two mechanisms control the mobility of the cations: the interaction of water with the solids (expressed by Equation (8)) and the movement of water within the soil column, and thus, the leaching rate of ions/nutrients is lower compared to E.E. approach. Consequently, the K.E. approach estimates a significantly higher time for the total release of potassium; in particular, under saturated conditions, the elution of potassium is completed after approximately 80 days (Figure 6a), whereas under unsaturated conditions it takes more than 5 years (Figure 6b).
Even though the K.E. approach is theoretically more rigorous than the E.E. approach, it also adds another uncertainty to the simulation process related to the estimation of the rate constant (k). To focus on this issue, in Figure 7 we compare the potassium release for three different values of rate constant (0.05, 0.5 and 5), under saturated and unsaturated flow conditions, considering indicatively that the proportion of biochar in the soil is 0%. We observe that for higher values of the rate constant, the mass of potassium is released faster to the soil solution and characteristic peaks appeared after each irrigation dose in the case of unsaturated flow conditions.

4. Discussion

Potassium in biochar is present in water-soluble, exchangeable and insoluble forms. Water-soluble K is released during the dissolution of K-rich salts, such as KCl, K2SO4 and KNO3 [23]. Exchangeable K is associated with the organic functional groups of biochar, whereas insoluble K is in stable phases, such as silicate minerals or incorporated within the amorphous phase [36,37]. Among them, water-soluble and exchangeable K comprise more than 90% of the total K content, and are the main pools of K in biochar-amended soils [36]. In our study, the leached K comprise 25% of the total K present, and is related to the presence of KCl in biochar. KCl is highly water-soluble and the main K source in the biochar-amended soils, explaining the great K amounts eluted (Table 2). Other K pools may also add K in the soils in a long-term basis, due to biochar degradation [10], following a kinetic approach as the one simulated.
Biochar enhances the microbial and flora activity in soils, and modifies the available potassium pools [38]. These bacteria, as well as the rhizosphere of the plants, excrete organic anions that may destroy the K-bearing mineral phases in soil. Additionally, the degradation of biochar with time contributes to the available nutrient pools. The microbial activity, therefore, also aids in enriching the soils with K [38]. However, the amount of K released due to biochar decomposition seems to be of secondary importance compared to that released from water-leachable and exchangeable pools. The reported rates of biochar decomposition (and therefore of mobilization of insoluble K) are 0.0093% per day [39], whilst the leaching rates of water-soluble K exceed 0.15% per day [40].
The nutrient availability when fertilising an agricultural soil is influenced by many factors, such as the physicochemical soil properties and soil moisture. In this work, the potassium release from the soil/biochar mixture was studied during an irrigation period under variable soil moisture conditions and considering an equilibrium or a kinetic ion exchange release mechanism. The combined use of the HYDRUS flow/transport and the PHREEQC geochemical codes allowed the investigation of the simultaneous effect of soil moisture conditions and prevailing geochemical processes on nutrient availability in agricultural soils.
The leaching behaviour of potassium is not only influenced by the initial elemental amount present in the soil, but it is substantially controlled/affected by the soil moisture condition (saturated/unsaturated) and the prevailing geochemical reactions/mechanisms. The mobility of the element depends upon various geochemical reactions occurring at the water/solid interface, such as sorption, ion-exchange and precipitation [23,26]. This is most easily observed in the simplified case of saturated E.E. models (Figure S1). High eluted concentrations of potassium, calcium and magnesium were observed in biochar-amended clayey soils by Major et al. [41] and were attributed to steady-state flow conditions of water within these soils. The presence of other cations in the system plays an important role in potassium availability and mobility. Calcium is the main cation that competes with potassium in the exchange sites of solids [42]. Higher amounts of potassium were leached from soils eluted with calcium-rich solutions, compared to those eluted with deionised water, implying the high selectivity of the cation for the soil exchange sites [42,43]. Experimental results have also shown that calcium and magnesium are retained in biochar-amended soils, whereas potassium and sodium are leached [44]. The above are also replicated by our modelling results, where calcium was retained by the solids in the column, whereas potassium, sodium and magnesium are rapidly eluted within the first 2 days (Figure S1). The elution rate follows the order K > Na > Mg > Ca. A steady increase in calcium concentration is attributed to calcite dissolution that lasted until the fifth day. When calcite was depleted in the soil, calcium concentrations in the outlet dropped, reaching the inlet concentrations of the irrigation water after 100 days (Figure S1). This trend is observed in all soil/biochar mixtures, regardless of the amount of biochar present.
A similar trend Is also observed in the case of K.E. models under saturated conditions (Figure S2). The main difference is the lesser amount of released cations and the longer times of elution. In this case, potassium and sodium are completely eluted after circa 100 and 40 days, respectively. Gwenzi et al. [9] reported that water-leached biochar-based fertilizers lost their available potassium content within 40 days. In our modelling results using the K.E. approach, ion-exchange reactions are compensated by the release rate of each cation by the solid surface. After 100 days, when the mobile fraction of potassium has left the soil column, the competition between magnesium and calcium for the exchange sites occurs, resulting in the retention of magnesium (Figure S2d) and the elution of calcium (Figure S2a). Moreover, the dissolution of calcite enriches the aqueous phase with calcium ions. Depletion of calcite occurs at day 160, followed by the elution of both calcium and magnesium from the soil columns.
The above reactions are considered to take place in a soil that is constantly saturated, and thus, steady-state flow conditions occur. In agricultural fields, however, this assumption is not valid, as the soil moisture is controlled by rainfall/irrigation events and unsaturated flow conditions exist. By comparing saturated with unsaturated conditions, either for the E.E. or K.E. approach, it is obvious that the movement and elution of ions from the soil columns is mainly regulated by the water flow. In the simplistic case of the E.E. approach, the elution times are longer, compared to the corresponding ones under saturated conditions, for potassium, sodium and magnesium, reaching 60, 40 and 90 days, respectively (Figure S3). The displacement of ions from the columns is compensated by the concomitant retention of calcium into the exchange sites. This retardation lasts 40 days, then a steady increase in calcium concentrations occurs due to calcite dissolution. In the case of the K.E. approach, the elution times are considerably longer under unsaturated conditions (Figure S4), even though the simulation period was extended to five years. Apart from potassium (Figure S4b), the elution curves of the other elements do not differ significantly for the various soil/biochar mixtures, and only periodical/seasonal variations are observed with time, following rainfall/irrigation events. This is mainly due to the different initial potassium concentrations, as well as the limited retardation of potassium ions.
Among the four modelling schemes examined in this work (saturated/unsaturated, E.E./K.E.) to describe the potassium release, it is clearly demonstrated that a slower release exists under unsaturated flow conditions using the K.E. approach, which is more likely valid than the E.E. approach (where potassium is depleted in a very short period, which is possible for in vitro experiments but unlikely for actual agronomic applications). As far as the simulations that represent saturated flow conditions are concerned, the release time of potassium is significantly underestimated and these simulations are only presented herein to highlight the importance of water flow to the estimation of nutrient availability in agricultural fields, as saturated conditions could be feasible during periods of flooding, in particular crops and limited areas. In all the above four schemes, the total mass of released potassium in the soil solution is circa 25% of the available potassium in the soil; what significantly differs among the four modelling schemes is the time for releasing the mass of potassium in the soil solution. In any case, additional, carefully designed, agronomic experiments will enlighten further the differences among the four modelling schemes, as well as assist to decrease the uncertainty related to the estimation of the rate constant (k).
Contrary to the fact that chemical fertilizer release potassium proportional to the applied dose [45], many researchers observed that this does not occur for organic fertilizers [46], biochar [38] and organominerals [47], probably due to the complexity of potassium interactions with their organic and inorganic compounds [48]. Our modelling results indicated that the percentage of released potassium remains relatively constant as the percentage of biochar increases and in relation to the available potassium. The effectiveness of nutrient-enriched biochars in agricultural soil (mainly P-, N- and K-enriched biochars) has been recently studied by many researchers [9,49,50,51], proving that the release of nutrients from enriched biochar fertilizers led to a rise in agronomic efficiency when compared to conventional mineral fertilizers, a conclusion which is confirmed in this work, as the total mass of the released potassium is significantly enhanced with biochar application.
Meanwhile, the economic feasibility of biochar production and utilization is still a significant challenge regarding its application in agricultural soils. Regularly, biochar feasibility is significantly modified by the financial cost of feedstock supply and transfer, as well as biochar characteristics and its technical specifications. Feedstock cost is the most critical component, as it can cost 45% to 75% of the total expenditure in biochar production. In general, studies have suggested that feedstock procurement for agricultural and forestry residues could cost EUR 61 to EUR 79 per ton [52]. Τhe raw materials, the quality as well as the texture of the biochar play an important role in its commercial value and selling price. The current average market price of biochar is about EUR 9 per cubic foot when negotiated for the bulk price but can cost up to EUR 40 per cubic foot in retail stores. Assuming a biochar price of EUR 10 per cubic foot, i.e., approximately EUR 350 per cubic meter, and considering that the biochar application is taking place on the upper soil layer (0–20 cm), the cost of the application for 1 stremma (1 stremma = 1000 m2 = 0.1 hectare) corresponds to EUR 350 for 0.5% biochar, EUR 700 for 1% biochar and EUR 1400 for 2% biochar, costs which might be considered quite high for extensive agriculture. Nevertheless, biochar application could be more feasible, either for intensive crop cultivation or for application in greenhouses.

5. Conclusions

Potassium release from the top 20 cm of the soil is significantly affected by the proportion of biochar in the soil by increasing the potassium availability to plants in the case of an increased biochar dose. Although the total mass of potassium released into the soil is similar between the two water flow conditions (saturated/unsaturated) and directly dependent on the total water volume applied in the soil, in the case of unsaturated flow, the release is gradual during the irrigation period, while the entire amount of potassium is released over a few days in the case of saturated flow conditions. Therefore, the simplification and adoption of saturated flow conditions in the study of nutrient release in agricultural soil may lead to unrealistic estimates of nutrient availability.
Regarding the two exchange approaches examined, the K.E. approach, that assumes a kinetically controlled release of potassium due to interactions occurring at the solid–solution interface, estimates a significantly higher time for the total release of potassium compared to the E.E. approach, even though the total mass of released potassium in the soil solution is the same in the two approaches. The presence of other major cations also plays a significant role in the release of potassium in all cases studied. The dissolution of calcite and the equilibrium with CO2, which is diffused within the pores of the soil, enriches the pore solution with calcium. In addition, the high selectivity of calcium for the exchange sites of the solids leads to the release of not only potassium, but also other cations, such as sodium and magnesium. Further experimental work in the field will enlighten the prevailing geochemical mechanisms related to potassium availability and will decrease the uncertainty of the parameter estimation of the K.E. approach.

Supplementary Materials

The following supporting information can be downloaded at: https://www.mdpi.com/article/10.3390/agronomy13030784/s1, Figure S1: Elution curves of ions/nutrients from soil columns containing 0, 0.5, 1 and 2% biochar under saturated conditions using the Equilibrium Exchange (E.E.) model; Figure S2: Elution curves of ions/nutrients from soil columns containing 0, 0.5, 1 and 2% biochar under saturated conditions using the Kinetic Exchange (K.E.) model; Figure S3: Elution curves of ions/nutrients from soil columns containing 0, 0.5, 1 and 2% biochar under unsaturated conditions using the Equilibrium Exchange (E.E.) model; Figure S4: Elution curves of ions/nutrients from soil columns containing 0, 0.5, 1 and 2% biochar under unsaturated conditions using the Kinetic Exchange (K.E.) model.

Author Contributions

Conceptualization: C.D.; Methodology: All; Formal analysis: Z.K. and V.K.; Investigation: Z.K. and V.K.; Funding acquisition: C.D. and E.H.; Data curation: Z.K.; Writing—original draft preparation: Z.K., V.K., C.D. and E.H.; Writing—review and editing: C.D. and E.H.; Visualization: C.D., E.H., Z.K. and V.K.; Supervision: C.D. and E.H.; Project administration: C.D. All authors have read and agreed to the published version of the manuscript.

Funding

This research received no external funding.

Institutional Review Board Statement

Not applicable.

Informed Consent Statement

Not applicable.

Data Availability Statement

Data of this research is provided upon request to corresponding author.

Acknowledgments

This work was initiated during FERTICHAR project, which was supported by the ARIMNet2 Program.

Conflicts of Interest

On behalf of all authors, the corresponding author states that there is no conflict of interest.

References

  1. Stewart, W.M.; Dibb, D.W.; Johnston, A.E.; Smyth, T.J. The contribution of commercial fertilizer nutrients to food production. Agron. J. 2005, 97, 1–6. [Google Scholar] [CrossRef] [Green Version]
  2. Ayoub, A.T. Fertilizers and the environment. Nutr. Cycl. Agroecosystems 1999, 5, 221–226. [Google Scholar] [CrossRef]
  3. Dybowski, D.; Dzierzbicka-Glowacka, L.A.; Pietrzak, S.; Juszkowska, D.; Puszkarczuk, T. Estimation of nitrogen leaching load from agricultural fields in the Puck Commune with an interactive calculator. PeerJ 2020, 8, e8899. [Google Scholar] [CrossRef] [Green Version]
  4. Craswell, E. Fertilizers and nitrate pollution of surface and ground water: An increasingly pervasive global problem. SN Appl. Sci. 2021, 3, 518. [Google Scholar] [CrossRef]
  5. Bennet, E.M.; Carpenter, S.R.; Caraco, N.F. Human Impact on Erodable Phosphorus and Eutrophication: A Global Perspective: Increasing accumulation of phosphorus in soil threatens rivers, lakes, and coastal oceans with eutrophication. Bioscience 2001, 51, 227–234. [Google Scholar] [CrossRef]
  6. Goulding, K.W.T.; Murrell, T.S.; Mikkelsen, R.; Rosolem, C.A.; Johnston, J.; Wang, H.Y.; Alfaro, M.A. Outputs: Potassium Losses from Agricultural Systems. Improving Potassium Recommendations for Agricultural Crops. In Improving Potassium Recommendations for Agricultural Crops; Murrell, T.S., Mikkelsen, R.L., Sulewski, G., Norton, R., Thompson, M.L., Eds.; Springer Nature Switzerland AG: Norcross, GA, USA, 2021; pp. 75–97. ISBN 978-3-030-59196-0. [Google Scholar]
  7. Rashid, M.; Hussain, Q.; Khan, K.S.; Alwabel, M.I.; Hayat, R.; Akmal, M.; Ijaz, S.S.; Alvi, S. Obaid-ur-Rehman Carbon-Based Slow-Release Fertilizers for Efficient Nutrient Management: Synthesis, Applications, and Future Research Needs. J. Soil Sci. Plant Nutr. 2021, 21, 1144–1169. [Google Scholar] [CrossRef]
  8. Torabian, S.; Qin, R.; Noulas, C.; Lu, Y.; Wang, G. Biochar: An organic amendment to crops and an environmental solution. AIMS Agric. Food 2021, 6, 401–415. [Google Scholar] [CrossRef]
  9. Gwenzi, W.; Nyambishi, T.J.; Chaukura, N.; Mapope, N. Synthesis and nutrient release patterns of a biochar-based N–P–K slow-release fertilizer. Int. J. Environ. Sci. Technol. 2018, 15, 405–414. [Google Scholar] [CrossRef]
  10. Allohverdi, T.; Kumar Mohanty, A.; Roy, P.; Misra, M.; Ibáñez, E.; Antoniotti, S. Molecules A Review on Current Status of Biochar Uses in Agriculture A Review on Current Status of Biochar Uses in Agriculture. Molecules 2021, 26, 5584. [Google Scholar] [CrossRef]
  11. Oni, B.A.; Oziegbe, O.; Olawole, O.O. Significance of biochar application to the environment and economy. Ann. Agric. Sci. 2019, 64, 222–236. [Google Scholar] [CrossRef]
  12. Lehmann, J. Biological carbon sequestration must and can be a win-win approach an editorial comment. Clim. Chang. 2009, 97, 459–463. [Google Scholar] [CrossRef]
  13. Bilias, F.; Kalderis, D.; Richardson, C.; Barbayiannis, N.; Gasparatos, D. Biochar application as a soil potassium management strategy: A review. Sci. Total Environ. 2023, 858, 159782. [Google Scholar] [CrossRef]
  14. Yeh, G.T.; Cheng, H.P. A 3-Dimensional Model of Density-Dependent Subsurface Flow and Thermal Multispecies-Multicomponent HYDROGEOCHEMical Transport Project Summary (EPA/600/SR-98/159); U.S. Environmental Protection Agency: Washington, DC, USA, 1999. [Google Scholar]
  15. Jacques, D.; Šimůnek, J.; Mallants, D.; van Genuchten, M.T. Modelling coupled water flow, solute transport and geochemical reactions affecting heavy metal migration in a podzol soil. Geoderma 2008, 145, 449–461. [Google Scholar] [CrossRef]
  16. Jacques, D.; Simunek, J. User Manual of the Multicomponent Variably-Saturated Flow and Transport Model HP1; Belgian Nuclear Research Centre: Mol, Belgium, 2005. [Google Scholar]
  17. Wissmeier, L.; Barry, D.A. Implementation of variably saturated flow into PHREEQC for the simulation of biogeochemical reactions in the vadose zone. Environ. Model. Softw. 2010, 25, 526–538. [Google Scholar] [CrossRef]
  18. Xu, T.; Sonnenthal, E.; Spycher, N.; Zhang, G.; Zheng, L.; Pruess, K. Toughreact: A simulation program for subsurface reactive chemical transport under non-isothermal multiphase flow conditions. In Groundwater Reactive Transport Models; Zhang, F., Yeh, G.T., Parker, J.C., Eds.; Bentham eBooks: Soest, The Netherlands, 2012; pp. 74–95. ISBN 978-160805525-8. [Google Scholar]
  19. Jacques, D.; Simunek, J.; Mallants, D.; Van Genuchten, M.T. The HPx software for multicomponent reactive transport during variably-saturated flow: Recent developments and applications. J. Hydrol. Hydromech. 2018, 66, 211–226. [Google Scholar] [CrossRef] [Green Version]
  20. Jacques, D.; Simunek, J.; Mallants, D.; Genuchten, M.T. Modeling Coupled Hydrologic and Chemical Processes: Long-Term Uranium Transport following Phosphorus Fertilization. Vadose Zo. J. 2008, 7, 698–711. [Google Scholar] [CrossRef] [Green Version]
  21. Leterme, B.; Blanc, P.; Jacques, D. A reactive transport model for mercury fate in soil—Application to different anthropogenic pollution sources. Environ. Sci. Pollut. Res. Int. 2014, 21, 12279–12293. [Google Scholar] [CrossRef]
  22. Gai, K.; Hoelen, T.P.; Hsu-Kim, H.; Lowry, G.V. Mobility of Four Common Mercury Species in Model and Natural Unsaturated Soils. Environ. Sci. Technol. 2016, 50, 3342–3351. [Google Scholar] [CrossRef]
  23. Angst, T.E.; Sohi, S.P. Establishing release dynamics for plant nutrients from biochar. GCB Bioenergy 2013, 5, 221–226. [Google Scholar] [CrossRef]
  24. Gaskin, J.W.; Speir, R.A.; Harris, K.; Das, K.C.; Lee, R.D.; Morris, L.A.; Fisher, D.S. Effect of Peanut Hull and Pine Chip Biochar on Soil Nutrients, Corn Nutrient Status, and Yield. Soil Qual. Fertil. 2010, 102, 623–633. [Google Scholar] [CrossRef] [Green Version]
  25. Van Poucke, R.; Meers, E.; Tack, F.M.G. Leaching behavior of Cd, Zn and nutrients (K, P, S) from a contaminated soil as affected by amendment with biochar. Chemosphere 2020, 245, 125561. [Google Scholar] [CrossRef] [PubMed]
  26. Kypritidou, Z.; Doulgeris, C.; Tziritis, E.; Kinigopoulou, V.; Jellali, S.; Jeguirim, M. Geochemical Modelling of Inorganic Nutrients Leaching from an Agricultural Soil Amended with Olive-Mill Waste Biochar. Agronomy 2022, 12, 480. [Google Scholar] [CrossRef]
  27. Genuchten, M.T. van A Closed-form Equation for Predicting the Hydraulic Conductivity of Unsaturated Soils. Soil Sci. Soc. Am. J. 1980, 44, 892–898. [Google Scholar] [CrossRef] [Green Version]
  28. Mualem, Y. A new model for predicting the hydraulic conductivity of unsaturated porous media. Water Resour. Res. 1976, 12, 513–522. [Google Scholar] [CrossRef] [Green Version]
  29. Parkhurst, B.D.L.; Appelo, C.A.J. User’s Guide To PHREEQC (version 2)—A Computer Program for Speciation, and Inverse Geochemical Calculations. Exch. Organ. Behav. Teach. J. 1999, 312, 4259. [Google Scholar]
  30. Gaines, G.L.; Thomas, H.C. Adsorption studies on clay minerals. II. A formulation of the thermodynamics of exchange adsorption. J. Chem. Phys. 1953, 21, 714–718. [Google Scholar] [CrossRef]
  31. Appelo, C.A.J.; Postma, D. Geochemistry, Groundwater and Pollution (Fifth); CRC Press: Boca Raton, FL, USA, 2005. [Google Scholar]
  32. Tiruta-Barna, L. Using PHREEQC for modelling and simulation of dynamic leaching tests and scenarios. J. Hazard. Mater. 2008, 157, 525–533. [Google Scholar] [CrossRef]
  33. Ghorbani, M.; Amirahmadi, E.; Neugschwandtner, R.W.; Konvalina, P.; Kopecký, M.; Moudrý, J.; Perná, K.; Murindangabo, Y.T. The impact of pyrolysis temperature on biochar properties and its effects on soil hydrological properties. Sustainability 2022, 14, 14722. [Google Scholar] [CrossRef]
  34. Tamoši, A.; Chouchène, A.; Valatkevičius, P.; Aikas, M.; Uscila, R.; Ghorbel, M.; Jeguirim, M. The Potential of Thermal Plasma Gasification of Olive Pomace Charcoal. Energies 2017, 10, 710. [Google Scholar] [CrossRef] [Green Version]
  35. Schaap, M.G.; Leij, F.J.; Van Genuchten, M.T. rosetta: A computer program for estimating soil hydraulic parameters with hierarchical pedotransfer functions. J. Hydrol. 2001, 251, 163–176. [Google Scholar] [CrossRef]
  36. Wang, M.; Xu, D.; Bai, Y.; Yu, G.; Zhang, J.; Zhang, S.; Xu, J.; Zhang, H.; Zhang, S.; Wei, J. Dynamic Investigation on Potassium Migration and Transformation during Biochar Combustion and Its Correlation with Combustion Reactivity. Fuel 2023, 340, 127540. [Google Scholar] [CrossRef]
  37. Nguyen, A.T.Q.; Bui, T.A.; Mai, N.T.; Tran, H.T.; Tran, S.V.; Nguyen, N.H.; Tsubota, T.; Shinogi, Y.; Dultz, S.; Nguyen, M.N. Release Kinetics of Potassium from Silica-Rich Fern-Derived Biochars. Agron. J. 2020, 112, 1713–1725. [Google Scholar] [CrossRef]
  38. Wang, L.; Xue, C.; Nie, X.; Liu, Y.; Chen, F. Effects of biochar application on soil potassium dynamics and crop uptake. J. Plant Nutr. Soil Sci. 2018, 181, 635–643. [Google Scholar] [CrossRef]
  39. Wang, J.; Xiong, Z.; Kuzyakov, Y. Biochar Stability in Soil: Meta-Analysis of Decomposition and Priming Effects. GCB Bioenergy 2016, 8, 512–523. [Google Scholar] [CrossRef] [Green Version]
  40. Limwikran, T.; Kheoruenromne, I.; Suddhiprakarn, A.; Prakongkep, N.; Gilkes, R.J. Dissolution of K, Ca, and P from biochar grains in tropical soils. Geoderma 2018, 312, 139–150. [Google Scholar] [CrossRef]
  41. Major, J.; Rondon, M.; Molina, D.; Riha, S.J.; Lehmann, J. Nutrient Leaching in a Colombian Savanna Oxisol Amended with Biochar. J. Environ. Qual. 2012, 41, 1076–1086. [Google Scholar] [CrossRef]
  42. Kolahchi, Z.; Jalali, M. Simulating leaching of potassium in a sandy soil using simple and complex models. Agric. Water Manag. 2006, 85, 85–94. [Google Scholar] [CrossRef]
  43. Kolahchi, Z.; Jalali, M. Effect of water quality on the leaching of potassium from sandy soil. J. Arid Environ. 2007, 68, 624–639. [Google Scholar] [CrossRef]
  44. Bakshi, S.; He, Z.L.; Harris, W.G. Biochar Amendment Affects Leaching Potential of Copper and Nutrient Release Behavior in Contaminated Sandy Soils. J. Environ. Qual. 2014, 43, 1894–1902. [Google Scholar] [CrossRef]
  45. Adebayo, A.G.; Akintoye, H.A.; Shokalu, A.O.; Olatunji, M.T. Soil chemical properties and growth response of Moringa oleifera to different sources and rates of organic and NPK fertilizers. Int. J. Recycl. Org. Waste Agric. 2017, 6, 281–287. [Google Scholar] [CrossRef] [Green Version]
  46. Soremi, A.O.; Adetunji, M.T.; Azeez, J.O.; Adejuyigbe, C.O.; Bodunde, J.G. Effects of soil amendment on potassium fractions of Southwestern Nigerian soil. Commun. Soil Sci. Plant Anal. 2018, 10, 1186–1198. [Google Scholar] [CrossRef]
  47. Abd El-Mageed, T.A.; Semida, W.M. Organo mineral fertilizer can mitigate water stress for cucumber production (Cucumis sativus L.). Agric. Water Manag. 2015, 159, 1–10. [Google Scholar] [CrossRef]
  48. Fachini, J.; Figueiredo, C.C.; de Vale, A.T. do Assessing potassium release in natural silica sand from novel K-enriched sewage sludge biochar fertilizers. J. Environ. Manag. 2022, 314, 115080. [Google Scholar] [CrossRef] [PubMed]
  49. Shin, J.D.; Park, S.W.; Lee, S. Optimum Method Uploaded Nutrient Solution for Blended Biochar Pellet with Application of Nutrient Releasing Model as Slow Release Fertilizer. Appl. Sci. 2019, 9, 1899. [Google Scholar] [CrossRef] [Green Version]
  50. Pogorzelski, D.; Filho, J.F.L.; Matias, P.C.; Santos, W.O.; Vergütz, L.; Melo, L.C.A. Biochar as composite of phosphate fertilizer: Characterization and agronomic effectiveness. Sci. Total Environ. 2020, 743, 140604. [Google Scholar] [CrossRef]
  51. Luo, W.; Qian, L.; Liu, W.; Zhang, X.; Wang, Q.; Jiang, H.; Cheng, B.; Ma, H.; Wu, Z. A potential Mg-enriched biochar fertilizer: Excellent slow-release performance and release mechanism of nutrients. Sci. Total Environ. 2021, 768, 144454. [Google Scholar] [CrossRef]
  52. Pokharel, R.; Comer, B. Economics of Biochar. Available online: https://www.canr.msu.edu/news/economics-of-biochar (accessed on 7 March 2023).
Figure 1. Ions/nutrients release from the soil/biochar mixture.
Agronomy 13 00784 g001
Figure 2. Irrigation dose applied as boundary condition at the top of soil column.
Agronomy 13 00784 g002
Figure 3. Soil moisture variation, theta, for (a) different time steps (using 21 nodes), and (b) different finite element nodes (using dtmax = 1 day).
Agronomy 13 00784 g003
Figure 4. Potassium release under (a) saturated flow conditions and (b) unsaturated flow conditions, for the E.E. approach and different soil/biochar mixtures.
Agronomy 13 00784 g004
Figure 5. Comparative evaluation for saturated and unsaturated flow conditions using the E.E. approach: (a) potassium concentration versus cumulative water volume, (b) accumulated potassium mass and (c) potassium release rate.
Agronomy 13 00784 g005
Figure 6. Potassium release under (a) saturated flow conditions and (b) unsaturated flow conditions, for the K.E. approach and different soil/biochar mixtures.
Agronomy 13 00784 g006
Figure 7. Effect of different values of the rate constant (k) in potassium release under (a) saturated and (b) unsaturated conditions.
Agronomy 13 00784 g007
Table 1. Main physicochemical characteristics of the agricultural soil.
ParameterValue *
Sand (%)44.8
Silt (%)29.6
Clay (%)25.6
Soil TextureLoam
pH of soil/biochar7.07/10.3
Electrical conductivity (mS cm−1) of soil/biochar0.38/7.56
ESP (%) of soil/biochar1.13/28.0
Organic matter (humified) (%)2.12
Organic carbon (%)1.06
CaCO3 equivalent (%)0.48
Cation exchange capacity (cmol kg−1)18.5
Wilting point at 15 atm (% w/w)24.8
Field capacity at 0.3 atm (% w/w)33.8
Bulk density (g cm−3)1.63
* Values except soil texture are the mean of three replicates, with measurements deviations < 5%.
Table 2. Concentration of the exchangeable cations (in mg kg−1) of the biochar/soil mixtures.
Biochar Fraction in SoilsKNaCaMg
0%15948470224
0.5%19652472223
1%23257473222
2%30666477221
Biochar750093081867
Table 3. Main physicochemical characteristics of the irrigation water.
ParameterValueParameterValue
pH7.49Na (mg L−1)83.6
Temperature (°C)22.2K (mg L−1)1.2
Electrical Conductivity (mS cm−1)1.229Ca (mg L−1)139.2
Cl (mg L−1)192.9Mg (mg L−1)27.2
HCO3 (mg L−1)279.7NO3 (mg L−1)122.7
SO4 (mg L−1)46.7NH4 (mg L−1)0.2
Table 4. Soil hydraulic parameters (van Genuchten parameters and saturated hydraulic conductivity).
ParameterValue
Residual soil water content, θr0.0616
Saturated soil water content, θs 0.3668
Parameter a in the soil water retention function [cm−1]0.0174
Parameter n in the soil water retention function1.3268
Saturated hydraulic conductivity, Ks [cm d−1]10
Pore-connectivity parameter, λ0.5
Disclaimer/Publisher’s Note: The statements, opinions and data contained in all publications are solely those of the individual author(s) and contributor(s) and not of MDPI and/or the editor(s). MDPI and/or the editor(s) disclaim responsibility for any injury to people or property resulting from any ideas, methods, instructions or products referred to in the content.

