Abstract
The dynamics of nitrogen availability in soil result from the net amount of organic and inorganic inputs undergoing decomposition, mineralization, and immobilization. This varies with soil type, climate, and cropping system management practices. Hence, the interaction of these factors in a specific environment is important for nitrogen management and availability in any cropping system. This study evaluated the concentration of nitrate (NO3−) and ammonium (NH4+) in a maize monocropping system in a long-term trial under different tillage practices, i.e., no-till (NT), conventional tillage (CT), and rotational tillage (RT), and with different nitrogen (Urea) fertiliser application rates (0, 100, and 200 kg/ha N). The experimental area was a split plot with randomized tillage strips as the main plots, with the nitrogen fertiliser application rates forming the subplots. The results found the highest concentration of NO3− (7.728 mg/kg) and NH4+ (0.762 mg/kg) under the NT (p < 0.05) compared to the other treatments. CT recorded the lowest amount of NH4+ (0.648 mg/kg) (p < 0.05) compared to RT (0.758 mg/kg), while the concentration of NO3− (6.755 mg/kg) under the CT was relatively higher than under the RT (4.720 mg/kg). The results also showed that the 0–10 cm depth had a significantly (p < 0.05) higher concentration of NO3− (6.787 mg/kg) and NH4+ (0.851 mg/kg), followed at the 20–30 cm depth with 6.229 mg/kg NO3− and 0.832 mg/kg NH4+. Soil samples taken at 10–20 cm depth recorded the lowest NO3− (6.188 mg/kg) and NH4+ (0.485 mg/kg). The study also found the highest NO3− concentration (0.452 mg/kg) with 200 kg/ha N (p < 0.05), while the highest concentration of NH4+ (0.954 mg/kg) was found with 0 kg/ha N. The lowest concentrations of both NO3− (6.333 mg/kg) and NH4+ (0.561 mg/kg) were found with 100 kg/ha N. the no-till also had a significantly (p < 0.05) higher NO3− (8.518 mg/kg) concentration with 200 kg/ha N compared to the CT (6.005 mg/kg) and RT (4.833 mg/kg). On the other hand, more NH4+ (1.478 mg/kg) was found with 0 kg/ha N under the NT compared to the CT (0.717 mg/kg) and the RT (0.669 mg/kg). The concentration of NH4+ was relatively low with 200 kg/ha N in the NT (0.545 mg/kg) and CT (0.598 mg/kg) but higher in the RT (0.813 mg/kg). In conclusion, the NT favoured the availability of NO3− and NH4+ in the studied cropping system; however, the concentration of these was affected by fertiliser application rate and depth. This suggested that each tillage system should be compatible with the type and the rate of inorganic nitrogen fertiliser for better crop production.
1. Introduction
Nitrogen is the fourth limiting factor for proper crop plant growth after carbon, hydrogen, and oxygen [1]. Nitrogen (N) is regarded as the most valuable component of all amino acids and nucleic acids; it plays a huge role in biochemical and physiological functions of crop plants [2,3], which significantly affect the yields and quality of agricultural products. Deficiencies in reactive nitrogen diminish the crop output and food supply, subsequently leading to hunger in the developing world [4]. Nitrogen is available in limited quantities in many soils, even though there is a huge reservoir of nitrogen in the atmosphere [2]. The availability of nitrogen in the soil for plant uptake depends on the rate at which carbon is converted to plant-available carbon (inorganic carbon), as well as the tillage practice [5]. Ref. [6] reported that soil nitrogen is conserved in soil organic matter (SOM); thus, a decrease or an increase in the SOM has a great effect on nitrogen cycling. Trends in the changes in the total nitrogen and those observed in the soil organic carbon content tend to be the same; this is because the nitrogen and the carbon cycles are totally inseparable [5].
The decrease in the soil organic content and total nitrogen is generally caused by intensive tillage practices [7]. Intensive tillage, which is commonly referred to as conventional tillage, accelerates the decomposition of soil organic carbon [8], which, in turn, favours the conversion of the organic form of nitrogen into inorganic forms, such as nitrate (NO3−), ammonium (NH4+), nitrous oxide (N2O), nitric oxide (NO), etc., through the process called mineralization [9,10,11]. With conventional tillage, nitrogen is mostly lost by nitrate (NO3−) leaching [9,10]. However, these findings were different from those of [11,12,13]. They found that the leaching of nitrate was greater under no-till than in conventional tillage practices. The conclusion was that there is little or no disturbance in soil structure under no-till, and, since nitrate (NO3−) is soluble and mobile, it moves together with water through the path provided by macro pores down the soil profile. Conservation agricultural (CA) practices, such as no-till with residue retention and minimum tillage, have been reported to reduce the loss of nitrogen from the soil to the atmosphere and leaching. The decomposition of residues and soil organic matter is slow under CA because aggregates are more stable, thus, less SOM is exposed to microbial attack. This, in turn, slows the decomposition of soil organic carbon, hence, soil inorganic nitrogen immobilization takes place [5,14]. During immobilization, inorganic forms of nitrogen are converted into organic nitrogen, resulting in lower amounts of nitrogen available for plant uptake. Conservation agricultural practices help to reduce leaching and denitrification [6,9], which indirectly reduce yields, nutrient balance, and dry mass production [1].
Research has shown that supplementing reactive nitrogen using mineral fertilisers has helped in increasing agricultural products to feed the increasing global population [4,15]. However, N fertiliser increases crop production costs and causes climate change, biodiversity losses, eutrophication, atmospheric pollution, etc. [1,4,16]. N fertiliser application rates also play a huge role in the aforementioned problems and in the rate at which N is mineralized or immobilized [9,11]. Ref. [9] reported that, at lower N fertilization rates, more soil nitrogen was mineralized under no-till in comparison to the minimum and conventional tillage. In addition, at high N application rates, more nitrogen was mineralized at the minimum and no-till than under conventional tillage. According to [9,17], applying N fertilisers tends to increase nitrous oxide (N2O) and nitric oxide (NO) emissions, especially under monoculture. Applying nitrogen fertilisers under conservation agricultural practices, such as no-till, increases the N mineralization rate when compared to conventional tillage, but this depends mainly on the rate at which the fertiliser is applied [9]. This, therefore, shows that tillage practices, as well as the amount of nitrogen fertiliser added to the soil, could have an effect on the availability and the concentrations of soil-available nitrate and ammonium.
Therefore, the agricultural sector is faced with the challenge of improving soil fertility and N management strategies with organic and inorganic fertilisers to reduce losses to the environment, while achieving optimum yields for present and future food security. The objective of the study was to investigate the effect of different tillage practices and fertiliser application rates on soil nitrate (NO3−) and ammonium (NH4+).
2. Materials and Methods
2.1. Study Area
The study was conducted in a trial that was established in the 2002–2003 summer growing season by the KwaZulu-Natal Department of Agriculture and Environmental Affairs at Grouton farm (28°55′26.83″ S, 29°33′38.64″ E) (Figure 1), situated in Winterton, Bergville, KwaZulu-Natal province of South Africa. The initial purpose for the establishment of the trial by the Department was to assess the combined effects of tillage practice and fertiliser application rates on soil fertility, diseases, and maize yield. From 1990 to the 2002–2003 growing season, the trial was under maize commercial production in rotation with soybean and managed under no-till. Before that, the field was planted to maize under conventional tillage. The largest percentage of dryland maize in KwaZulu-Natal is produced commercially in this area. Annually, the area experiences an average rainfall of 634 mm in summer and an average air temperature of 19.3 °C and 27.9 °C in June and January. The trial site is characterised by clay loamy-textured (Hutton non-swelling) soil, and it is left fallow in winter and planted with dryland maize in summer. The amount of rainfall received and temperatures during the experiment are presented in detail by [18].
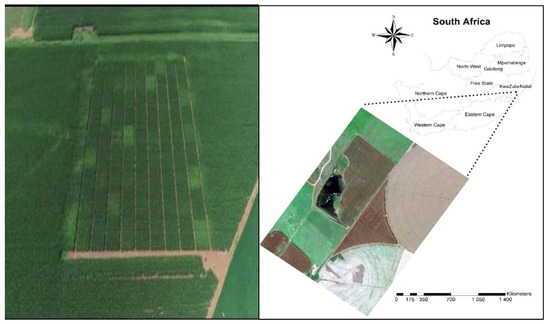
Figure 1.
The location of the study area (28°55′26.83″ S, 29°33′38.64″ E, 1038 m above sea level).
2.2. Experimental Design
The experiment site was a split plot with three tillage treatments: [no-till (NT), rotational tillage (RT), and conventional tillage (CT)], randomized three times, forming the whole plot (see [18] for the trial layout). Each subplot comprised 12 m × 9.5 m rows of maize at a density of 70,000 plants/ha, and the total area of the whole plot was 0.86 ha. The nitrogen (N) source (Urea or LAN) and the rate of application (0, 50, 100, 150, or 200 kg/ha) formed the subplots, which were randomized within the whole plot. However, in this study, samples were only taken on Urea at 0, 100, and 200 kg/ha. Under the NT, there were no disturbances in the soil. No-till involved direct seeding using the planter and, every time after harvesting, the maize residue was left on the surface as permanent soil cover, while under the CT, the field was ploughed using the mouldboard and disc-ploughed to a depth of 30 cm before planting. Under the RT, the soil was managed under no-till for four years and then conventionally tilled on the fifth year. Under NT and RT, about 10–12 t/ha/yr of maize residues was left on the soil surface, forming the permanent soil cover. The nitrogen source was urea and was top-dressed at three rates (0, 100, or 200 kg/ha) at four weeks after planting. Phosphorus (P) and potassium (K) were applied in a band method at a rate of 50 and 20 kg/ha, respectively. Lime was applied at a rate of 2 t/ha at planting in the conventionally tilled treatments and incorporated on the surface in the no-till and rotational tillage treatments during the second season. Chemicals were used to control weeds using the combination of S-metolachlor and 2,4-D, mesotrione, and atrazine. Pyrethroid (Decis Forte) was the only chemical that was applied at planting to control cutworms. Carbendazim plus azoxystrobin and flusilazole were used to control fungal diseases such as rust, grey leaf spot, and northern corn leaf blight. The chemicals were applied using a tractor-drawn ring equipped with an 18 m wide boom sprayer.
2.3. Soil Sampling
Soil samples were collected in April 2019, August 2019, and March 2020 using an auger at 0–10 cm, 10–20 cm, and 20–30 cm depth; each depth was replicated three times randomly within each subplot. The soil samples were taken in all the subplots where nitrogen was applied as urea at (0, 100, and 200 kg/ha). The samples of the same depth from the same tillage strip (whole plot) were mixed to get a representative soil sample. The samples were then put in plastic bags for available soil nitrate and ammonium analysis.
2.4. Soil Nitrate and Ammonium Analysis
Nitrate and ammonium were analysed according to the method that was previously described by [19]. Briefly, the method involves weighing 10.0 g of freshly sampled soil into a plastic shaking bottle and adding 100 mL of 2 M KCL extracting solution. The solution is shaken for 1 h, then filtered through No. 42 Whatman filter paper. The method involves stem distillation and, finally, measurement of the nitrate and ammonium.
2.5. Soil Organic Carbon and pH
The soil total, C, was analysed by an automated Dumas dry combustion method using a LECO CNS-2000 [20]. The air-dried soil samples were passed through a 0.5 mm sieve size; then, a 0.5 g sample was measured and placed in the LECO for analysis of the C. The procedure was based on the dry combustion of air-dried samples in crucibles, subjected to a 1350-degree Celsius furnace temperature for about 7 min.
The soil pH was measured in a 1:2.5 soil:water mixture [21]. The pH of each soil sample was measured in distilled water and 1 mol/L of KCl solution at a ratio of 1:2.5 (volume:volume). Next, 10 g portions of soil, previously dried, ground, sieved on a 2 mm sieve, and thoroughly mixed, were placed using the plastic calibrated spoon in 50–100 mL beakers. Thereafter, 25 mL of distilled water or 1 mol/L of KCl were added, respectively. The solutions/mixtures were replicated three times. After hand mixing, the suspensions were left overnight. The next day, the suspensions were mixed twice before a pH measurement. The pH readings were taken using a pH meter calibrated based on standard buffer solutions in a pH range of 4.01, 7.01, and 10.01 [20].
2.6. Statistical Analysis
The soil nitrate and ammonium were analysed using GenStat16 software (VSN International, 2009). The data were subjected to an ANOVA, and the means were separated by Tukey’s least significant difference (LSD) at a 5% level of significance.
3. Results
Highly significant differences (p < 0.001) were observed in tillage treatments and their interaction in the concentrations of NO3− and NH4+ (Table 1).

Table 1.
ANOVA results of the effect of tillage treatments (NT, RT, and CT), depths (0–10, 10–20, and 20–30 cm), N-levels (0, 100, and 200 kg/ha), sampling times (April 2019, August 2019, and March 2020), and their interaction on soil-available nitrate (NO3−) and ammonium (NH4+).
Highly significant differences (p < 0.001) were found in the concentration of NO3− and NH4+ under different tillage treatments (Table 1). NT had the highest NO3− (7.728 mg/kg), followed by CT at 6.755 mg/kg, and, lastly, RT with the lowest concentration of 4.720 mg/kg NO3− (Figure 2). The NT (0.762 mg/kg) and RT (0.758 mg/kg) had significantly higher (p < 0.05) concentrations of NH4+ compared to the CT treatment (0.648 mg/kg) (Figure 2).
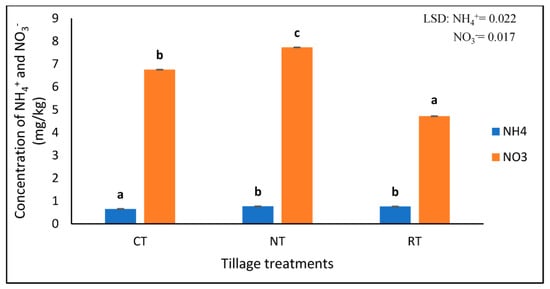
Figure 2.
The concentrations of extractable NO3− and NH4+ at three different tillage treatments of no-till (NT), rotational tillage (RT), and conventional tillage (CT) after 17 years of trial establishment. The bars not sharing the same letter differ significantly at LSD (p = 0.05).
The results showed a highly significant interaction (p < 0.001) between the tillage treatments and the depths for available NO3− and NH4+ (Table 1 and Figure 3). The 0–10 cm depth of the NT (8.046 mg/kg) had the significantly (p < 0.05) highest concentration of NO3−, compared to the CT (7.472) and RT (4.844 mg/kg) treatments (Figure 3a). The concentration of NO3− decreased at the 10–20 cm depth and increased at the 20–30 cm depth, while that of the RT and CT decreased with depth (Figure 3a).
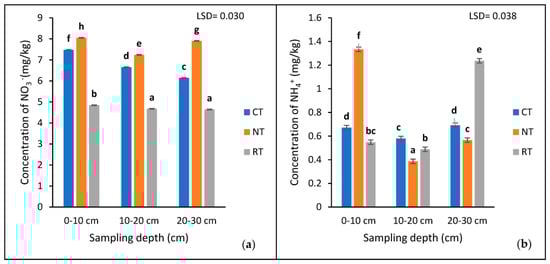
Figure 3.
The concentration of extractable NO3− (a) and NH4+ (b) at three sampling depths (0−10, 10−20, and 20−30 cm) of the three tillage treatments (CT, NT, and RT) recorded after 17 years of trial establishment. cm = centimetre. The bars not sharing the same letter differ significantly at LSD (p = 0.05).
The 0–10 cm depth of the NT had a significantly higher (p < 0.005) concentration of NH4+ compared to the 20–30 and 10–20 cm depths, respectively (Figure 3b). Contrarily, in the RT treatment, the highest concentration was found at the 20–30 cm depth, followed by the 0–10 and 10–20 cm depths, respectively. On the other hand, the CT treatment had similar (p > 0.05) concentrations of NH4+ at the 0–10 and 20–30 cm depths, with the lowest at the 10–20 cm depth (Figure 3b).
The interaction of tillage treatment and N fertiliser application rate was significantly different (p < 0.05) for soil-available NO3− (Table 1 and Figure 4a). The no-till recorded the highest concentration of NO3− (8.518 mg/kg) with 200 kg/ha N, followed by 100 (7.34 mg/kg) and 0 (7.33 mg/kg) kg/ha N, respectively (Figure 4a). The results showed that the no-till recorded the highest concentration of NO3− under all three nitrogen fertiliser application rates (0 N, 100 N, and 200 N) compared to the rotational and conventional tillage systems (Figure 4a). The rotational tillage system recorded the lowest nitrate concentration of them all. Most notable was that the rate at which N was applied had an impact on the concentration of nitrate; the concentration of nitrate decreased with an increase in N fertilization. (Figure 4a). Under CT, the concentration of NO3− decreased with an increase in N fertiliser levels, while, under NT and RT, NO3− increased with an increase in N fertiliser levels.
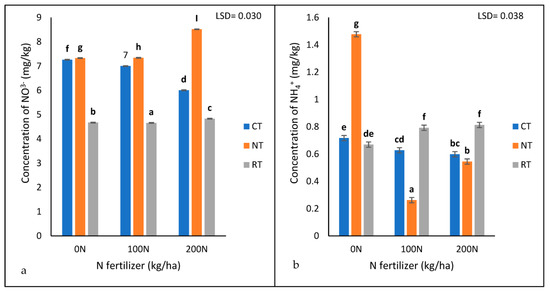
Figure 4.
The concentrations of extractable NO3− (a) and NH4+ (b) under three tillage treatments (NT, RT, and CT) and three nitrogen (Urea) treatments (0, 100, and 200 kg/ha) recorded after 17 years of trial establishment. N = nitrogen fertiliser. The bars not sharing the same letter differ significantly at LSD (p = 0.05).
The results showed a significant interaction (p < 0.05) between tillage treatments and N fertiliser application rates for soil-available NH4+ (Table 1 and Figure 4b). The highest concentration of NH4+ was found under NT at 0 kg/ha N (1.478 mg/kg) (Figure 4b). The concentration of NH4+ was relatively lower with 200 kg/ha N in the NT (0.545 mg/kg) and CT (0.598 mg/kg) but higher in the RT (0.813 mg/kg) (Figure 4b). The ammonium found under the RT (0.669 mg/kg) and CT (0.717 mg/kg) with 0 kg/ha N was more than that with the 200 kg/ha N in the NT(Figure 4b).
The results showed that the concentration of NO3− was significantly different (p < 0.05) at different sampling periods (Table 1 and Figure 5). More NO3− was found in August 2019 (6.534 mg/kg), followed by 6.436 mg/kg in March 2020. April 2019 recorded the lowest concentration of NO3− (6.233 mg/kg) (Figure 5). The study found that the concentration of NH4+ was slightly significantly different (p < 0.05) at different sampling periods (Figure 5). The concentration of NH4+ found in April 2019 was significantly different to that in August 2019 and March 2020, but between August 2019 and March 2020, there was no significant difference. More NH4+ was recorded in March 2020 (0.823 mg/kg); the least was recorded in April 2019 (0.546 mg/kg) (Figure 5).
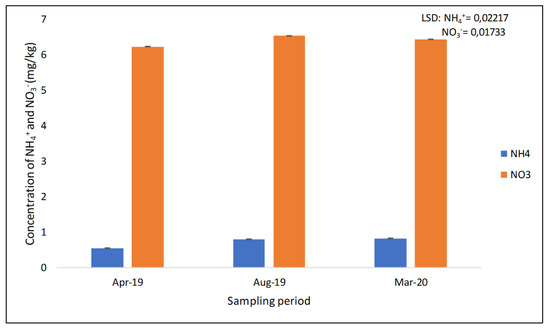
Figure 5.
The concentration of extractable NO3− and NH4+ across the three sampling periods recorded after 17 years of trial establishment.
The results showed no significant difference (p < 0.05) in the concentration of SOC under different tillage treatments (Table 2). However, NT had more SOC (1.78%) compared to CT (1.75%) and RT (1.72%), respectively. The results found a significantly (p < 0.05) higher concentration of SOC at the 0–10 cm soil surface depth (2.03%), followed by that of the 10–20 cm depth (1.65%), and the lowest concentration of SOC was found at the 20–30 cm soil depth. The interaction between tillage treatments and sampling depths was slightly significant (p < 0.05) for total soil organic carbon. Most notably, the 0–10 cm depth had the highest concentration of SOC in all the tillage treatments. The NT (2.21%) had the highest concentration of SOC at the 0–10 cm soil depth, followed by the RT (2.04%); the CT had the lowest SOC concentration (1.83%) (Table 2). Soil organic carbon was relatively lower at the 20–30 cm soil depth under all the tillage treatments. Even though the SOC was low at the 20–30 cm depth, the CT had more SOC (1.68%) compared to the NT (1.53%) and RT (1.51%).
Table 2.
Soil pH and SOC measured 17 years after implementation of the trial at different soil depth and under different tillage treatments (NT, CT, and RT).
The results showed no significant interaction (p > 0.05) between tillage practices and nitrogen fertiliser application rates on SOC (Table 3). Similar trends were also observed in soil pH, where there were no significant interactions between the tillage systems and fertiliser application rates. (Table 3). However, the pH in the NT treatment was found to be significantly lower than that of the RT and CT treatments (Table 3).
Table 3.
The concentration of soil organic carbon (SOC) and soil pH at different N fertiliser levels under three tillage treatments (NT, CT, and RT) after 17 years of trial establishment.
The results showed a significant interaction (p < 0.05) between tillage treatments, sampling depth, and N fertiliser levels for both NO3− and NH4+. (Table 4) Rotational tillage, combined with the effect of N fertiliser levels and sampling depths, recorded the lowest concentration of NO3− when compared to that of CT and NT combined with N level and sampling depths. Moreover, the concentration of NH4+ varied significantly with the combined effect of tillage treatments, sampling depths, and N fertiliser levels.
Table 4.
Concentrations of NO3− and NH4+ (mg/kg) and standard errors of means found under different tillage treatments, sampling depths, and N fertiliser application rates.
4. Discussion
4.1. Soil Available Nitrate (NO3−)
The study found that NT had a significantly (p < 0.05) higher NO3− concentration (7.728 mg/kg) compared to CT (6.755 mg/kg) and RT (4.720 mg/kg). The results were in agreement with those of [22], who reported that direct seeding with mulch recorded the highest concentration of nitrate compared to conventional tillage. Conventional tillage accelerates the rate at which SOC decomposes; this favours the mineralization of soil nitrogen (from organic to inorganic form) [23]; hence, more NO3− becomes accessible to crop plants, so less nitrogen (NO3−) remains in the soil [8,9,10,11]. This is supported by the results of the present study (Table 2), where the concentration of SOC was high under NT, especially at the 0–10 cm depth, compared to CT and RT. The NT had more NO3− (7.728 mg/kg) and SOC (1.782%), followed by the CT (NO3− (6.755 mg/kg) and SOC (1.750%), then, the RT, with the least NO3− (4.720 mg/kg) and SOC (1.715%). The potential of nitrate to leach is very high in intensively tilled soils compared to the minimum and no tillage, because tillage increases the flow of water down the soil profile [24].
The results also found more NO3− at the 0–10 cm depth (6.787 mg/kg), followed by that at the 20–30 cm depth (6.229 mg/kg). The second depth (10–20 cm) recorded the lowest amount of NO3− (6.188 mg/kg). Similar findings were observed by [25], where biochar amendments and N fertiliser (Urea) significantly increased NO3− content at the top 0–10 cm soil depth. Ref. [25] also reported that the concentration of NO3− decreased with an increase in depth, which is contrary to the findings of the present study. More SOC (2.026%) was found at the 0–10 cm soil depth in the present study, hence, the accumulation of more NO3− at the 0–10 cm depth. On the other hand, the concentration of SOC was low at the 20–30 cm depth, but the concentration of NO3− was relatively higher than that at the 10–20 cm depth. This suggests that the NO3− had leached to deeper soil depths. The results also found a significantly (p < 0.05) higher concentration of NO3− with 200 kg/ha N (6.452 mg/kg), followed by 0 kg/ha N (6.420 mg/kg); 100 kg/ha N had the lowest amount of NO3− (6.333 mg/kg). These findings were inconsistent with [25], who reported that the NO3− content decreased with an increasing N fertiliser rate.
The concentration of NO3− was significantly different at different sampling periods. More NO3− was found in August 2019 (6.534 mg/kg), followed by 6.436 mg/kg in March 2020. Ref. [11] found that the concentration of nitrate was relatively higher after the harvesting of the maize crop than before sowing under both conventional and minimum tillage, which is similar to our findings, since, in August, the trial was left fallow (after the maize crop harvesting). April 2019 recorded the lowest concentration of NO3− (6.233 mg/kg). These findings were contrary to those of [26], who found that the concentration of NO3− increased during the growing period of corn under both no-till and tillage treatments. This suggests that more NO3− is taken by the growing maize crop during the growing period (April 2019 and March 2020), or the NO3− leaches to greater depths (>30 cm).
Moreover, the interaction of tillage treatments and sampling depths was significant. RT recorded the lowest NO3− concentration (4.642 mg/kg, 4.675 mg/kg, and 4.844 mg/kg) compared to NT and CT at all the sampling depths. The interaction of NT and sampling depth gave the highest concentration of NO3− (8.046 mg/kg). Most notably, the 0–10 cm soil depth recorded the highest concentration of NO3− under all the tillage treatments (RT (4.844 mg/kg), CT (7.472), and NT (8.046 mg/kg), while the lowest concentration was observed at the 20–30 cm depth for the RT (4.642 mg/kg) and CT (6.143 mg/kg). Ref. [26] found that the concentration of NO3− under NT was lower at 5–10 cm and at depths > 10 cm compared to CT. Their findings were different to our findings, where 0–10 cm under NT recorded the highest concentration of NO3− compared to 0–10 cm under CT. These findings suggest a low C:N ratio under CT, which rapidly releases more NO3− for immediate use by the maize crop, leaving less NO3− in the upper soil layer. On the other hand, leaving residues/mulching under NT may have increased the C:N ratio, resulting in the immobilization of N (NO3−); hence, more NO3− was available in the upper soil layer but not accessible to the maize crop.
On the other hand, NT had the highest NO3− concentration compared to RT and CT, regardless of the N fertiliser application rate. No-till recorded the highest concentration of NO3− (8.518 mg/kg) at 200 kg/ha N. Conversely, Ref. [22] found that the addition of farmyard manure and mineral fertiliser in direct seeding with mulch favoured the reduction of nitrate compared to conventional tillage, while [27] reported that the combination of both conventional tillage and high N fertiliser rates resulted in extreme losses of NO3− through leaching compared to NT. The lower NO3− concentration under the CT in the present study suggests that nitrate reduction is attributed to the disturbances caused by tillage on soil aggregates and their microbial community. Most notable is that RT had the lowest NO3− concentration compared to the other tillage practices at all the N fertiliser levels. Under the CT, the concentration of NO3− decreased with an increase in the N fertiliser levels, while, under the NT and RT, the NO3− increased with an increase in the N fertiliser levels.
Nitrate (NO3−) was found to be the dominant form of soil-available nitrogen in this study. Nitrate was dominant over NH4+ under different tillage treatments, sampling depths, N fertiliser application rates, and sampling periods. This indicates that more inorganic N in the form of NO3− in the topsoil was available to the maize, and, also, N losses as NO3− were highly possible. These findings were in contrast to [25] findings, which reported that NH4+ was dominant and accessible to rainfed rice, and that the chances of NO3− losses were very slim.
4.2. Soil Available NH4+
The concentration of NH4+ was significantly (p < 0.05) higher under the NT (0.762 mg/kg) compared to the RT (0.758 mg/kg), and the CT had a relatively low NH4+ (0.648 mg/kg). Similar findings were reported by [22], who found the highest NH4+ content under direct seeding with mulch compared to CT. Ref. [28] also found a greater NH4+ content under a no-tillage system than under a conventional tillage system. The lower concentration of NH4+ in CT suggests the mineralization of N to inorganic NH4+, and a relatively high uptake by the maize crop, such that less is left in the soil. No-till favours the immobilization of soil N (from inorganic to organic N); less N (NH4+) becomes available to crop plants, thus more NH4+ is found in the soil [5,14]. The greater concentration of NH4+ under NT has also been attributed to high levels of SOC found under the NT, since the two are complementary.
The ammonium also followed a similar trend to the NO3−; the concentration of NH4+ was higher at the 0–10 cm depth (0.851 mg/kg) and at 20–30 cm (0.832 mg/kg). This observation also explains more SOC in the upper soil layer (0–10 cm). The study was in agreement with the findings of [25], where NH4+ mostly accumulated in the top 10 cm layer of the soil. Ref. [24] also found that the concentration of NH4+ decreased with an increase in depth, while, in the present study, the concentration of NH4+ was higher at the 20–30 cm depth (0.832 mg/kg) and low at the 10–20 cm depth (0.485 mg/kg). This observation may be attributed to Ferralsols’ characteristics, especially the excellent porosity and infiltration, which may have leached more NH4+ to deep soil layers. Conversely to the findings of the present study, [28] found more NH4+ in deep soil layers (30–60 cm and 60–90 cm) compared to the shallow soil layer (0–30 cm), and the conclusion was that the formation of cracks in Vertisols displaces soil organic matter to deeper depths, promoting mineralization in the deepest layers. Furthermore, the results showed a significant difference (p < 0.05) but an inconsistent trend in the concentration of NH4+ at different N fertiliser application rates. More NH4+ was found with 0 kg/ha N (0.954 mg/kg), followed by 200 kg/ha N (0.652 mg/kg); 100 kg/ha N resulted in the lowest amount of NH4+ (0.561 mg/kg). Conversely, Ref. [25] reported that the concentration of NH4+ decreased with an increase in N fertiliser levels. Our observations with regards to more NH4+ with 0 kg/ha N in the present study are that the ratio of carbon to nitrogen (C:N) becomes relatively high in maize crop residues where there was no N fertiliser input, therefore resulting in microbial immobilization. On the other hand, adding N fertiliser may have reduced the C:N ratio, such that more NH4+ was mineralized for immediate crop use.
The concentration of NH4+ found in March 2020 was significantly higher than that found in August 2019 and April 2019, respectively. Conversely, Ref. [26] reported that the concentration of NH4+ decreased in the growing period of corn in no-till and tillage treatments. More NH4+ during the 2020 growing period (March 2020) suggests that the application of N fertiliser and mulching maintained more inorganic NH4+ in the topsoil available to the maize crop.
The interaction between tillage treatments and sampling depths was significant (p < 0.05) for soil-available NH4+. The results showed that at the 10–20 cm soil depth, the concentration of NH4+ was low for all the tillage treatments (NT (0.386 mg/kg), RT (0.488 mg/kg), and CT (0.580 mg/kg)). These findings are similar to those of [26], who found that the content of NH4+ in the middle layer was lower under NT compared to that under CT treatment. The 20–30 cm depth recorded more NH4+ for RT (1.237 mg/kg) and CT (0.692 mg/kg) than for NT (0.566 mg/kg). The NT had the highest NH4+ concentration (1.333 mg/kg) amongst them all at 0–10 cm. Ref. [26] also reported that more NH4+ was found in the upper soil layers (0–5 cm) in the no-till compared to tillage treatments, which is similar to our findings. This may be attributed to the placement of the maize crop residues and N fertiliser on the soil surface under the NT.
The results showed a significant interaction (p < 0.05) between tillage treatments and N fertiliser application rates for soil-available NH4+. The highest concentration of NH4+ was found under NT with 0 kg/ha N (1.478 mg/kg). The concentration of NH4+ was relatively lower with 200 kg/ha N in NT (0.545 mg/kg) and CT (0.598 mg/kg) but higher in RT (0.813 mg/kg). The ammonium found under the RT (0.669 mg/kg) and the CT (0.717 mg/kg) with 0 kg/ha N was more than that with 200 kg/ha N. The decomposition of maize crop residues, together with soil organic matter and soil organic carbon, is slow under the NT; not adding N fertiliser slows the decomposition process even further, and nitrogen (NH4+) is immobilized due to the high C:N ratio. Hence, there was more NH4+ under the NT with 0 kg/ha N than under the CT with 0 kg/ha. The low NH4+ in both the NT and CT with 200 kg/ha is attributed to the low C:N ratio as a result of the high N fertiliser application rate. More NH4+ found in the RT at 200 kg/ha N may be attributed to the equilibrium state between the mineralization and immobilization of the NH4+. The addition of N fertiliser under the RT may have counteracted the high C:N ratio from the effect of residues, leaving mineralization and immobilization at an equilibrium state.
5. Conclusions
In the current study, the no-till had a higher concentration of NO3− and NH4+ compared to conventional tillage. In contrast, the rotational tillage had the lowest concentration of nitrate compared to the conventional tillage. The concentration of these nutrients varied with depth in different tillage treatments, suggesting different nitrogen management practices to balance the availability of nitrogen may be required over the growing season. For example, in the no-till, the concentration of NO3− and NH4+ was high at the top 0–10 cm and 20–30 cm depths compared to the 10–20 cm depth. However, in the rotational tillage treatment, these nutrients were relatively uniform, while, in the conventional tillage treatment, these nutrients decreased with depth. The effect of the N fertiliser application rates in the different tillage treatments varied. The NT recorded more NH4+, with 0 kg/ha N compared to the CT and RT, while more NO3− was found with 200 kg/ha N. The rotational tillage recorded more NH4+ with 200 kg/ha N. These observations suggest that tillage treatments and N fertiliser application rates need to be chosen so that they are complementary/compatible for a good yield and quality of food crops while improving soil fertility.
Author Contributions
Conceptualization, N.J.S.; Formal analysis, N.J.S.; Funding acquisition, L.S.M. and K.N.; Investigation, S.G.Z.; Resources, K.N.; Supervision, N.M.M.; Writing—original draft, S.G.Z.; Writing—review and editing, N.M.M. All authors have read and agreed to the published version of the manuscript.
Funding
This Research was funded by National Research Foundation (NRF) of South Africa.
Data Availability Statement
Not applicable.
Conflicts of Interest
The authors declare no conflict of interest.
References
- Anas, M.; Liao, F.; Verma, K.K.; Sarwar, M.A.; Mahmood, A.; Chen, Z.; Li, Q.; Zeng, X.; Liu, Y.; Li, Y. Fate of nitrogen in agriculture and environment: Agronomic, eco-physiological and molecular approaches to improve nitrogen use efficiency. Biol. Res. 2020, 53, 47. [Google Scholar] [CrossRef] [PubMed]
- de Bruijn, F.J. Biological nitrogen fixation. Adv. Microbiol. J. 2016, 6, 407–411. [Google Scholar] [CrossRef]
- Leghari, S.J.; Wahocho, N.A.; Laghari, G.M.; HafeezLaghari, A.; MustafaBhabhan, G.; HussainTalpur, K.; Bhutto, T.A.; Wahocho, S.A.; Lashari, A.A. Role of nitrogen for plant growth and development: A Review. Adv. Environ. Biol. 2016, 10, 209–218. [Google Scholar]
- Rutting, T.; Aronsson, H.; Delin, S. Efficient use of nitrogen in agriculture. Nutr. Cycl. Agroecosyst. 2018, 110, 1–5. [Google Scholar] [CrossRef]
- Verhulst, N.; Govaerts, B.; Verachtert, E.; Castellanos-Navarrete, A.; Mezzalama, M.; Wall, P.; Deckers, J.; Sayre, K.D. Conservation Agriculture, Improving Soil Quality for sustainable Production Systems? In Advances in Soil Science: Food Security and Soil Quality; Lal, R., Stewart, B.A., Eds.; CRC Press: Boca Raton, FL, USA, 2010; pp. 137–208. [Google Scholar]
- Sithole, N.J.; Magwaza, L.S.; Mafongoya, P.L. Conservation agriculture and its impact on soil quality and maize yield: A South African perspective. Soil Tillage Res. 2016, 162, 55–67. [Google Scholar] [CrossRef]
- Xue, J.; Pu, C.; Liu, S.; Chen, Z.; Chen, F.; Xiao, X.; Lal, R.; Zhang, H. Effects of tillage systems on soil organic carbon and total nitrogen in a double paddy cropping system in Southern China. Soil Tillage Res. 2015, 153, 161–168. [Google Scholar] [CrossRef]
- Al-Kaisi, M.M.; Yin, X.H. Tillage and crop residue effects on soil carbon and carbon dioxide emission in corn–soybean rotations. J. Environ. Qual. 2005, 34, 437–445. [Google Scholar] [CrossRef]
- Hafif, B. Effect of Tillage on Soil Nitrogen; A Review. Int. J. Adv. Sci. Eng. Inf. Technol. 2014, 4, 16–19. [Google Scholar] [CrossRef]
- Rueda, M.; Munoz-Guerra, L.M.; Yunta, F.; Esteban, E.; Tenorio, J.L.; Lucena, J.J. Tillage and crop rotation effects on barley yield and soil nutrients on a Calciortidic Haploxeralf. Soil Tillage Res. 2007, 92, 1–9. [Google Scholar]
- Khan, S.; Shah, A.; Nawaz, M.; Khan, M. Impact of different tillage practices on soil physical properties, nitrate leaching and yield attributes of maize (Zea mays L.). J. Soil Sci. Plant Nutr. 2017, 17, 240–252. [Google Scholar] [CrossRef]
- Wilts, A.R.; Reicosky, D.C.; Allmaras, R.R.; Clapp, C.E. Long-term corn residue effects: Harvest alternatives, soil carbon turnover, and root-derived carbon. Soil Sci. Soc. Am. J. 2004, 68, 1342–1351. [Google Scholar] [CrossRef]
- Cui, S.Y.; Chen, F.; Xue, J.F.; Tang, F.; Zhang, W.G.; Lal, H.L. Tillage effects on nitrogen leaching and nitrous oxide emission from double-cropped paddy fields. Agron. J. 2014, 106, 9. [Google Scholar] [CrossRef]
- Marahatta, S.; Sah, S.K.; MacDonald, A.; Timilnisa, J.; Devkota, K.P. Influence of Conservation Agriculture Practices on Physical and Chemicl Properties of Soil. Int. J. Adv. Res. 2014, 2, 43–49. [Google Scholar]
- Jensen, L.S.; Schjoerring, J.K. Benefits of Nitrogen for Food, Fibre and Industrial Production, The European Nitrogen Assessment ed.; Cambridge University Press: Cambridge, UK, 2011; pp. 1–9. [Google Scholar]
- Ribaudo, M.; Delgado, J.; Hansen, L.; Livingston, M.; Mosheim, R.; Williamson, J. Nitrogen in Agricultural Systems: Implications for Conservation Policy; ERR-127; U.S. Department of Agriculture, Economic Research Service: Washington, DC, USA, 2011. [Google Scholar]
- Venterea, R.T.; Burger, M.; Spokas, K.A. Nitrogen Oxide and Methane emissions under varying tillage and fertilizer management. J. Environ. Qual. 2005, 34, 1467–1477. [Google Scholar] [CrossRef] [PubMed]
- Zulu, S.G.; Motsa, N.M.; Sithole, N.J.; Magwaza, L.S.; Ncama, K. Soil macrofauna abundance and taxonomic richness under long-term no-till conservation agriculture in a semi-arid environment of South Africa. Agronomy 2022, 12, 722. [Google Scholar] [CrossRef]
- Okalebo, J.R.; Gathua, K.W.; Woomer, P.L. Laboratory Methods of Soil and Plant Analysis: A Working Manual, 2nd ed.; Sacred: Nairobi, Kenya, 2002. [Google Scholar]
- Kowalenko, C.G. Assessment of Leco CNS-2000 analyzer for simultaneously measuring total carbon, nitrogen and sulphur in soil Commun. Soil Sci. Plant Anal. 2001, 32, 14. [Google Scholar] [CrossRef]
- Malhi, S.S.; Nyborg, M.; Harapiak, J.T. Effects of long-term N fertilizer-induced acidification and liming on micronutrients in soil and in bromegrass hay. Soil Tillage Res. 1998, 48, 91–101. [Google Scholar] [CrossRef]
- Cheneby, D.; Brauman, A.; Rabary, B.; Philippot1, L. Differential Responses of Nitrate Reducer Community Size, Structure, and Activity to Tillage Systems. Appl. Environ. Microbiol. 2009, 75, 3180–3186. [Google Scholar] [CrossRef]
- Vilakazi, B.S.; Zengeni, R.; Mafongoya, P. The effects of different tillage techniques and N fertilizer rates on Nitrogen and Phosphorus in dry land Agriculture. Agronomy 2022, 12, 2389. [Google Scholar] [CrossRef]
- Celika, I.; Günal, H.; Acara, M.; Göka, M.; Barut, Z.B.; Pamiralan, H. Long-term tillage and residue management effect on soil compaction and nitrate leaching in a Typic Haploxerert soil. Int. J. Plant Prod. 2017, 11, 131–150. [Google Scholar]
- Oladele, S.O.; Adeyemo, A.J.; Awodun, M.A. Influence of rice husk biochar and inorganic fertilizer on soil nutrients availability and rain-fed rice yield in two contrasting soils. Geoderma 2019, 336, 1–11. [Google Scholar] [CrossRef]
- Anugroho, F.; Kitou, M. Effect of Tillage Treatments of Hairy Vetch Residues on Soil Inorganic-N Distributions and Corn Growth in a Subtropical Region. Appl. Environ. Soil Sci. 2020, 2020, 7049161. [Google Scholar] [CrossRef]
- Zia, N.; Iqbal, M.; Sarwar, N.; Nawaz, M.; Imran, M.; Shaheen, M.R.; Ur-Rehman, A.; Shehzad, S.; Jawad, Y. Impact of tillage methods and nitrogen application rates on Soil physical health indices, NO3, Content and yield related traits of wheat. Int. J. Biosci. 2018, 12, 73–81. [Google Scholar]
- Lopez-Bellido, L.; Munoz-Romero, V.; Fernandez-Garcia, P.; Lopez-Bellido, R.J. Ammonium accumulation in soil: The long-term effects of tillage, rotation and N rate in a Mediterranean Vertisol. Soil Use Manag. 2014, 30, 471–479. [Google Scholar] [CrossRef]


Disclaimer/Publisher’s Note: The statements, opinions and data contained in all publications are solely those of the individual author(s) and contributor(s) and not of MDPI and/or the editor(s). MDPI and/or the editor(s) disclaim responsibility for any injury to people or property resulting from any ideas, methods, instructions or products referred to in the content. |
© 2023 by the authors. Licensee MDPI, Basel, Switzerland. This article is an open access article distributed under the terms and conditions of the Creative Commons Attribution (CC BY) license (https://creativecommons.org/licenses/by/4.0/).