


Coffee Pulp Biomass Utilization on Coffee Production and Its Impact on Energy Saving, CO2 Emission Reduction, and Economic Value Added to Promote Green Lean Practice in Agriculture Production

 , ,
, , 
Abstract
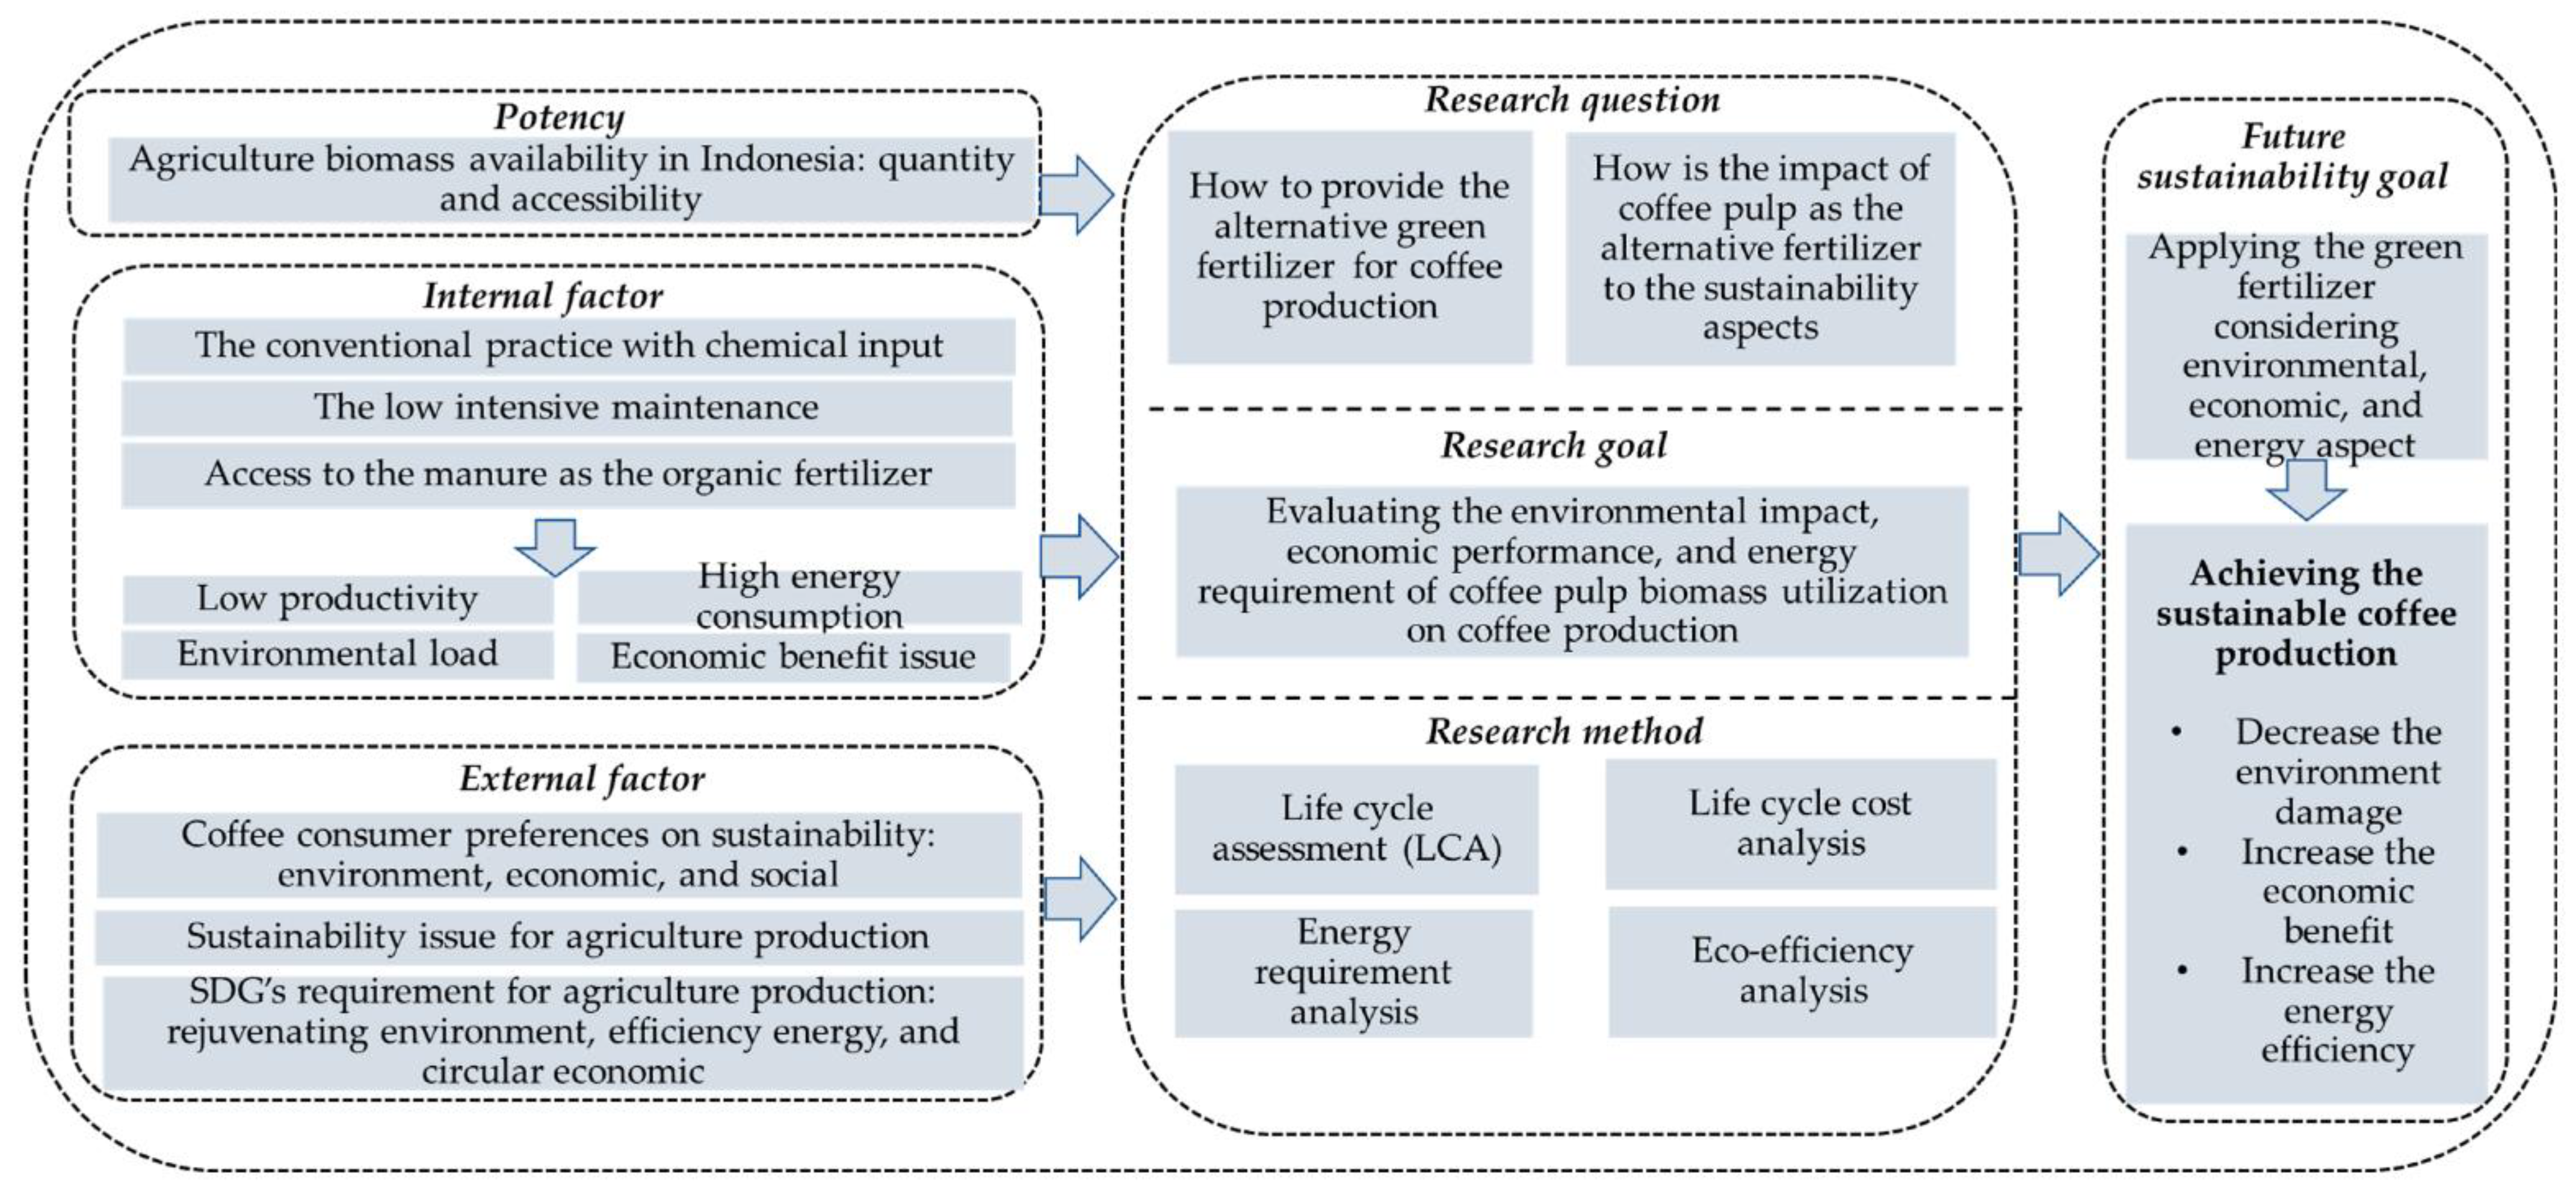
:1. Introduction
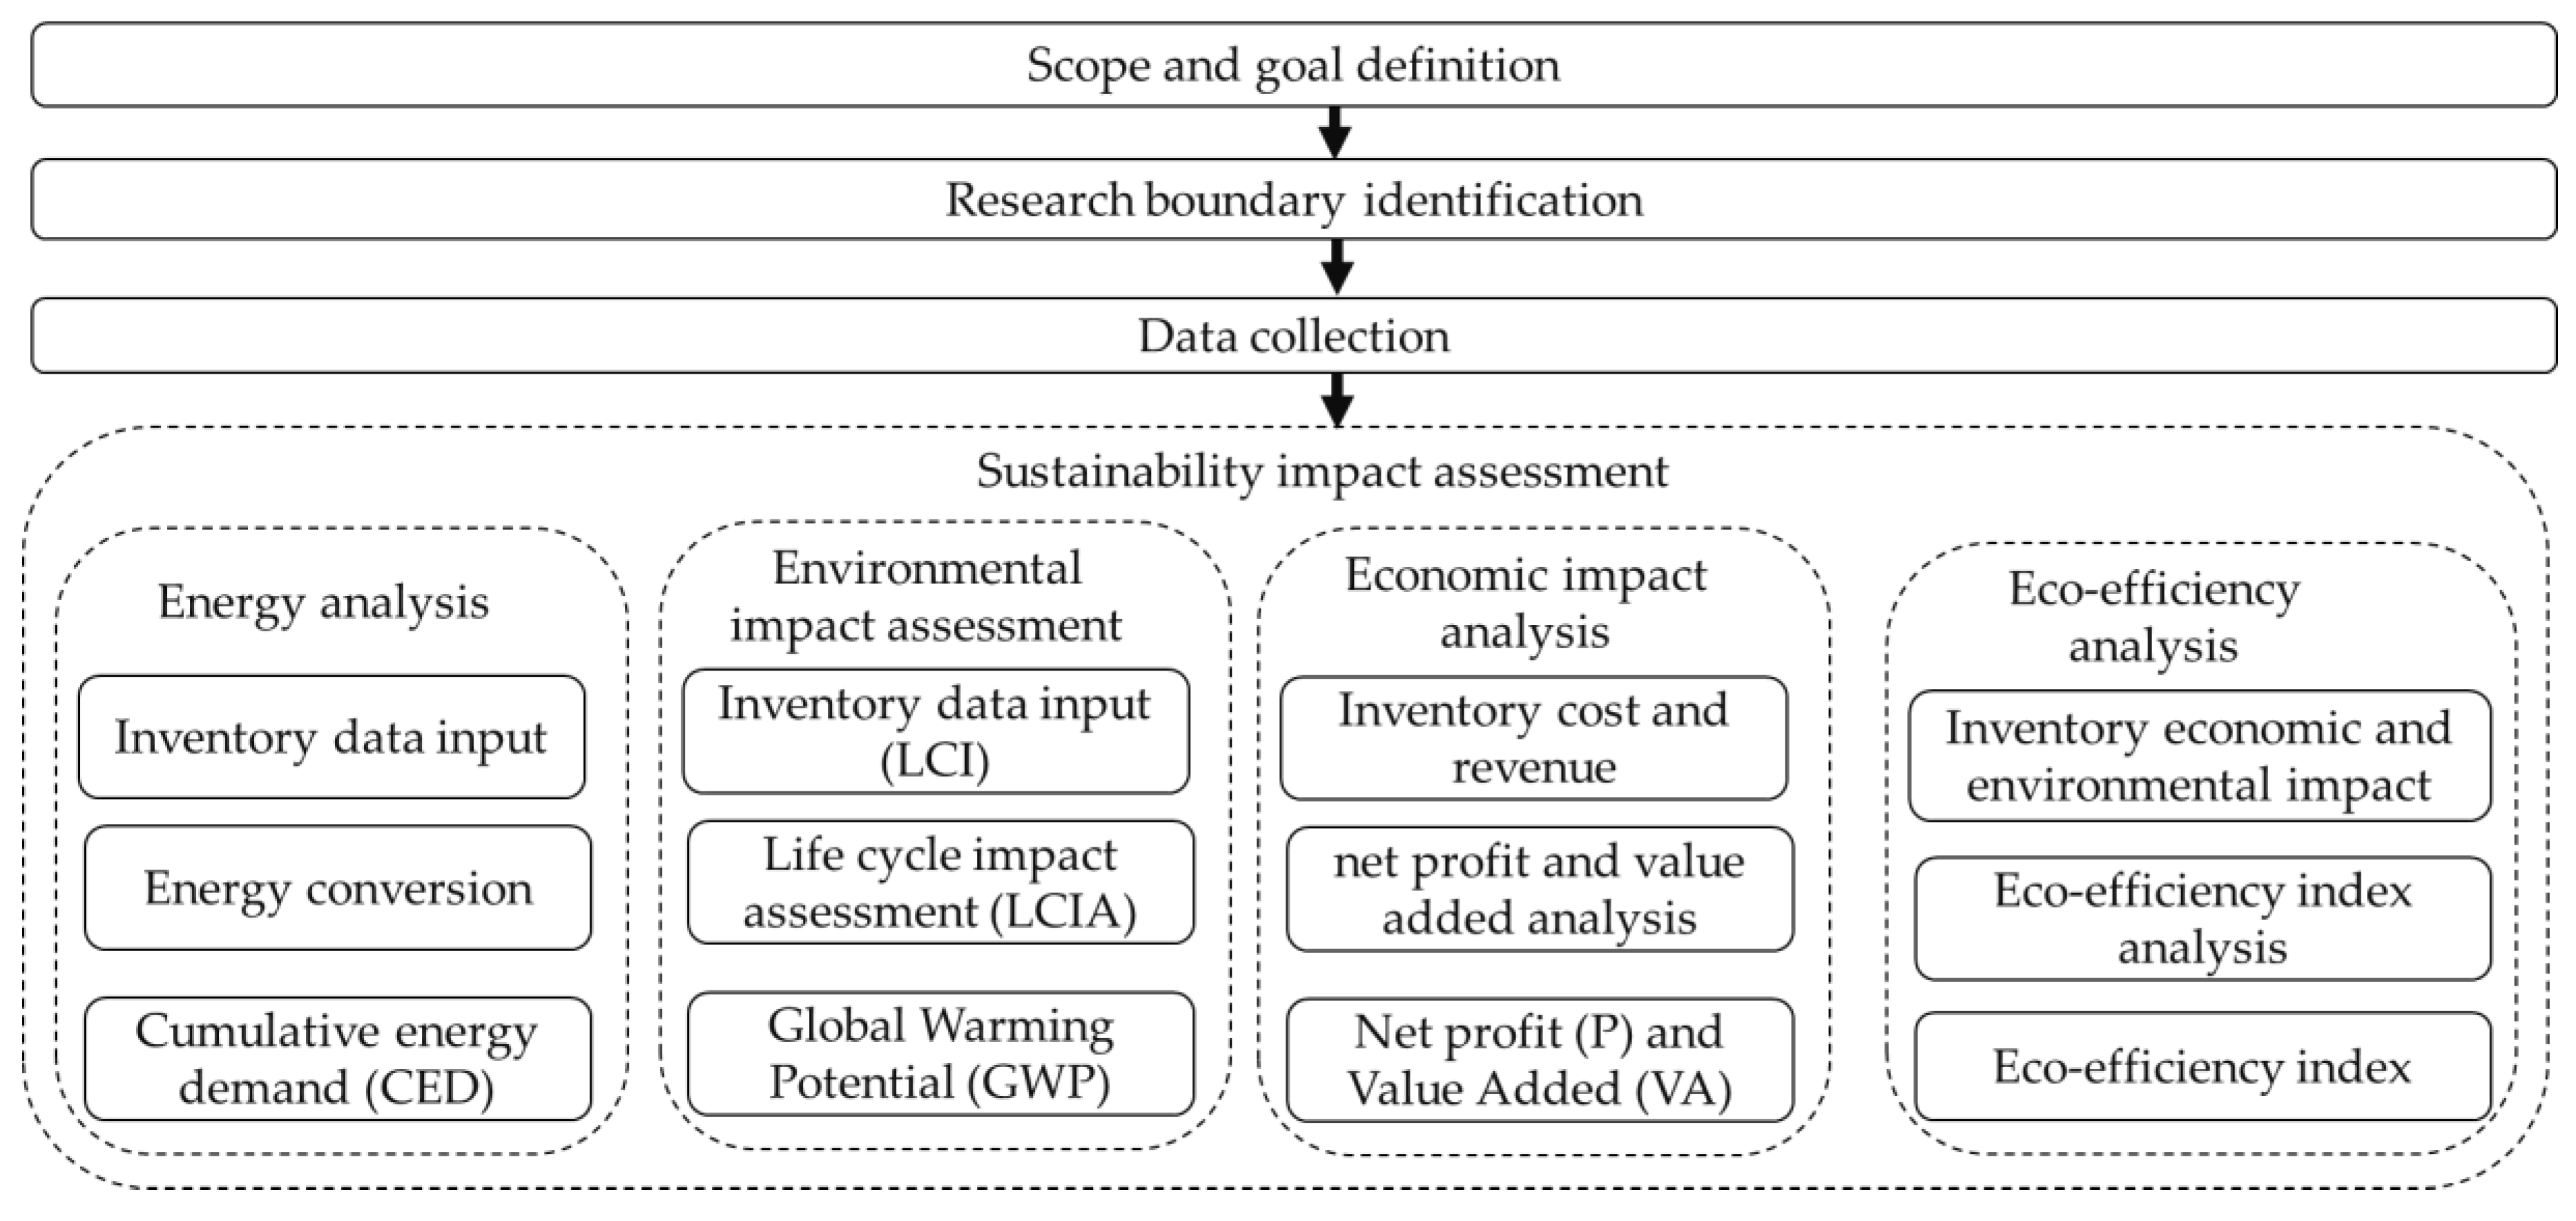
2. Materials and Methods
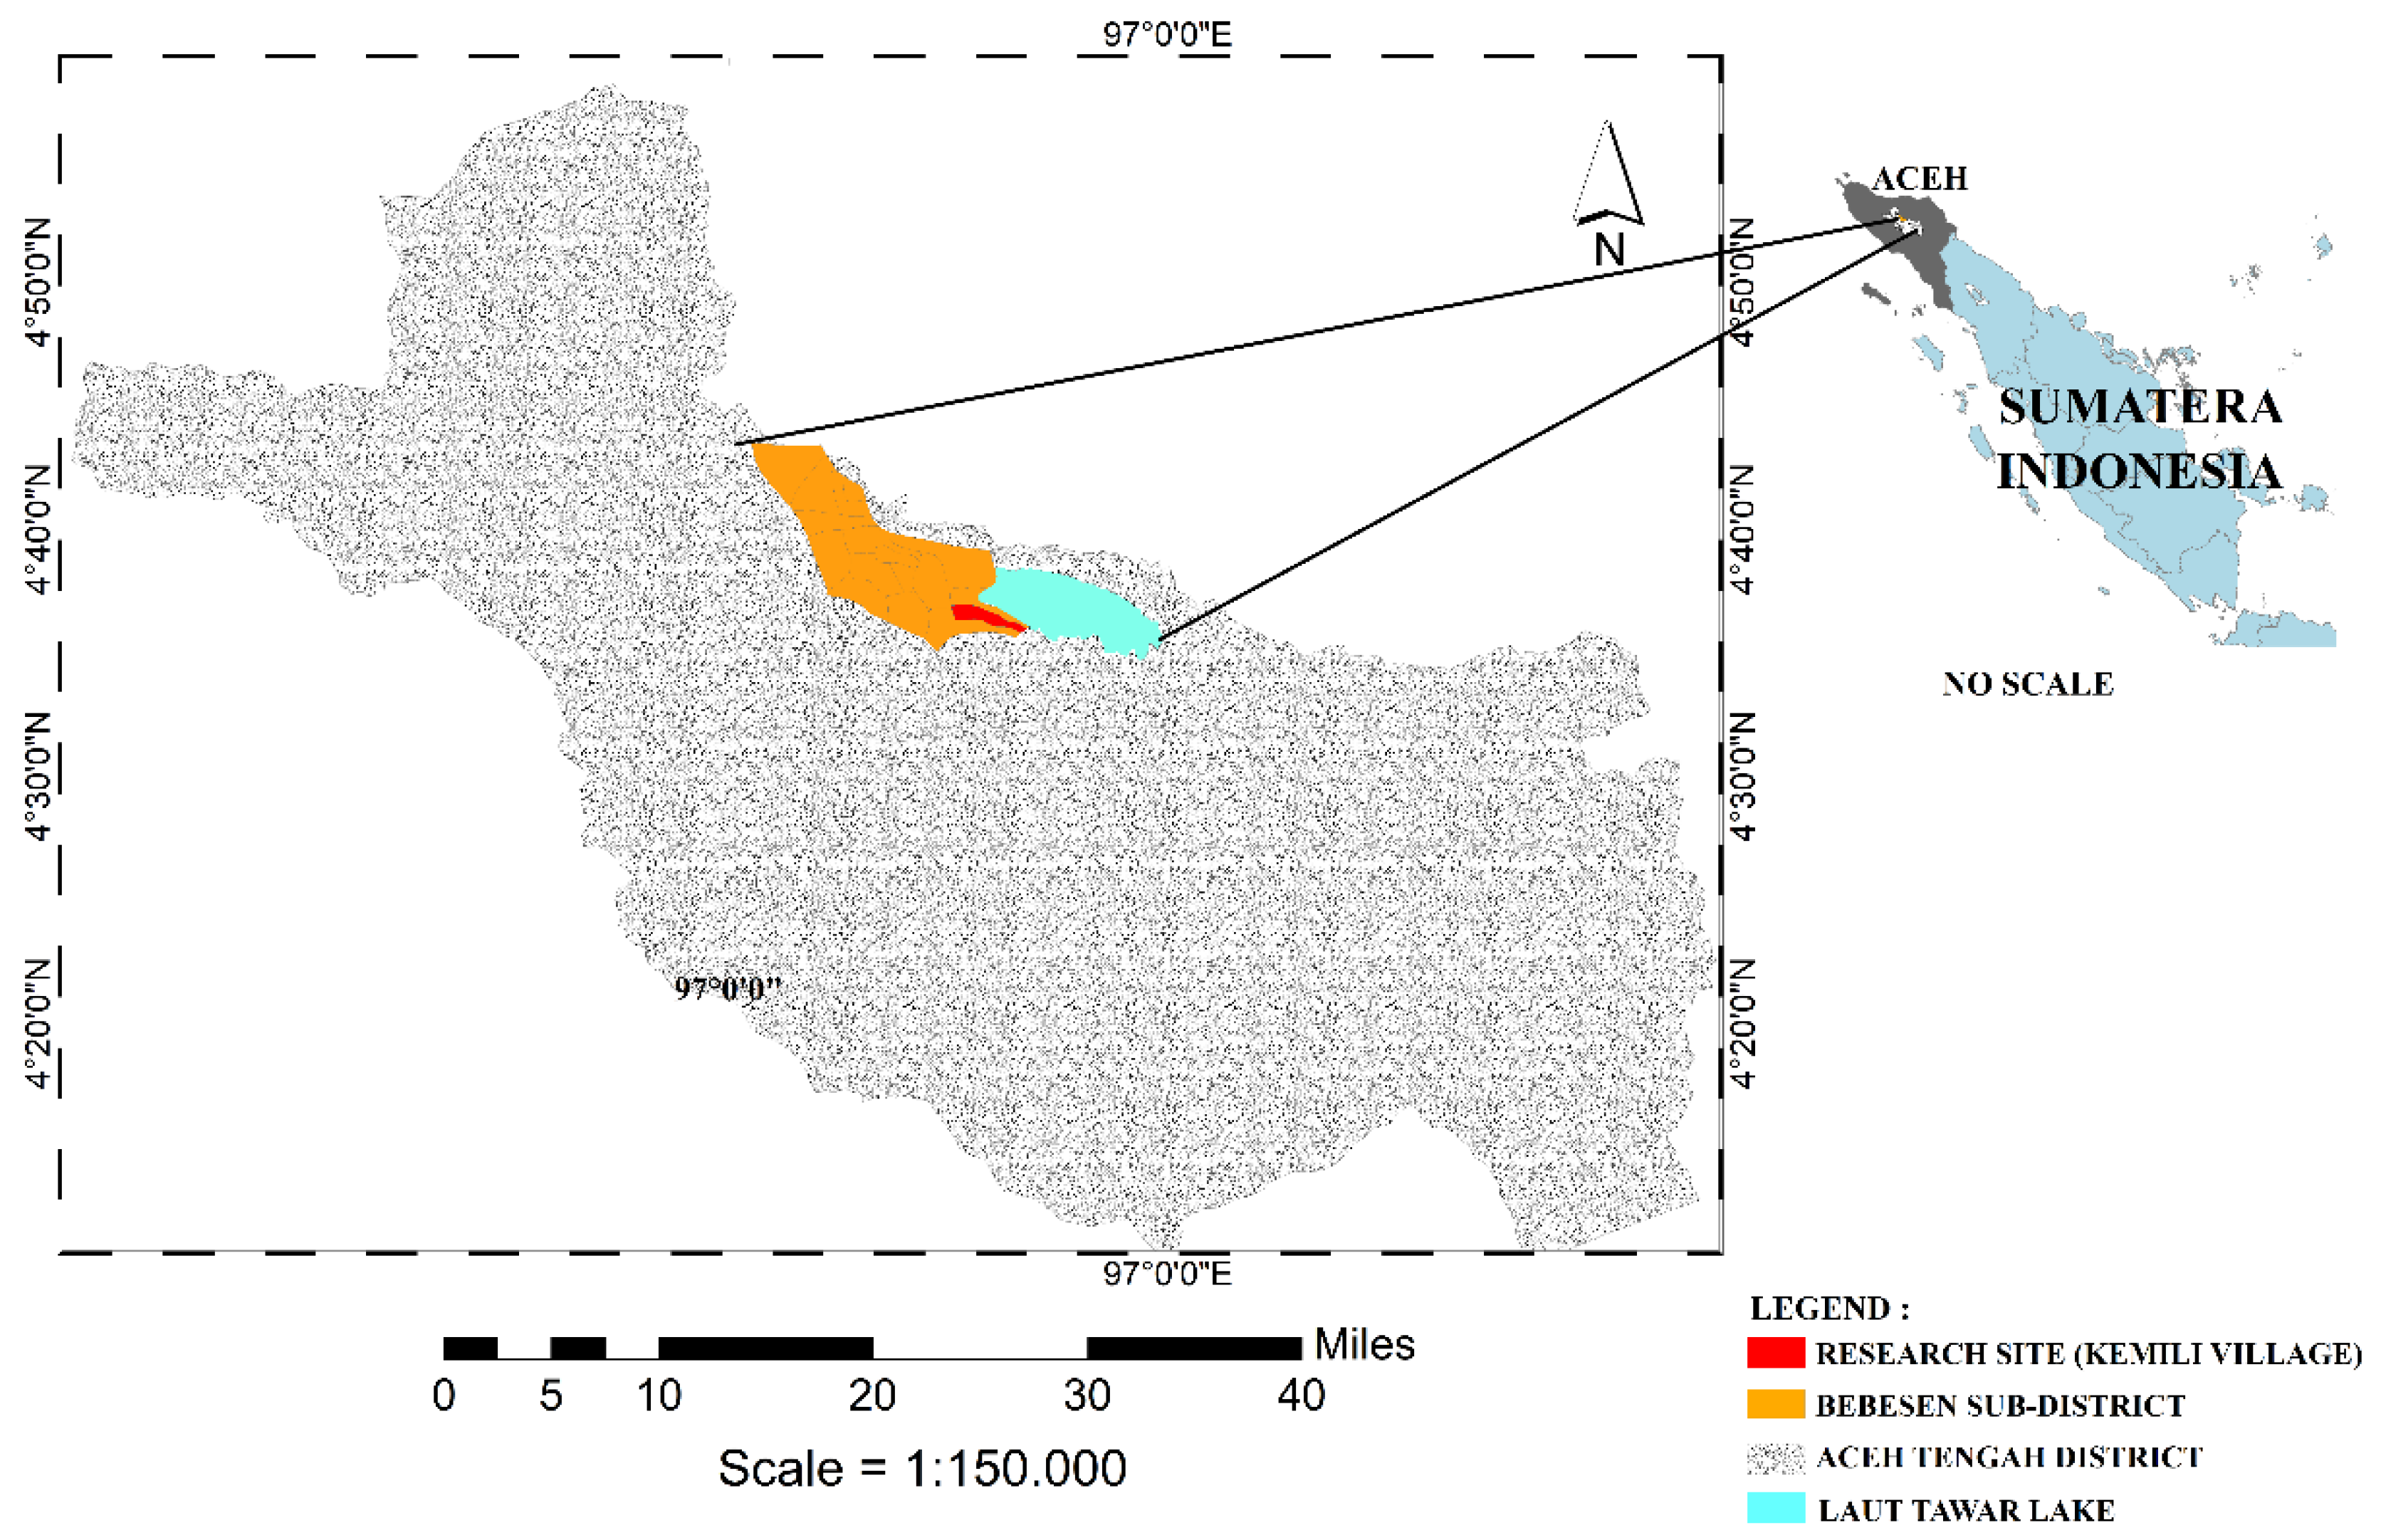
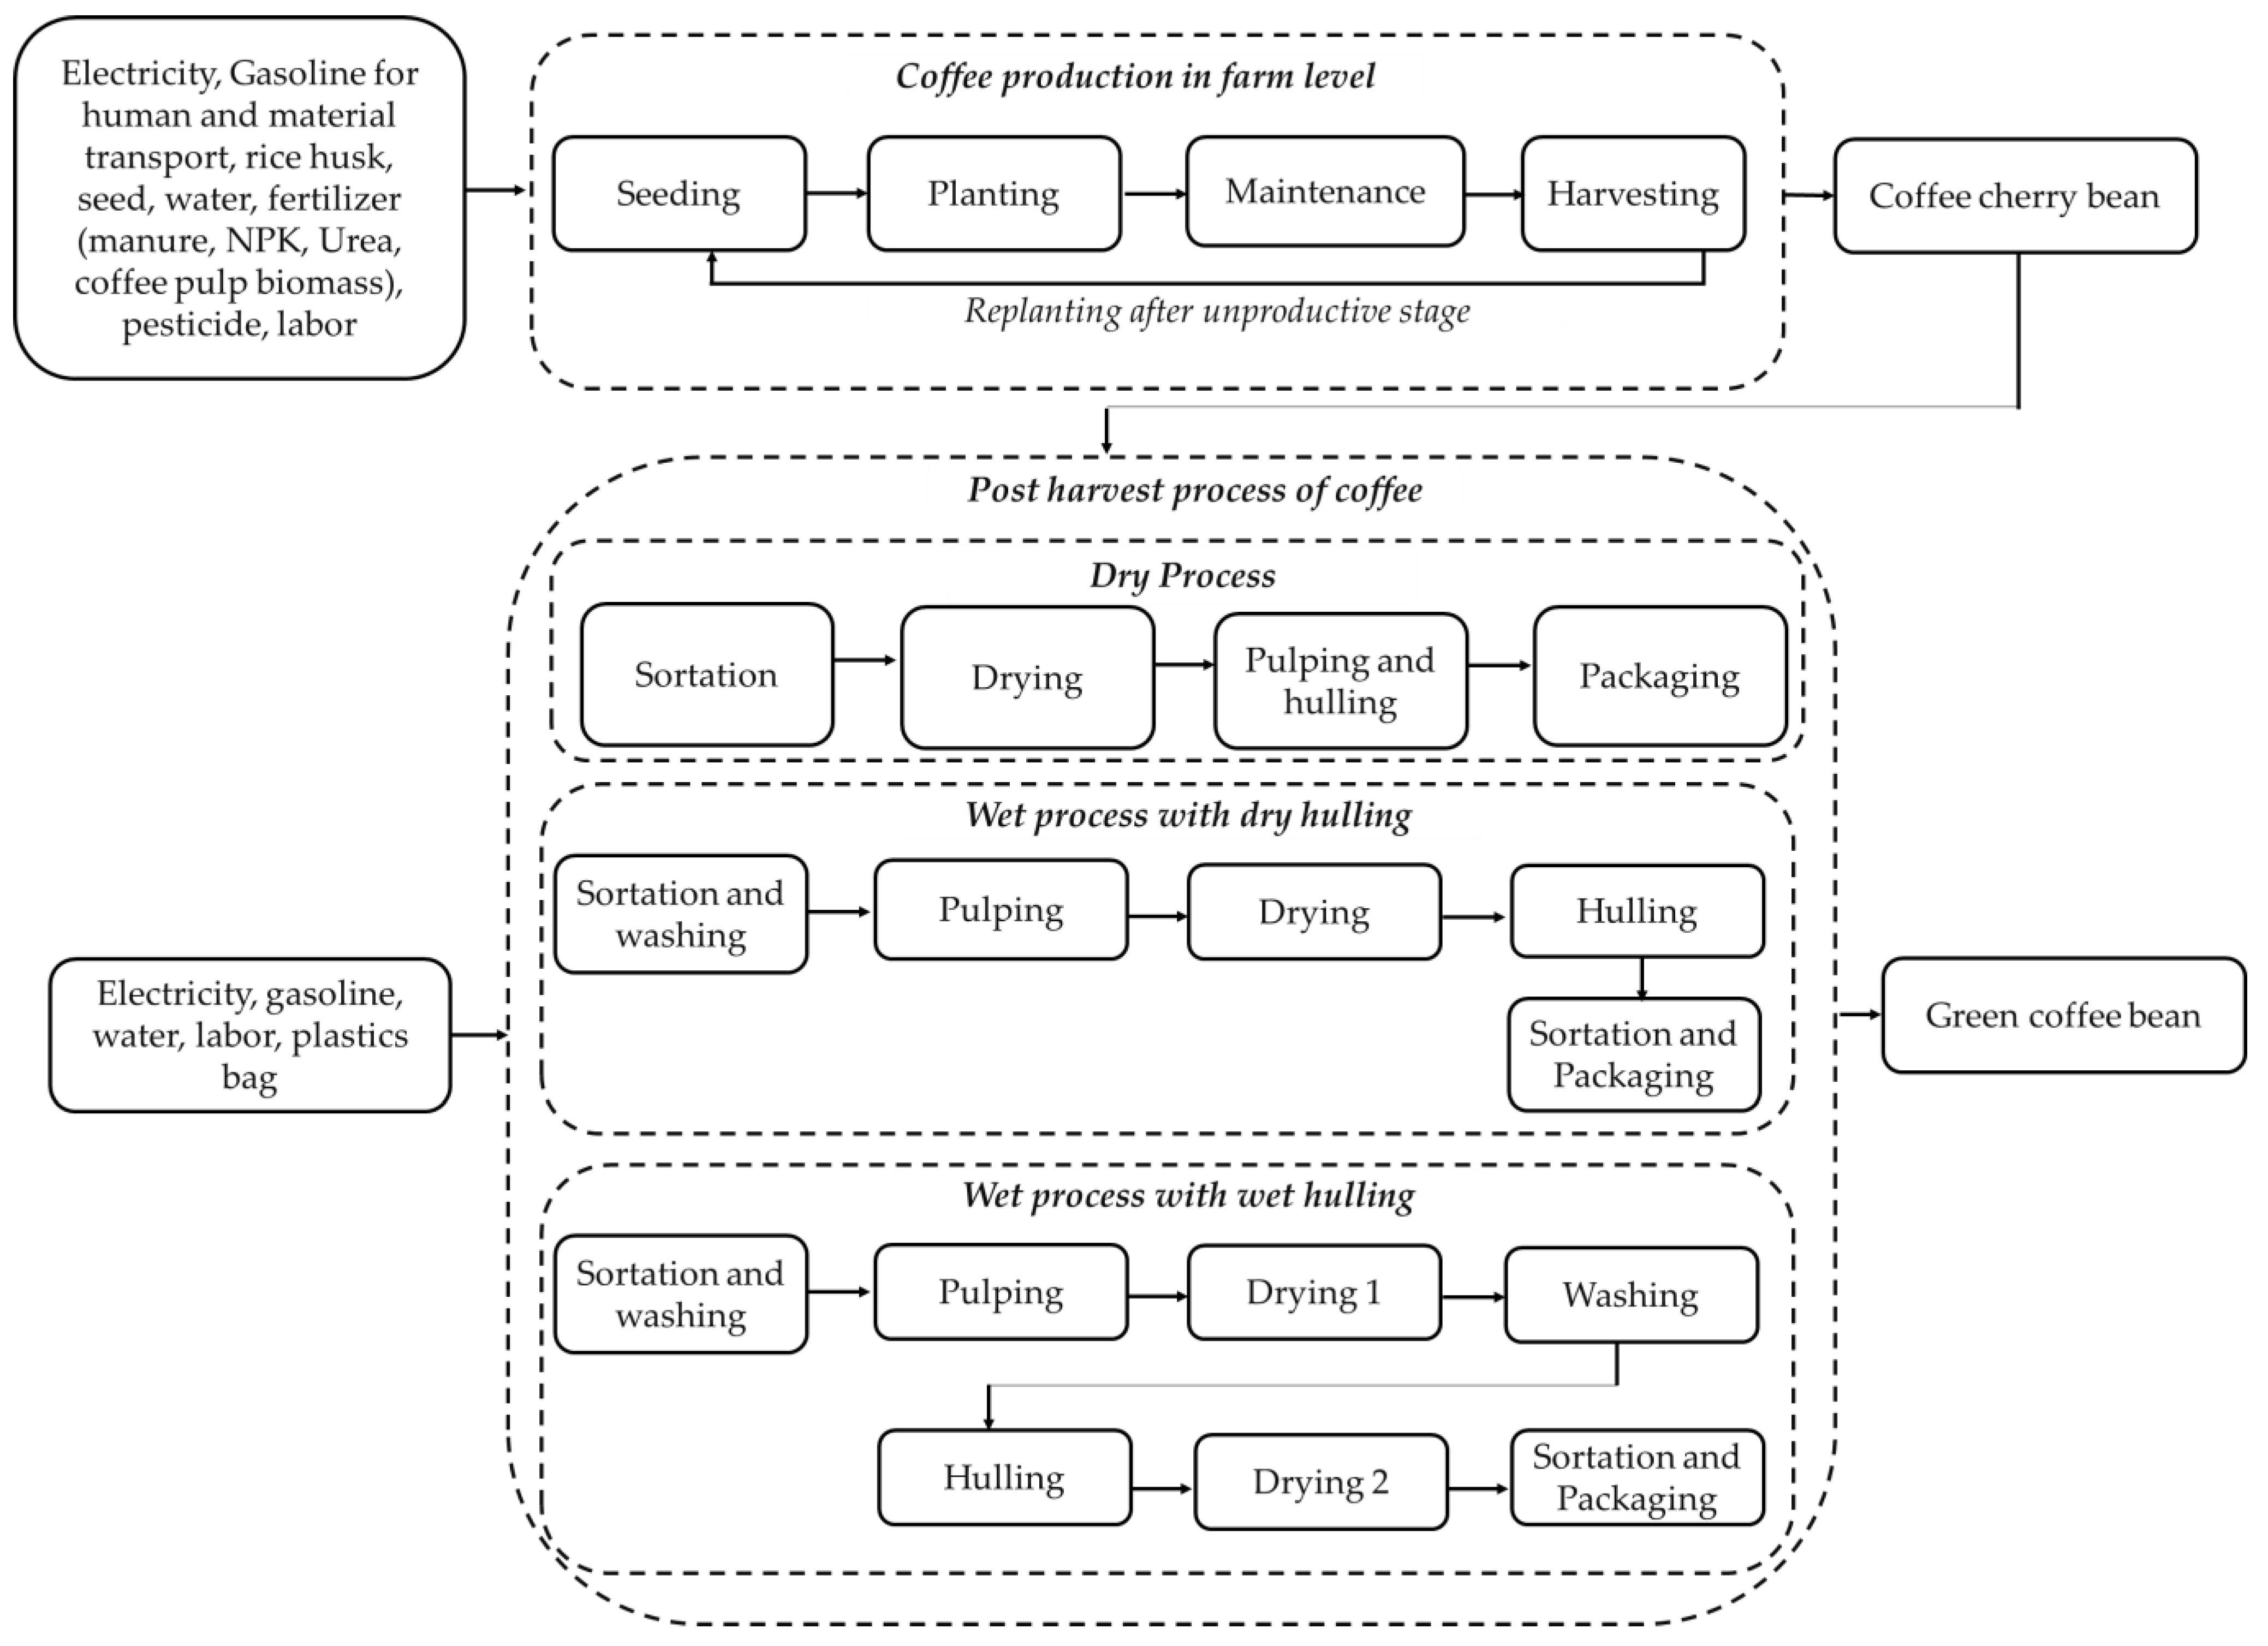
2.1. The Research Boundary and Scenarios
2.1.1. The Research Boundary
2.1.2. The Research Scenario
- (1)
- Chemical Manure (CM): This scenario is commonly used by farmers in Indonesia and involves the use of a combination of chemical fertilizer (NPK) and manure as the organic fertilizer.
- (2)
- Organic Manure (OM): This scenario is performed by applying the manure as the primary fertilizer input during the cultivation. A previous study reported that access to large amounts of manure is challenging [5]. The farmers must frequently travel long distances to provide a lot of manure for their coffee cultivation. Therefore, only a few coffee farmers are practicing using organic manure with a single application on their farm.
- (3)
- Chemical Coffee pulp (CPB): This scenario is performed by applying chemical fertilizer combined with the coffee pulp as an organic fertilizer. The amount of coffee pulp per tree is 2–4 kg per application.
- (4)
- Organic Coffee pulp (OPB): This scenario uses the coffee pulp as a fertilizer. The farmer directly applies the coffee pulp after the pulp is resulted as the co-product of green coffee beans production. In the single use of a coffee pulp application (OPB), an amount of about 4–8 kg of coffee pulp is applied per coffee tree in the farm, which is higher than in CPB. Since the availability and accessibility of coffee pulp are not difficult for farmers, the application of coffee pulp can be widely applied.
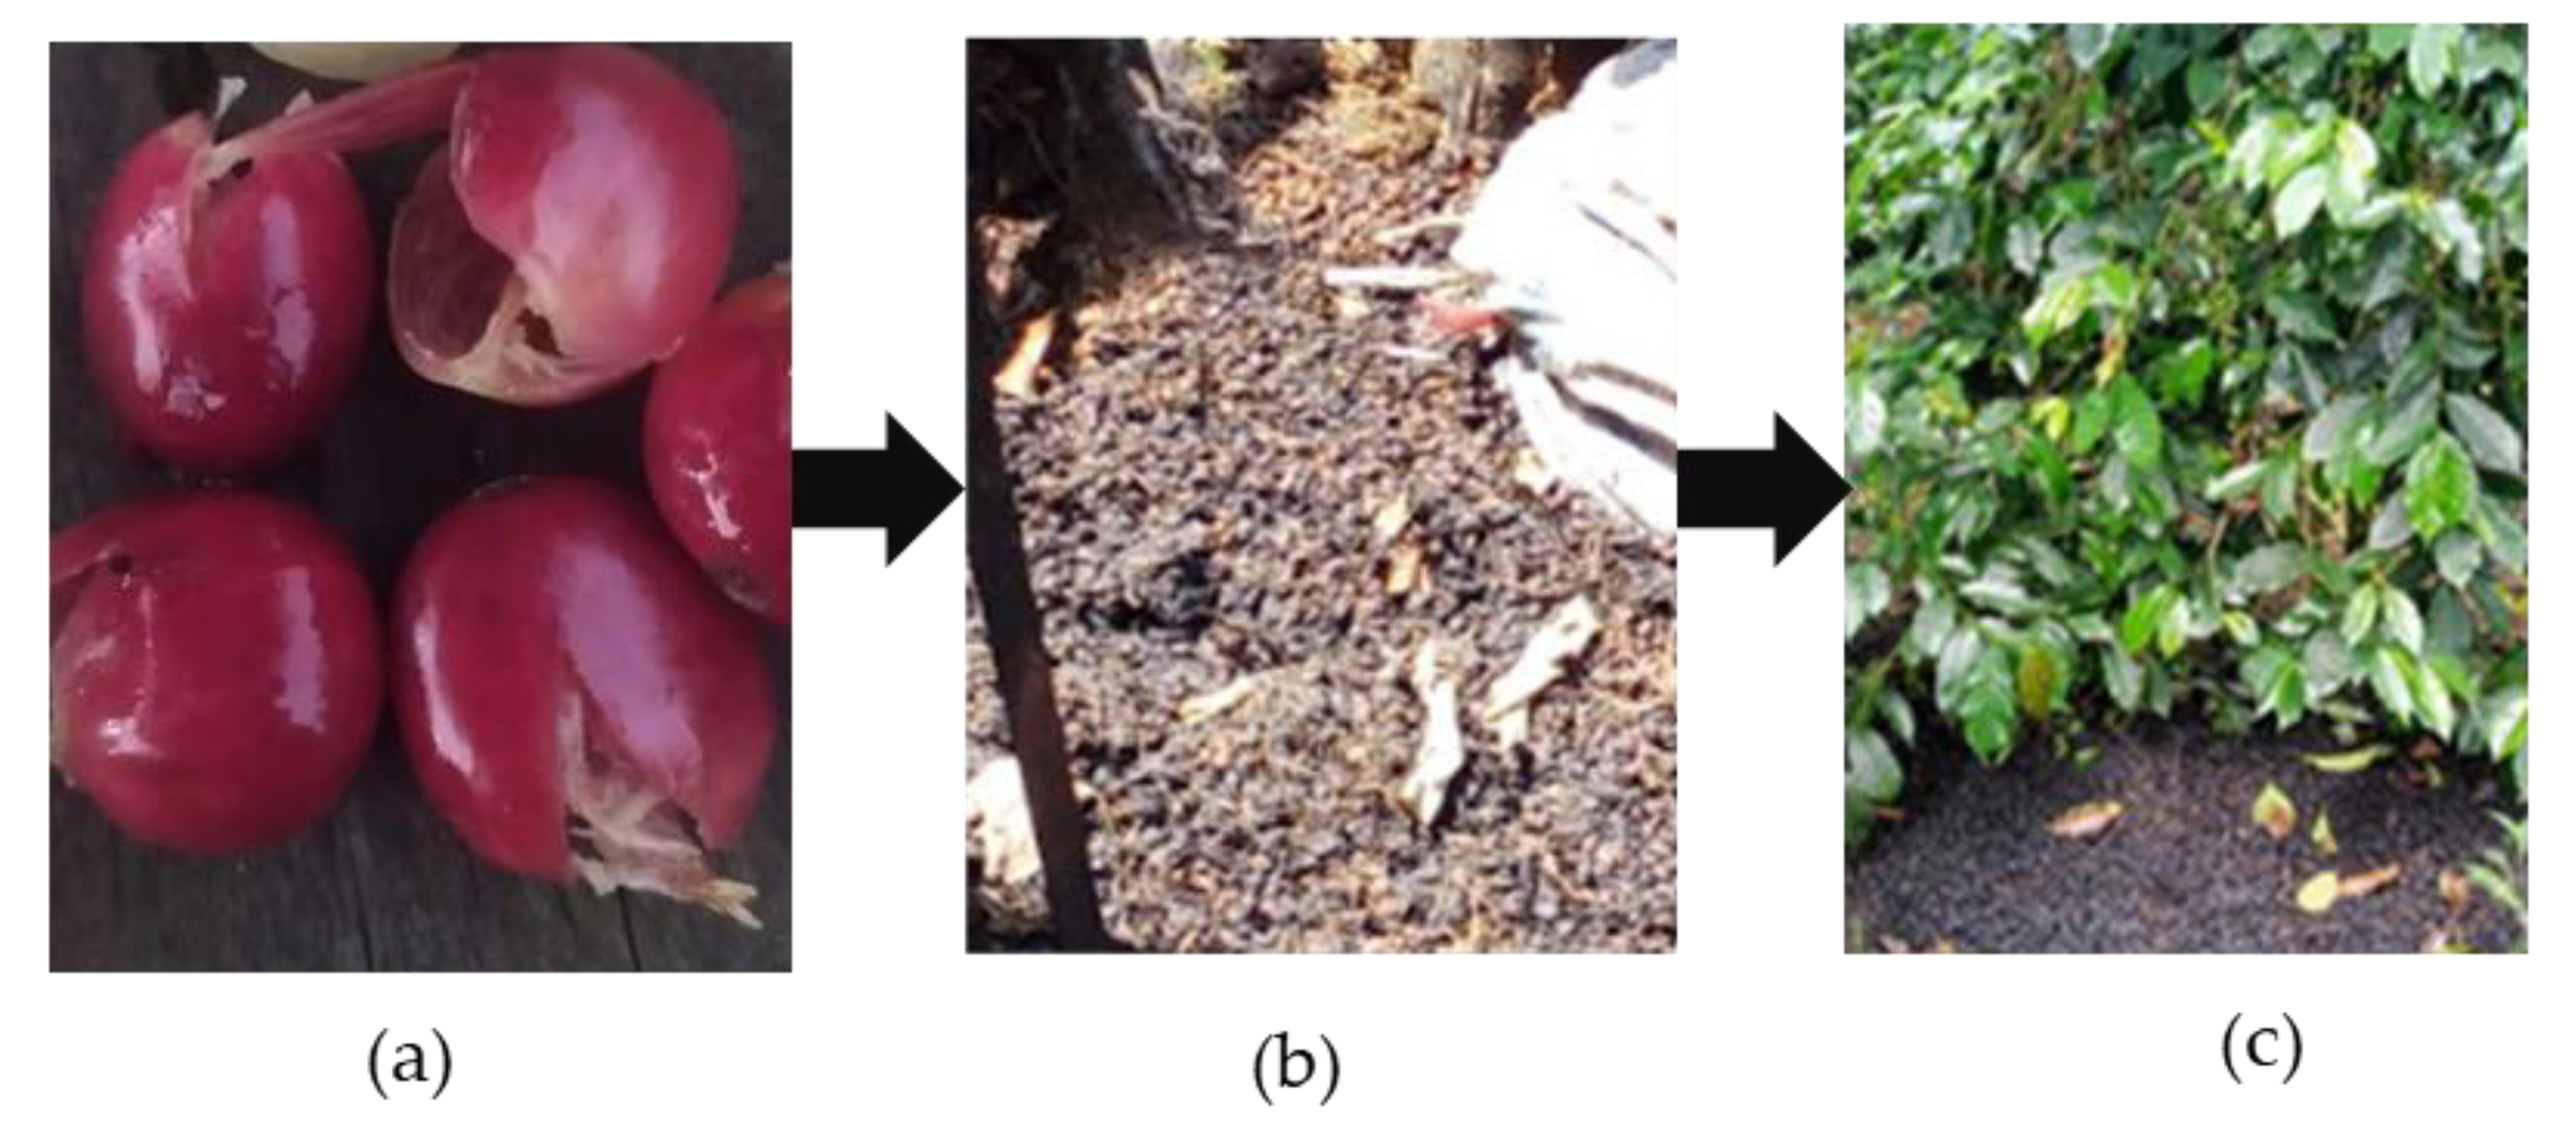
- (1)
- Dry Process: this is also known as the natural process. The coffee cherry bean is directly dried after the sortation process. The pulping is performed after the dried coffee has lost 10–12% of its moisture content. In the natural process, the water consumption during the process is lower than the other process.
- (2)
- Wet Process with Dry Hulling: the coffee cherry bean is directly pulped after sortation. The coffee is dried after pulping until the moisture content is between 10% and 12%. Then, the dried coffee bean is hulled in dry conditions.
- (3)
- Wet Process with Wet Hulling: the coffee is pulped in wet conditions, and then the coffee bean is dried until the moisture content is between 25% and 35%. Later, the coffee is hulled in wet conditions. After the hulling process, coffee is dried in the second stage until coffee moisture content is 10–12%.
2.1.3. The Functional Unit
2.2. The Calculation of Indicators
2.2.1. The Cumulative Energy Demand Analysis (CED)
2.2.2. Environmental Impact Assessment
2.2.3. Economic Performance Analysis
- Life cycle cost (LCC) analysis
- Value-added analysis (VA)
2.2.4. The Eco-Efficiency Analysis
3. Results
3.1. The Cumulative Energy Demand (CED) of Coffee Production
3.1.1. The Cumulative Energy Demand in Coffee Cultivation
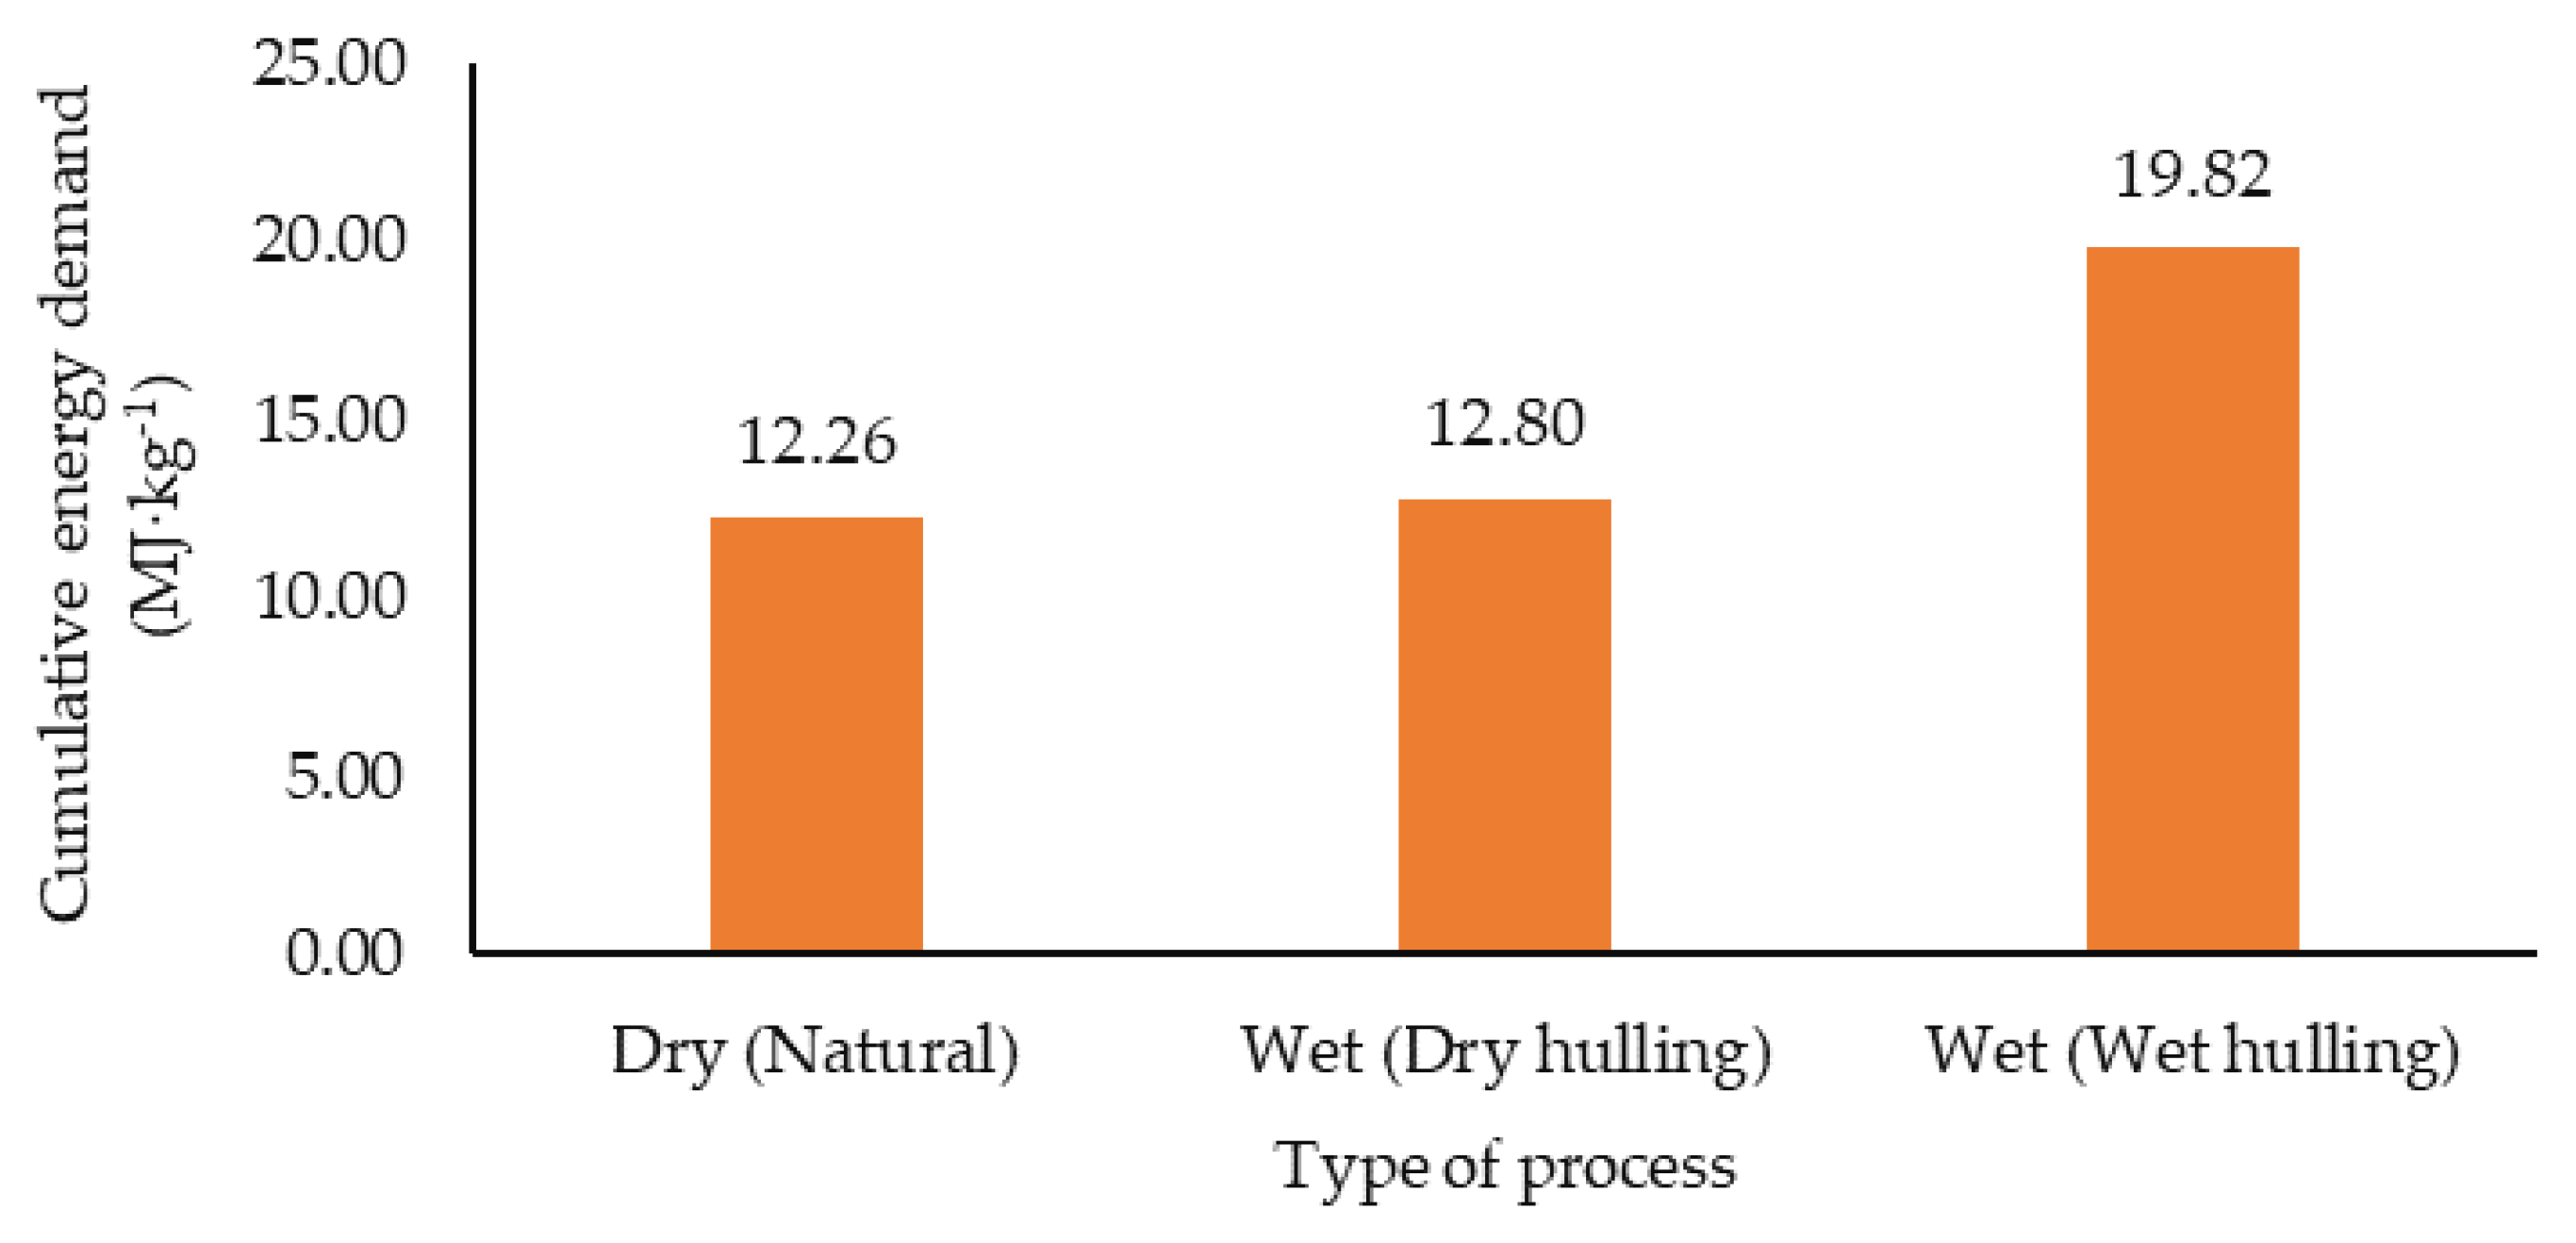
3.1.2. The Cumulative Energy Demand (CED) of the Coffee Post-Harvest Process
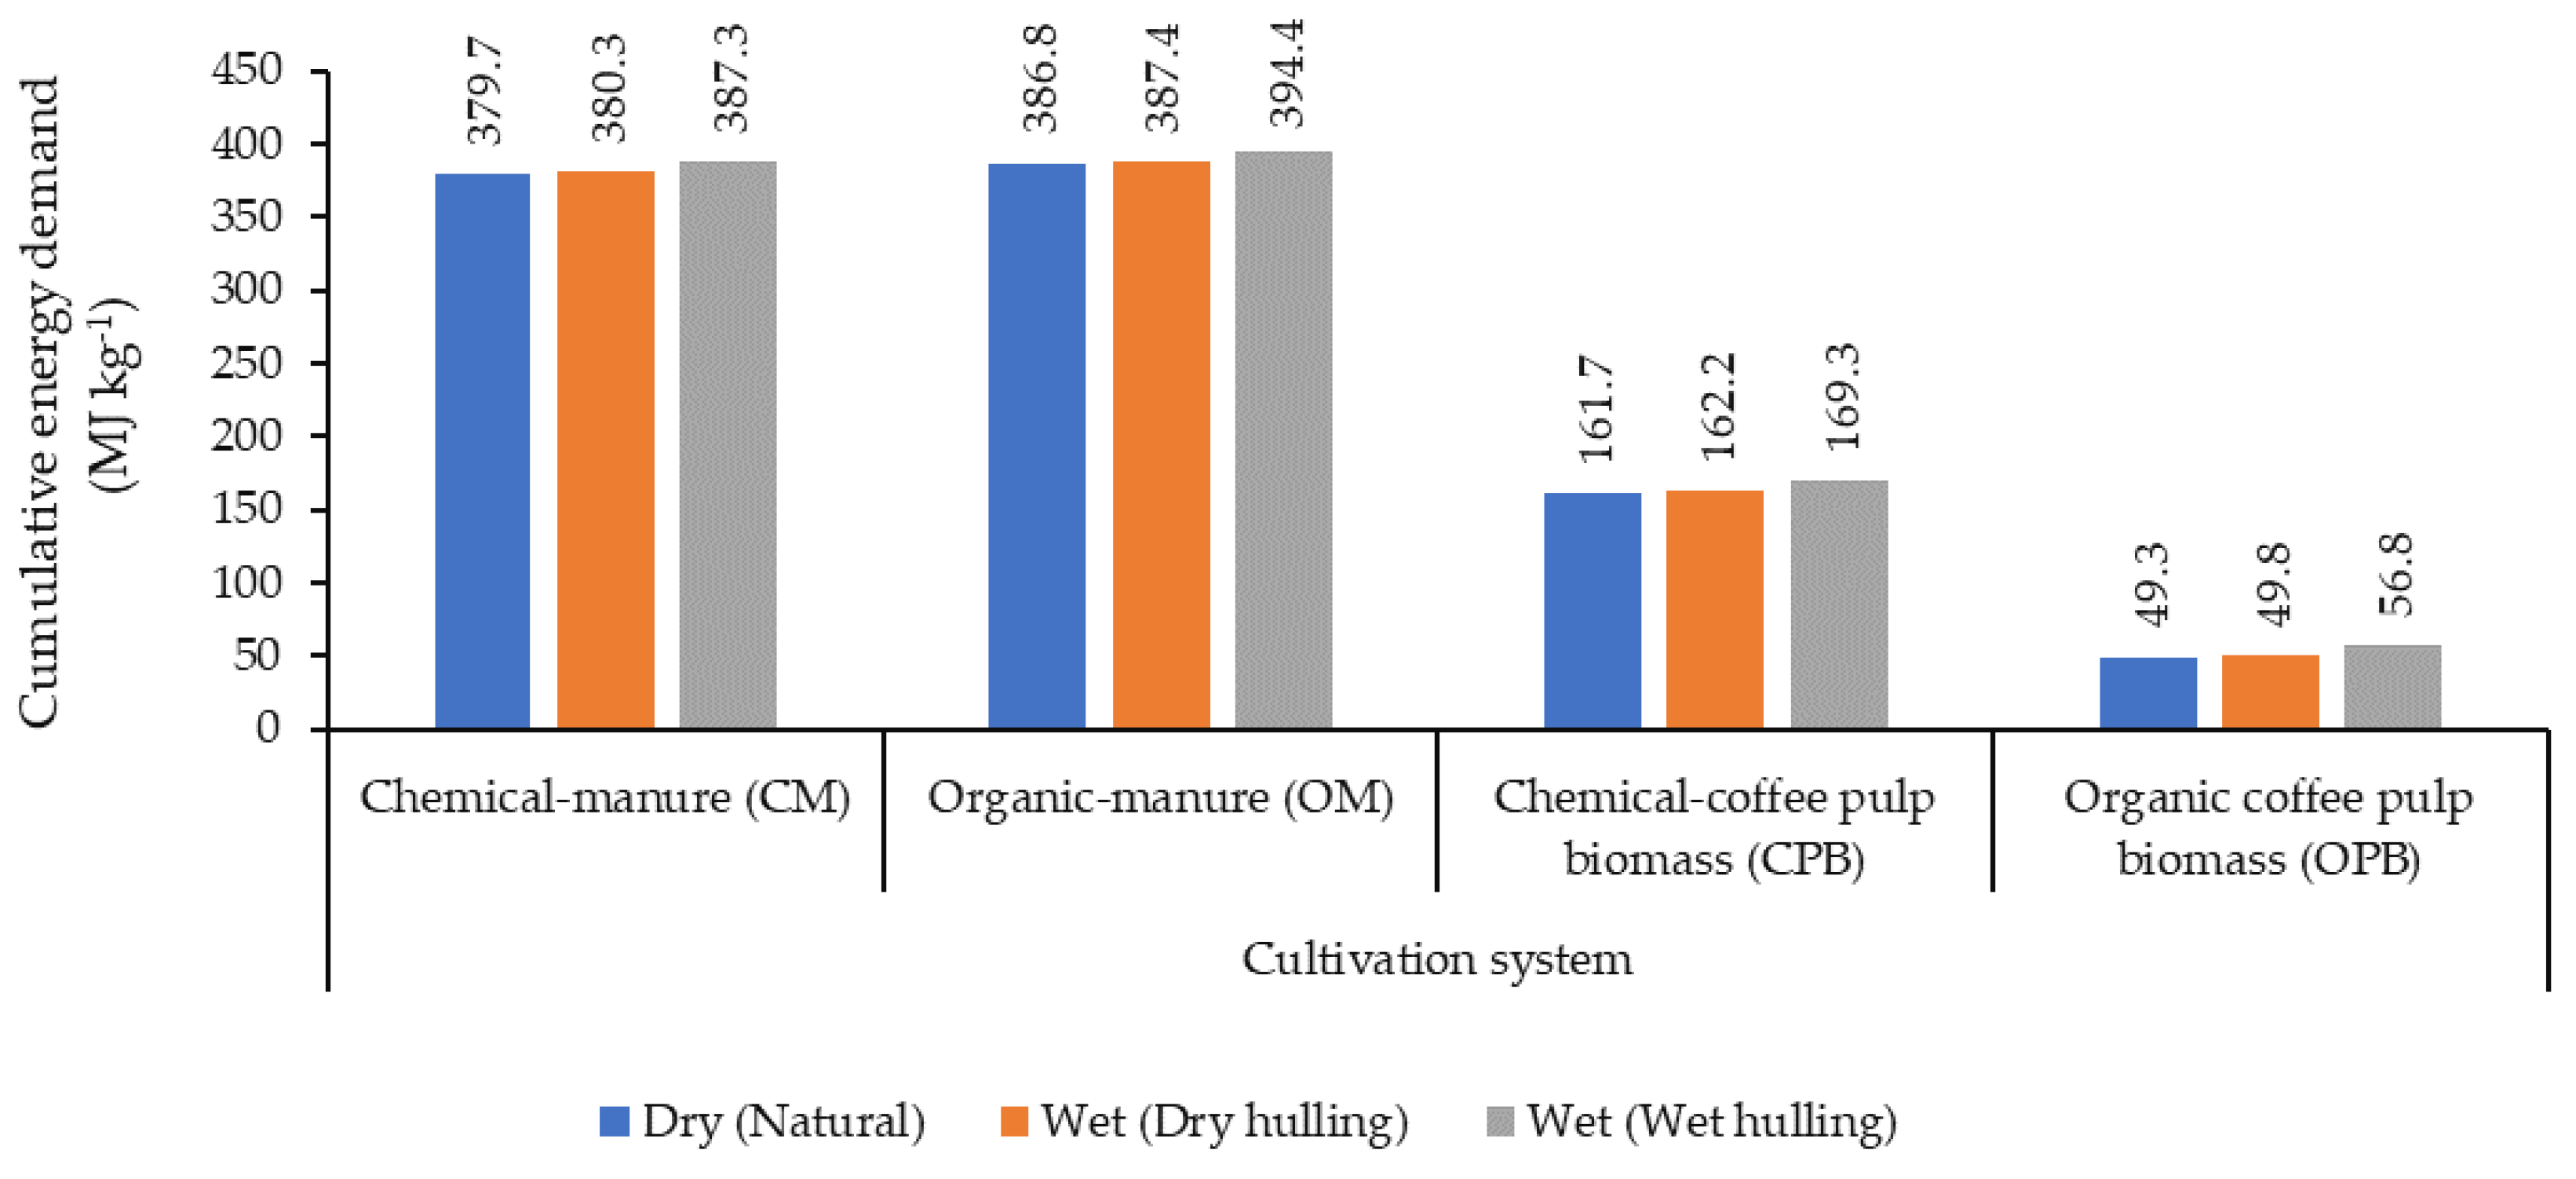
3.1.3. The Cumulative Energy Demand of the Coffee Life Cycle
3.2. Environmental Impact of Coffee Biomass Utilization
3.2.1. The Global Warming Potential in the Coffee Cultivation Stage
3.2.2. The Global Warming Potential in the Coffee Post-Harvest Process
3.2.3. Global Warming Potential in the Coffee Life Cycle
3.3. Economic Performance
3.3.1. Economic Performance in Coffee Cultivation
3.3.2. Economic Performance in the Coffee Post-Harvest Process
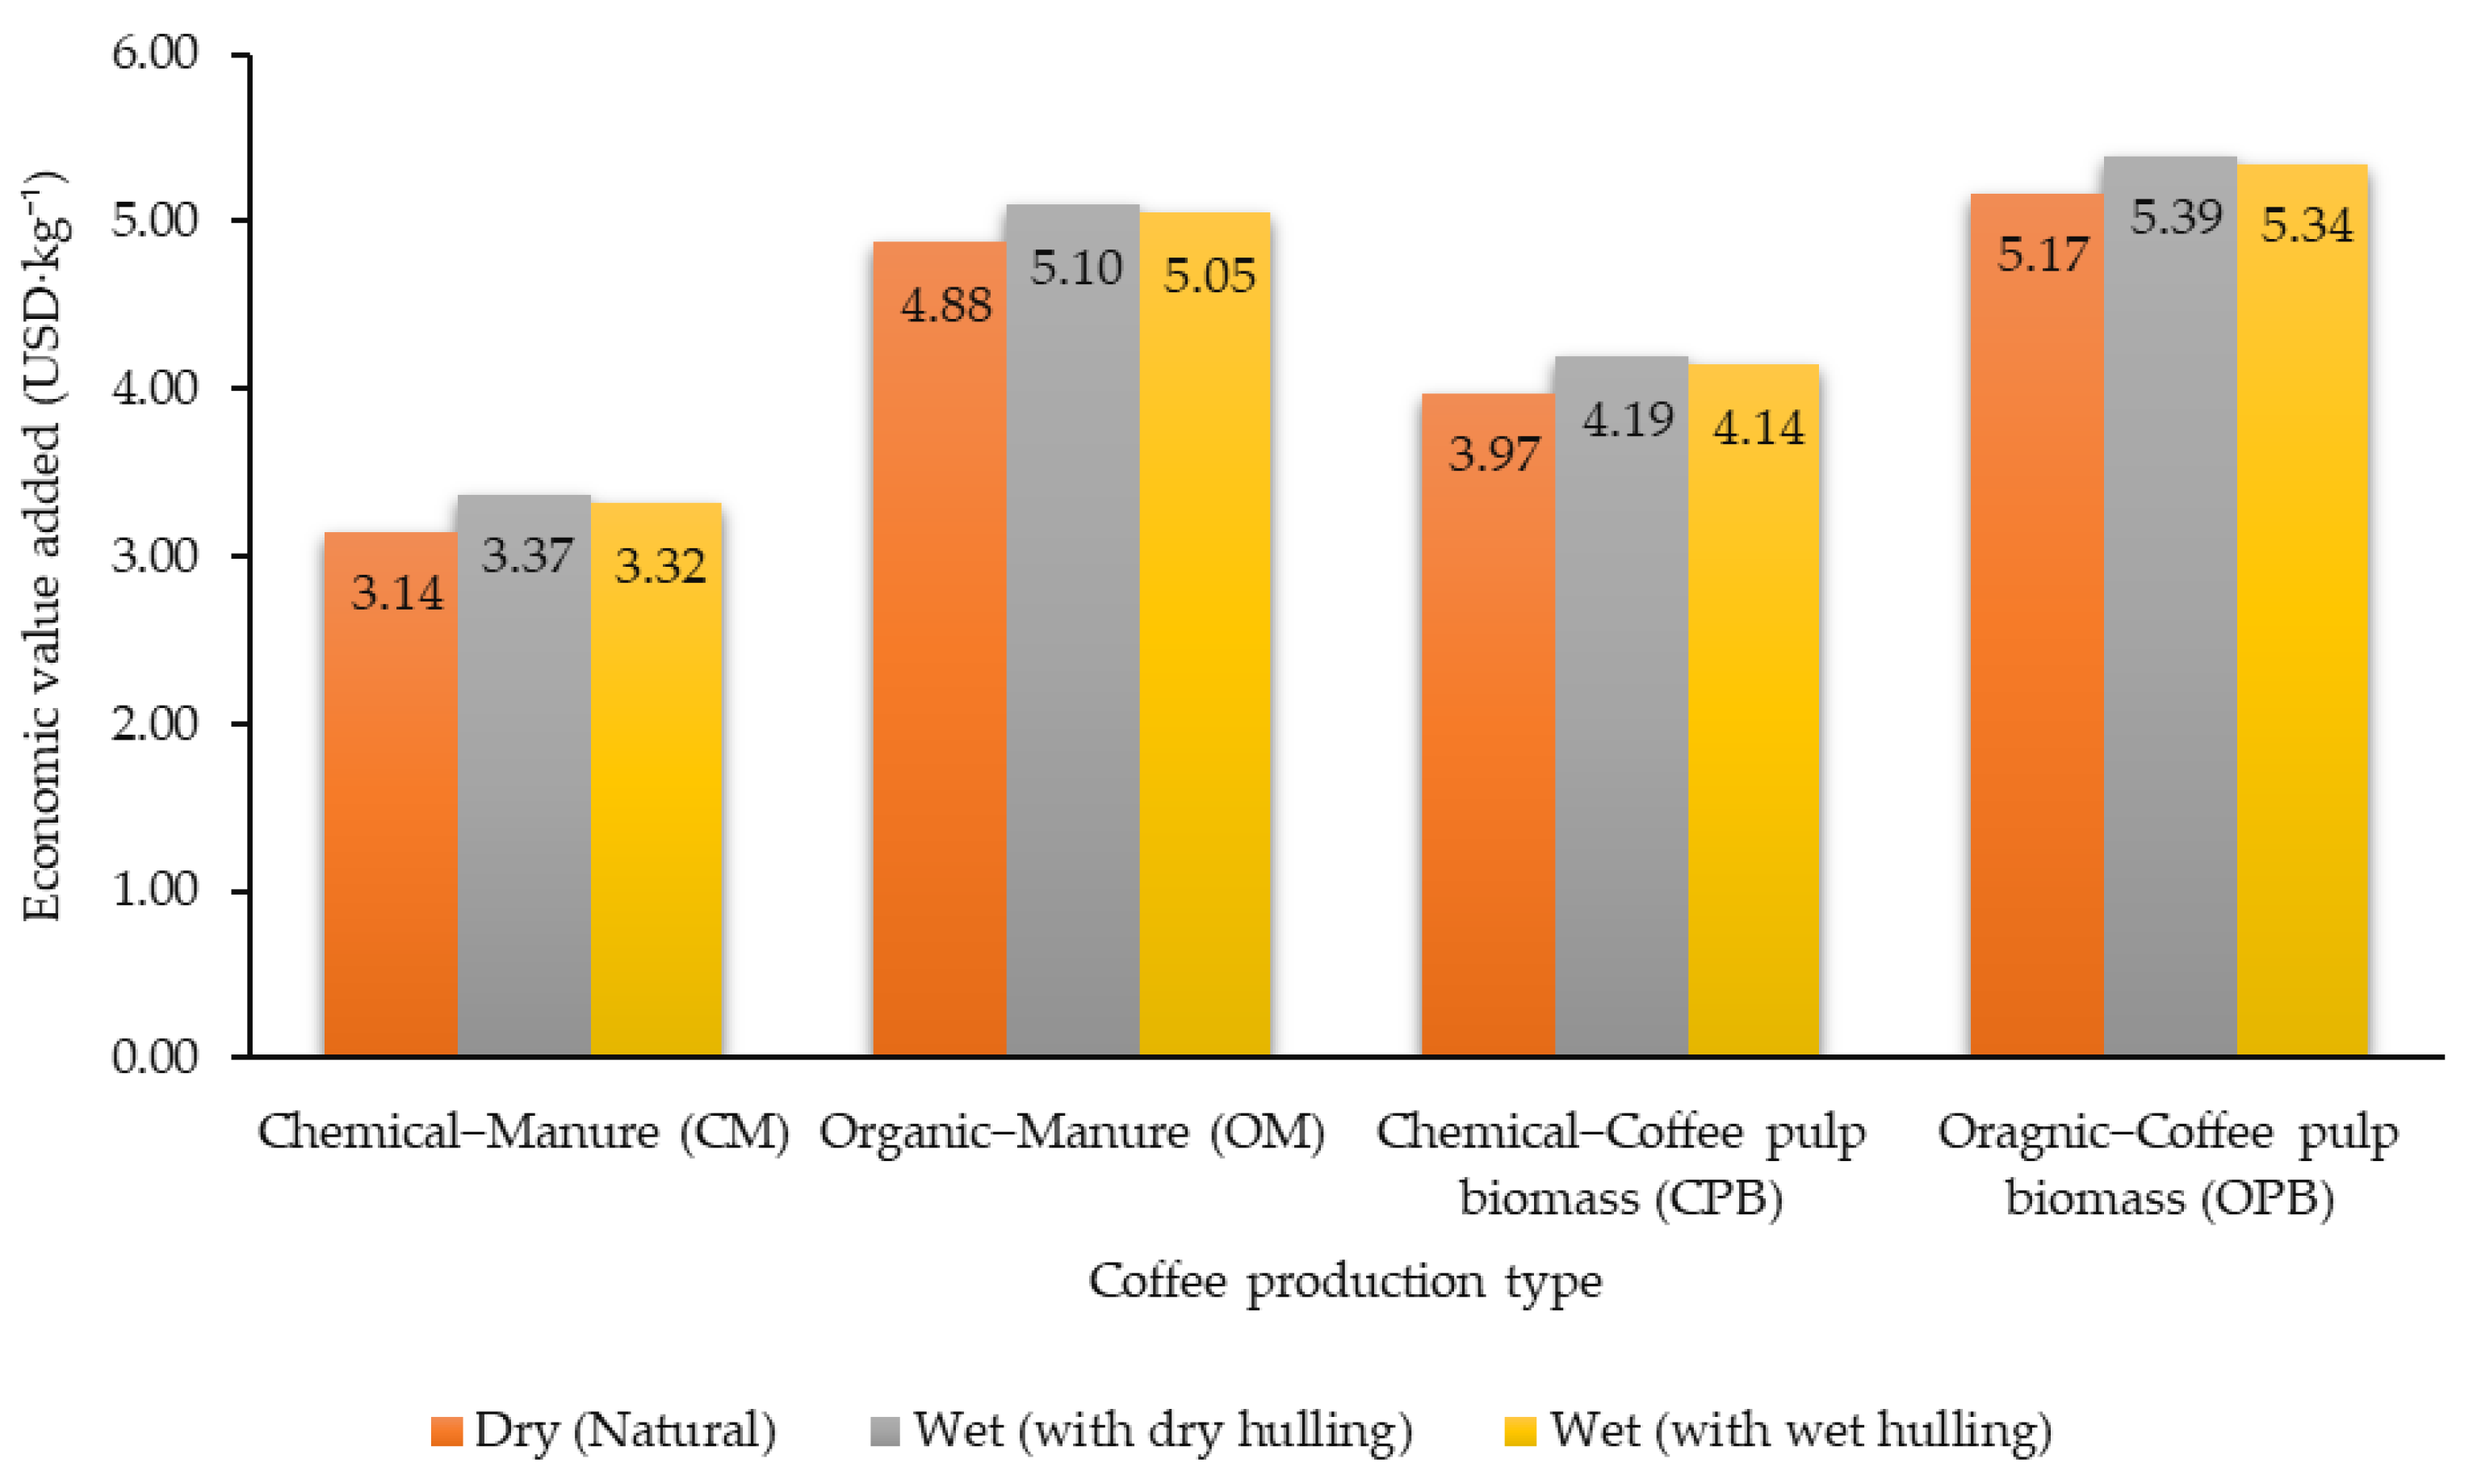
3.3.3. Economic Performance in Life Cycle Coffee Production Chain
3.4. Eco-Efficiency Analysis
4. Discussion
4.1. Coffee Pulp Biomass Utilization Impact on Energy Saving, CO2 Emission Reduction, and Economic Benefit Increases at the Farm Level
4.2. Coffee Pulp Biomass Utilization and the Potential Impact on CO2 Emission Reduction during the Distribution to Global Market
4.3. Coffee Pulp Biomass Utilization and Its Relationship on Promoting a Green-Lean (GM) Production toward the Circular Economy
5. Conclusions
Author Contributions
Funding
Data Availability Statement
Acknowledgments
Conflicts of Interest
Abbreviations
| CED | Cumulative energy demand |
| CM | Chemical manure cultivation system |
| CPB | Chemical coffee pulp cultivation system |
| CCu | Cost of cultivation process |
| Ccu.pr | Cost of cultivation or cost for post-harvest process |
| Chl | Cost of human labor |
| CMA | Cost of material input |
| CPA | Cost of packaging |
| Cpr | Cost of post-harvest process |
| CTD | Cost of transportation and distribution |
| E | Total energy requirement |
| Eel | Energy requirement for electricity |
| EELF | Energy factor for electricity |
| Efc | Energy requirement of chemical fertilizer |
| Efo | Energy requirement of organic fertilizer |
| EFel | Emission factor for electricity use |
| EFg | Emission factor for gasoline |
| EFo | Emission factor for organic fertilizer production |
| EFc | Emission factor of chemical fertilizer production |
| EFp | Emission factor for pesticide production |
| EFrh | Emission factor for rice husk |
| Eg | Energy requirement for gasoline |
| Egf | Energy factor of gasoline |
| Eh | Energy requirement for human labor |
| EHf | Energy factor of human labor |
| EI | Environmental impact |
| El | Electricity use |
| Erh | Energy requirement for rice husk |
| EP | Economic performance |
| Ep | Energy requirement for pesticide |
| EPf | Energy factor of pesticide |
| Ew | Energy requirement for water |
| Ffc | Energy factor of chemical fertilizer |
| Ffo | Energy factor of organic fertilizer |
| g | Gasoline consumption |
| GWP | Global warming potential |
| GWPel | Emission from electricity use |
| GWPg | Emission from gasoline use |
| GWP o | Emission prof organic fertilizer production |
| GWP c | Emission from chemical organic production |
| GWPp | Emission from pesticide production |
| GWPrh | Emission from rice husk |
| GWPn | Emission from N application to the field |
| h | Human labor |
| p | Pesticide utilization |
| w | Water consumption |
| WWf | Energy factor of water |
| GWP | Global warming potential |
| LCA | Life cycle assessment |
| LCC | Life cycle costing |
| LCCGCB | Life cycle cost of green coffee bean |
| LCI | Life cycle inventory |
| OM | Organic manure cultivation system |
| OPB | Organic coffee pulp cultivation system |
| rh | Rice husk utilization |
| TLCC | Total life cycle cost |
| SDGs | Sustainable development goals |
| VA | Value added |
| SDGs | Sustainable development goals |
Appendix A

| Items | Questions | Answer |
|---|---|---|
| General information | Location | …................ |
| Total cultivation area | …................ | |
| Production per hectare | …................ | |
| Period of life cycle of coffee tree | …................ | |
| Resources use during the life cycle coffee cultivation and post-harvest processing | Time period for each stage and process | …................ |
| Working days per stage | …................ | |
| Working hour per working day | …................ | |
| Labor involved | …................ | |
| Organic fertilizer application | …................ | |
| Chemical fertilizer application | …................ | |
| Pesticide, herbicide, fungicide application | …................ | |
| Frequency of fertilizer and pesticide application | …................ | |
| Additional fertilizer and material application | …................ | |
| Machine type used | …................ | |
| Gasoline/fuel consumption per process | …................ | |
| Machine capacity per process | …................ | |
| Water use per process | …................ | |
| Resources during distribution and transportation | Retailer destination | …................ |
| Distance | …................ | |
| Vehicle used | …................ | |
| Vehicle capacity load for per process | …................ | |
| Total product to be distributed to retailer | …................ | |
| Economic evaluation | Selling price of 1 kg of coffee green beans | …................ |
| Labor cost per day | …................ | |
| Fertilizer cost per kg | …................ | |
| Pesticide cost pe liter | …................ | |
| Gasoline cost per liter | …................ | |
| Domestic distribution cost | …................ | |
| Packaging cost | …................ |
| Cultivation Stages | Input–Output System | Unit | Chemical Manure (CM) | Organic Manure (OM) | Chemical Coffee Biomass (CPB) | Organic Coffee Biomass (OPB) | ||||||||
|---|---|---|---|---|---|---|---|---|---|---|---|---|---|---|
| Min | Max | Average | Min | Max | Average | Min | Max | Average | Min | Max | Average | |||
| Seeding and Nursery | Electricity | kWh | 0.012 | 11.280 | 0.350 | 0.009 | 0.023 | 0.013 | 0.086 | 0.086 | 0.086 | 0.086 | 0.086 | 0.086 |
| Labor transport | person·km | 20 | 70 | 385.4 | 0.4 | 90 | 75.4 | 432 | 228 | 330 | 6 | 114 | 432 | |
| Material transport | t·km | 0.4 | 10.5 | 2.1 | 5.8 | 180 | 43.1 | 5 | 10.5 | 7.8 | 5 | 10.5 | 7.8 | |
| Rice husk | kg | - | 1300 | 103.7 | - | 150 | 36.5 | - | - | - | - | - | - | |
| Seed | kg | 2 | 2 | 2.1 | 2 | 2 | 2 | 2 | 3 | 2.5 | 2 | 2 | 2 | |
| Water | L | 150 | 48,420 | 1662 | 120 | 300 | 167.1 | 1100 | 1100 | 1100 | 1100 | 1100 | 1100 | |
| Manure | kg | 100 | 2625 | 328.4 | 120 | 6000 | 2584 | 200 | 1000 | 600 | 300 | 1200 | 750 | |
| Coffee pulp | kg | |||||||||||||
| Labor | h | 114 | 720 | 385.4 | 12 | 420 | 167.6 | 432.0 | 228.0 | 330.0 | 100 | 432 | 215.3 | |
| Planting | Labor transport | person·km | 168 | 4560 | 658.7 | 10 | 243 | 79.4 | 31.5 | 30.0 | 30.8 | 45 | 52.5 | 105 |
| Material transport | t·km | 12.4 | 88 | 26.0 | 5.8 | 180 | 43.1 | 45 | 54 | 49.5 | 22 | 33 | 36.7 | |
| Manure | kg | 1000 | 20,000 | 4001 | 120 | 6000 | 2584 | 75 | 200 | 137.5 | 600 | 600 | 600 | |
| NPK | kg | - | 300 | 68.8 | - | - | - | 20 | 34 | 27 | - | - | - | |
| Urea | kg | - | 100 | 5.9 | - | - | - | - | - | - | - | - | - | |
| Pesticide | L | 6 | 7.5 | 6.6 | - | - | - | - | - | - | - | - | - | |
| Coffee pulp | kg | - | - | - | - | - | - | 990 | 220 | 605 | 900 | 2250 | 1575 | |
| Labor | h | 252 | 6840 | 990 | 48 | 1416 | 602.4 | - | - | - | - | - | - | |
| Maintenance | Labor transport | person·km | 288 | 1200 | 541.5 | 144 | 5124 | 1737 | 400 | 460 | 430 | 564 | 840 | 2376 |
| Material transport | t·km | 1622 | 27,984 | 6432 | - | 1280 | 277.8 | 144 | 207 | 175.5 | 46.6 | 104 | 228.8 | |
| Manure | kg | 7000 | 270,000 | 45,930 | 5000 | 320,000 | 69,859 | 37,800 | 47,250 | 42,525 | 2100 | 21,000 | 21,000 | |
| NPK | kg | 726.0 | 26,490 | 4299.2 | - | - | - | 1134 | 1134 | 1134 | - | - | - | |
| Urea | kg | - | 3000 | 362.6 | - | - | - | - | - | - | - | - | - | |
| Pesticide | L | - | 120 | 24.1 | - | - | - | - | - | - | - | - | - | |
| Coffee pulp | kg | - | - | - | - | - | - | 24,000 | 42,750 | 33,375 | 30,240 | 58,800 | 40,897 | |
| Labor | h | 900 | 6552 | 2194.2 | 107.5 | 959 | 480 | 140 | 161.0 | 150.5 | 142.0 | 634.0 | 327.7 | |
| Harvesting | Labor transport | person·km | 864 | 6720 | 2658 | 432.0 | 4992 | 2058 | 4872 | 6496 | 5684 | 41,000 | 60,500 | 54,167 |
| Material transport | t·km | 33 | 425 | 117.2 | 34.1 | 328 | 120.9 | 256 | 416 | 336 | 3272 | 6096 | 5299 | |
| Labor | h | 1296 | 10,080 | 4014 | 432.0 | 4992 | 2107 | 4872 | 6496 | 5684 | 1952.4 | 2881 | 2579 | |
| Total production | kg | 8250 | 100,150 | 27,638 | 8520 | 80,500 | 28,078 | 61,000 | 101,000 | 81,000 | 41,000 | 60,500 | 54,167 | |
| Average harvesting | Kg·y−1 | 1065 | 9104.5 | 2917.7 | 1065 | 7318 | 2593 | 2904.8 | 4809.5 | 3857.1 | 1952.4 | 2881 | 2579 | |
| Input | Unit | Post-Harvest Process | ||
|---|---|---|---|---|
| Dry Process (Natural) | Wet Process (Dry Hulling) | Wet Process (Wet Hulling) | ||
| Human labor | h | 354 | 237 | 261 |
| Water | L | 1000 | 1000 | 2000 |
| Electricity | kWh | 2.24 | 11.09 | 11.58 |
| gasoline | L | 3 | 9 | 9 |
| Plastic bag | kg | 0.3 | 0.3 | 0.3 |
| Input System | Unit | Energy Conversion Factor (MJ·Unit−1) | References | |
|---|---|---|---|---|
| Gasoline | L | 34.2 | [38] | |
| Electricity | kWh | 11.93 | [39] | |
| Human labor | h | 1.96 | [40,41] | |
| Pesticide | L | 278 | [41] | |
| NPK | Nitrogen | kg | 64.4 | [42] |
| Phosphorus | kg | 12.44 | [43,44] | |
| Potassium | kg | 11.15 | [43,44] | |
| Compost | kg | 6 | [45] | |
| Poultry manure | kg | 1.32 | [46,47,48] | |
| Water | L | 1 | [44,48] | |
| Rice husk | kg | 14.6 | [48] | |
| Plastic bag | pc | 0.508 | [49] | |
| Input Items | Unit | Conversion | Post-Harvest Process | ||
|---|---|---|---|---|---|
| Dry (Natural) | Wet (with dry Hulling) | Wet (with wet Hulling) | |||
| Human | h | 1.96 | 693.8 | 464.5 | 511.6 |
| Water | L | 1 | 1000 | 1000 | 2000 |
| Electricity | kWh | 11.93 | 26.7 | 132.3 | 138.2 |
| Gasoline | L | 34.2 | 102.6 | 307.8 | 307.8 |
| Plastic bag | kg | 0.508 | 15.2 | 15.2 | 15.2 |
| Impact | Unit | Cultivation System | |
|---|---|---|---|
| Non-Organic (CPB) | Organic (OPB) | ||
| Energy saving | MJ·kg−1 | 218.04 | 337.54 |
| CO2 emission reduction | kg CO2 eq·kg−1 | 1.07 | 0.19 |
| Value added increased | USD·kg−1 | 0.83 | 0.29 |
References
- Kurdve, M.; Bellgran, M. Green lean operationalisation of the circular economy concept on production shop floor level. J. Clean. Prod. 2021, 278, 123223. [Google Scholar] [CrossRef]
- Data Information Center of Agriculture Ministry of Indonesia. Coffee Outlook Indonesia; Data Information Center, Agriculture Ministry of Indonesia: Jakarta, Indonesia, 2020.
- Spångberg, J.; Hansson, P.A.; Tidåker, P.; Jönsson, H. Environmental impact of meat meal fertilizer vs. chemical fertilizer. Resour. Conserv. Recycl. 2011, 55, 1078–1086. [Google Scholar] [CrossRef]
- Usva, K.; Sinkko, T.; Silvenius, F.; Riipi, I.; Heusala, H. Carbon and water footprint of coffee consumed in Finland—Life cycle assessment. Int. J. Life Cycle Assess. 2020, 25, 1976–1990. [Google Scholar] [CrossRef]
- Rahmah, D.M.; Putra, A.S.; Ishizaki, R.; Noguchi, R.; Ahamed, T. A Life Cycle Assessment of Organic and Chemical Fertilizers for Coffee Production to Evaluate Sustainability toward the Energy–Environment–Economic Nexus in Indonesia. Sustainability 2022, 14, 3912. [Google Scholar] [CrossRef]
- Wang, C.; Malik, A.; Wang, Y.; Chang, Y.; Lenzen, M.; Zhou, D.; Pang, M.; Huang, Q. The social, economic, and environmental implications of biomass ethanol production in China: A multi-regional input-output-based hybrid LCA model. J. Clean. Prod. 2020, 249, 119326. [Google Scholar] [CrossRef]
- Catalán, E.; Komilis, D.; Sánchez, A. Environmental impact of cellulase production from coffee husks by solid-state fermentation: A life-cycle assessment. J. Clean. Prod. 2019, 233, 954–962. [Google Scholar] [CrossRef]
- Saccani, N.; Bressanelli, G.; Visintin, F. Circular supply chain orchestration to overcome Circular Economy challenges: An empirical investigation in the textile and fashion industries. Sustain. Prod. Consum. 2023, 35, 469–482. [Google Scholar] [CrossRef]
- Coltro, L.; Mourad, A.L.; Oliveira, P.A.P.L.V.; Baddini, J.P.O.A.; Kletecke, R.M. Environmental profile of Brazilian green coffee. Int. J. Life Cycle Assess. 2006, 11, 16–21. [Google Scholar] [CrossRef]
- Hassard, H.A.; Couch, M.H.; Techa-Erawan, T.; Mclellan, B.C. Product carbon footprint and energy analysis of alternative coffee products in Japan. J. Clean. Prod. 2014, 73, 310–321. [Google Scholar] [CrossRef] [Green Version]
- Neilson, J. Global Private Regulation and Value-Chain Restructuring in Indonesian Smallholder Coffee Systems. World Dev. 2008, 36, 1607–1622. [Google Scholar] [CrossRef]
- Noponen, M.R.A.; Edwards-Jones, G.; Haggar, J.P.; Soto, G.; Attarzadeh, N.; Healey, J.R. Greenhouse gas emissions in coffee grown with differing input levels under conventional and organic management. Agric. Ecosyst. Environ. 2012, 151, 6–15. [Google Scholar] [CrossRef] [Green Version]
- Halog, A.; Manik, Y. Life Cycle Sustainability Assessments. Encycl. Inorg. Bioinorg. Chem. 2016, 1–17. [Google Scholar] [CrossRef]
- Pishgar-Komleh, S.H.; Akram, A.; Keyhani, A.; Sefeedpari, P.; Shine, P.; Brandao, M. Integration of life cycle assessment, artificial neural networks, and metaheuristic optimization algorithms for optimization of tomato-based cropping systems in Iran. Int. J. Life Cycle Assess. 2020, 25, 620–632. [Google Scholar] [CrossRef]
- Basavalingaiah, K.; Paramesh, V.; Parajuli, R.; Girisha, H.C.; Shivaprasad, M.; Vidyashree, G.V.; Thoma, G.; Hanumanthappa, M.; Yogesh, G.S.; Dhar, S.; et al. Energy flow and life cycle impact assessment of coffee-pepper production systems: An evaluation of conventional, integrated and organic farms in India. Environ. Impact Assess. Rev. 2022, 92, 106687. [Google Scholar] [CrossRef]
- Mantoam, E.J.; Angnes, G.; Mekonnen, M.M.; Romanelli, T.L. ScienceDirect Energy, carbon and water footprints on agricultural machinery. Biosyst. Eng. 2020, 8, 304–322. [Google Scholar] [CrossRef]
- Nabavi-Pelesaraei, A.; Hosseinzadeh-Bandbafha, H.; Qasemi-Kordkheili, P.; Kouchaki-Penchah, H.; Riahi-Dorcheh, F. Applying optimization techniques to improve of energy efficiency and GHG (greenhouse gas) emissions of wheat production. Energy 2016, 103, 672–678. [Google Scholar] [CrossRef]
- Pimentel, D.; Burgess, M. An environmental, energetic and economic comparison of organic and conventional farming systems. Integr. Pest Manag. Pestic. Probl. 2014, 3, 141–166. [Google Scholar] [CrossRef]
- Nagapurkar, P.; Smith, J.D. Techno-economic optimization and environmental Life Cycle Assessment (LCA) of microgrids located in the US using genetic algorithm. Energy Convers. Manag. 2019, 2019181, 272–291. [Google Scholar] [CrossRef]
- Wang, Z.; Lv, J.; Gu, F.; Yang, J.; Guo, J. Environmental and economic performance of an integrated municipal solid waste treatment: A Chinese case study. Sci. Total Environ. 2020, 709, 136096. [Google Scholar] [CrossRef]
- Aristizábal-Marulanda, V.; Solarte-Toro, J.C.; Cardona Alzate, C.A. Study of biorefineries based on experimental data: Production of bioethanol, biogas, syngas, and electricity using coffee-cut stems as raw material. Environ. Sci. Pollut. Res. 2020, 28, 24590–24604. [Google Scholar] [CrossRef]
- Aristizábal-Marulanda, V.; García-Velásquez, C.A.; Cardona, C.A. Environmental assessment of energy-driven biorefineries: The case of the Coffee Cut-Stems (CCS) in Colombia. Int. J. Life Cycle Assess. 2021, 26, 290–310. [Google Scholar] [CrossRef]
- Von Geibler, J.; Cordaro, F.; Kennedy, K.; Lettenmeier, M.; Roche, B. Integrating resource efficiency in business strategies: A mixed-method approach for environmental life cycle assessment in the single-serve coffee value chain. J. Clean. Prod. 2016, 115, 62–74. [Google Scholar] [CrossRef] [Green Version]
- Taboada-gonz, P.; Hern, M.T.; Velarde-s, M.; Liliana, M. Environmental impacts of a Mexican hemodialysis unit through LCA. J. Clean. Prod. 2023, 384, 135480. [Google Scholar]
- Sajawal, M.; Khan, H.; Liu, J.J.; Na, J. Green hydrogen and sustainable development–A social LCA perspective highlighting social hotspots and geopolitical implications of the future hydrogen economy. J. Clean. Prod. 2023, 395, 136438. [Google Scholar]
- Abbas, A.; Zhao, C.; Waseem, M.; Ahmad, R. Analysis of Energy Input–Output of Farms and Assessment of Greenhouse Gas Emissions: A Case Study of Cotton Growers. Front. Environ. Sci. 2022, 9, 1–11. [Google Scholar] [CrossRef]
- Avadí, A.; Marcin, M.; Biard, Y.; Renou, A.; Gourlot, J.P.; Basset-Mens, C. Life cycle assessment of organic and conventional non-Bt cotton products from Mali. Int. J. Life Cycle Assess. 2020, 25, 678–697. [Google Scholar] [CrossRef]
- Cellura, M.; Ardente, F.; Longo, S. From the LCA of food products to the environmental assessment of protected crops districts: A case-study in the south of Italy. J. Environ. Manage. 2012, 93, 194–208. [Google Scholar] [CrossRef]
- Humbert, S.; Loerincik, Y.; Rossi, V.; Margni, M.; Jolliet, O. Life cycle assessment of spray dried soluble coffee and comparison with alternatives (drip filter and capsule espresso). J. Clean. Prod. 2009, 17, 1351–1358. [Google Scholar] [CrossRef]
- McAuliffe, G.A.; Takahashi, T.; Lee, M.R.F. Applications of nutritional functional units in commodity-level life cycle assessment (LCA) of agri-food systems. Int. J. Life Cycle Assess. 2020, 25, 208–221. [Google Scholar] [CrossRef] [Green Version]
- Pashaei Kamali, F.; van der Linden, A.; Meuwissen, M.P.M.; Malafaia, G.C.; Oude Lansink, A.G.J.M.; de Boer, I.J.M. Environmental and economic performance of beef farming systems with different feeding strategies in southern Brazil. Agric. Syst. 2016, 146, 70–79. [Google Scholar] [CrossRef]
- Pergola, M.; Persiani, A.; Pastore, V.; Palese, A.M.; Arous, A.; Celano, G. A comprehensive Life Cycle Assessment (LCA) of three apricot orchard systems located in Metapontino area (Southern Italy). J. Clean. Prod. 2017, 142, 4059–4071. [Google Scholar] [CrossRef]
- Quispe, I.; Navia, R.; Kahhat, R. Life Cycle Assessment of rice husk as an energy source. A Peruvian case study. J. Clean. Prod. 2019, 209, 1235–1244. [Google Scholar] [CrossRef]
- Huppes, G.; Ishikawa, M. Eco-efficiency and Its. J. Ind. Ecol. 2005, 9, 43–46. [Google Scholar] [CrossRef]
- Konstantas, A.; Stamford, L.; Azapagic, A. A framework for evaluating life cycle eco-efficiency and an application in the confectionary and frozen-desserts sectors. Sustain. Prod. Consum. 2020, 21, 192–203. [Google Scholar] [CrossRef]
- Martinelli, G.; Vogel, E.; Decian, M.; Farinha, M.J.U.S.; Bernardo, L.V.M.; Borges, J.A.R.; Gimenes, R.M.T.; Garcia, R.G.; Ruviaro, C.F. Assessing the eco-efficiency of different poultry production systems: An approach using life cycle assessment and economic value added. Sustain. Prod. Consum. 2020, 24, 181–193. [Google Scholar] [CrossRef]
- Valente, C.; Møller, H.; Johnsen, F.M.; Saxegård, S.; Brunsdon, E.R.; Alvseike, O.A. Life cycle sustainability assessment of a novel slaughter concept. J. Clean. Prod. 2020, 272, 122651. [Google Scholar] [CrossRef]
- IOR Energy Pty Ltd.-University of California, Berkeley. List of Common Conversion Factor. List of Common Conversion Factors (Engineering Conversion Factors)–IOR Energy Pty Ltd. (berkeley.edu) 2020. URL List of Common Conversion Factors (Engineering Conversion Factors)–IOR Energy Pty Ltd. (berkeley.edu). Available online: https://w.astro.berkeley.edu/~wright/fuel_energy.html (accessed on 25 December 2020).
- Kaab, A.; Sharifi, M.; Mobli, H.; Nabavi-Pelesaraei, A.; Chau, K.W. Use of optimization techniques for energy use efficiency and environmental life cycle assessment modification in sugarcane production. Energy 2019, 181, 1298–1320. [Google Scholar] [CrossRef]
- Hosseinzadeh-Bandbafha, H.; Safarzadeh, D.; Ahmadi, E.; Nabavi-Pelesaraei, A.; Hosseinzadeh-Bandbafha, E. Applying data envelopment analysis to evaluation of energy efficiency and decreasing of greenhouse gas emissions of fattening farms. Energy 2017, 120, 652–662. [Google Scholar] [CrossRef]
- Unakitan, G.; Hurma, H.; Yilmaz, F. An analysis of energy use efficiency of canola production in Turkey. Energy 2010, 35, 3623–3627. [Google Scholar] [CrossRef]
- Ozkan, B.; Akcaoz, H.; Fert, C. Energy input-output analysis in Turkish agriculture. Renew. Energy 2004, 29, 39–51. [Google Scholar] [CrossRef]
- Mousavi-Avval, S.H.; Rafiee, S.; Sharifi, M.; Hosseinpour, S.; Notarnicola, B.; Tassielli, G.; Renzulli, P.A. Application of multi-objective genetic algorithms for optimization of energy, economics and environmental life cycle assessment in oilseed production. J. Clean. Prod. 2017, 140, 804–815. [Google Scholar] [CrossRef]
- Rafiee, S.; Mousavi Avval, S.H.; Mohammadi, A. Modeling and sensitivity analysis of energy inputs for apple production in Iran. Energy 2010, 35, 3301–3306. [Google Scholar] [CrossRef]
- Antizar-Ladislao, B.; Irvine, G.; Lamont, E.R. Energy from waste: Reuse of compost heat as a source of renewable energy. Int. J. Chem. Eng. 2010. [CrossRef] [Green Version]
- McLaughlin, N.B. Comparison of energy inputs for inorganic fertilizer and manure based corn production. Can. Biosyst. Eng.Le Genie Des Biosyst. Au Can. 2000, 42, 9–17. [Google Scholar]
- Neira, D.P.; Montiel, M.S.; Fernández, X.S. Energy analysis of organic farming in Andalusia (Spain). Agroecol. Sustain. Food Syst. 2013, 37, 231–256. [Google Scholar] [CrossRef]
- Zea, P.; Chilpe, J.; Sánchez, D.; Chica, E.J. Energy efficiency of smallholder commercial vegetable farms in Cuenca (Ecuador). Trop. Subtrop. Agroecosystems 2020, 23, 1–8. [Google Scholar]
- Columbia Climate School. Sustainability" Plastic, Paper or Cotton: Which Shopping Bag is Best?" From The series Sustainability Living; Columbia Climate School: New York, NY, USA, 2020; Available online: https://news.climate.columbia.edu/2020/04/30/plastic-paper-cotton-bags/ (accessed on 30 January 2023).
- Kuhlmann, H.; Lammel, J. Application of the Life Cycle Assessment methodology to agricultural production: An example of sugar beet production with different forms of nitrogen fertilisers. Eur. J. Agron. 2021, 14, 221–233. [Google Scholar]
- Swarr, T.E.; Hunkeler, D.; Klöpffer, W.; Pesonen, H.L.; Ciroth, A.; Brent, A.C.; Pagan, R. Environmental life-cycle costing: A code of practice. Int. J. Life Cycle Assess. 2011, 16, 389–391. [Google Scholar] [CrossRef] [Green Version]
- Kizilaslan, H. Input-output energy analysis of cherries production in Tokat Province of Turkey. Appl. Energy 2009, 86, 1354–1358. [Google Scholar] [CrossRef]
- Guo, M.; Murphy, R.J. LCA data quality: Sensitivity and uncertainty analysis. Sci. Total Environ. 2012, 435–436, 230–243. [Google Scholar] [CrossRef]
- Lim, M.K.; Lai, M.; Wang, C.; Lee, S.Y. Circular economy to ensure production operational sustainability: A green-lean approach. Sustain. Prod. Consum. 2022, 30, 130–144. [Google Scholar] [CrossRef]
- Sagnak, M.; Kazancoglu, Y. Integration of green lean approach with six sigma: An application for flue gas emissions. J. Clean. Prod. 2016, 127, 112–118. [Google Scholar] [CrossRef]
- Cai, W.; Lai K hung Liu, C.; Wei, F.; Ma, M.; Jia, S.; Jiang, Z.; Lv, L. Promoting sustainability of manufacturing industry through the lean energy-saving and emission-reduction strategy. Sci. Total Environ. 2019, 665, 23–32. [Google Scholar] [CrossRef] [PubMed]
| Category | Unit | Cumulative Energy Demand (CED) | |||
|---|---|---|---|---|---|
| Chemical Manure (CM) | Organic Manure (OM) | Chemical Coffee Pulp Biomass (CPB) | Organic Coffee Pulp Biomass (OPB) | ||
| Per hectare | MJ ha−1 | 142,395.60 | 118,907.92 | 86,463.19 | 14,321.39 |
| Per kilogram of coffee cherry beans | MJ kg−1 | 55.12 | 56.18 | 22.42 | 5.55 |
| Per kilogram coffee green beans (6.6. kg cherry) | MJ kg−1 | 363.79 | 370.78 | 147.97 | 36.63 |
| Stages | Categories | Unit | Scenario | ||||
|---|---|---|---|---|---|---|---|
| Chemical Manure (CM) | Organic Manure (OM) | Chemical Coffee Pulp (CPB) | Organic Coffee Pulp (OPB) | ||||
| Cultivation | Per hectare | kg CO2-eq ha−1 | 6906 | 2705 | 4725 | 1627 | |
| Per kg of cherry beans | kg CO2-eq kg−1 | 0.24 | 0.096 | 0.058 | 0.03 | ||
| Per 6.6 kg of cherry beans to produce 1 kg of green beans | kg CO2-eq kg−1 | 1.584 | 0.6336 | 0.3828 | 0.198 | ||
| Post-harvest process | Categories | Unit | Dry Process | Wet Process with Wet Hulling | Wet Process with Dry Hulling | ||
| Per ton of cherry beans | kg CO2-eq t−1 | 10.2 | 36 | 36.45 | |||
| Per kg of green coffee beans | kg CO2-eq kg−1 | 0.068 | 0.24 | 0.243 | |||
| Cumulative | Categories | Scenario | unit | Dry Process | Wet Process with Wet Hulling | Wet Process with Dry Hulling | |
| Per 1 kg of green coffee beans | CM | kg CO2-eq kg−1 | 1.652 | 1.824 | 1.827 | ||
| OM | kg CO2-eq kg−1 | 0.7016 | 0.8736 | 0.8766 | |||
| CPB | kg CO2-eq kg−1 | 0.4508 | 0.6228 | 0.6258 | |||
| OPB | kg CO2-eq kg−1 | 0.266 | 0.438 | 0.441 | |||
| Process | Unit | Total CO2 Emission | Contribution Factor | ||
|---|---|---|---|---|---|
| Gasoline | Packaging Bag | Electricity | |||
| Wet (Wet hulling) | kg CO2 eq | 0.2428 | 0.1531 | 0.0002 | 0.0895 |
| % | 63.0597 | 0.0896 | 36.8507 | ||
| Wet (Dry hulling) | kg CO2 eq | 0.2395 | 0.1531 | 0.0007 | 0.0857 |
| % | 63.9279 | 0.2947 | 35.7773 | ||
| Dry Process | kg CO2 eq | 0.0686 | 0.0510 | 0.0002 | 0.0173 |
| % | 74.4388 | 0.3174 | 25.2438 | ||
| Economic Performance Indicators | Categories | Unit | Cultivation Systems | |||
|---|---|---|---|---|---|---|
| Chemical Manure (CM) | Organic Manure (OM) | Chemical Coffee Pulp (CPB) | Organic Coffee Pulp (OPB) | |||
| Life Cycle Cost | Per hectare coffee production | USD | 3955.48 | 2175.03 | 3543.23 | 2857.18 |
| Per kg cherry bean | USD | 0.17 | 0.1 | 0.04 | 0.05 | |
| Per kg green coffee bean | USD | 1.11 | 0.64 | 0.29 | 0.35 | |
| Revenue | Per hectare | USD | 11,117 | 12,016 | 38,427 | 29,124 |
| Value Added | Per hectare coffee production | USD | 7161 | 9841 | 34,884 | 26,267 |
| Per kg coffee cherry bean | USD | 0.31 | 0.44 | 0.43 | 0.48 | |
| Per kg coffee green bean | USD | 2.02 | 2.91 | 2.84 | 3.2 | |
| Economic Performance Indicator | Category | Unit | Post-Harvest Process | ||
|---|---|---|---|---|---|
| Dry (Natural) | Wet (with Dry Hulling) | Wet (with Wet Hulling) | |||
| Life Cycle Cost | Organic (OM, OPB) | USD kg−1 | 3.93 | 3.71 | 3.76 |
| Non-Organic (CM, CPB) | USD kg−1 | 4.35 | 4.13 | 4.18 | |
| Value added | Organic (OM, OPB) | USD kg−1 | 1.97 | 2.19 | 2.14 |
| Non-Organic (CM, CPB) | USD kg−1 | 1.13 | 1.35 | 1.3 | |
| Post-Harvest Processing | Unit | Cultivation System | |||
|---|---|---|---|---|---|
| Chemical Manure (CM) | Organic Manure (OM) | Chemical Coffee Pulp Biomass (CPB) | Organic Coffee Pulp Biomass (OPB) | ||
| Dry (natural) | kg CO₂ eq·USD−1 | 1.462 | 0.356 | 0.399 | 0.135 |
| Wet (with dry hulling) | kg CO₂ eq·USD−1 | 1.353 | 0.400 | 0.464 | 0.201 |
| Wet (with wet hulling) | kg CO₂ eq·USD−1 | 1.462 | 0.408 | 0.509 | 0.204 |
Disclaimer/Publisher’s Note: The statements, opinions and data contained in all publications are solely those of the individual author(s) and contributor(s) and not of MDPI and/or the editor(s). MDPI and/or the editor(s) disclaim responsibility for any injury to people or property resulting from any ideas, methods, instructions or products referred to in the content. |
© 2023 by the authors. Licensee MDPI, Basel, Switzerland. This article is an open access article distributed under the terms and conditions of the Creative Commons Attribution (CC BY) license (https://creativecommons.org/licenses/by/4.0/).
Share and Cite
Rahmah, D.M.; Mardawati, E.; Kastaman, R.; Pujianto, T.; Pramulya, R. Coffee Pulp Biomass Utilization on Coffee Production and Its Impact on Energy Saving, CO2 Emission Reduction, and Economic Value Added to Promote Green Lean Practice in Agriculture Production. Agronomy 2023, 13, 904. https://doi.org/10.3390/agronomy13030904
Rahmah DM, Mardawati E, Kastaman R, Pujianto T, Pramulya R. Coffee Pulp Biomass Utilization on Coffee Production and Its Impact on Energy Saving, CO2 Emission Reduction, and Economic Value Added to Promote Green Lean Practice in Agriculture Production. Agronomy. 2023; 13(3):904. https://doi.org/10.3390/agronomy13030904
Chicago/Turabian StyleRahmah, Devi Maulida, Efri Mardawati, Roni Kastaman, Totok Pujianto, and Rahmat Pramulya. 2023. "Coffee Pulp Biomass Utilization on Coffee Production and Its Impact on Energy Saving, CO2 Emission Reduction, and Economic Value Added to Promote Green Lean Practice in Agriculture Production" Agronomy 13, no. 3: 904. https://doi.org/10.3390/agronomy13030904
APA StyleRahmah, D. M., Mardawati, E., Kastaman, R., Pujianto, T., & Pramulya, R. (2023). Coffee Pulp Biomass Utilization on Coffee Production and Its Impact on Energy Saving, CO2 Emission Reduction, and Economic Value Added to Promote Green Lean Practice in Agriculture Production. Agronomy, 13(3), 904. https://doi.org/10.3390/agronomy13030904