Abstract
Late-sowing and high-density cultivation are typical cotton planting models that are widely applied in the Yellow River Valley of China. The model can easily lead to late maturity and reduced yields. Plant topping and ethephon spraying have been shown to improve cotton earliness and yields. However, the optimal topping date and ethephon concentration are yet to be established. A two-year field experiment (2020–2021) was thus conducted to assess the effects of spraying high-concentration ethephon and early topping on the growth, yield, and earliness of cotton under late-sowing and high-density cultivation models. The experiment employed a split-plot design, in which the main plots were sprayed with varying ethephon concentrations (2000 mL/ha, E2000; 4000 mL/ha, E4000; 6000 mL/ha, E6000), while subplots were plant topping dates (T13, 13 July, early-topped; T20, 20 July, suitable-topped; T27, 27 July, late-topped). Higher ethephon concentrations (E4000) increased the earliness of early-topped (T13) plants. Boll-setting and boll-opening rates increased by 12.00% and 16.83% in T13 plants, respectively, relative to T27 plants. However, the shedding rate for T13 plants decreased by 12.00%. Earliness and harvest index (HI) for the T13 plants were higher than those of the T27 plants by 8.01% and 18.91%, respectively. Even though the T13 plant yield decreased slightly, their boll weight increased by 3.99% and 12.27%, respectively, relative to those of the T20 and T27 plants. Earliness increased with increasing ethephon concentration. In conclusion, early topping and higher ethephon concentrations can effectively improve cotton yield and earliness.
1. Introduction
Cotton is an important fiber crop that is globally cultivated, primarily for commercial purposes. However, it is labor-intensive [1], which increases its production costs. To reduce production costs and save on labor, light and simplified cultivation models, including late sowing and high-density planting, are gradually being used in China [2,3].
Late sowing promotes vegetative growth by accelerating the aging rate of cotton leaves, thereby shortening the vegetative growth time, which prolongs the boll-opening date. Moreover, it enhances concentrated boll opening, which is vital in mechanical harvesting [4]. However, late sowing tends to delay physiological maturity and reduce cotton yield potential [5]. Therefore, increasing the planting density has become a viable choice for growers. High-density planting improves the structural characteristics of cotton clusters and increases the concentration of effective cotton bolls in the upper part of the plant. Though light and simplified cultivation models enhance the load and time concentration of cotton into bolls, cotton is prone to low temperature and cold damage during the later growth stages, resulting in slow opening of cotton bolls and a low flowering rate before frost, thereby reducing seed cotton yield and quality [6,7,8]. Therefore, the effects of promoting early maturity and earliness, possibly through plant topping and ethephon spraying [9,10] in the late-sowing and high-density cultivation models, should be investigated to determine how they impact cotton yield and quality.
Plant topping breaks apical dominance, increases earliness, and promotes partitioning of assimilates to the reproductive organs [9]. However, the apical dominance of cotton increases as the density increases, reducing the topping effect and seed cotton yields [2]. Plant topping increases the seed cotton yield by 8.6–12.8% more than non-topping at high plant density (90,000 plants·ha−1), possibly because topping promotes partitioning of assimilates to the reproductive organs [11,12].
Timely topping of cotton is essential to reduce unproductive fruit branches, promote rational distribution of nutrients, and increase the boll formation rate and boll weights [1,12]. An investigation of the topping date for different cotton varieties revealed that the topping date significantly affected the seed cotton yield and fiber quality. Early topping before frost increases the fiber maturity index and flowering rate, thereby improving earliness [7]. However, too early or late topping reduces the seed cotton yield [13]. Plant topping dates have also been shown to significantly affect the spatiotemporal distribution of cotton bolls. The boll-setting rate in the middle and lower parts decreases, while the boll-setting rate in the upper parts increases with delays in topping [14]. Therefore, early topping is necessary to improve early maturity, seed cotton yields, and fiber quality in cotton. However, the optimal plant topping date and its effects on improving earliness under the late-sowing and high-density cultivation models have yet to be fully established.
Spraying plant growth regulators on cotton has been performed to increase earliness [15]. Ethephon is one of the plant hormones that was discovered early and is widely used as a plant growth regulator in agricultural production. Ethylene regulates plant growth and development by regulating various biological and non-biological processes, for instance, stimulating leaf senescence and fruit ripening to improve earliness [16]. Ethephon spraying also accelerates the degradation rate of proteins in the boll shell and the transfer of assimilated substances from the boll shell to seeds and fibers, thereby improving boll weight and fiber quality [17]. The ripening effects of ethephon are closely associated with spray concentration. Zhang reported that 40% ethephon (2512.5 mL/ha treatment) increased the cotton yield of late-ripening cotton varieties by 6.5–21.4% compared to the controls [16].
Based on findings from the above studies, it has been postulated that a suitable plant topping date and ethephon concentration improve earliness and promote concentrated spitting, which are important for increasing seed cotton yields in late-sowing and high-density cultivation models. However, the optimal ethephon concentration and topping date under late-sowing and high-density cultivation models are poorly understood. This study aimed at determining the optimal topping date and ethephon concentration for improving earliness and yields in late-sowing and high-density cultivation models.
2. Materials and Methods
2.1. Experimental Sites
A two-year field experiment was conducted at Qingyuan experimental station (2020 and 2021) (115°47′ E, 38°76′ N) and Weixian experimental station (2021) (115°27′ E, 36°56′ N), Hebei Province, China. Table 1 shows the properties of the topsoil (0–20 cm) before planting in 2020 and 2021. Figure 1 shows the average rainfall and temperature of the cotton growing sites in 2020 and 2021. The average temperature and rainfall levels of the cotton growing season in Qingyuan 2020 were 21.57 °C and 93.12 mm, respectively. The average temperature and rainfall levels of the cotton growing season in Qingyuan 2021 were 21.78 °C and 146.55 mm, respectively; and the average temperature and rainfall levels of the cotton growing season in Weixian 2021 were 22.72 °C and 141.52 mm, respectively.

Table 1.
Soil properties.

Figure 1.
Data on weather parameters: total monthly rainfall (R) and monthly mean temperature (T) during the 2020–2021 cropping seasons.
2.2. Experimental Design and Field Management
2.2.1. Experimental Cotton Cultivar
Nongda 601, a widely commercially cultivated transgenic cotton cultivar developed by Hebei Agricultural University, was used in this experiment. This cultivar is highly resistant to insects and diseases, with a seed cotton yield of 3000 kg/ha. The 40% ethylene water agent was purchased from Shandong Dezhou Dacheng Pesticide Co., Ltd., Dezhou, China.
2.2.2. Experimental Design
The split-plot experimental design was used in this study. The main plot was manually sprayed with three concentrations of 40% ethephon (2000 mL/ha, E2000; 4000 mL/ha, E4000; 6000 mL/ha, E6000) on 30 September 30 (recommended spraying date for this area) in 2020 and 2021. The sub-plots were assigned three topping dates: T13 (13 July), the early-topping date; T20 (20 July), the conventional topping date; and T27 (27 July), the late-topping date.
Manual topping was adopted, whereby one leaf and one heart were at the lower part of the main stem growth point, and the expanded leaves were removed. Planting was performed on 1 May 2020, and 2021, at a density of 9 plants/m2 and a row spacing of 76 cm. Each plot was 66.7 m2 and was supplemented with 180 kg/ha of N, 105 kg/ha of P2O5, and 90 kg/ha of K2O as basal fertilizers. Other field management practices, including irrigation, tillage, and insect and weed control, were in accordance with the local agronomic practices.
2.3. Data Collection
The collected data included the tempo-spatial distribution of cotton bolls, net photosynthetic (Pn) rate, leaf area index (LAI), boll load per unit leaf area, photo-assimilate partitioning, earliness, seed cotton yield, yield components, and fiber quality.
2.3.1. Tempo-Spatial Distribution of Cotton Bolls
Mature cotton bolls were separately hand harvested and divided into three groups according to their within-plant positions (tempo-spatial distribution): lower-positioned fruiting branches sourced bolls (bolls on the first to fourth fruiting branches), mid-positioned fruiting branches sourced bolls (bolls on the fifth to eighth fruiting branches), and upper-positioned fruiting branches sourced bolls (bolls on the ninth and larger fruiting branches). Final plant heights were recorded for ten randomly selected plants per plot, and the number of bolls was recorded. Boll-setting, boll-opening, and shedding rates were calculated after summarizing the data. Contour lines were plotted using the Surfer 15 software (USA). The formulas used were:
Boll-setting rate = number of bolls per plant/number of fruit segments per plant
Boll-opening rate = number of bolls opening per plant/number of bolls per plant Shedding rate = number of sheddings per plant/number of fruit segments per plant
2.3.2. Photosynthetic Traits
Chlorophyll concentrations in functional leaves in the main stem were determined at 0, 14, 28, 42, and 56 days after topping using a SPAD meter (SPAD-502; Konica Minolta, Tokyo, Japan). Measurements were taken from five plants in each plot, with five measurements for each leaf. The average value of five measurements per leaf was used as the definite value.
The photosynthetic (Pn) rate was assessed between 0900 and 1100 h on cloudless days at 0, 14, 28, 42, and 56 days after topping. Measurements were taken using a LI-6400 portable photosynthesis system (Li-Cor, Lincoln, NE, USA) when the ambient photosynthetic photon flux density exceeded 1500 μM/m2/s. Measurements were obtained from five plants in each replicate, and the mean values were used as definitive values.
2.3.3. LAI and Boll Load per Unit Leaf Area
LAI was taken between 1000 and 1300 h on cloudless days using SUNSCAN (Delta, Hounslow, UK) at 0, 14, 28, 42, and 56 days after topping. The average boll load per unit leaf area was calculated using six representative plants per plot.
The dry weights of reproductive organs (squares, flowers, greens, and mature bolls) were determined after drying for 48 h at 80 °C. Boll load was expressed as the dry weight of reproductive organs per unit leaf area, i.e., boll load per unit leaf area = reproductive biomass/leaf area.
2.3.4. Biomass and Partitioning
Cotton biomass was measured at 0, 14, 28, 42, and 56 days after topping using six representative cotton plants from each plot. Biomass for reproductive (squares, flowers, greens, and mature bolls) and vegetative (stalks and leaves) organs was weighed after drying at 80 °C to a constant weight.
2.3.5. Cotton Yield, Yield Contributors, and Earliness
Plants in the central two rows (10 m) of each plot were manually harvested three times (10 October, 11 November and 27 November of 2020 and 2021, respectively). Cotton seeds from each plot were weighed after sun drying to a constant weight, after which the cotton yields (kg/ha) and average boll weight for each plot were determined after sun drying for ten days. Cotton earliness is expressed as the percentage of the first two harvests to the total harvest [11], i.e., earliness = the first two harvests/total harvest.
Boll weight during each harvest was determined using 50 randomly sampled bolls per plot. Cotton seeds were ginned using a 10-saw gin to obtain the lint percentage.
2.3.6. Fiber Quality
Cotton seeds were separately ginned, and fiber quality was determined using the High-Volume Instrument (HVI) for fiber quality analysis. Analysis was performed using a 10-g lint sample for each ginned sample.
2.4. Statistical Analysis
The means and standard errors were calculated based on the number of replications from each treatment using Microsoft Office Excel 2016 (Microsoft Corporation, Waltham, MA, USA). Analysis of variance (ANOVA) was performed using the General Linear Models procedure in SPSS 26 (IBM, Armonk, NY, USA). Based on Duncan’s test, the significance threshold was set at p < 0.05. Figures were drawn using GraphPad Prism 8 (GraphPad Software Inc., San Diego, CA, USA). Principal component analysis (PCA) was performed using the R software (R 4.0.4).
3. Results
3.1. Tempo-Spatial Distribution and Field Growth of Cotton Bolls
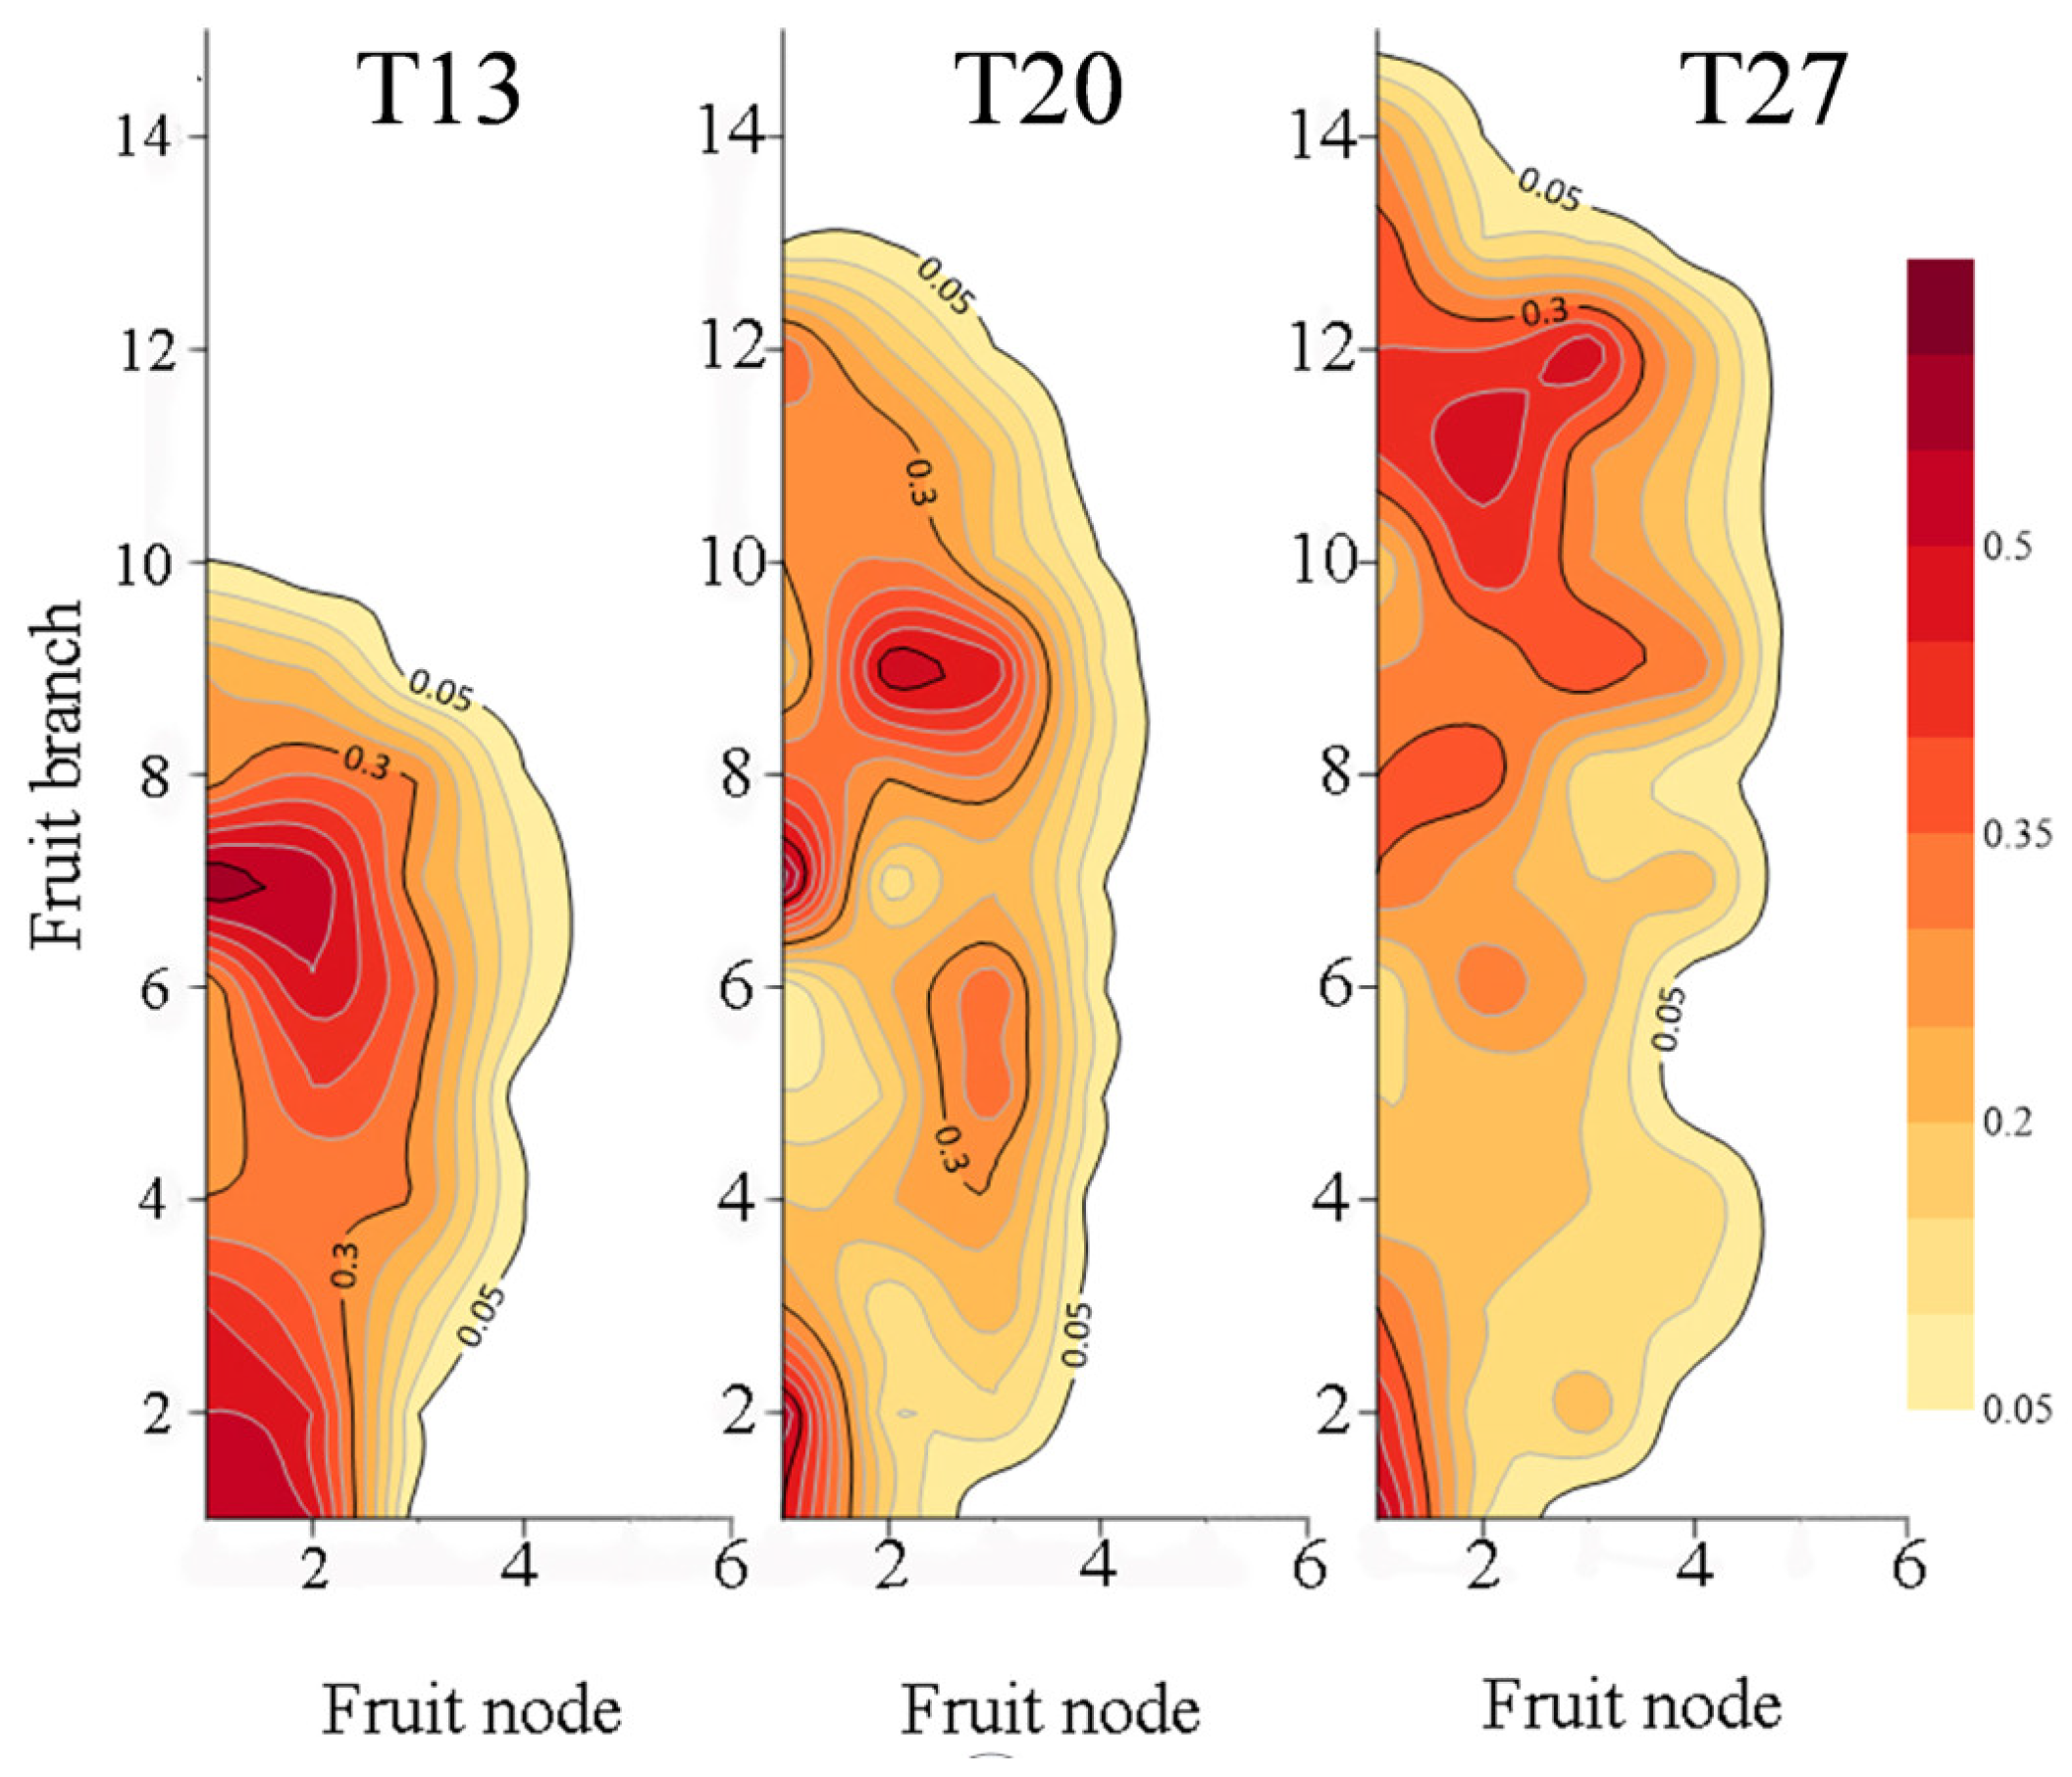
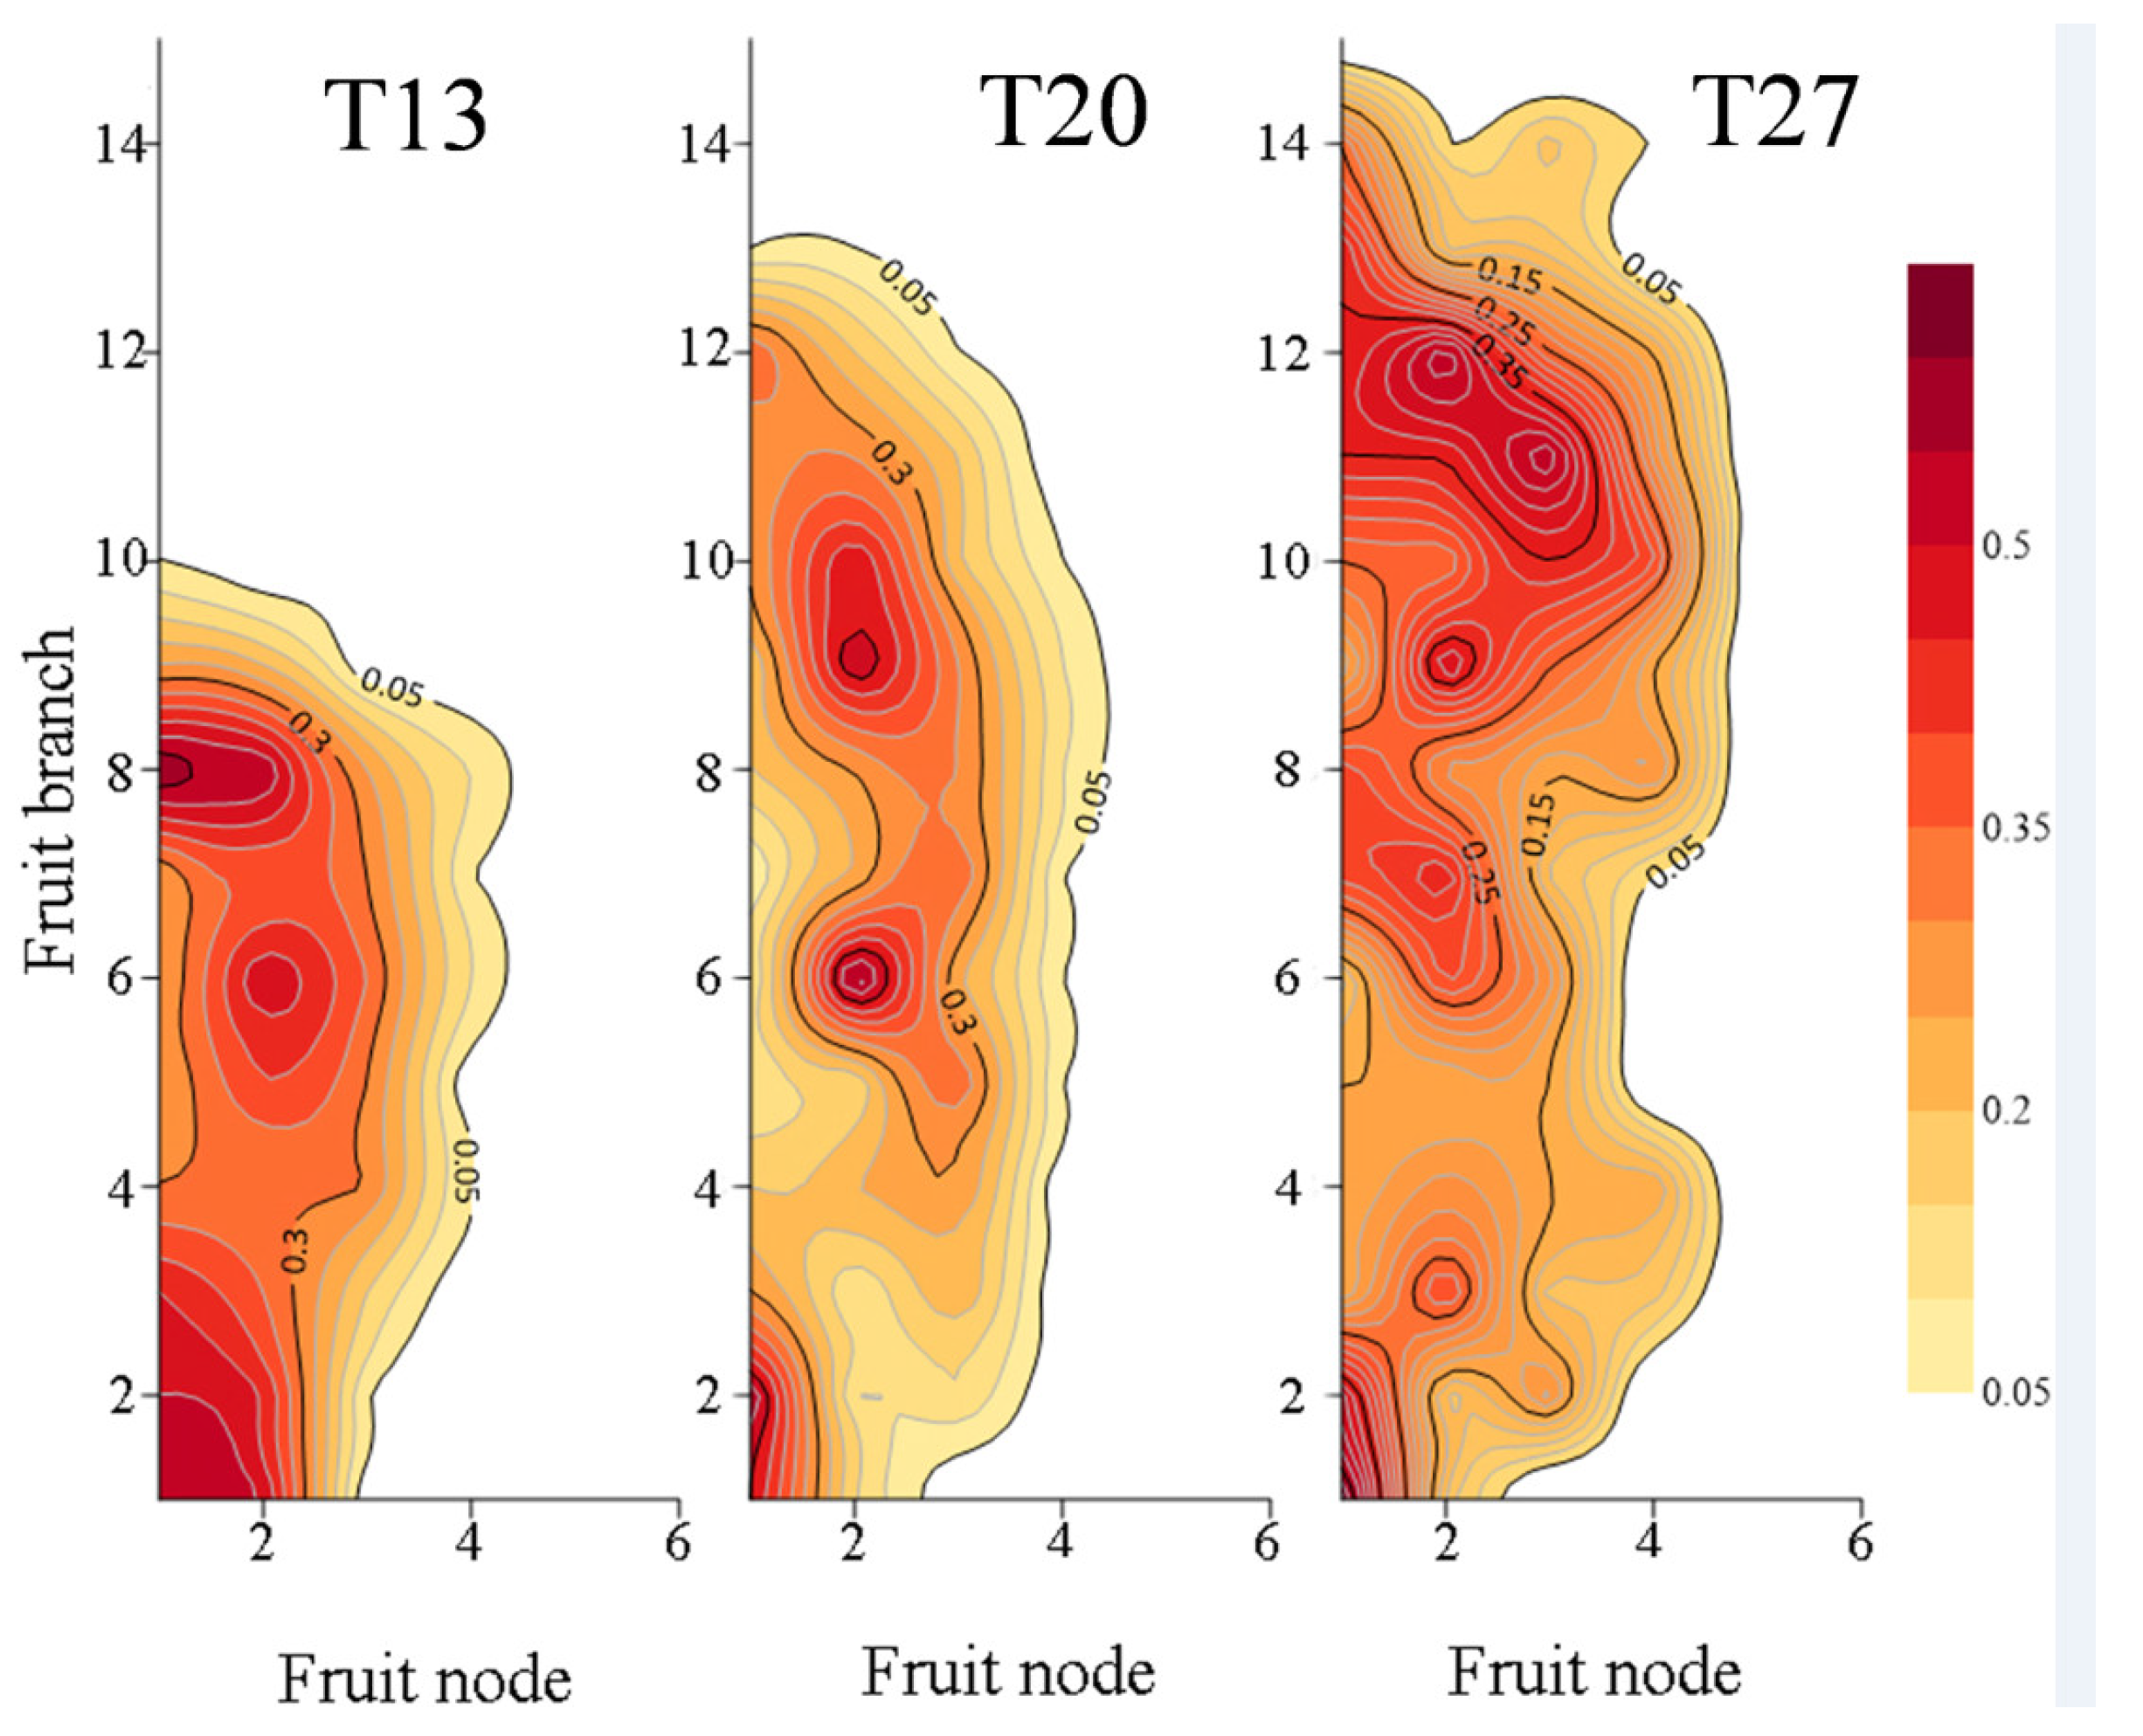
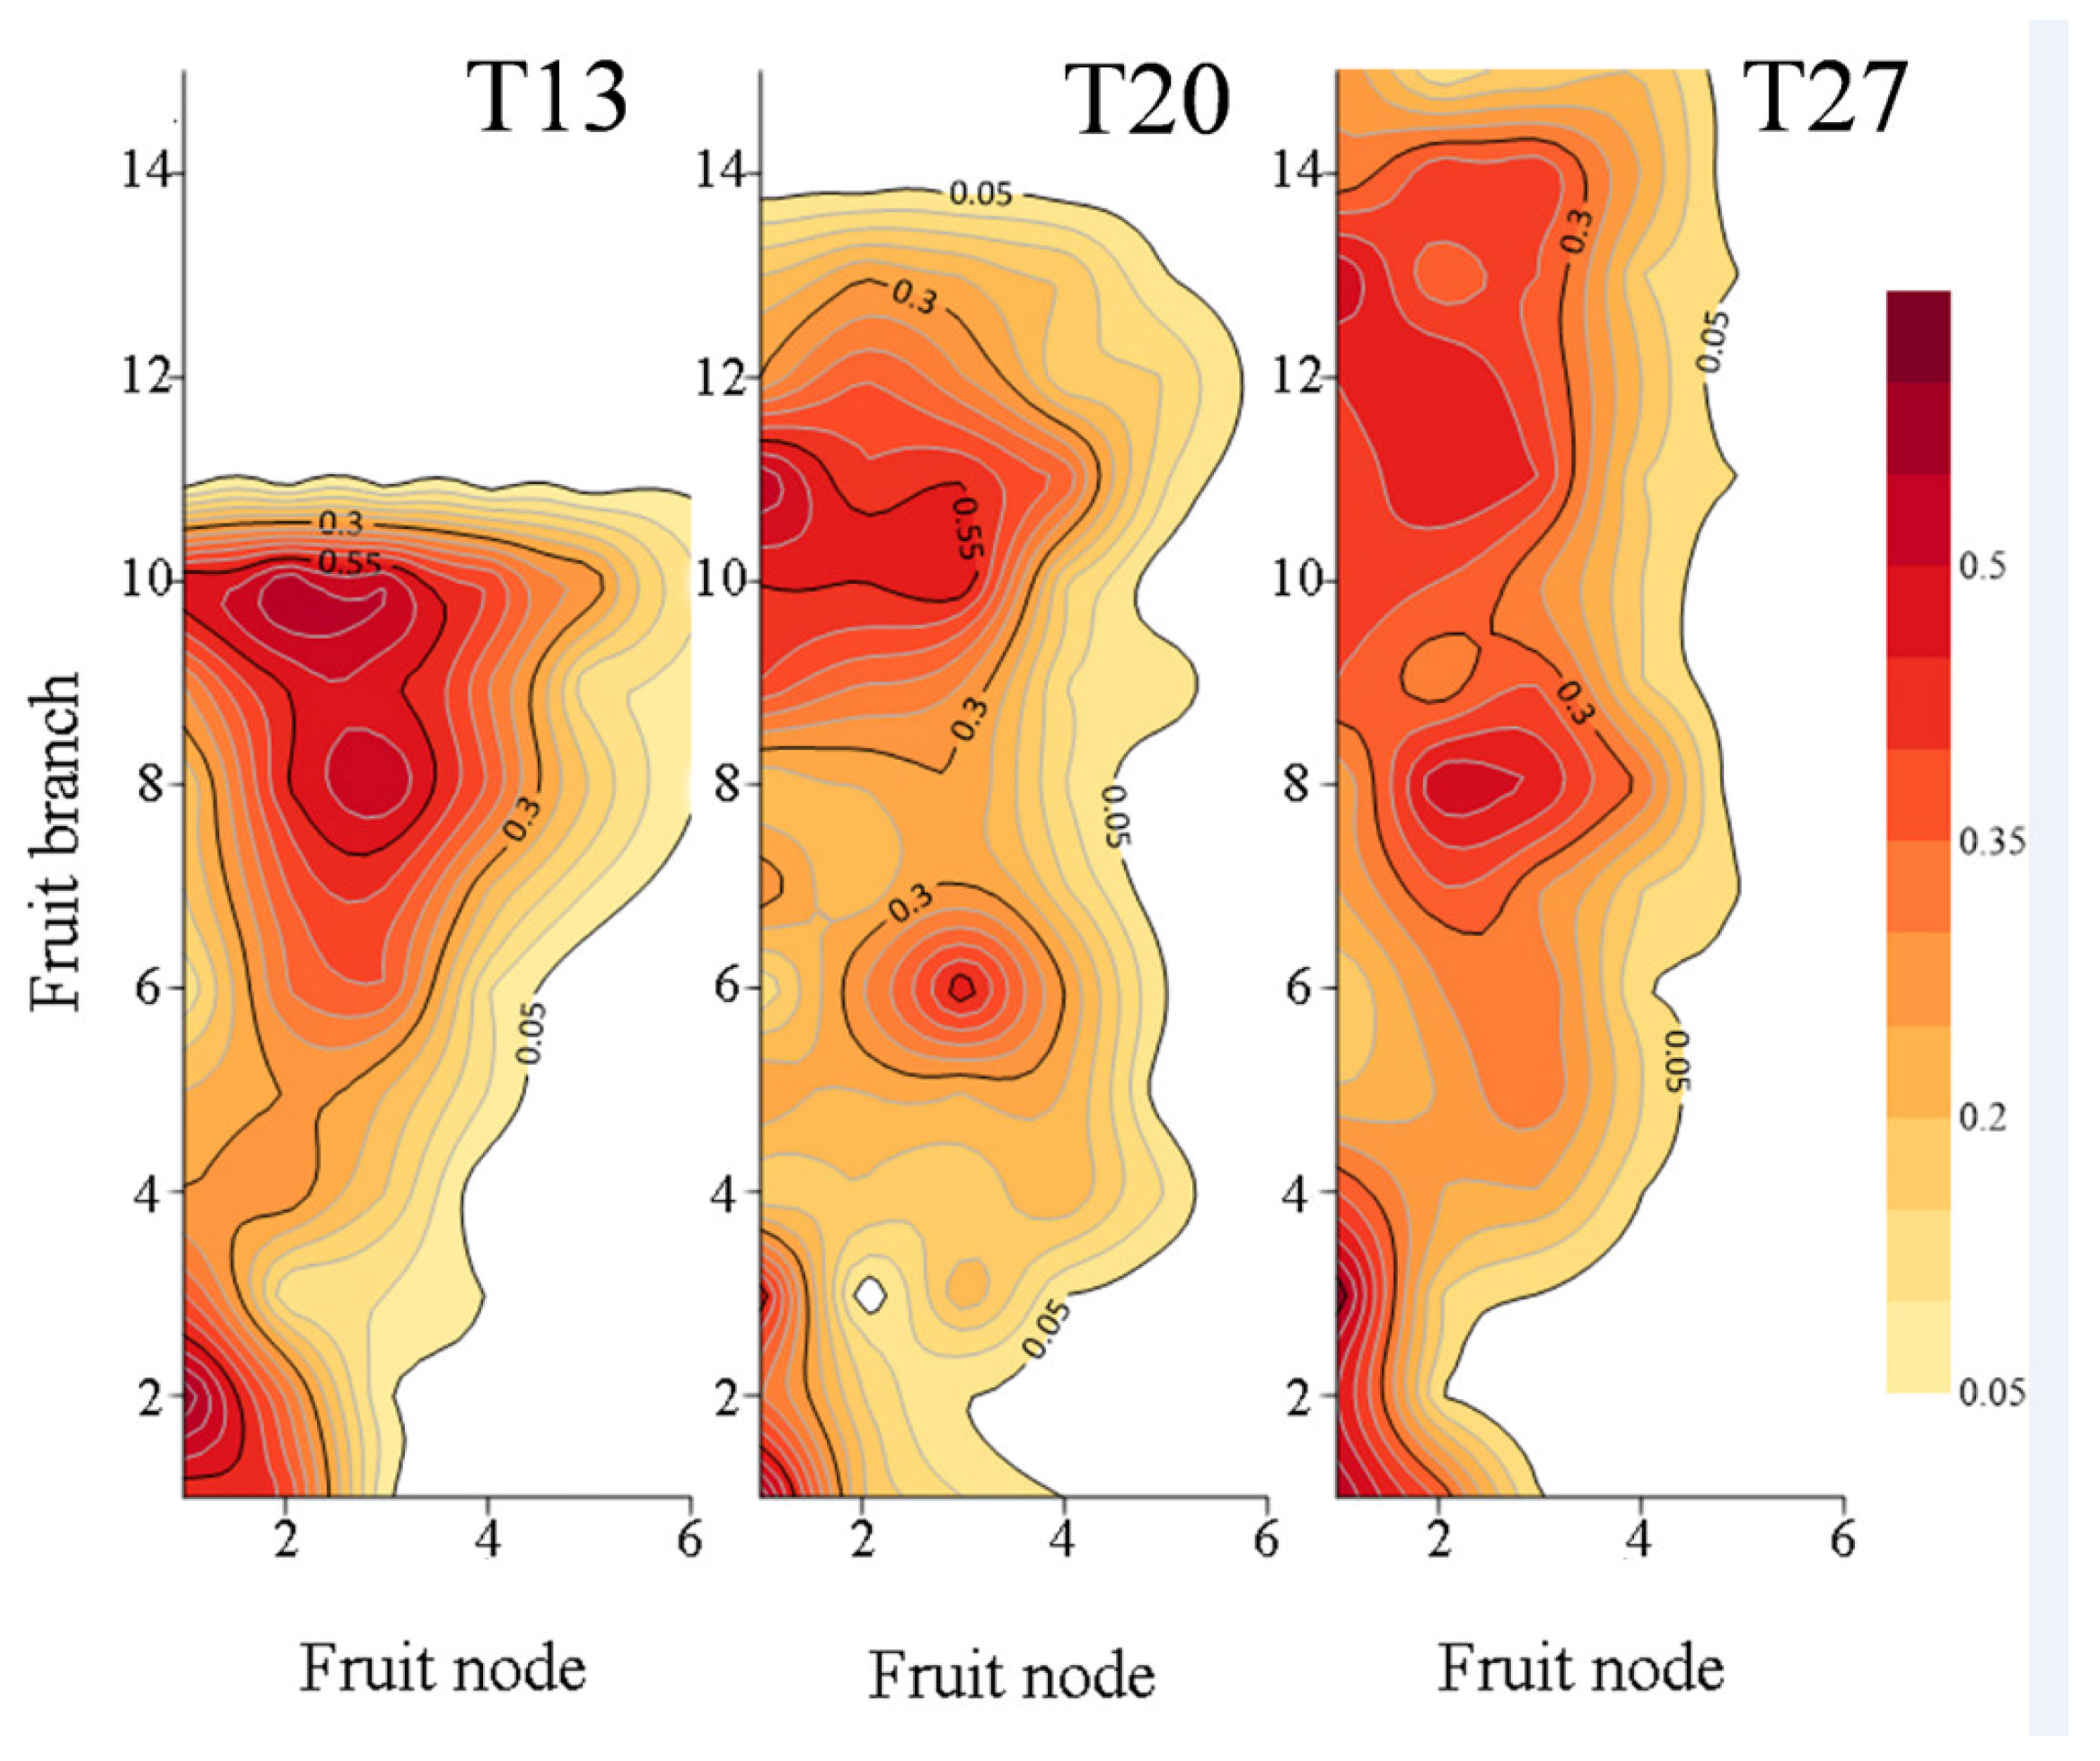
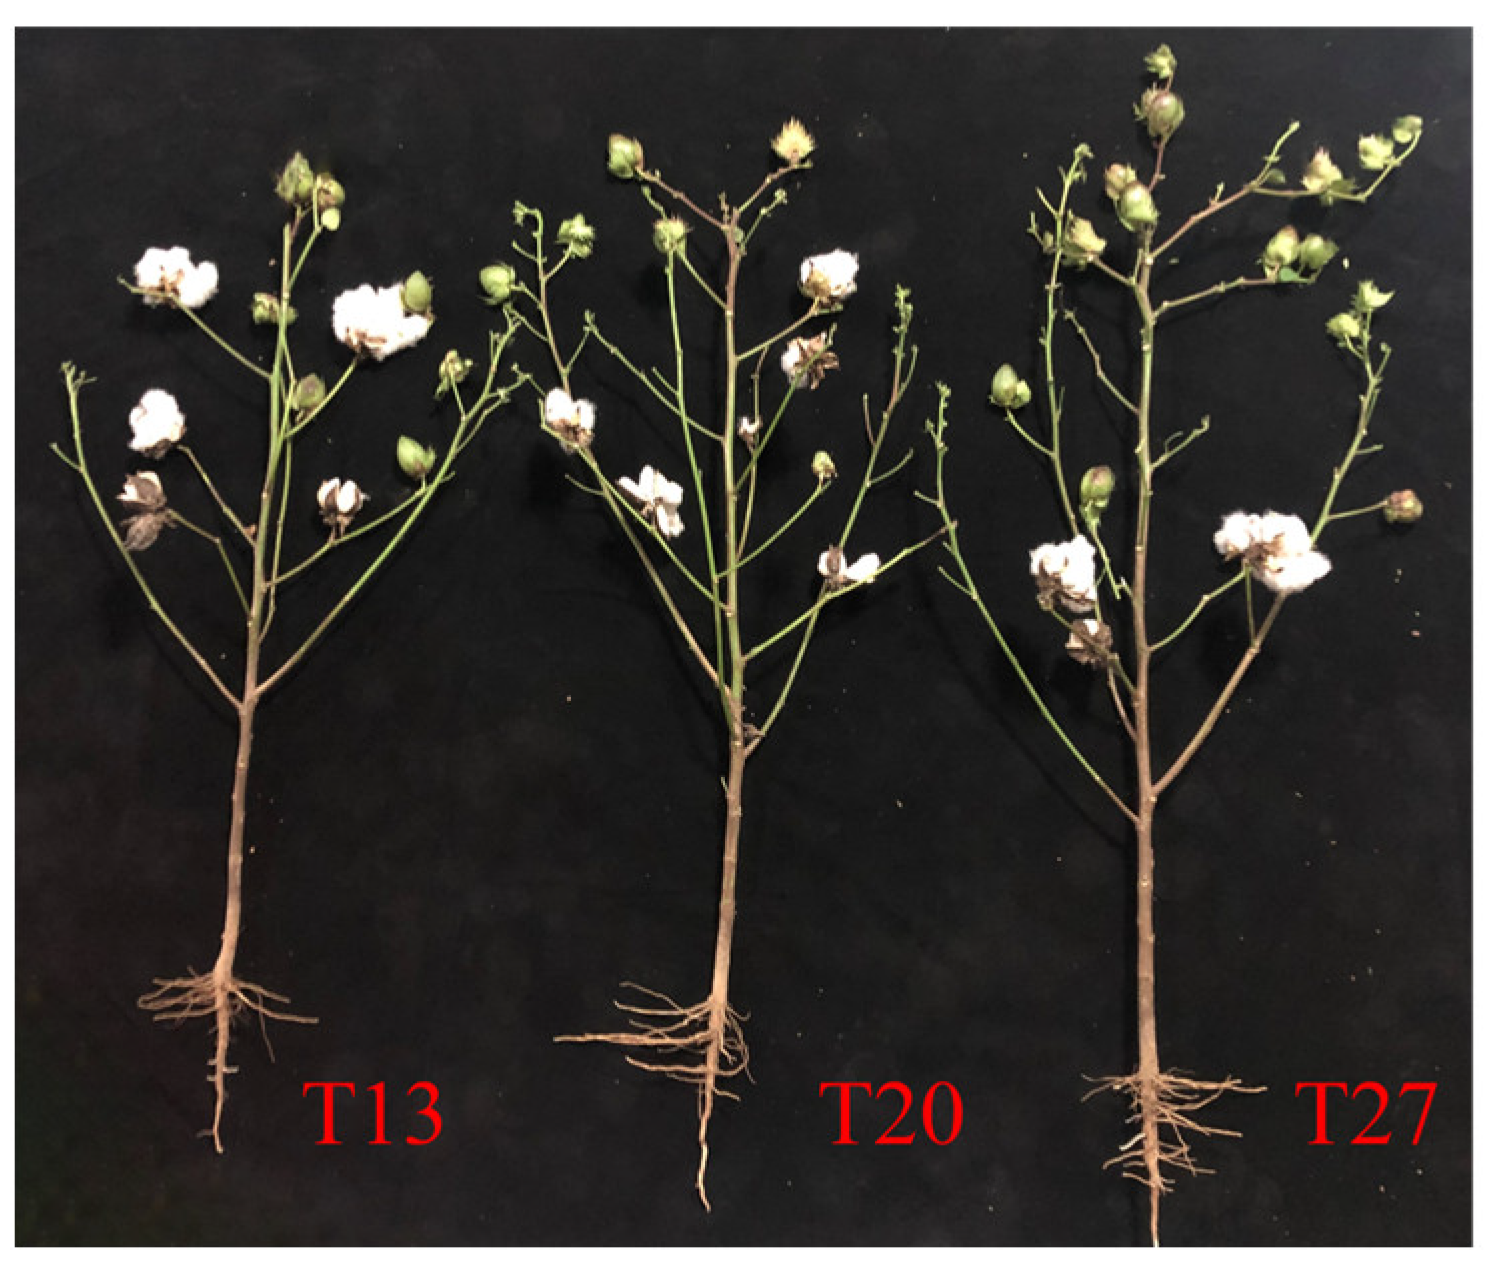
The plant topping dates affected the percentage of mid- and late-positioned bolls (Figure 2, Figure 3 and Figure 4). The T13 bolls were concentrated on the 6th to 8th fruiting branches; the T20 bolls were concentrated on the 9th and 10th fruiting branches; and the T27 bolls were concentrated on the 10th to 12th fruiting branches. The growth of cotton bolls exhibited the same trend (Figure 5). Early-topping (T13) increased the number of mid- and late-positioned bolls. In Weixian, heavy rainfall in September 2021 caused the cotton plants to shed many bolls and increased the number of upper-positioned bolls.
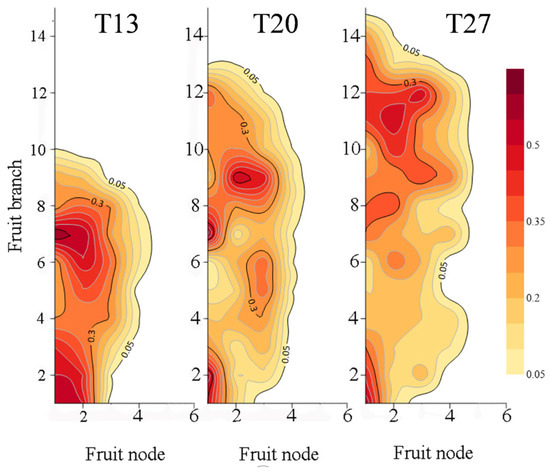
Figure 2.
Tempo-spatial distribution of cotton bolls between treatments (Qingyuan 2020).
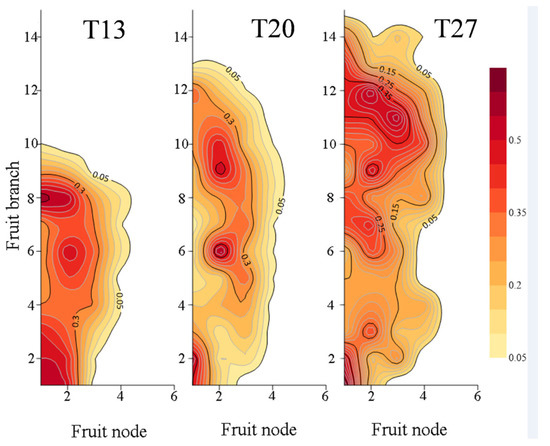
Figure 3.
Tempo-spatial distribution of cotton bolls between treatments (Qingyuan 2022).
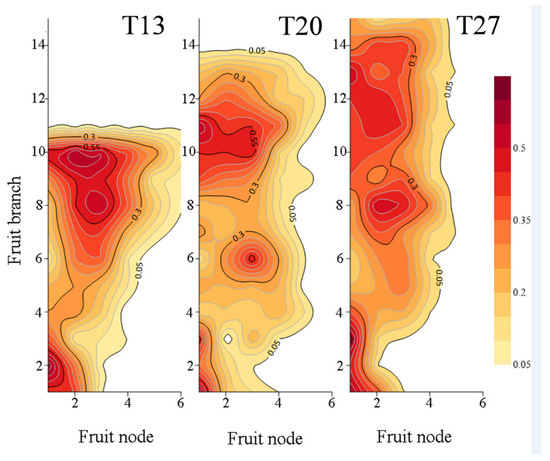
Figure 4.
Tempo-spatial distribution of cotton bolls between treatments (Weixian 2021).
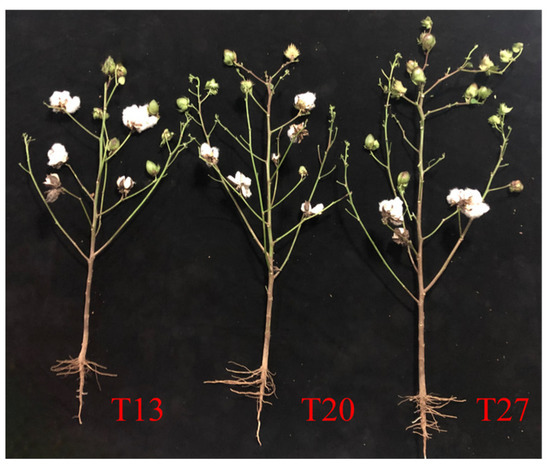
Figure 5.
Field growth of cotton plants between treatments.
The plant topping dates significantly affected the growth characteristics of cotton plants and bolls (Table 2). Plant heights and fruit branches for T13 plants were significantly decreased relative to those of T20 and T27 plants. The T13 plants were 11.58% and 20.64% taller and had 18.95% and 30.40% more fruiting branches than the T20 and T27 plants, respectively (p < 0.05). The T13 plants had increased boll-setting and boll-opening rates but reduced shedding rates after the frost boll ratio. The T13 plants had 5.93% and 12.00% and 7.87% and 16.83% higher boll-setting and boll-opening rates than the T20 and T27 plants, respectively (p < 0.05). The T13 plants had a 5.93% and 12.00% and a 28.92% and 46.39% lower shedding rate after the frost boll ratio than the T20 and T27 plants, respectively (p < 0.05).

Table 2.
The field growth of cotton plants and boll formation at different plant topping dates.
3.2. Photosynthetic Characters
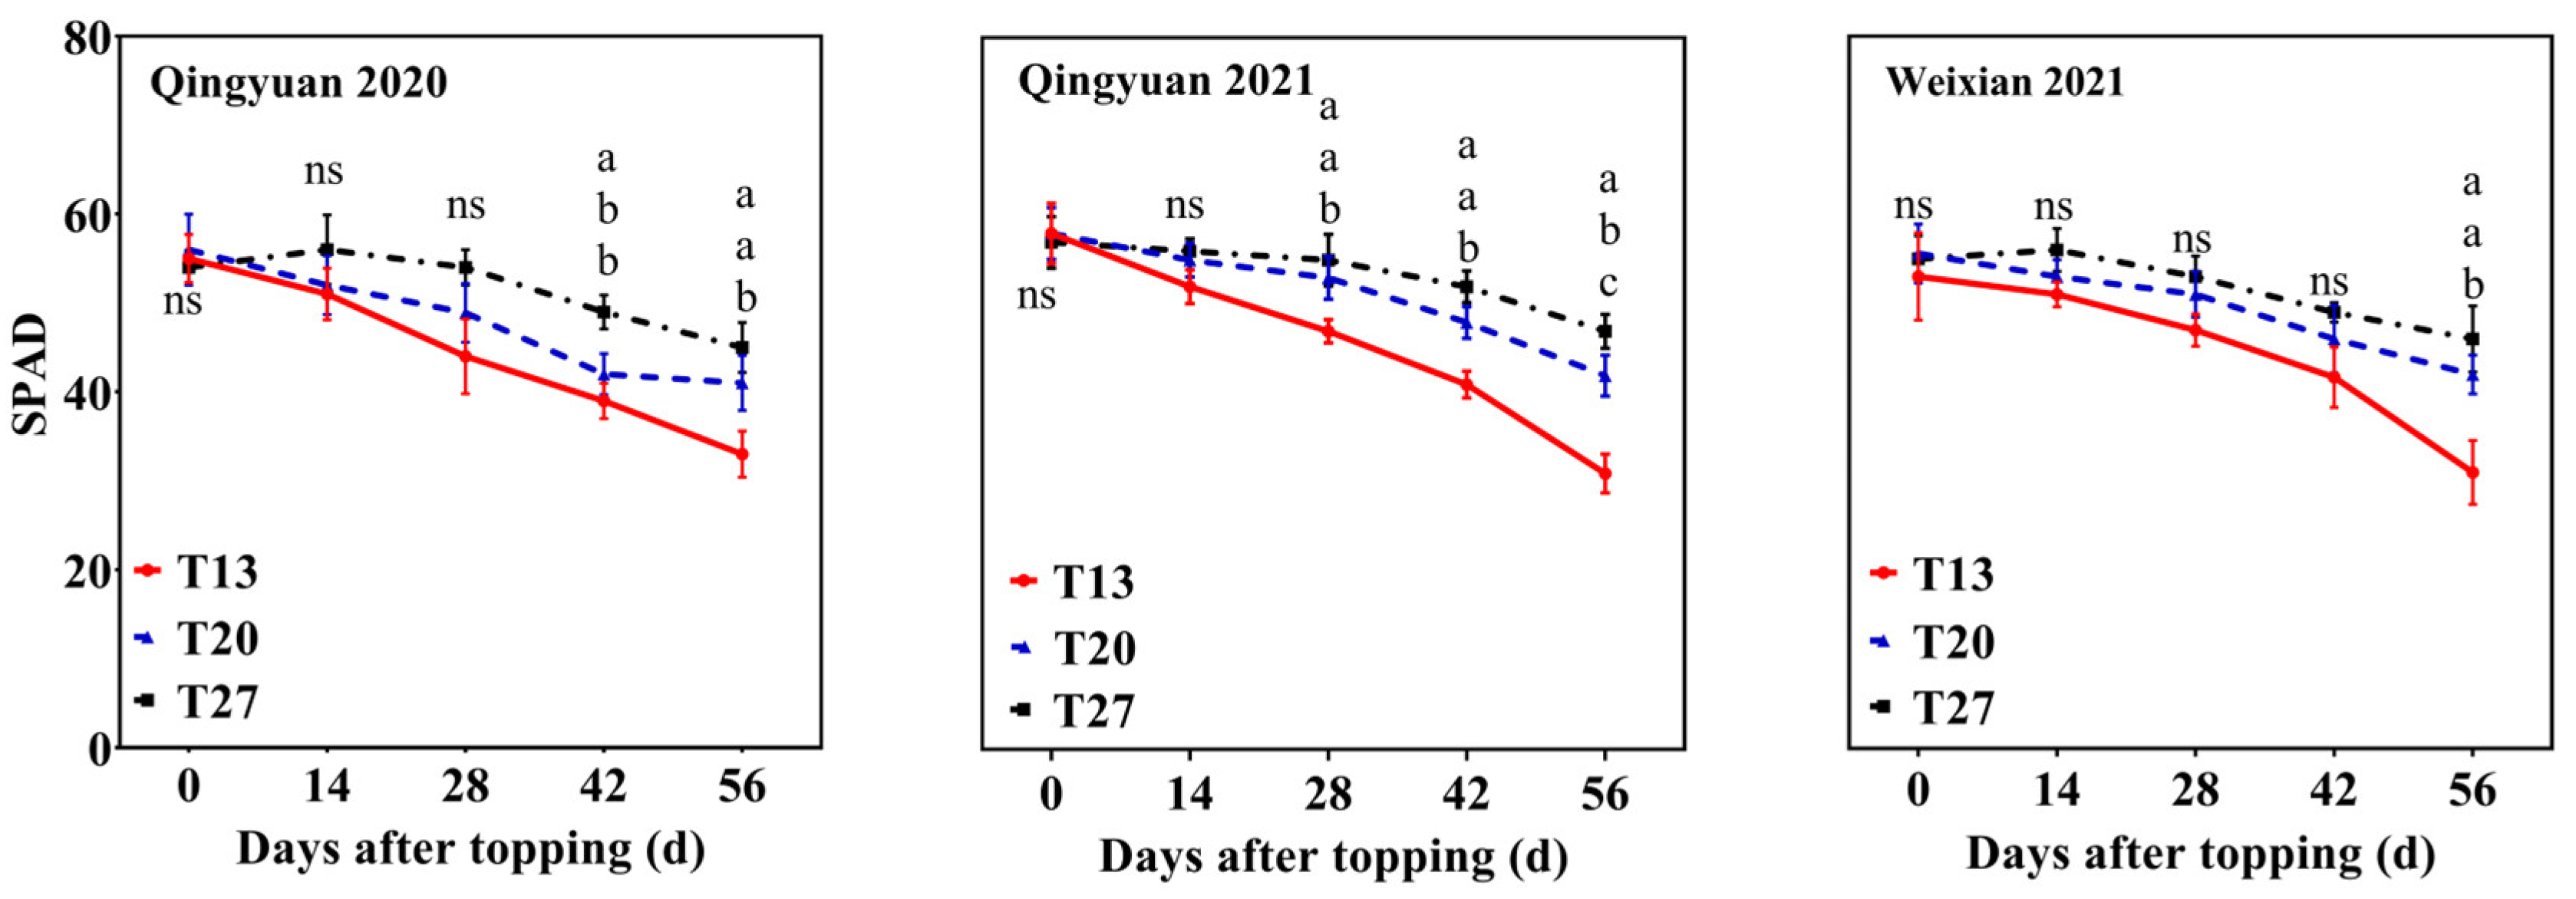
Plant topping dates significantly affected the SPAD of cotton leaves (Figure 6). The SPAD of the main stem functional leaf for T13 plants was significantly lower than those of T20 and T27 plants, but the drop occurred at different times. In 2020, there was a significant difference in SPAD 42 days after topping in Qingyuan. The SPAD for T13 plants at 42 and 56 days after topping was decreased by 7.14% and 20.41%, respectively, and by 19.51% and 26.67% when compared to those of T20 and T27 plants (Qingyuan 2020) (p < 0.05). In 2021, there were significant differences in SPAD at 28 days after topping in Qingyuan. The SPAD for T13 plants at 28, 42, and 56 days after topping decreased by 11.32% and 14.58%, 26.19% and 14.54%, and by 21.15% and 34.04% when compared to those of T20 and T27 plants, respectively (Qingyuan 2021) (p < 0.05). In Weixian, significant differences in SPAD were noted 56 days after topping when the SPAD for T13 plants decreased by 29.19% and 32.61% when compared to those of T20 and T27 plants, respectively (p < 0.05).
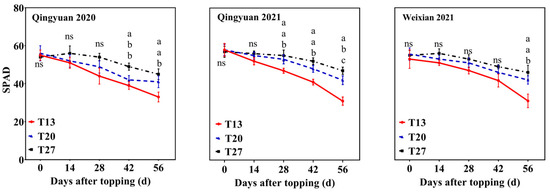
Figure 6.
Cotton main stem functional leaf SPAD. Significant differences are denoted by lowercase letters (p < 0.05) and ns represents no significant difference.
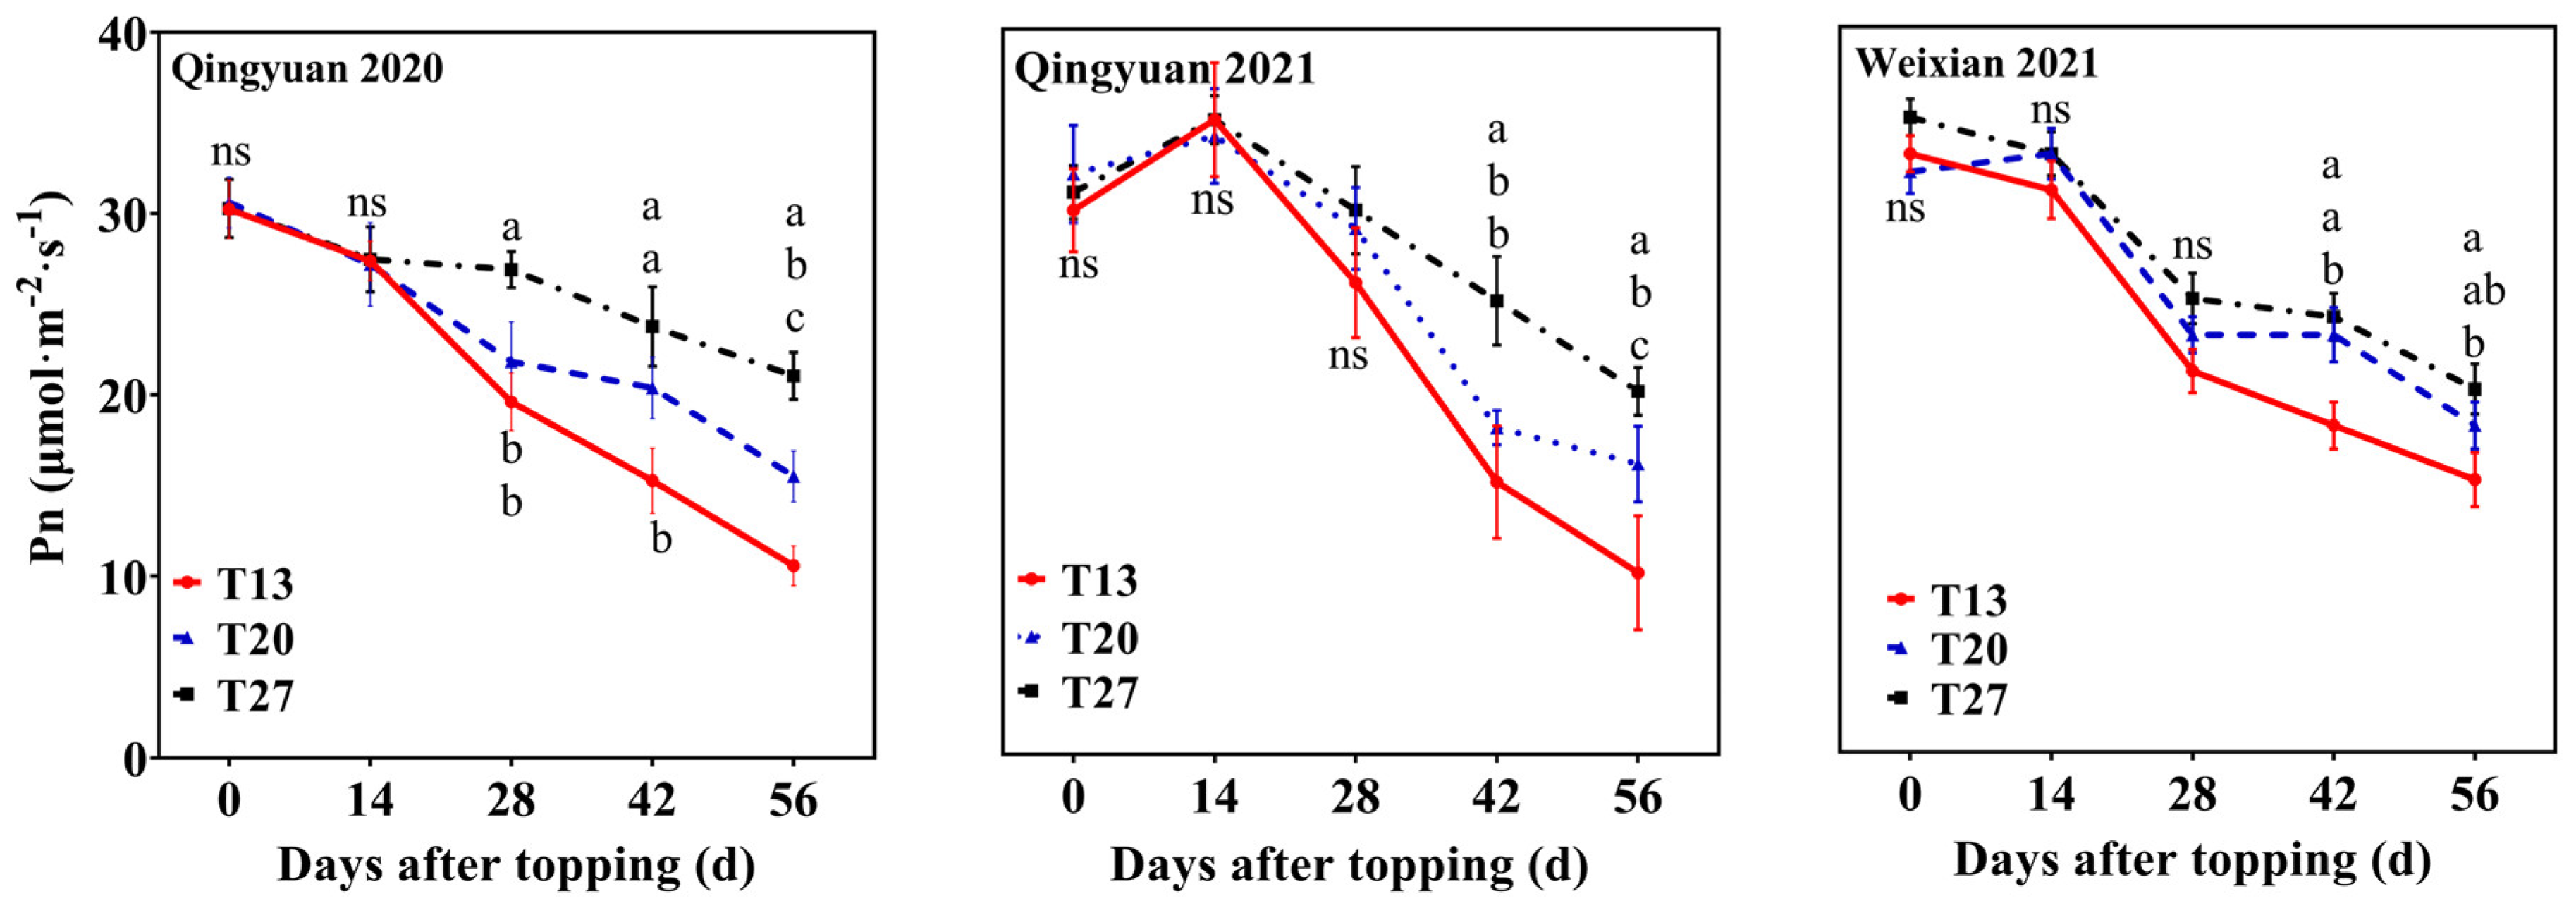
Plant topping dates significantly affected the net photosynthetic (Pn) rates for the cotton plants. Late-topping significantly reduced the Pn of functional leaves of the main cotton stem (Figure 7). In 2020, there were significant differences in Pn 28 days after topping in Qingyuan. The Pn for T13 plants 28, 42, and 56 days after topping were 9.52% and 25.12%, 34.78% and 27.13%, and 32.25% and 47.22% lower than those of T20 and T27 plants, respectively (Qingyuan 2020) (p < 0.05). In 2021, there were significant differences in Pn 42 days after topping in Qingyuan. The Pn for T13 plants 42 and 56 days after topping were 16.67% and 39.81%, respectively, and 37.51% and 42.11% lower than those of T20 and T27 plants (Qingyuan 2021) (p < 0.05). In Weixian, significant differences in Pn were noted 42 days after topping. The Pn for T13 plants 42 and 56 days after topping were 21.74% and 16.67%, respectively, and 25.00% and 25.00% lower than those of T20 and T27 plants (Weixian 2021) (p < 0.05).
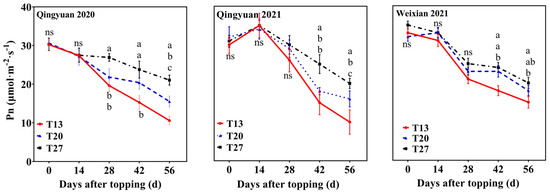
Figure 7.
Net photosynthetic (Pn) rate of the cotton main stem functional leaf. Significant differences are denoted by lowercase letters (p < 0.05) and ns represents no significant difference.
3.3. Leaf Area Index (LAI)
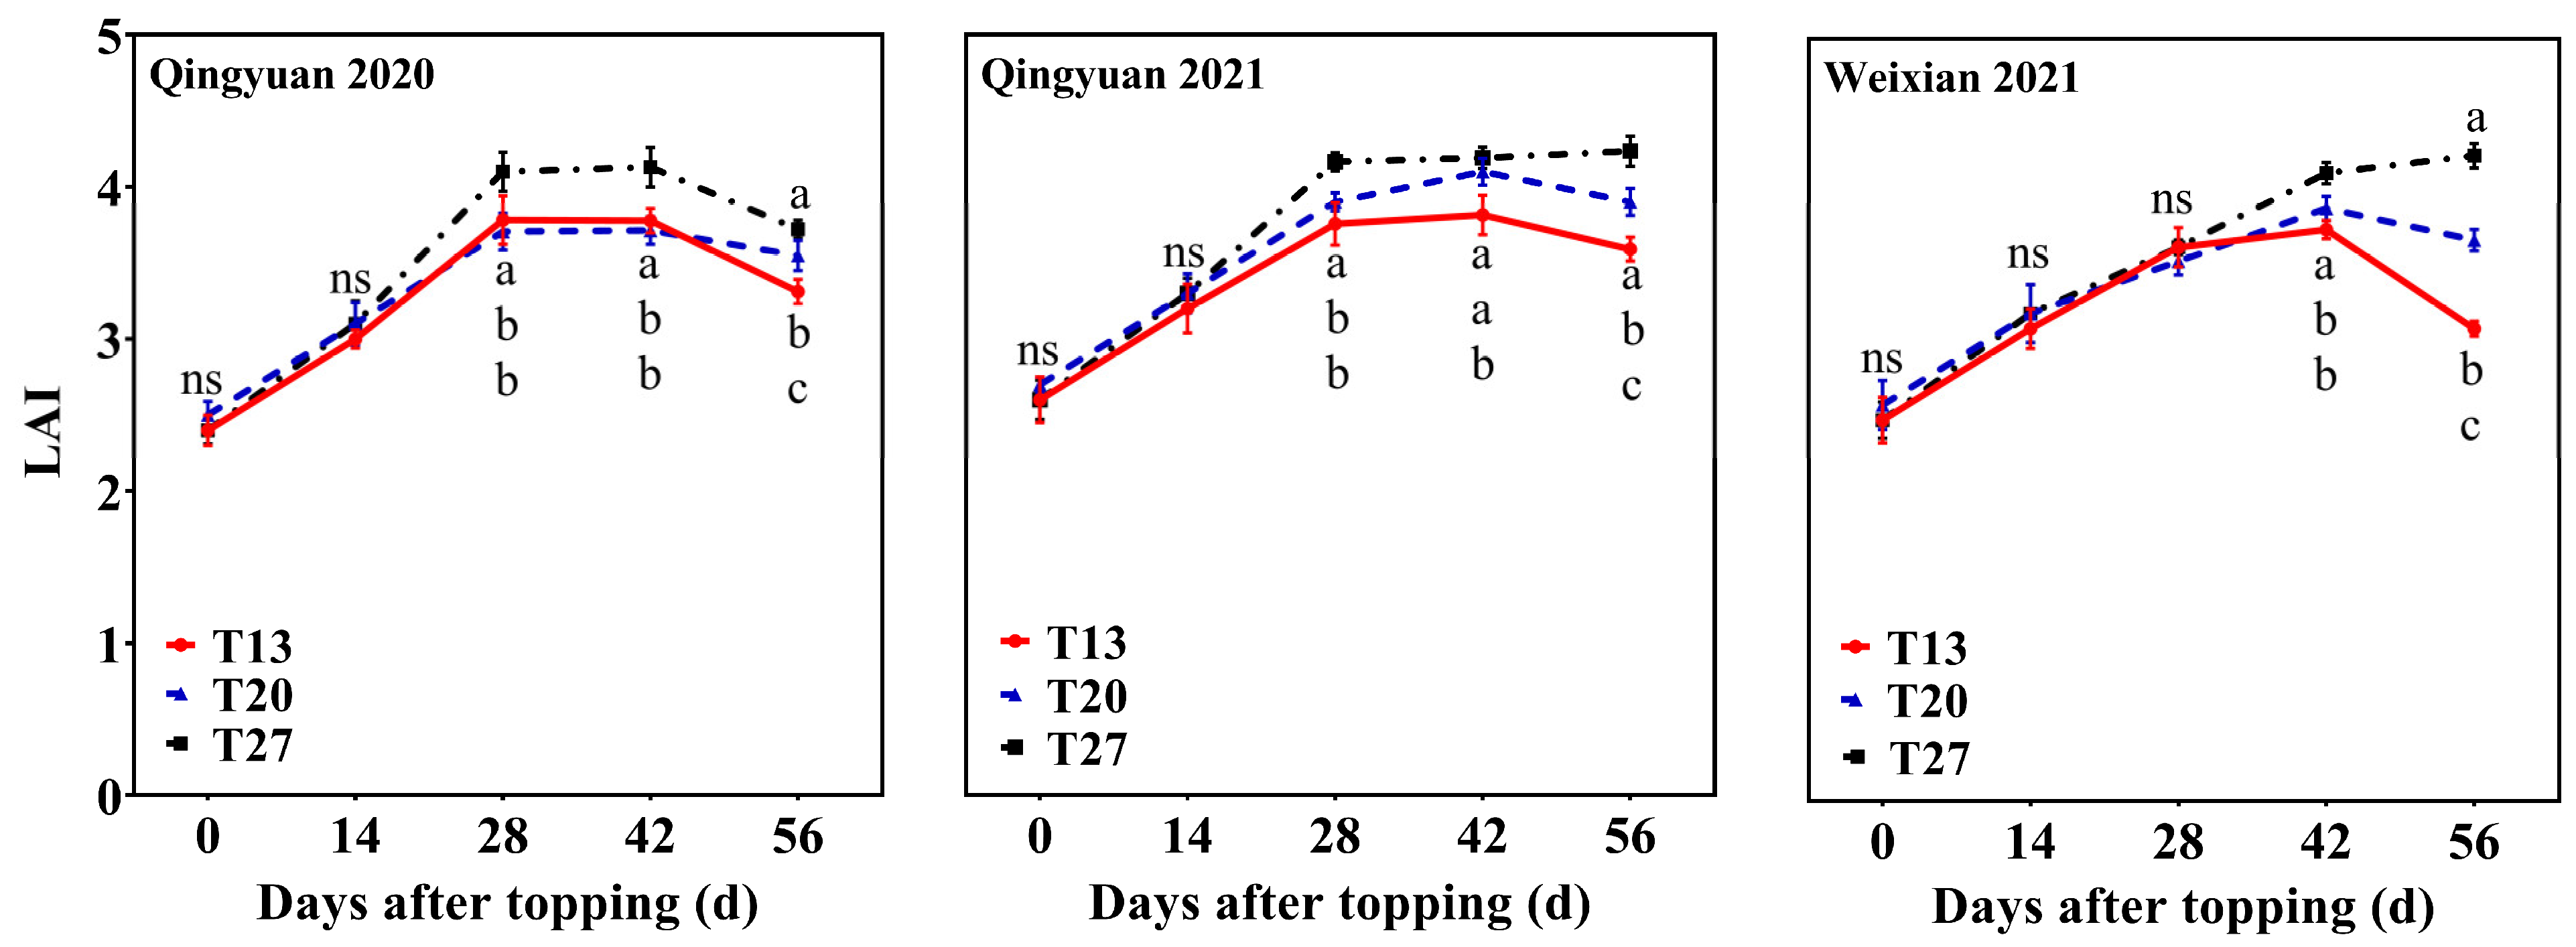
The LAI first increased and then decreased after plant topping in all treatments (Figure 8). In Qingyuan, LAI reached the maximum levels in all plots 28 days after topping in 2020 and 2021. The LAI for T13 plants at 42 and 56 days after topping decreased by 3.59% and 15.83%, respectively, and by 9.02% and 26.82% relative to those of T20 and T27 plants (Qingyuan 2020) (p < 0.05). The LAI for T13 plants at 42 and 56 days after topping decreased by 6.98% and 7.92% and by 8.98% and 15.20%, respectively, relative to those of T20 and T27 plants (Qingyuan 2021) (p < 0.05). In Weixian, LAI was at its maximum level 42 days after topping. The LAI for T13 plants at 42 and 56 days after topping decreased by 1.73% and 6.70%, respectively, and by 8.51% and 11.01% relative to those of T20 and T27 plants (Weixian 2021) (p < 0.05).
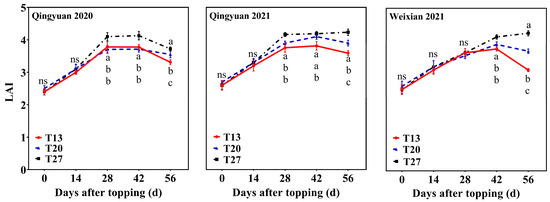
Figure 8.
Leaf area index (LAI). Significant differences are denoted by lowercase letters (p < 0.05) and ns represents no significant difference.
3.4. Boll Load per Unit Leaf Area
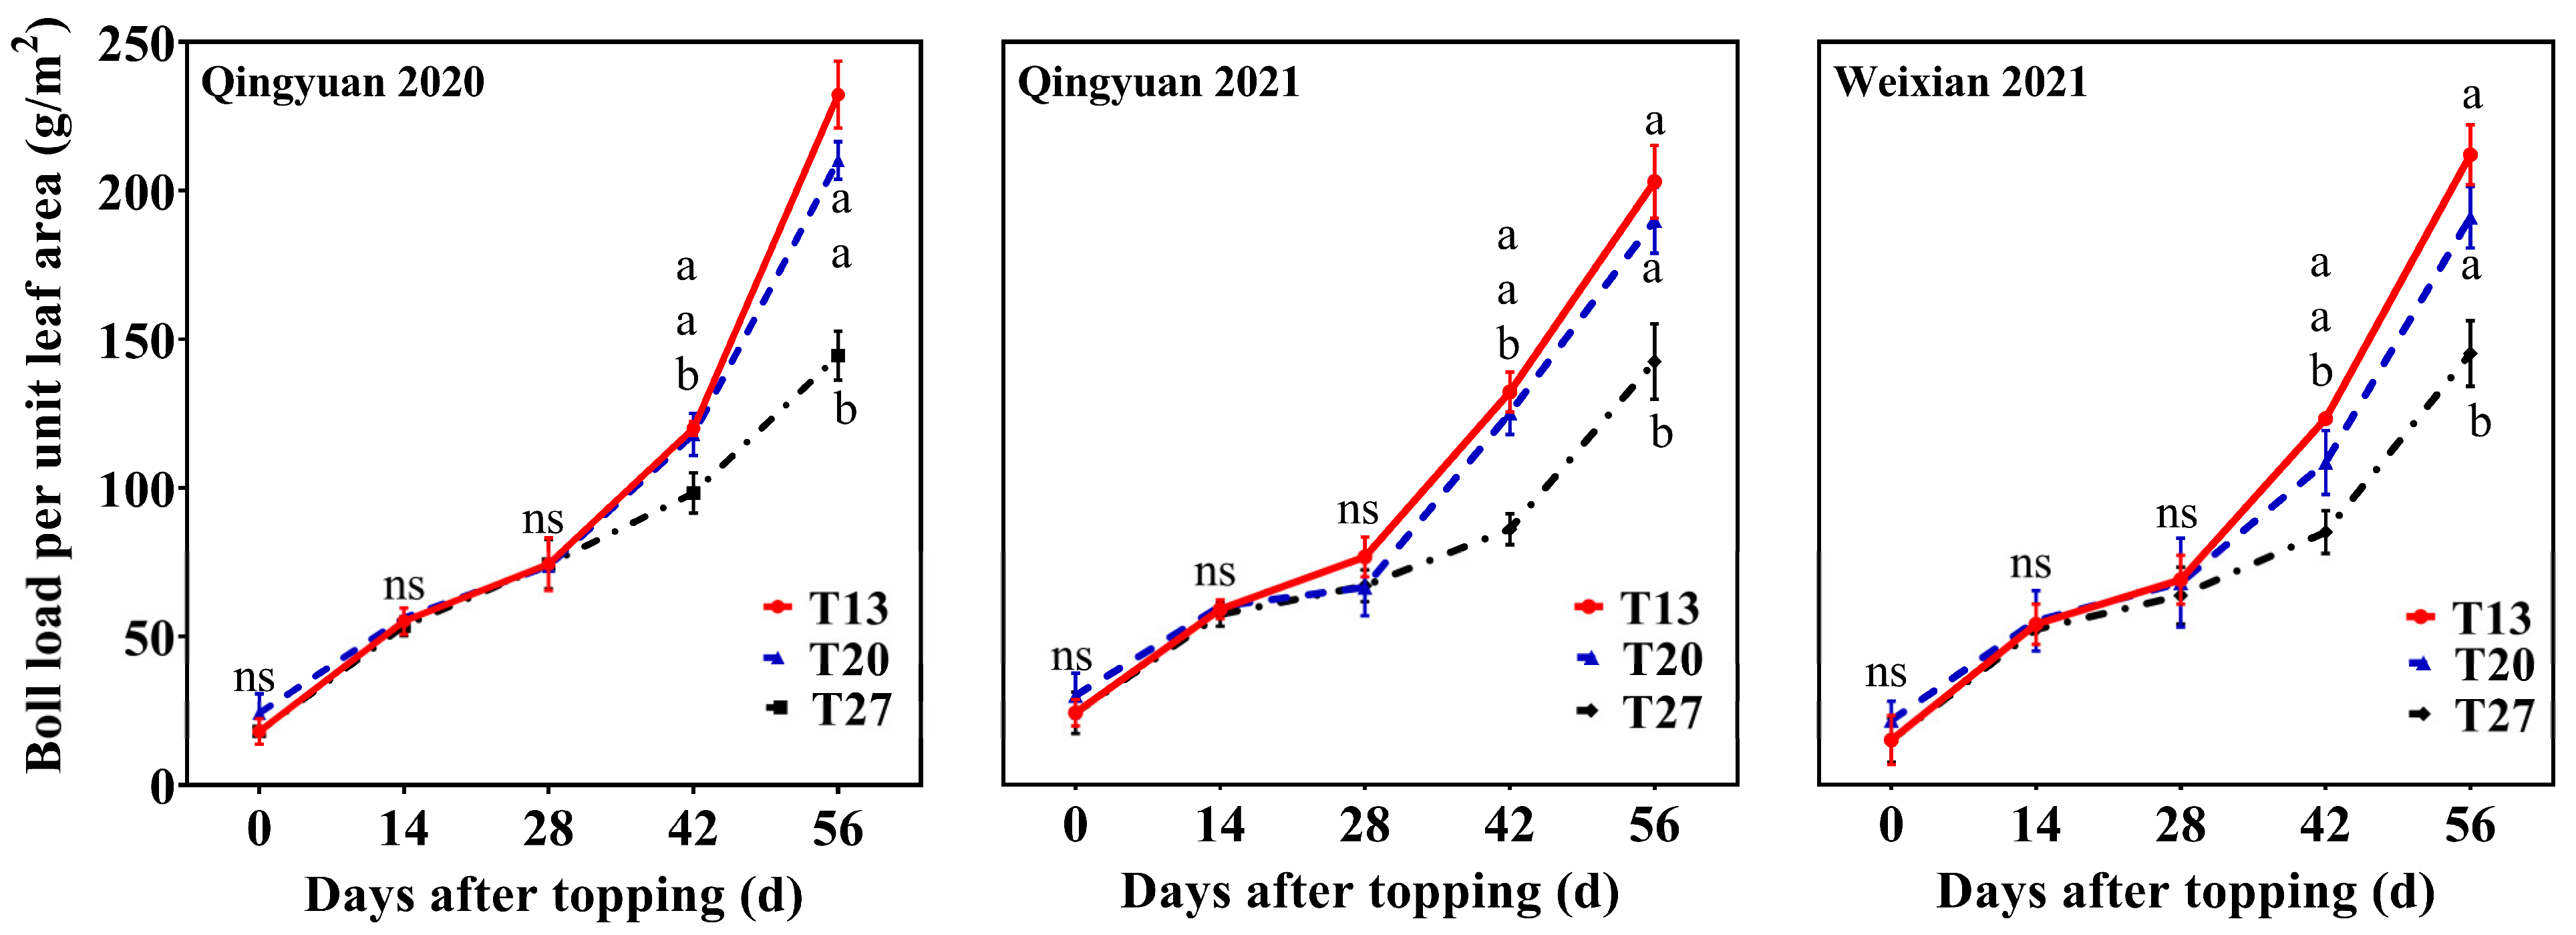
The plant topping date significantly affected the boll load per unit leaf area (Figure 9). The boll load per unit leaf area for T13 plants at 42 days after topping was significantly higher than those of T20 and T27 plants. The boll load per unit leaf area for T13 plants at 56 days after topping was increased by 66.18% and 28.74%, respectively, relative to those of T20 and T27 plants (p < 0.05).
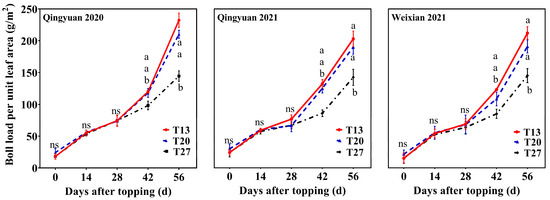
Figure 9.
The boll load per unit leaf area. Significant differences are denoted by lowercase letters (p < 0.05) and ns represents no significant difference.
3.5. Biological Yield and Dry Matter Partitioning
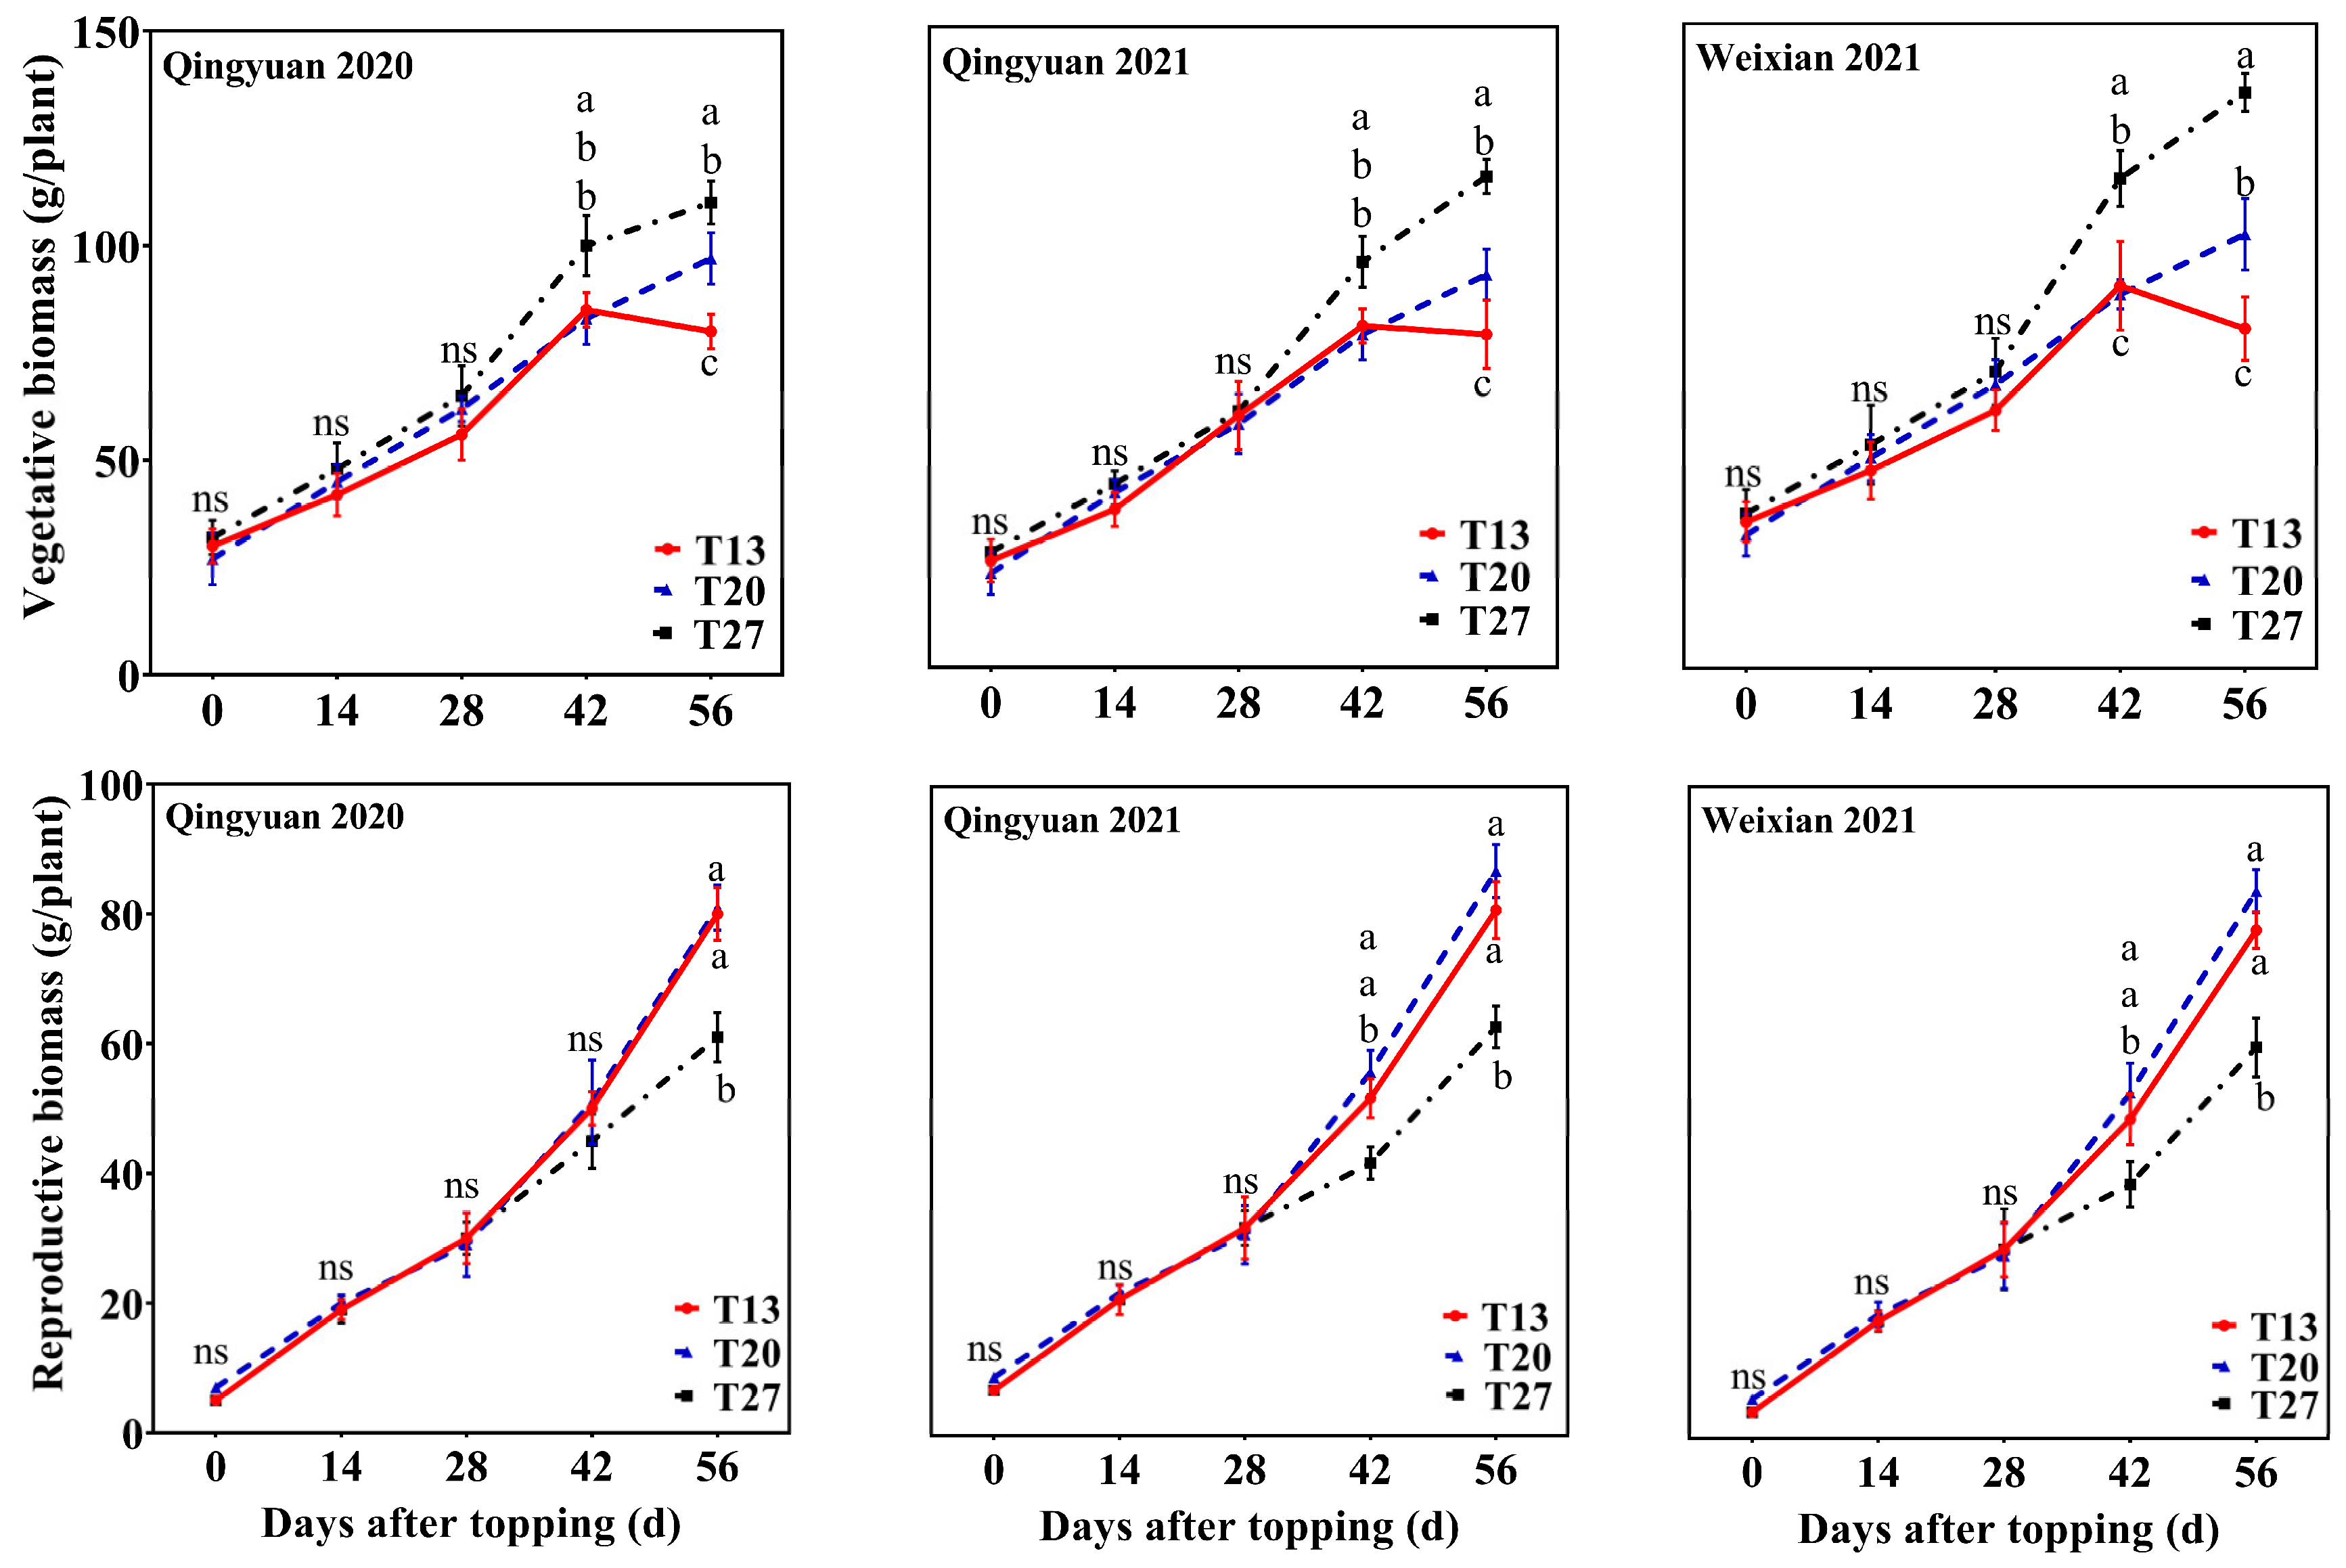
The vegetative biomass first increased and then decreased, while the reproductive biomass exhibited continuous growth with the advancement of the growth and development of cotton (Figure 10).
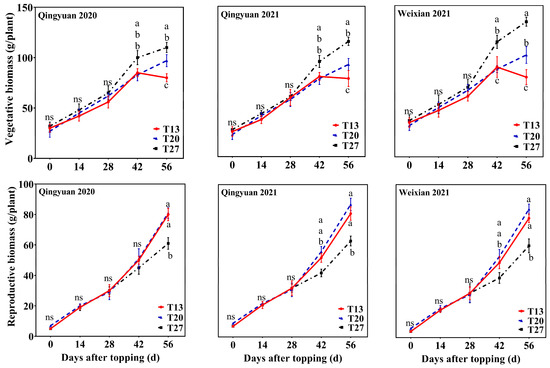
Figure 10.
Dry matter partitioning. Significant differences are denoted by lowercase letters (p < 0.05) and ns represents no significant difference.
There were significant differences in vegetative and reproductive biomasses at 42 days after topping, with a significant decrease and increase in vegetative biomass and reproductive biomass for T13 plants, respectively. The reproductive biomass for T13 plants at 42 and 56 days after topping was increased by 19.84% and 29.89%, respectively, relative to those of T27 and T20 plants (p < 0.05). The reproductive biomass for T20 plants was slightly higher than that of T13 plants; however, the difference was not significant. The reproductive organs of cotton plants had a higher distribution of dry matter.
3.6. Cotton Yield, Yield Components, and Earliness
Harvest index (HI) and earliness were affected by plant topping dates and ethephon concentrations in each experimental site (Table 3, Table 4 and Table 5). HI and earliness for T13 plants were 18.91% and 8.01% higher than those of T27 plants, respectively (p < 0.05).

Table 3.
The effect of topping date and concentration of ethephon on yield, yield components, and earliness (Qingyuan 2020).

Table 4.
The effect of topping date and concentration of ethephon on yield, yield components, and earliness (Qingyuan 2021).

Table 5.
The effect of topping date and concentration of ethephon on yield, yield components, and earliness (Weixian 2021).
Seed cotton yield was affected by plant topping dates and ethephon concentrations (Table 3, Table 4 and Table 5). Ethephon concentrations of 4000 mL/ha and topping on July 20 resulted in the highest yield. However, with the delay in the topping date of the same ethephon concentration, the cotton seed yield first increased and then decreased. The seed cotton yield for plants topped on the same date increased and then kept decreasing with increasing ethephon concentration.
Yield components were also affected by plant topping dates and ethephon concentrations. Postponement of the topping date resulted in an increase and decrease in boll density, while boll weight exhibited a continuous downward trend, indicating that early topping significantly increased the cotton boll weight.
Ethephon concentration had no significant effects on boll weight or association with topping date. Lint percentage first increased and then decreased with increasing ethephon concentration. However, the topping date had no significant effect on the lint percentage.
3.7. Fiber Quality
The fiber content, micronaire value, and fiber strength decreased with late topping. However, none of the above factors were significantly affected by changes in ethephon concentrations (Table 6, Table 7 and Table 8). However, the topping date and ethephon concentration significantly affected fiber elongation. The highest extensibility was observed at an ethephon concentration of 2000 mL/ha on 27 July 2020, in Qingyuan.

Table 6.
The effect of topping date and concentration of ethephon on fiber quality (Qingyuan 2020).

Table 7.
The effect of topping date and concentration of ethephon on fiber quality (Qingyuan 2021).

Table 8.
The effect of topping date and concentration of ethephon on fiber quality (Weixian 2021).
3.8. Principal Component and Correlation Analyses
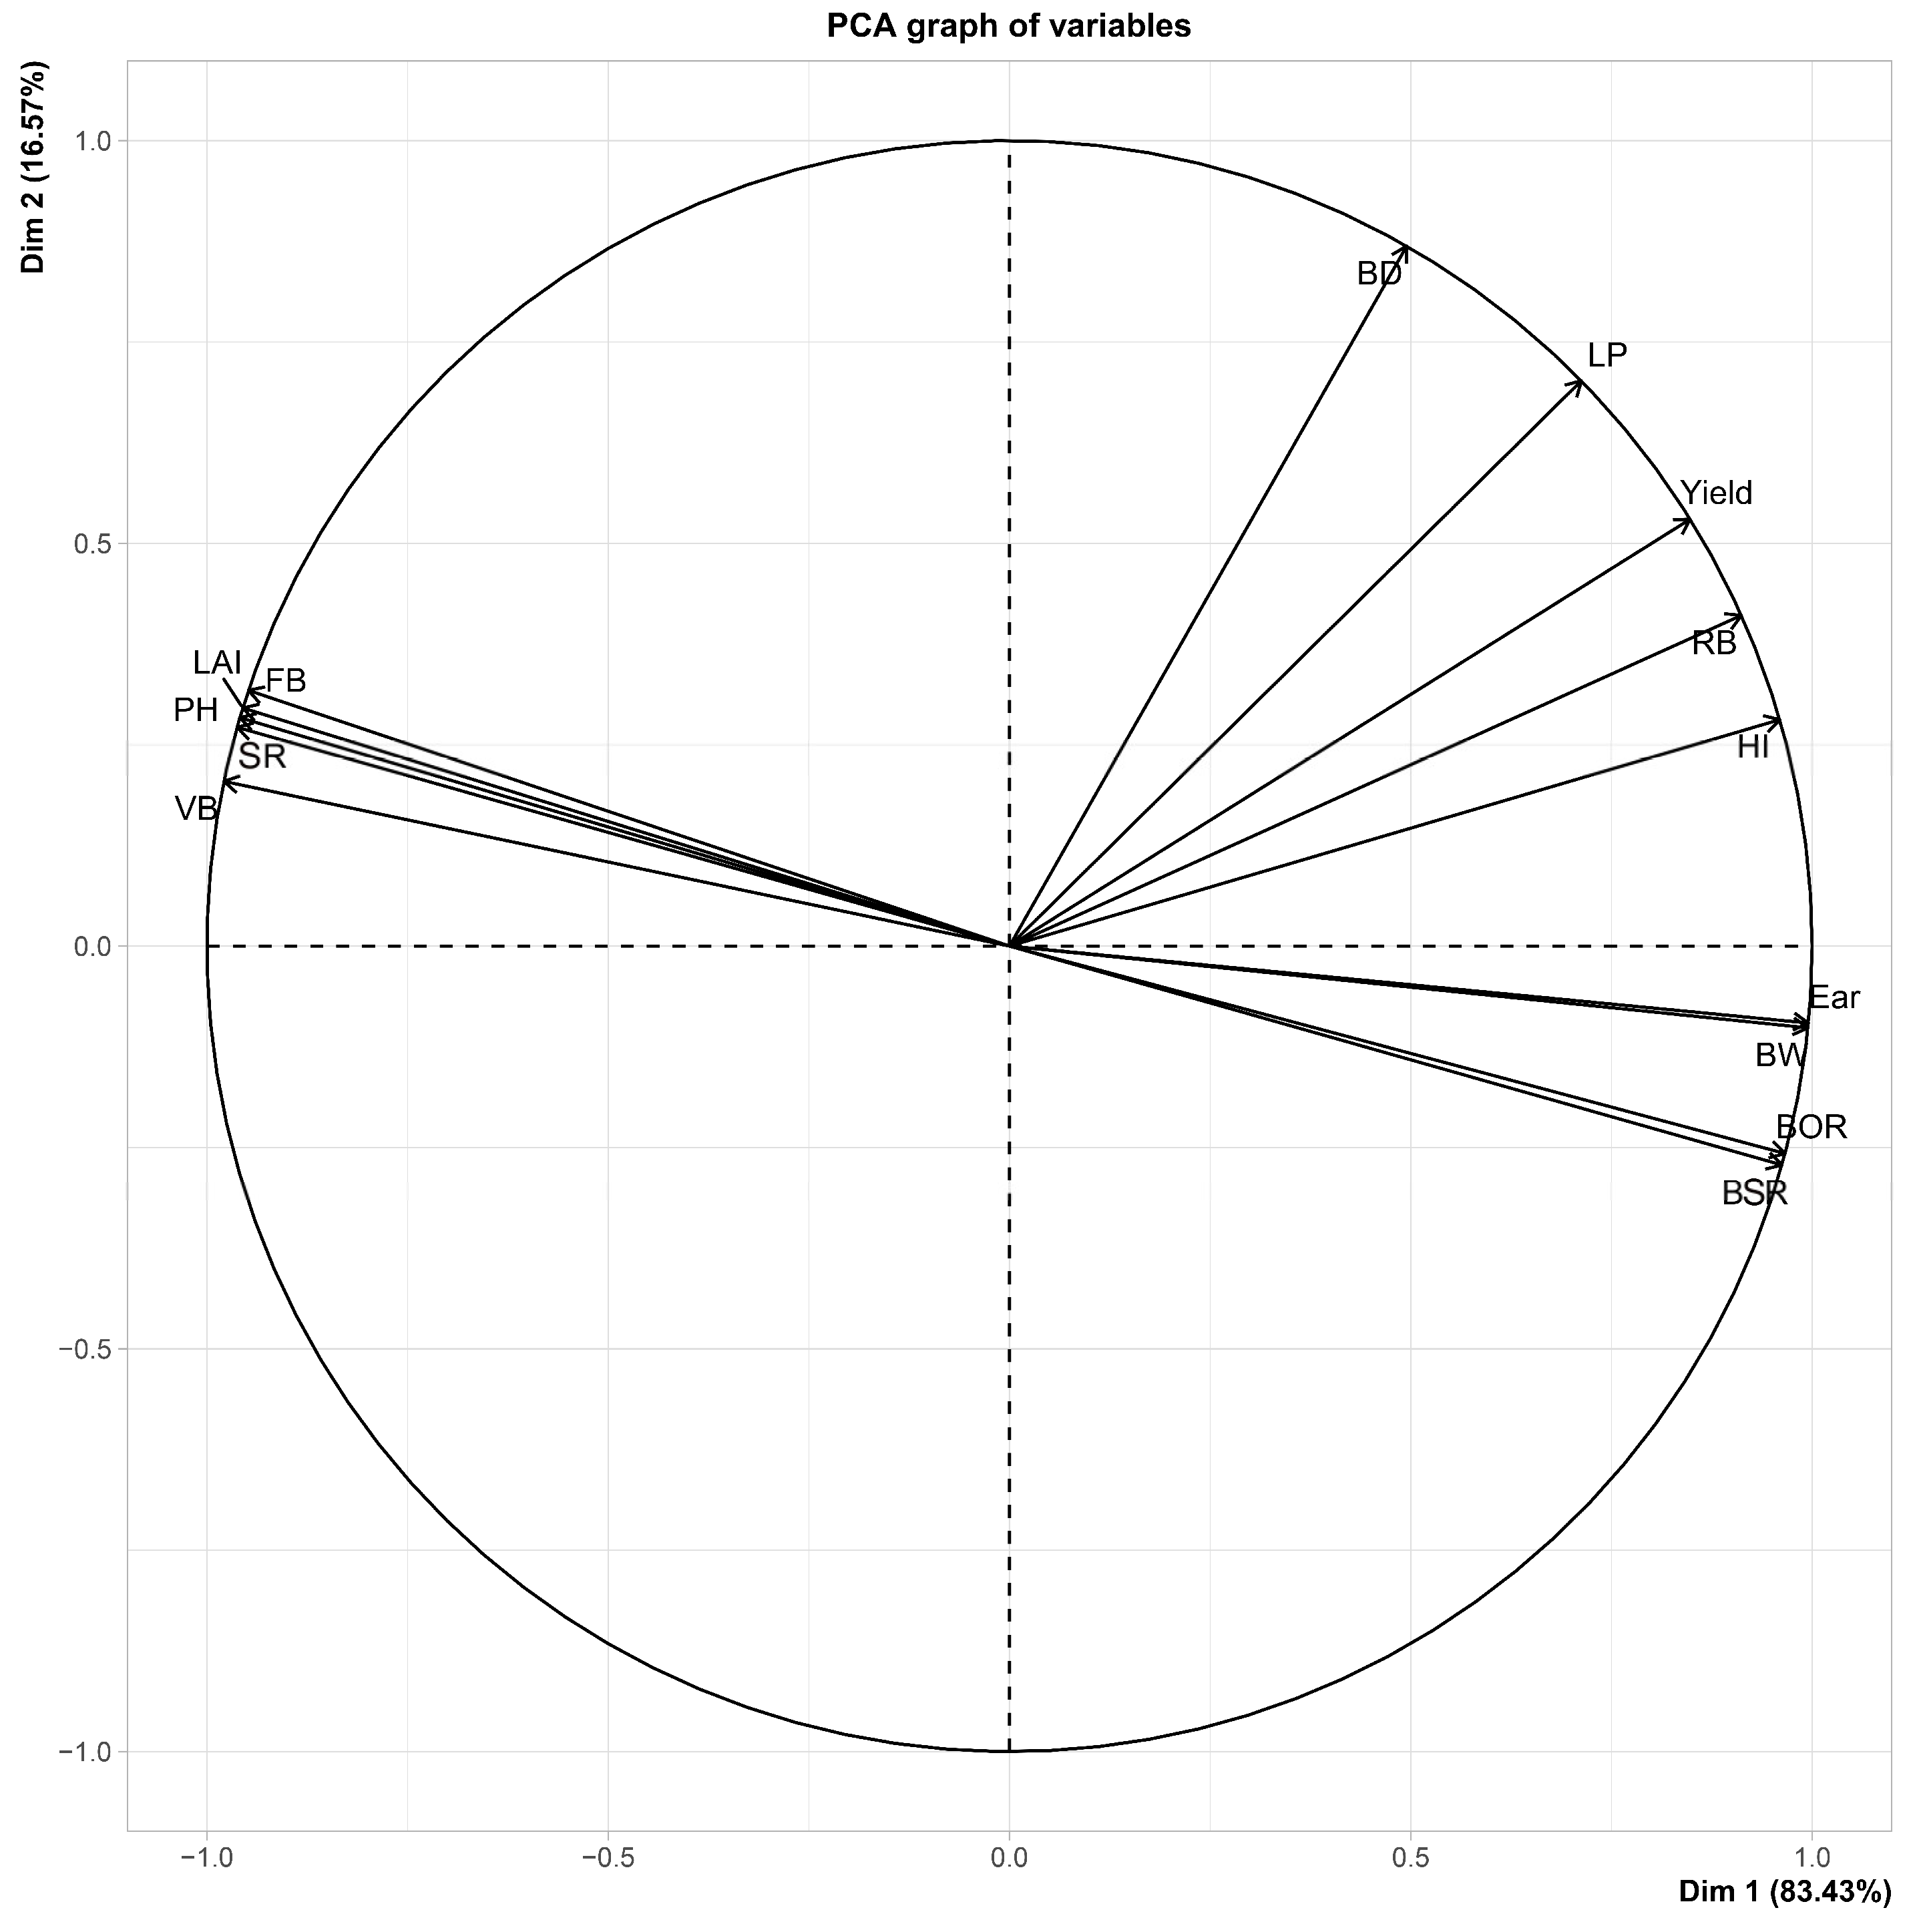
This analysis included fourteen traits (Figure 11). The first two PCs had an eigenvalue higher than one, and PC1 (principal component 1) and PC2 (principal component 2) were obtained. PC1 and PC2 could explain 83.43% and 16.57% of the total variation, respectively. The first component differentiated between treatments and was negatively correlated with leaf area index, plant height, fruit branches, expulsion rate, and vegetative biomass, whereas the strongest positive correlation was observed for seed cotton yields, reproductive biomass, harvest index, earliness, boll weight, boll-setting rate, and boll-opening rate. The second PC2 was positively correlated with boll density and lint percentage.
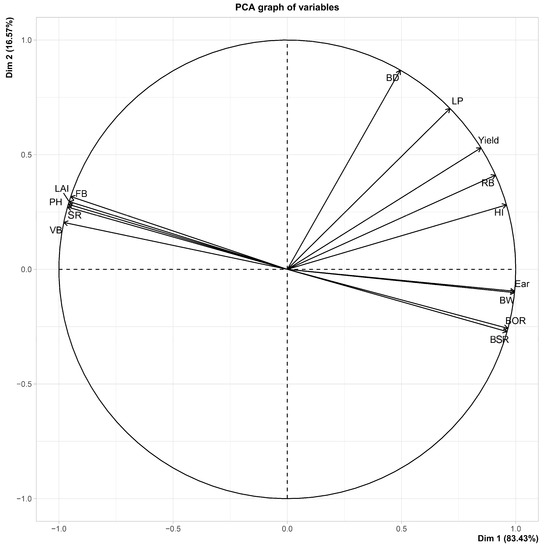
Figure 11.
Principal component analysis (PCA) of cotton growth, yield, and quality. BSR, boll formation rate; BOR, boll opening rate; BW, boll weight; Ear, earliness; HI, harvest index; RB, reproductive biomass; Yield, seed cotton yield; LP, lint percentage; BD, boll density; FB, fruit branches; LAI, leaf area index; PH, plant height; SR, expulsion rate; VB, vegetative biomass.
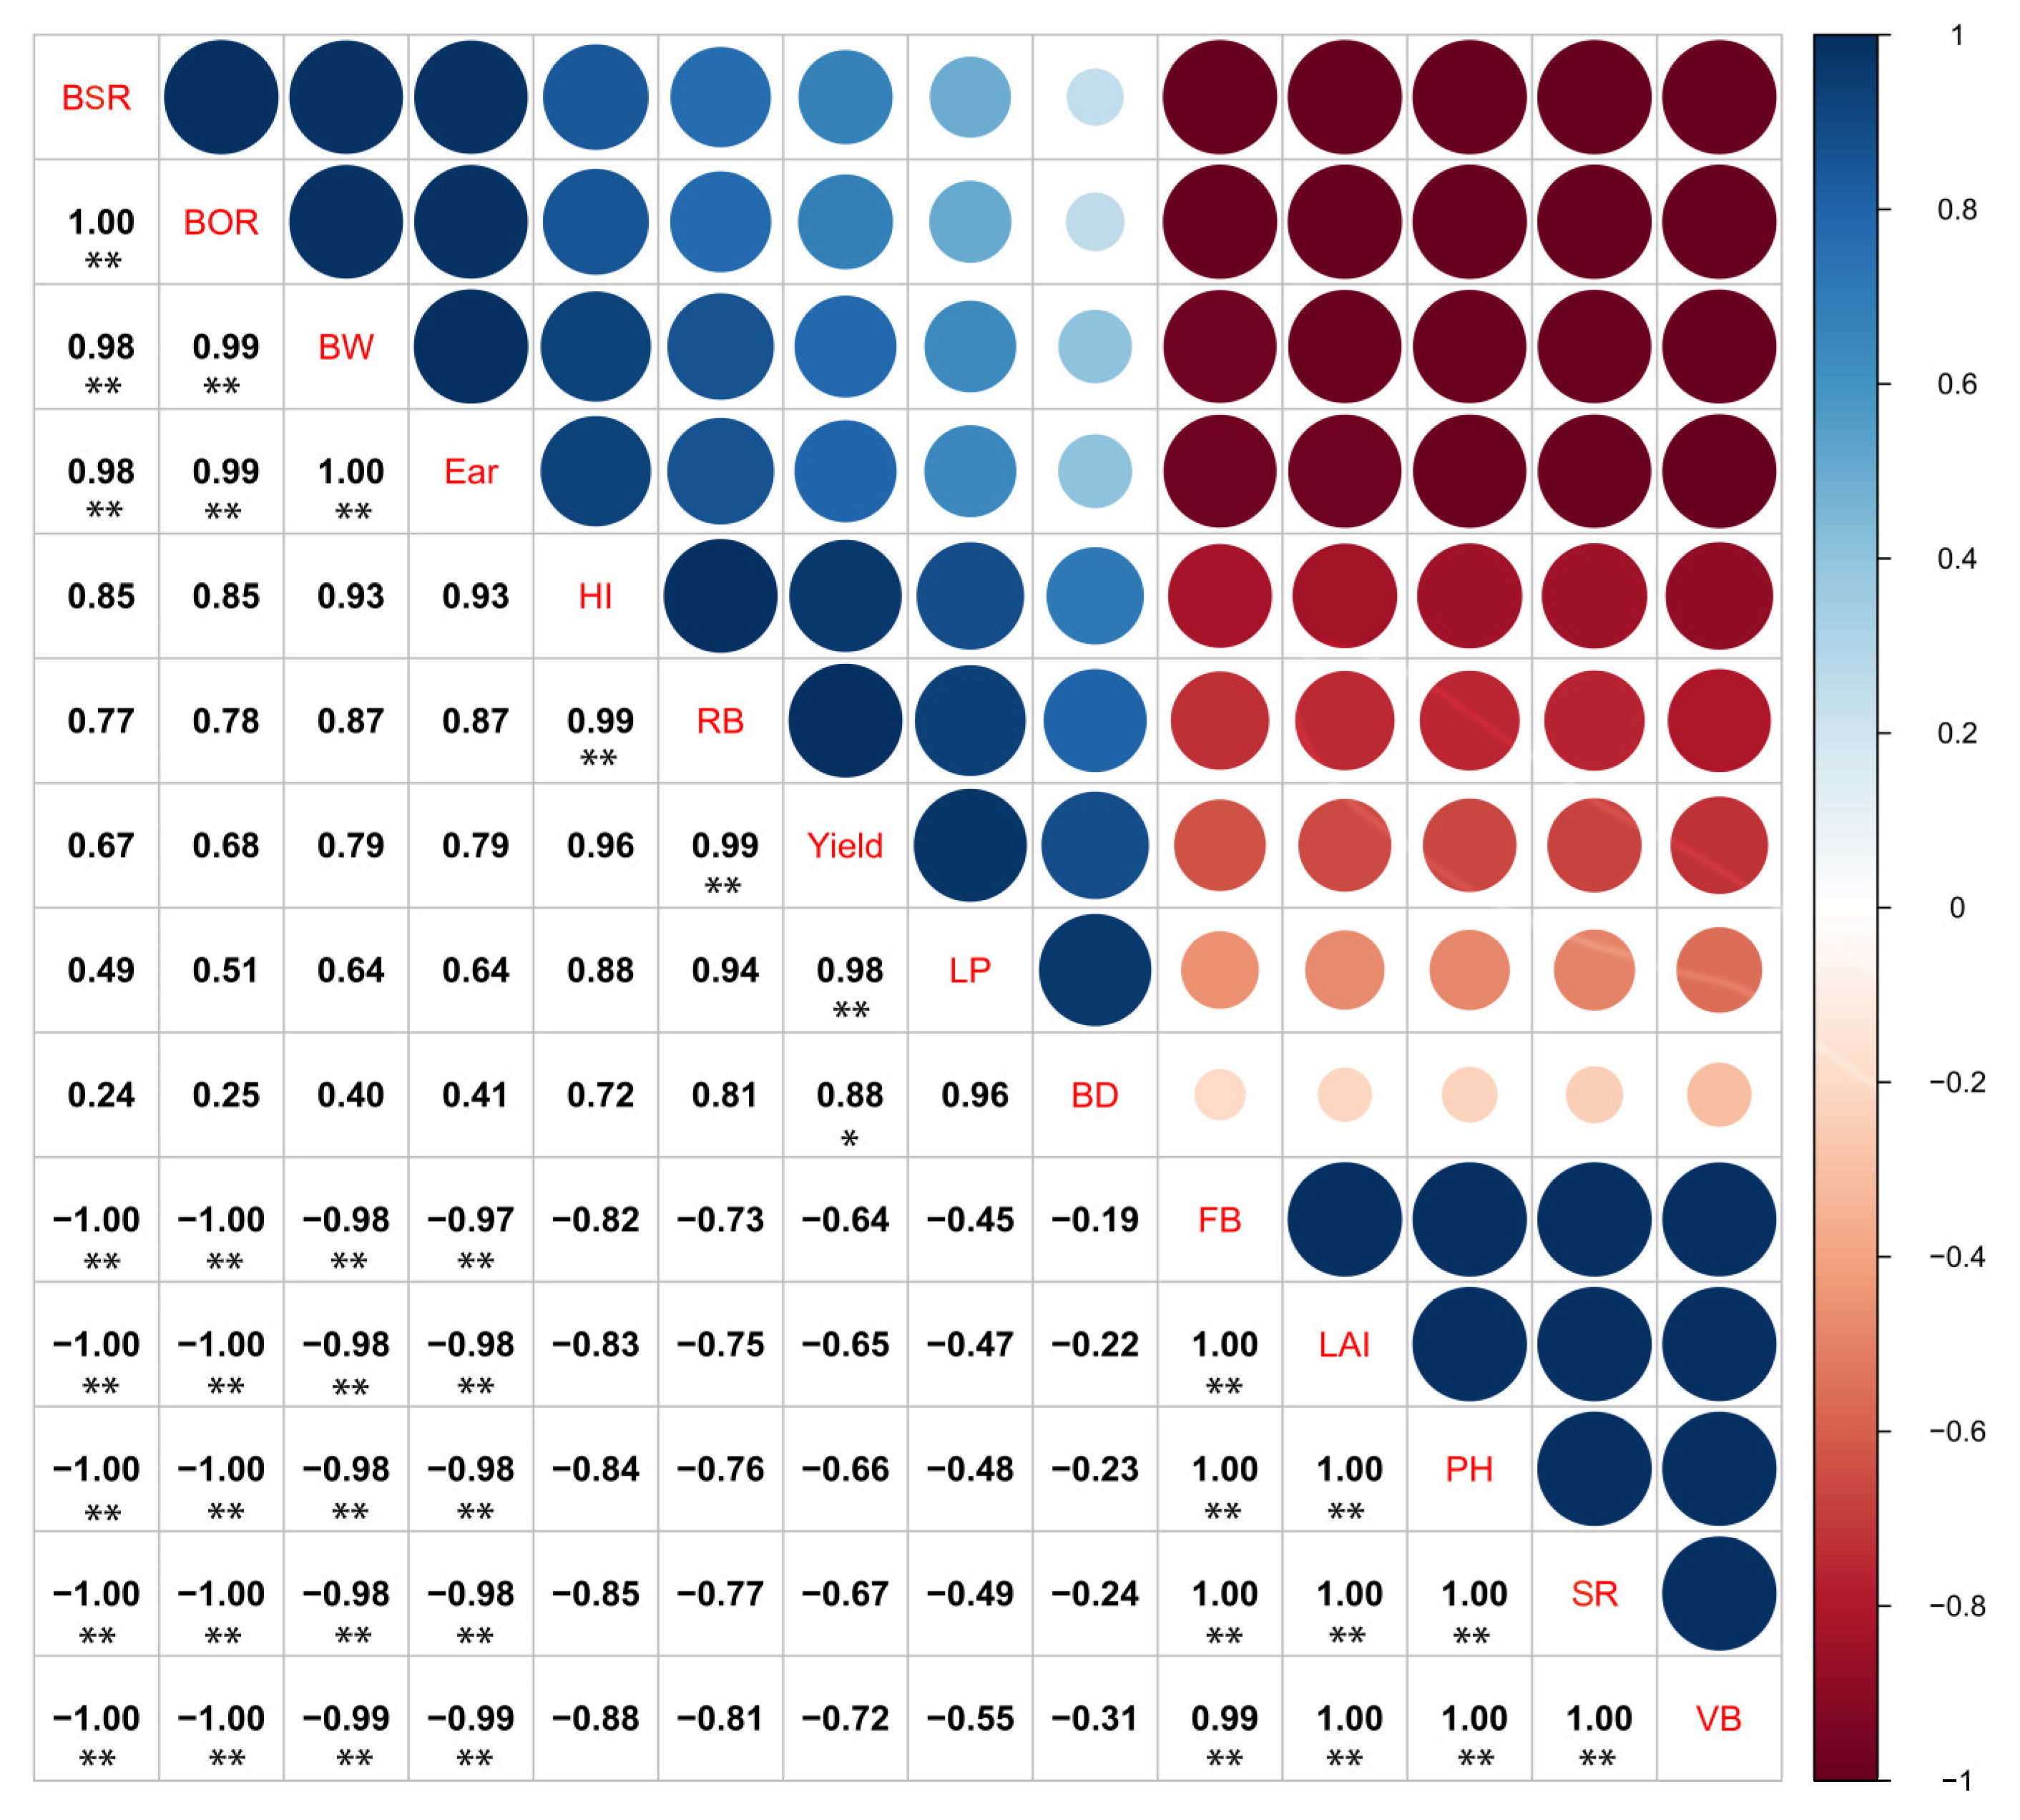
There was a significant positive correlation between boll weight, boll-setting rate, boll-opening rate, and earliness. However, leaf area index, reproductive biomass, and shedding rate were significantly negatively correlated with earliness (Figure 12). Boll weight, boll-setting rate, and boll-opening rate for T13 plants were significantly higher than those of T20 and T27 plants (Table 2, Table 3, Table 4 and Table 5). In contrast, leaf area index, vegetative biomass, and shedding rate for T13 plants were lower than those of T20 and T27 plants (Table 2; Figure 8 and Figure 10), suggesting that T13 plants had higher earliness. Moreover, there was a significant positive correlation between boll density, reproductive biomass, and seed cotton yield. Boll density first increased and then decreased with the postponement of the topping date. However, the influence of ethephon concentration was not significant. The T13 plants had a significant increase in reproductive biomass, which increased their boll weight, effectively reducing the risk of yield reduction caused by decreased boll density.
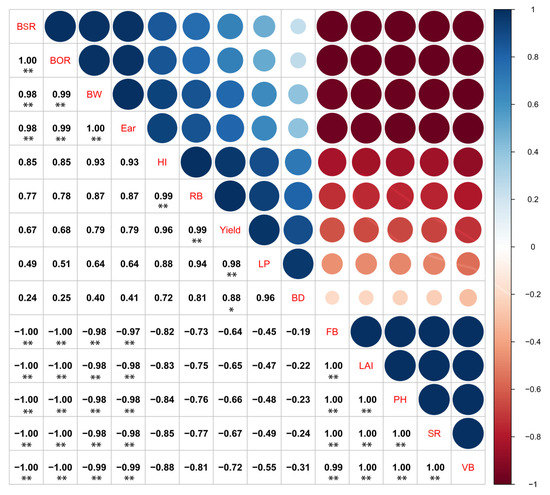
Figure 12.
The matrix of Spearman’s correlation coefficients and 95% confidential intervals. BSR, boll formation rate; BOR, boll opening rate; BW, boll weight; Ear, earliness; HI, harvest index; RB, reproductive biomass; Yield, seed cotton yield; LP, lint percentage; BD, boll density; FB, fruit branches; LAI, leaf area index; PH, plant height; SR, expulsion rate; VB, vegetative biomass. Significant differences are denoted by * (p < 0.05), and ** (p < 0.01).
4. Discussion
4.1. The Effects of Topping Date and Concentration of Ethephon on Yield, HI, and Earliness
Several measures, such as plant topping and spraying with ripening agents, have been used to promote earliness and cotton yield [9,15,17]. We obtained comparable results. For early topping, Hi and earliness of T27 significantly increased by 18.91% and 8.01%, respectively, compared with T13 (p < 0.05) (Table 3, Table 4 and Table 5). Regarding ethephon concentration, the E4000 and E6000 treatments increased HI and earliness by 7.95% and 13.64%, respectively, and by 4.25% and 8.36% (p < 0.05) compared to E2000 (Table 6, Table 7 and Table 8). These findings suggest that early topping and spraying higher concentrations of ethephon are effective measures for improving cotton HI and earliness. Due to its labor-intensive nature, mechanized harvesting is crucial in cotton cultivation as it minimizes labor inputs while simultaneously maximizing production output [7]. To implement mechanized cultivation methods, it is necessary to adopt specific cultivation measures that will improve HI and earliness. Plant topping is conducive to shaping reasonable cotton plant types and boll distribution [18,19]. In this study, early-topping (T13) combined with a higher concentration of ethephon (E4000) increased the number of mid- and late-positioned bolls (Figure 2, Figure 3, Figure 4 and Figure 5), while promoting a more concentrated distribution of cotton bolls and concentrated spitting. Therefore, this measure is suitable for the light and simplified cultivation mode of cotton. In this study, the rainfall in the late growth stages of cotton significantly impacted the tempo-spatial distribution and field growth of cotton bolls. In September, the rainfall levels exceeded 300 mm, which resulted in a significant fall in lower bud bolls (Figure 1). Even though there was a concentration of boll distribution in the 9th and 10th fruit branches under all three topping dates, T13 had a significantly higher earliness than T27.
4.2. Effects of Topping Date and Ethephon Concentration on Dry Matter Partitioning
Cotton seed yields are affected by dry matter partitioning [20]. The proportion of dry matter distribution to the reproductive organs is a key factor in yield determination [21]. Increasing plant density, delaying the topping date, or non-topping potentially leads to strong vegetative growth in cotton, enhancing apical dominance while reducing yields [11]. Dai found that timely plant topping decreases apical dominance in cotton and can thus be used to coordinate the relationship between vegetative and reproductive growth. Therefore, timely plant topping is essential to increasing cotton seed yields and earliness [9]. In this study, the biological yield of T13 plants at 42 days after topping was increased by 19.84% when compared to that of T27 plants (p < 0.05; Figure 10). This shows that early topping increases the proportion of dry matter distribution in reproductive organs, thereby increasing HI. Delaying the plant topping date enhances the growth of vegetative organs, resulting in a significant increase in the leaf area, which causes easy shedding of cotton buds and young bolls [10]. We found that LAI was significantly reduced, which enhanced ventilation and light transmission conditions during the later growth stages and was conducive for boll formation and mechanical cotton harvesting. However, compared to the T20 plants, there was a slight decline in the cotton seed yields of the T13 plants (Table 3, Table 4 and Table 5), possibly because of the reduction in the number of fruit branches. This outcome was in tandem with that of a previous report [22].
4.3. Effects of Topping Date and Ethephon Concentration on Fiber Quality
Cotton, which is globally grown, is a major source of natural fibers. Therefore, fiber quality is an important factor in improving the final economic benefits of cotton [5]. Our findings are consistent with those of a previous study that reported that suitable ethephon concentrations could promote cotton fiber development and increase the fiber length of cotton ovules [19]. In this study, the lint percentage increased and then decreased with increasing ethephon concentration at the same plant topping date. This outcome was attributed to the strong ripening effects of high-concentration ethephon (Table 6, Table 7 and Table 8). The time for the development of immature cotton fibers was reduced after spraying, which decreased the lint percentage. In other studies, ethephon increased the boll-opening rate, which decreased the frost boll ratio, thereby promoting concentrated cotton ripening [23,24]. Herein, bolls in the T13 plants were concentrated in the lower middle (Figure 2, Figure 3, Figure 4 and Figure 5). Moreover, late spraying of higher concentrations of ethephon increased the boll-opening rate and earliness. Even though the T13 plants exhibited decreased boll density, there were no significant decreases in yield, possibly because ethephon promoted the transfer of nutrients from leaves and boll shells to cottonseeds and cotton fibers, thereby increasing the boll weights. This finding was consistent with that of Meng [25], which confirms that spraying higher concentrations of ethephon reduced the risk of yield loss in early-topped cotton plants.
5. Conclusions
Early topping and spraying at higher ethephon concentrations increased earliness in the late-sowing and high-density cultivation models. Both techniques can effectively alleviate the challenges associated with high vegetative growth and late maturation. Early topping accelerated the aging rate of cotton leaves during the late growth stages by decreasing the SPAD, Pn, and LAI of functional leaves on the main cotton stem. Early topping also promoted the transfer of dry matter to reproductive organs, which increased the boll weight and maintained stable production. Moreover, higher ethephon concentrations increased the boll-opening rate and fiber quality of concentrated bolls. The HI and earliness under E4000 and E6000 were higher by 7.95% and 13.64%, and by 7.95% and 13.64%, relative to the corresponding values under E2000, respectively. Our findings suggest that early topping (13 July) and spraying higher ethephon concentrations (4000 mL/ha) is an ideal approach for achieving light and simplified cotton cultivation.
Author Contributions
L.L., C.L., H.S., L.Z., X.L., Z.B. and L.T. initiated and designed the research. S.W., H.S., K.Z., Y.Z., H.Z., A.L. and J.Z. performed the experiments and collected the data. S.W., H.S. and L.T. wrote the code and tested the methods. S.W., L.Z. and H.S. analyzed the data and wrote the manuscript. All authors have read and agreed to the published version of the manuscript.
Funding
This study was supported by grants from the National Natural Science Foundation of China (No. 32272220 and No. 32172120).
Data Availability Statement
Data are available on request.
Conflicts of Interest
The authors declare that they have no known competing financial interests or personal relationships that could have appeared to influence the work reported in this paper.
References
- Dai, J.; Li, W.; Zhang, D.; Tang, W.; Li, Z.; Lu, H.; Kong, X.; Luo, Z.; Xu, S.; Xin, C.; et al. Competitive yield and economic benefits of cotton achieved through a combination of extensive pruning and a reduced nitrogen rate at high plant density. Field Crops Res. 2017, 209, 65–72. [Google Scholar] [CrossRef]
- Khan, A.; Najeeb, U.; Wang, L.; Tan, D.K.Y.; Yang, G.; Munsif, F.; Ali, S.; Hafeez, A. Planting density and sowing date strongly influence growth and lint yield of cotton crops. Field Crops Res. 2017, 209, 129–135. [Google Scholar] [CrossRef]
- Dai, J.; Kong, X.; Zhang, D.; Li, W.; Dong, H. Technologies and theoretical basis of light and simplified cotton cultivation in China. Field Crops Res. 2017, 214, 142–148. [Google Scholar] [CrossRef]
- Qi, J.; Zhang, Y.; Dai, J.; Xu, S.; Zhang, D.; Nie, J.; Sun, X.; Dong, H. Late-planted short-season cotton without plastic mulching is an alternative to early-planted mulched full-season cotton. Ind. Crops Prod. 2021, 163, 113325. [Google Scholar] [CrossRef]
- Gwathmey, C.O.; Clement, J.D. Alteration of cotton source–sink relations with plant population density and mepiquat chloride. Field Crops Res. 2010, 116, 101–107. [Google Scholar] [CrossRef]
- Yang, G.-Z.; Luo, X.-J.; Nie, Y.-C.; Zhang, X.-L. Effects of Plant Density on Yield and Canopy Micro Environment in Hybrid Cotton. J. Integr. Agric. 2014, 13, 2154–2163. [Google Scholar] [CrossRef]
- Dai, J.; Li, W.; Tang, W.; Zhang, D.; Li, Z.; Lu, H.; Eneji, A.E.; Dong, H. Manipulation of dry matter accumulation and partitioning with plant density in relation to yield stability of cotton under intensive management. Field Crops Res. 2015, 180, 207–215. [Google Scholar] [CrossRef]
- Chen, Y.; Dong, H. Mechanisms and regulation of senescence and maturity performance in cotton. Field Crops Res. 2016, 189, 1–9. [Google Scholar] [CrossRef]
- Dai, J.; Dong, H. Intensive cotton farming technologies in China: Achievements, challenges and countermeasures. Field Crops Res. 2014, 155, 99–110. [Google Scholar] [CrossRef]
- Yang, Y.; Ouyang, Z.; Yang, Y.; Liu, X. Simulation of the effect of pruning and topping on cotton growth using COTTON2K model. Field Crops Res. 2008, 106, 126–137. [Google Scholar] [CrossRef]
- Dai, J.; Tian, L.; Zhang, Y.; Zhang, D.; Xu, S.; Cui, Z.; Li, Z.; Li, W.; Zhan, L.; Li, C.; et al. Plant topping effects on growth, yield, and earliness of field-grown cotton as mediated by plant density and ecological conditions. Field Crops Res. 2022, 275, 108337. [Google Scholar] [CrossRef]
- Liang, F.-B.; Yang, C.-X.; Sui, L.-L.; Xu, S.-Z.; Yao, H.-S.; Zhang, W.-F. Flumetralin and dimethyl piperidinium chloride alter light distribution in cotton canopies by optimizing the spatial configuration of leaves and bolls. J. Integr. Agric. 2020, 19, 1777–1788. [Google Scholar] [CrossRef]
- Nie, J.; Li, Z.; Zhang, Y.; Zhang, D.; Xu, S.; He, N.; Zhan, Z.; Dai, J.; Li, C.; Li, W.; et al. Plant pruning affects photosynthesis and photoassimilate partitioning in relation to the yield formation of field-grown cotton. Ind. Crops Prod. 2021, 173, 114087. [Google Scholar] [CrossRef]
- Nie, J.-J.; Yuan, Y.-C.; Qin, D.-L.; Liu, Y.-H.; Wang, S.-L.; Li, J.-P.; Zhang, M.-L.; Zhao, N.; Guo, W.-J.; Qi, J.; et al. Spatial distribution of bolls affects yield formation in different genotypes of Bt cotton varieties. J. Integr. Agric. 2019, 18, 2492–2504. [Google Scholar] [CrossRef]
- Fang, S.; Gao, K.; Hu, W.; Wang, S.; Chen, B.; Zhou, Z. Foliar and seed application of plant growth regulators affects cotton yield by altering leaf physiology and floral bud carbohydrate accumulation. Field Crops Res. 2019, 231, 105–114. [Google Scholar] [CrossRef]
- Zhang, W.; Hu, Y.; Liu, J.; Wang, H.; Wei, J.; Sun, P.; Wu, L.; Zheng, H. Progress of ethylene action mechanism and its application on plant type formation in crops. Saudi J. Biol. Sci. 2020, 27, 1667–1673. [Google Scholar] [CrossRef] [PubMed]
- Arif, M.; Kareem, S.H.S.; Ahmad, N.S.; Hussain, N.; Yasmeen, A.; Anwar, A.; Naz, S.; Iqbal, J.; Shah, G.A.; Ansar, M. Exogenously Applied Bio-Stimulant and Synthetic Fertilizers to Improve the Growth, Yield and Fiber Quality of Cotton. Sustainability 2019, 11, 2171. [Google Scholar] [CrossRef]
- Zhao, W.; Yan, Q.; Yang, H.; Yang, X.; Wang, L.; Chen, B.; Meng, Y.; Zhou, Z. Effects of mepiquat chloride on yield and main properties of cottonseed under different plant densities. J. Cotton Res. 2019, 2, 10. [Google Scholar] [CrossRef]
- Zhu, L.; Dou, L.; Shang, H.; Li, H.; Yu, J.; Xiao, G. GhPIPLC2D promotes cotton fiber elongation by enhancing ethylene biosynthesis. iScience 2021, 24, 102199. [Google Scholar] [CrossRef]
- Dong, H.; Li, W.; Tang, W.; Li, Z.; Zhang, D.; Niu, Y. Yield, quality and leaf senescence of cotton grown at varying planting dates and plant densities in the Yellow River Valley of China. Field Crops Res. 2006, 98, 106–115. [Google Scholar] [CrossRef]
- Chen, Y.; Kong, X.; Dong, H. Removal of early fruiting branches impacts leaf senescence and yield by altering the sink/source ratio of field-grown cotton. Field Crops Res. 2018, 216, 10–21. [Google Scholar] [CrossRef]
- Liu, Z.-Y.; Chen, Y.; Li, Y.-B.; Chen, C.; Ma, Y.-X.; Chen, D.-H.; Zhang, X.; Zhou, M. Construction of optimum number of fruiting nodes benefit high yield in cotton population. Ind. Crops Prod. 2020, 158, 113020. [Google Scholar] [CrossRef]
- Deguine, J.-P.; Ferron, P.; Russell, D. Sustainable pest management for cotton production. A review. Agron. Sustain. Dev. 2008, 28, 113–137. [Google Scholar] [CrossRef]
- Wang, H.; Gao, K.; Fang, S.; Zhou, Z. Cotton Yield and Defoliation Efficiency in Response to Nitrogen and Harvest Aids. Agron. J. 2019, 111, 250–256. [Google Scholar] [CrossRef]
- Meng, L.; Zhang, L.-Z.; Qi, H.-K.; DU, M.-W.; Zuo, Y.-L.; Zhang, M.-C.; Tian, X.-L.; Li, Z.-H. Optimizing the application of a novel harvest aid to improve the quality of mechanically harvested cotton in the North China Plain. J. Integr. Agric. 2021, 20, 2892–2899. [Google Scholar] [CrossRef]
Disclaimer/Publisher’s Note: The statements, opinions and data contained in all publications are solely those of the individual author(s) and contributor(s) and not of MDPI and/or the editor(s). MDPI and/or the editor(s) disclaim responsibility for any injury to people or property resulting from any ideas, methods, instructions or products referred to in the content. |
© 2023 by the authors. Licensee MDPI, Basel, Switzerland. This article is an open access article distributed under the terms and conditions of the Creative Commons Attribution (CC BY) license (https://creativecommons.org/licenses/by/4.0/).


