Article

Enhancing Red Currant Berry Quality through Fertilization Using Compost from Municipal Sludge and from Vegetal Waste

by
Georgica Pandelea (Voicu)
1,
Mirela Florina Călinescu
2,*,
Ivona Cristina Mazilu
2,
Daniela Simina Ștefan
1 and
Camelia Ungureanu
1,*
1
Faculty of Chemical Engineering and Biotechnologies, University Politehnica of Bucharest, 1-7, Polizu Street, 011061 Bucharest, Romania
2
Research Institute for Fruit Growing Pitesti, 402 Marului Street, 117450 Pitesti, Romania
*
Authors to whom correspondence should be addressed.
Agronomy 2023, 13(5), 1363; https://doi.org/10.3390/agronomy13051363
Submission received: 24 April 2023 / Revised: 5 May 2023 / Accepted: 10 May 2023 / Published: 12 May 2023
(This article belongs to the Section Horticultural and Floricultural Crops)

Abstract

:
Adding compost to the soil is an ecological and economical approach to providing the nutrients needed to support crops, improve soil characteristics, and increase the orchard’s durability. Over three years, at the Research Institute for Fruit Growing Pitesti, Romania, data regarding the influence of fertilization with municipal sludge and vegetal origin compost (MSVOC, 20 and 40 t ha−1 doses) and vegetal origin compost (VOC, 30 and 40 t ha−1 doses) on berry quality at ‘Jonker Van Tets’ red currant cv. Were recorded. Berry dry matter, soluble solids, sugar, titratable acidity, vitamin C, phenolic, and anthocyanin content are discussed. The correlations between berry quality indicators with climatic factors (temperatures and sunshine hours) and soil chemical characteristics are discussed. Strong correlations have been identified between anthocyanins, vitamin C, and phenolics with average temperature, maximum temperature, and sunshine hours in April. Except for Fe and Mn, berry phenolics were negatively correlated with all other soil quality indicators. In the third after the application, the results indicated that VOC 40 t ha−1 had a beneficial effect, increasing berry weight, and TTA, while VOC 30 t ha−1 significantly increased DW, TTA, and vitamin C content. Therefore, vegetal origin compost can be used as fertilizer in the sustainable growth of red currants.

1. Introduction

Red currant (Ribes rubrum) is a member of the genus Ribes (family Grossulariaceae) [1,2,3]. Red currants are cultivated mainly in Europe [4] in areas that fulfill the 800–1100 required chill hours and the 150 to 180 growing degree days. They withstand lower winter temperatures, such as −34°C [5]. Although in Romania red currant is cultivated from the plain area to the area of high hills, it is less adapted to hot summers. Partial shading along with northern to northeastern exposure is beneficial, as it provides cooler environmental conditions and higher humidity, and red currants’ leaves will be protected from direct sun. Ropelewska [6] provides an overview of red currant cultivation in Poland. According to the author, the most favorable soils for red currant are loamy-sandy or sand, with an acid-to-alkaline reaction, and the pH range of 6.0–6.5 is considered ideal for red currant growth.
The center of red currant diversity is located in Northern Europe, Scandinavia, and eastern neighbors of the Baltic Sea [7,8]. Wiethold [8] appreciated that the first red currant crops were established in Holland, Denmark, the coastal plains around the Baltic Sea, and northern France or Belgium. It produces small, red, juicy globular fruits. Like other berries, red currant contains primary nutrients (sugar, organic acids, minerals, and dietary fiber, but also small lipid and protein contents) and bioactive compounds, among which vitamin C and phenolic compounds (anthocyanins mainly) are found in the highest concentration and are responsible for red currant health-related activities [9]. However, their taste is mainly sour rather than sweet; red currants are used for fresh consumption but also may be processed into a wide diversity of products such as juices, liqueurs, wine jams, dehydrated food, etc. Their sour taste makes them attractive to a small segment of consumers. However, the low sugar content successfully places them in the group of fruits suitable for the diet of diabetics [10,11,12,13].
Generally, it is well-known that berries’ chemical constituents‘ levels vary depending on cultivar, pedoclimatic condition, phytosanitary status, plant exposure to sunlight (as leaves sunburns are frequently mentioned in unprotected orchards), agricultural practices (plant nutrition, soil management, water regime), and time of harvesting [14]. Changes in red currant berries’ nutritional and functional properties (Ribes rubrum L.) occur during growth and maturation [1]. Zdunić et al. [1] also noted that these properties can vary depending on factors such as cultivar, pedoclimatic condition, phytosanitary status, plant exposure to sunlight, agricultural practices, and harvesting time, especially in high-density orchard soil [14].
Nutrient supplementation is an essential condition of efficient agriculture, but it can cause environmental pollution when fertilization is carried out in excess. An alternative to classic fertilization programs is the use of compost, to which several beneficial effects are attributed. In sustainable agriculture, compost is seen as an option that also solves ecological problems related to sludge utilization from city sewage treatment plants [15,16,17]. In addition to stimulating crop production, composts enrich soils in organic matter, have the property of gradual release of nutrients, improve the soil’s physical properties, especially water retention capacity and hydraulic conductivity, and reduce the degree of soil compaction [18,19]. This can lead to more robust and healthier plant growth, larger yields, and improved fruit quality. Compost also helps regulate soil pH, preventing nutrient deficiencies and other problems that can affect berry production [20]. Additionally, compost can help suppress certain soil-borne diseases and pests, reducing the need for chemical treatments. By reducing the need for chemical treatments, compost can help ensure that red currant is grown sustainably and is environmentally friendly [21].
Briefly, the efficiency of compost fertilization depends on several factors, such as organic matter content, the load of heavy metals, and environmental factors that influence the mineralization rate (environmental temperature, humidity, the activity of microorganisms, etc.). Finally, the residual effect of organic matter in improving soil properties lasts for many years after fertilization, and this increases the economic efficiency of the plantation.
Starting from these considerations, the objective of the article is to analyze how the two types of compost and the applied doses influence the quality of red currant berries. In the 2020–2022 period, at the Research Institute for Fruit Growing Pitești, Romania, data regarding the influence of fertilization with two origin compost (MSVOC = municipal sludge with vegetal waste origin compost and VOC = vegetal waste origin compost) on berry quality at ‘Jonker Van Tets’ red currant cv. (dry weight, total soluble solids, total sugar, total titratable acidity, vitamin C, total phenolics, and total anthocyanins) were recorded.

2. Materials and Methods

2.1. Vegetal Material and Experiment Design

The study was performed at the Research Institute for Fruit Growing Pitesti Romania (RIFG, 44.8982° North, 24.8674° East, 285 m above sea level) in the red currant orchard. The experimental area is characterized by a temperate-continental climate, with an average multiannual temperature of 10 °C and an annual quantity of precipitations of 678 mm (Figure 1). The red currant’s orchard soil is an aric anthrosoil, with a loamy to loamy-sandy texture, with a moderately acidic pH. During the study, the soil was cultivated along the plant rows and kept as permanent sod between rows; sprinkler irrigation was applied to maintain an optimal soil humidity level.
Some climatic parameters were correlated to berry quality parameters: mean (Tmean), maximum (Tmax), and minimum (Tmin) daily air temperatures and the monthly sum of sunshine hours (Sh). All data were collected near the red currant orchard with an RIFG meteorological platform (iMETOSag weather station-Pessl Instruments GmbH, Weiz, Austria).
The plantation was established in the spring of 2016, with a density of 3333 plants/ha (3 × 1 m), and a bush-shaped crown. The studied cultivar is ‘Jonkheer Van Tets,’ a red currant cultivar (Ribes rubrum), known for its large, juicy, and sweet berries, as well as its disease resistance and good yield. The cultivar is widely grown in Europe, especially in Northern Europe and Scandinavia, where the climate is well-suited for its production.
In the first experimental year, four compost variants (2 compost types × 2 different doses) were administered and incorporated into the soil in a single application. No other fertilizer was used. The two compost types were compost MSVOC, obtained from municipal sludge and vegetal residues, and compost VOC, obtained from vegetal residues (Table 1). Some chemical parameters of the municipal and vegetal origin compost, vegetal origin compost, untreated soil, and soil after adding composts are presented in Table 1. As presented, soil pH and humus content varied from 5.49 (in untreated soil) to 6.38 (VOC 40 t ha−1) and from 2.05 (untreated variant) to 3.26 (VOC 40 t ha−1), and a similar trend was registered for soil total nitrogen (0.12–0.20), total organic C (0.71–3.19), and mobile phosphorous (PAL, 51.67–177.00), although for potassium the lowest and the highest levels were reached in untreated soil (121.00 mg/kg) and in soil treated with MSVOC 20 t ha−1 (213.00 mg kg−1). Zn level varied from 1.9 mg kg−1 (control) to 14.70 mg kg−1 (MSVOC 40 t ha−1), and Cu varied between 5.90 mg kg−1 to 6.67 mg kg−1, while for Fe and Mn variations from 106.53 (VOC 40 t ha−1) to 152.17 mg kg−1 (MSVOC 40 t ha−1) and from 29.97 (VOC 40 t ha−1) to 53.00 mg kg−1 (control) were found.
A bifactorial experiment (A × B, randomized block design) was set up in 2020, where A factor was the compost treatment, having five levels (V1 = control-untreated, V2 = Compost MSVOC −20 t ha−1, V3 = Compost MSVOC −40 t ha−1, V4 = Compost VOC −30 t ha−1, and V5 = Compost VOC −40 t ha−1, Table 2) while B factor was the experimental year, with three levels (2020, 2021, and 2022). The experiment was organized into three replications, with three plants per replication (a total of nine plants per treatment).
The five compost treatments’ (CT) effects on berries quality were studied. Berries quality fluctuation depending on the experimental year (Y) and compost treatments × year (CT × Y) effects have also been discussed.

2.2. Berry Quality Determinations

All determinations were performed in three replications per year. Berry weight was determined by weighing 100 berries samples. Dry matter was calculated with the formula (Dry weight/Fresh weight) × 100 = percentage of dry matter (DM%), where Fresh and Dry weight is obtained by weighing the berry sample before and after the moisture has fully evaporated in a laboratory oven.
The refractometric method (using a Palete Atago digital refractometer) was used for total soluble content determination, while for total sugar content determination, the Fehling-Soxhlet method was followed. This method involves an ethanolic extraction step (obtaining the Soxhlet extract), followed by the hydrolysis of the extract with hydrochloric acid, and then the determination of total sugar by titrating the solution with Fehling’s reagent. Gergen’s [22] methodology was used for vitamin C content determination. This method is based on the ability of ascorbic acid to reduce iodine to iodide in an acidic environment. The oxidation of ascorbic acid is indicated by a change in the color of the solution from red-orange to yellow-green, due to the formation of free iodine.
An ethanolic extract (mixture of ethanol and acidified water with hydrochloric acid) was used to determine the total content of anthocyanins (TAC). The method proposed by Fuleki (1968) [23] was followed. This method is based on the reactions of anthocyanins with magnesium chloride with the formation of a complex that has a maximum absorption at 535 nm. The results were expressed as mg cyanidin 3-glucoside equivalents per kg fresh berries (mg C3G kg−1). To determine the total content of phenolic compounds, the Singleton et al. [24,25] method was used. The method is based on the oxidation of polyphenols with phosphoric acid and the reaction with the Folin-Ciocalteu reagent. Total phenolic content (TPC) was expressed as mg gallic acid equivalents per kg fresh berries (mg GAE kg−1).

2.3. Data Statistical Analysis

Berries quality parameters were analyzed with IBM SPSS 20 program. The Shapiro–Wilk test was used to test data normality (Mishra et al. [26]), while the Levene test was used to test variances homogeneity. Data normally distributed and with variance homogeneity accepted were subjected to two-way ANOVA followed by Duncan’s Multiple Range Test (the significance level was set to 0.05) to highlight the composts and year condition influence and differences between means. When data were not normally distributed (i.e., TSC and TAC), a nonparametric test (Kruskal-Wallis H Test) was run, followed by Dunn’s pairwise test, to compare the groups (with a significance level of 0.05). Correlations between variables and climatic factors/compost chemical characteristics were also calculated (Pearson’s correlation coefficient) and discussed.

3. Results

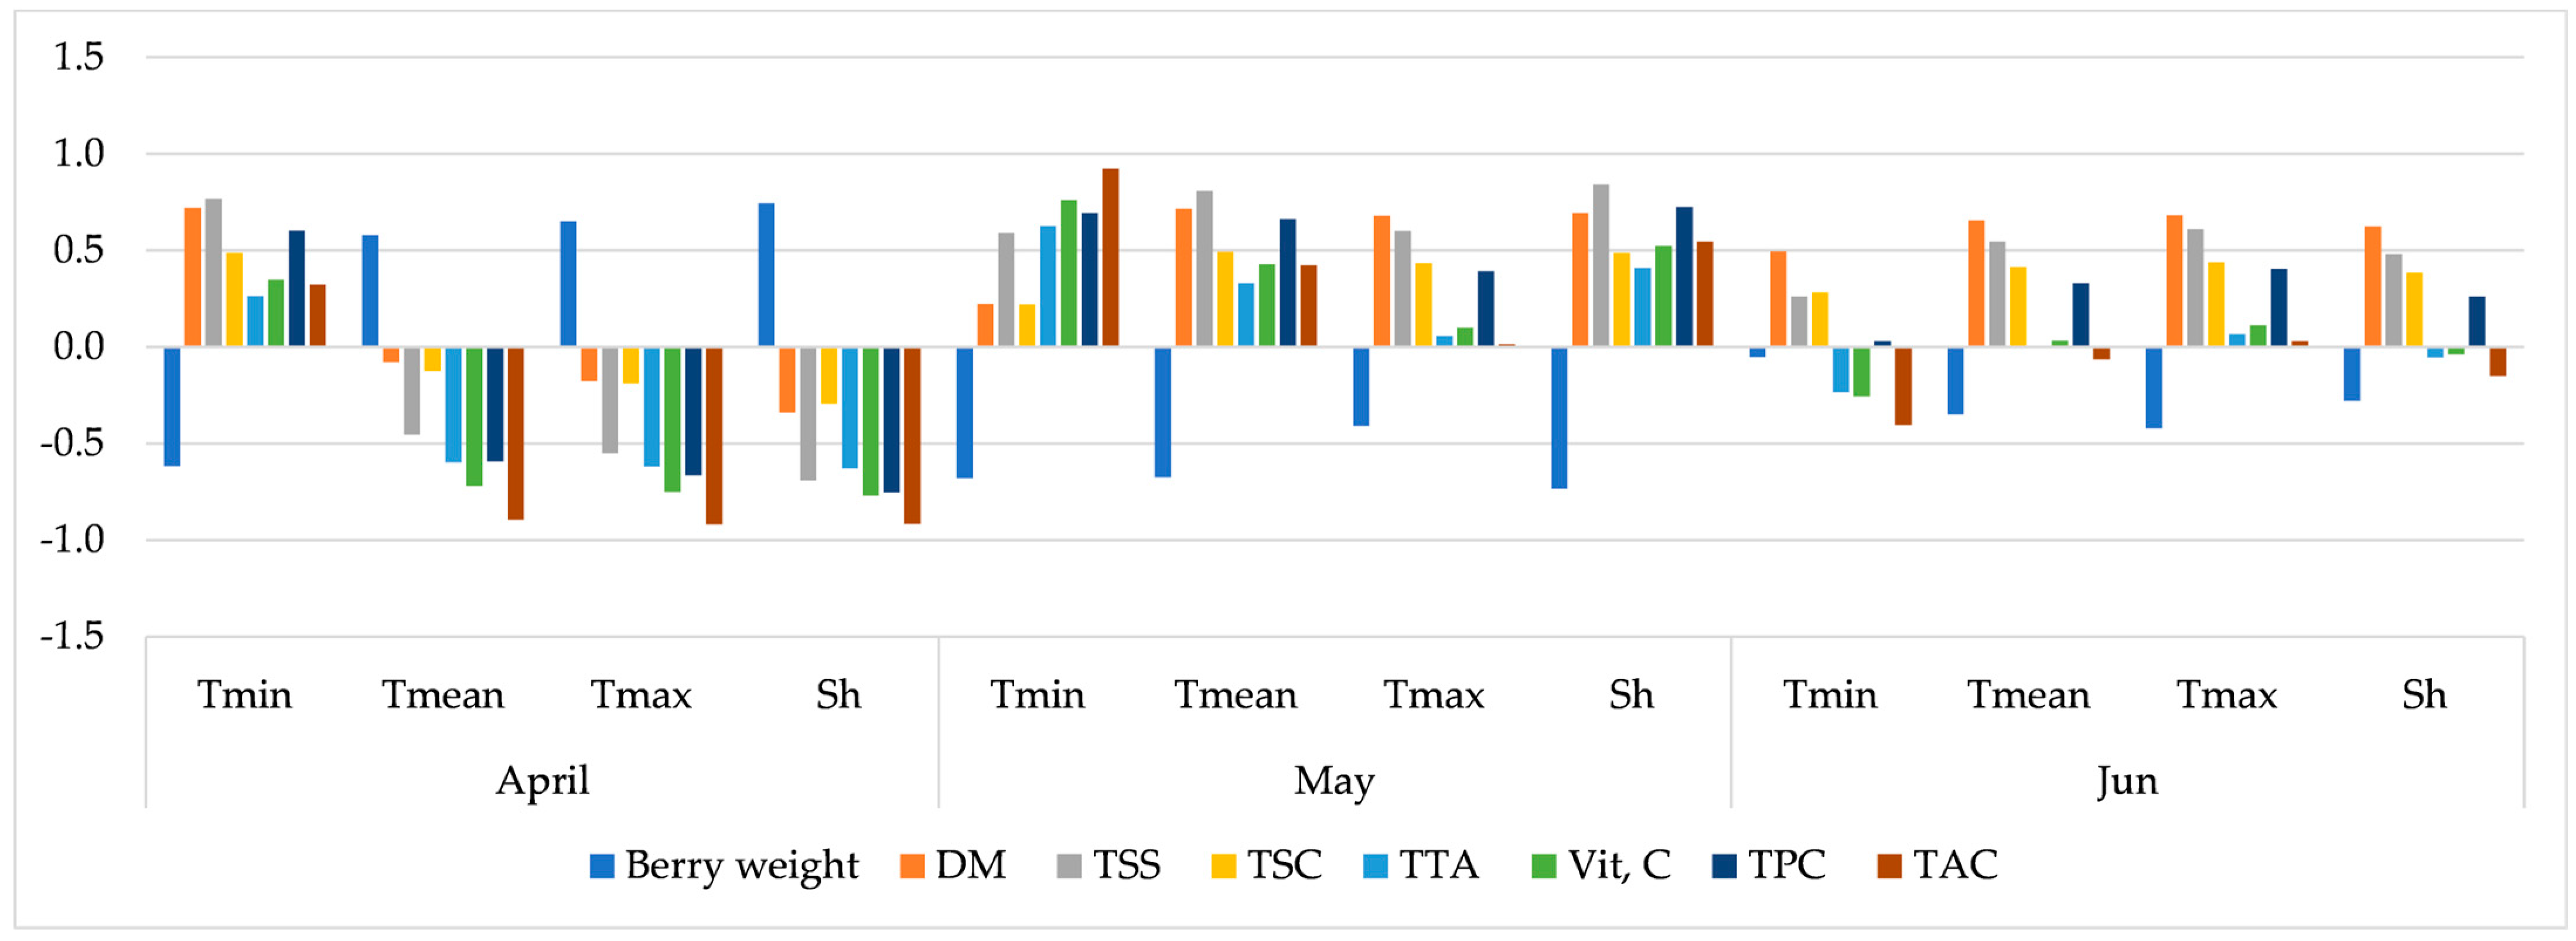
3.1. Correlations between Berries Quality and Climatic Parameters

Analysis of the correlation presented in Figure 2 indicates that the only positive correlations with berry weight were noted for Tmean (r = 0.578 ***), Tmax (r = 0.650 ***), and Sh (r = 0.745 ***) in April. Tmin in April, similar to May temperatures, and Sh and June Tmean and Tmax had negative correlations with red currants weight. DM and TSC showed positive correlations with the Tmin in April (r = 0.720 *** and r = 0.487 **, respectively,) and with Tmean, Tmax, and Sh in May (very significant correlations for DM and distinctly signifi-cant correlations for TSC). In June positive correlations, very significant of DM with Tmin, Tmean, Tmax, and Sh, and distinctly significative correlations of TSC with Tmean, Tmax, and SH, were noted. However, negative correlations were still found in April with Sh (r = −0.340 * for DM and r = −0.294 * for TSC). A similar situation was observed for TSS, with the mention that in this case significant negative correlations with Tmean (r = −0.454 **) and Tmax (r = −0.550 **) in April were noted as a result of the higher Sh (r = −0.692 ***).
More acidic fruits were obtained in cooler April, when lower Tmean (r = −0.598 **) and Tmax (r = −0.620 **) occurred, with reduced Sh (r = −0.630 **), while in May, TTA was positively correlated to Tmin (r = 0.627 ***), Tmean (r = 0.330 *), and Sh (r = 0.409 **). Vitamin C content was positively correlated to increases in Tmin in April (r = 0.349 *), but also Tmin (r = 0.761 **), Tmean (r = 0.428 **), and Sh (r = 0.523 **) in May. A similar trend was recorded for TPC. Additionally, it could be observed that TPC was higher when May had higher Tmax and Sh and June had higher Tmean and Tmax. TAC content had a positive correlation with Tmin (r = 0.323 *), but negative with Tmean (r = −0.895 **) and Tmax (r = −0.918 **) in April. Moreover, positive correlations with Tmin (r = 0.923 **) and Tmean (r = 0.423 **) in May, and negative ones with Tmin in June (r = −0.404 **), were observed. Finally, TAC correlated in opposite ways with Sh in April and May (r = −0.916 ** and r = 0.546 **).

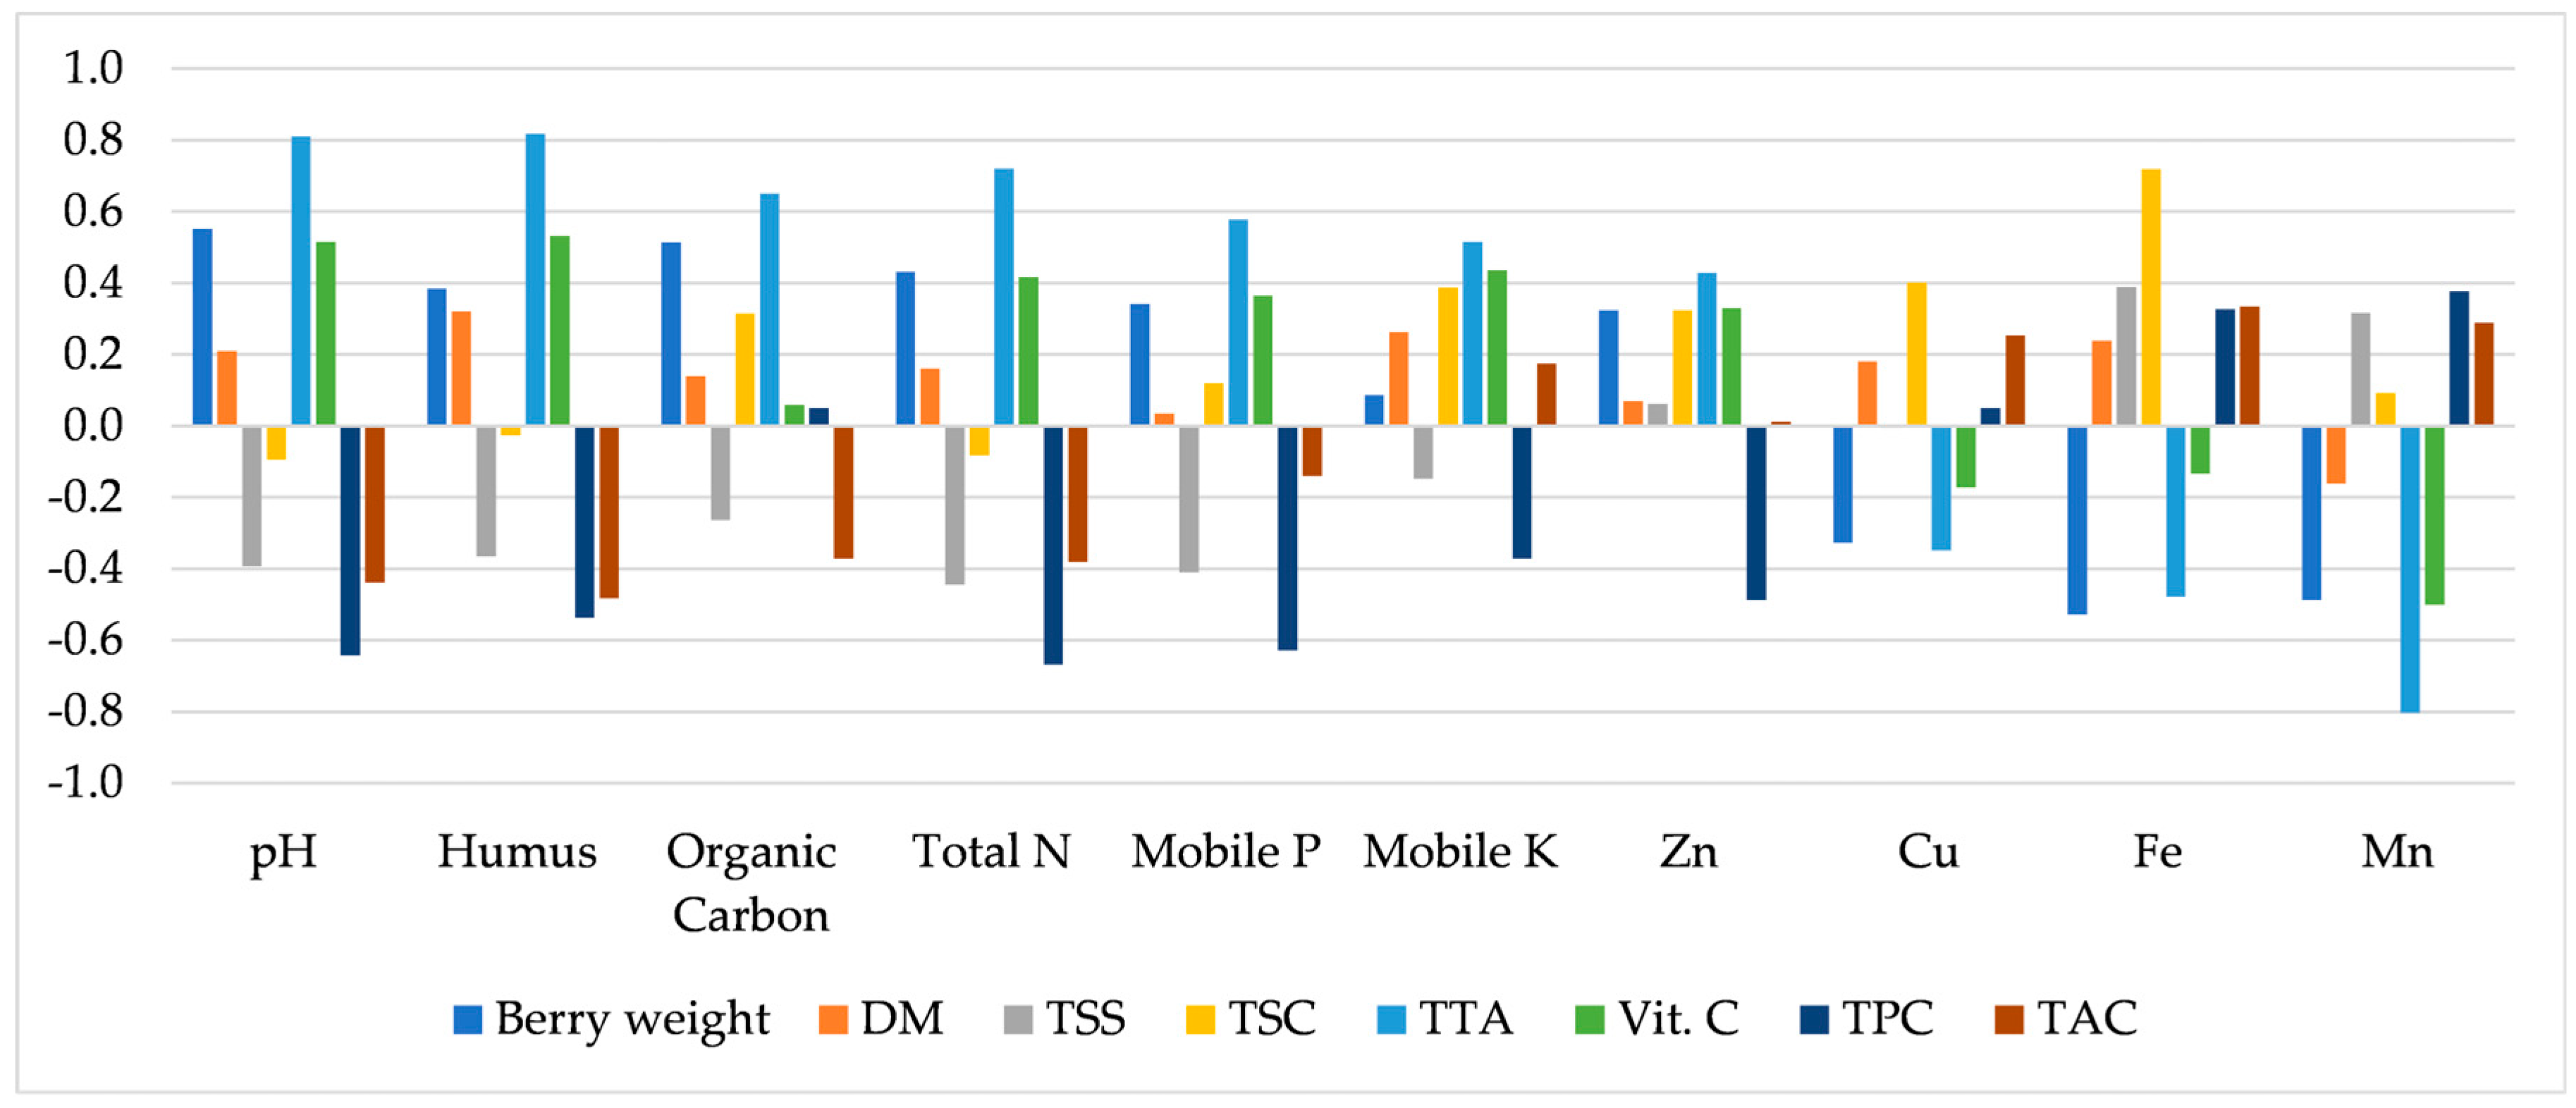
3.2. Correlations between Red Currant Quality and the Soil Chemical Characteristics

The analysis of the correlations of berries quality indicators to the soil chemical characteristics indicated a positive correlation of berry weight with soil pH (r = 0.552 *), but a negative one with Fe (r = −0.528 *), while total sugar content (TSC) was positively correlated with Fe (r = 0.719 *, Figure 3). It could also be observed that total titratable acidity (TTA) correlated positively with soil pH (r = 0.810 ***), humus content (r = 0.818 ***), organic carbon (C, r = 0.651 *), total nitrogen (N, r = 0.721 **), mobile phosphorous (P, r = 0.578 *), and potassium (K, r = 0.515 *), while a negative correlation to Mn was registered (r = −0.804 ***).
Among the components with antioxidant activity determined in this study, vitamin C was positively correlated with pH (r = 0.515 *) and humus content (r = 0.531 *). Total phenolic content (TPC) decreased at high soil pH (r = −0.642 **), humus (r = −0.537 *), total N (r = −0.668 **), and mobile P (r = −0.629 *).

3.3. Compost Influence on Berries Quality

The analysis of the correlations between the red currant quality indicators (Table 2) showed negative correlations between berry weight and all other quality indicators. Among them, the weakest correlation was established with TSC (r = −0.372 *), while the strongest was established with TPC (r = −0.730 **).
Positive correlations were established between berry dry weight, total soluble solids, total sugar content, vitamin C, total phenolic content (TPC), and total anthocyanin content (TAC). Among these, the correlation between DW and TSC was the most intense (r = 0.824 ***). In addition, berries with high acidity showed high levels of vitamin C (r = 0.800 ***), TPC (r = 0.392 **), and TAC (r = 0.540 ***), confirming that an acidic environment has the property of stabilizing the three antioxidant categories. The strongest correlation between antioxidants was registered for vitamin C and TAC (r = 0.737 ***), followed by the correlation between TAC and TPC (r = 0.701 ***) and between vitamin C and TPC (r = 0.619 ***).
Table 3 and Table 4 present the statistical descriptors (mean, standard deviation, coefficient of variation, range, and extreme values) for fruit quality indicators of the red currant cultivar ‘Jonkheer Van Tets’ determined between 2020 and 2022. As can be seen, the average values recorded for berry weight, DM, TSS, and TSC were 0.47 g, 17.13%, 11.77°Brix, and 8.15%, respectively. Titratable acidity oscillated around 1.7% citric acid, and the three components with antioxidant activity had average levels of 35.28 mg 100 g−1 (vitamin C), 1565.11 mg GAE kg−1 (TPC), and 205.11 mg C3G kg−1 (TAC).
As Table 3 presents, the significant effects observed in 2020 after compost applications were those related to the reduction of DM in the variant treated with MSVOC 40 t ha−1 (from 18.3% to 15.3%) and in the two treatments with VOC (to 15.1% and 14.9%, respectively). In this latter case, the reduction was directly proportional to the compost dose. The fertilization effects on the total soluble content were insignificant, although an increase was highlighted in the MSVOC treatment, especially when applying the 20 t ha−1 dose (from 10.5 to 11.27 °Brix). There was also a reduction in total titratable acidity in plants fertilized with MSVOC (from 1.61% to 1.28% and 1.22% citric acid). A lower acidity reduction resulted in plants treated with the highest dose of VOC (40 t ha−1). However, when 30 t ha−1 VOC was applied, the berries showed significantly higher acidity than the control (1.72% citric acid). Regarding the level of the antioxidant compounds analyzed in this study, a vitamin C content reduction occurred in the first year of fertilization. The higher the dose of compost, the stronger the vitamin C decrease resulted, and the reduction was more significant in VOC-treated variants (from 35.49 to a minimum of 25.60 mg 100 g−1), compared to MSVOC-treated ones. TPC increased significantly in 2020 in MSVOC 20 t ha−1 treatment from 1314.49 to 1460.87 mg GAE kg−1 and decreased in VOC 40 t ha−1 treated red currants (to 1189.86 mg GAE kg−1).
In the second year after the application of the composts, the differences between the fertilized and control variants were insignificant in most cases. An exception was the increase in berries acidity in plants fertilized with VOC.
The study carried out in the third year after the compost application indicated significant influences of fertilization treatments on some of the berry’s quality indicators. Thus, apart from the significant increase in fruit weight in the variant treated with VOC 40 t ha−1 (from 0.36 to 0.46 g), a significant increase in DW was obtained when fertilizing with the 30 t ha−1 dose of VOC (from 17.9% to 18.9%). Insignificant increases in DM were also recorded in the other fertilized variants. For both types of compost, the treatment effect decreased with the increase in the fertilizer dose. TSS increased insignificantly compared to the control with the increase of MSVOC compost dose, so that the highest content of TSS resulted under MSVOC 40 t ha−1 treatment. In the case of VOC compost, the treatment dose correlated inversely proportionally with the TSS level. Under these conditions, the greatest (and significant) reduction of TSS was observed in the variant treated with VOC compost 40 t ha−1 (from 12.53% to 11.87%). As shown in Table 3, a significant increase in berry’s acidity was recorded under the action of composts. The increase was small and similar for the two MSVOC compost doses. The highest acidity was determined for plants fertilized with VOC. In this case, reducing the dose of compost (from 40 to 30 t ha−1) insignificantly increased fruit acidity (from 1.84 to 1.98% citric acid).
Berries’ vitamin C increased due to fertilization in a manner close to that of total titratable acidity, but the effect of fertilization in this third year of study was insignificant. Generally, the highest vitamin C content increase was observed in the variants fertilized with VOC compost. Moreover, the dose of compost correlated inversely proportionally with the vitamin C level of the berries, and the highest concentration of vitamin C was determined in the variant treated with VOC, 20 t ha−1 (39.901 mg 100 g−1), with 7.73 mg 100 g−1 higher compared to the control. Unlike vitamin C, TPC decreased in 2022 in all compost-treated variants, especially in MSVOC 40% (from 1794.18 to 1610.91 mg GAE kg−1) and VOC 40% (to 1494.73 mg GAE kg−1).
On average, over the entire study period, a reduction in DM content was obtained, significant and directly proportional to the compost dose in the case of the VOC and the highest dose of MSVOC. Fertilization with MSVOC increased TSS level, while in the variant fertilized with VOC 40 t ha−1, TSS decreased. In the case of vitamin C, the only significant effect of fertilization with composts observed on the average of the years of study was its level reduction in the variant treated with MSVOC 40 t ha−1, while a significant TPC decrease occurred in VOC 40 t ha−1 variant by 8%. Compared to the Control, TSC variation between compost treatments was nonsignificant, and the same was observed for TAC (Table 4).

4. Discussion

The results of compost fertilization are not visible immediately after application. Therefore, a time-varying between weeks, months, or even years is required. This period depends on the composition and the degree of maturity of the compost, the type of soil, the type of climate, the temperature of the soil, the water regime, the type of culture, etc. (Schmidt et al. [27]). In our study, a reduction in the level of some fruit quality indicators in the first year (DM and vitamin C), insignificant influences on others (fruit weight and TSS), or oscillations in opposite directions of a third group (TTA and TPC) were the effects recorded at the end of the first season of vegetative growth after the application of the composts. Moreover, the second year was characterized by a limited number of significantly different indicators compared to the control: TTA increase in VOC 30 and 40 t ha−1, TPC reduction in MSVOC 40 t ha−1 and VOC 30 t ha−1, and its increase in MSVOC 20 t ha−1 and VOC 40 t ha−1. A more intense effect of compost on the quality of red currant berries was observed in the third year after application. Hargreaves [28] found that fertilization with four types of compost did not influence fruit yield, total antioxidant capacity, and vitamin C content of raspberry fruits. Similar to our study, the authors observed large differences between the study years and justified them by the extremely varied precipitation regime from one year to another. Composts (Biochar, Compost, and Biochar-Blended Compost) increased fruit quality in olives, greenhouse-grown tomatoes, and vineyards [29], while other authors found that the annual application of compost increased plum yields and fruit weight, but not the tree nutrient content [30]. In the Ribas-Agustí et al. [31] tomato fertilization experience, a comparison of municipal sewage waste MSW compost fertilization effect (alone or combined with mineral fertilization) indicated that the exclusive application of compost did not improve fruit quality (weight, TSS, size), modified the TPC profile by the growth of a kaempferol derivative and reduced fruit production. The authors showed that the application of MSW combined with mineral fertilizers is optimal and does not reduce either the production or the quality of the fruits.
At the end of the three years of study, the soil fertilized with municipal compost at a dose of 20 t ha−1 (MSVOC 20 t ha−1) contained the highest levels of copper and potassium, and an iron level only slightly lower than the maximum (from MSVOC 40 t ha−1). Increasing the dose of municipal compost to 40 t ha−1 led to the enrichment of the soil in zinc and iron (the highest levels). The soil fertilized with vegetable compost in a dose of 30 t ha−1 (VOC 30 t ha−1) had a high content of humus (similar to VOC 40 t ha−1) and low Cu content. Increasing the dose of VOC to 40 t ha−1 enriched the soil in humus, N, and P and increased the pH of the soil, while the levels of Mn and Fe decreased.
As can be observed, at the end of the study, in all variants where compost was applied, a significant increase in the total titratable acidity of the berries was recorded. In addition, increases in fruit weight (significant in VOC 40 t ha−1-soil rich in humus, N, P, with high pH, but with low Mn and Fe content), DM, and vitamin C (both significant in VOC 30 t ha−1-soil rich in humus, but with a low level of Cu) were also observed.
Concerning the relationship between berry metabolites, similar positive correlations, even stronger, were previously found in the research of Milošević and Milošević [14]. For red currants, berry acidity does not decrease with ripening, and this is proven by the fact that fruits with a higher level of sugar also had a higher content of organic acids. However, unlike the very intense correlation reported by Milošević and Milošević [14] between TSS and TTA in the present study, their relationship was positive but insignificant. Dry matter content ranged within limits previously reported by Petrisor et al., [28] (16.21–18.41%), although TSS had a lower level compared to the mentioned study. Generally, minimum TSS levels of 8.0% are reported in the literature for red currants, with maximums as high as 18.2%. Regarding the ’Jonkheer Van Tets’ cultivar, 9.14–11.6% TSS were determined, lower compared to the present study (Table 5).
Total sugar content was within the values previously reported for the red currant species and was rather high when compared to most of the levels found by some authors [1,32,33,34] for the same cultivar (Table 5). For total titratable acidity, values were found to range over a wider range, from 0.9 to 3.9%, compared to 1.13–2.07%. A case where the TTA went up to 9.4% was also reported [35]. However, the average acidity determined in the present study falls between the values reported for the ‘Jonkheer Van Tets’ cv. (1.3–2.85%). In this study, the vitamin C content is rather average, between the minimum values reported by Celik and Islam [4] (19.75 mg 100 g−1) and the highest one reported by Djordjević et al. [33] (52.8 mg 100 g−1). Studies on other red currant cultivars have indicated a wide variability of vitamin C, ranging from 17.0 to just over 70 mg 100 g−1, with one reference even mentioning a very high level of 721.2 mg 100 g−1 determined in a study on 29 red currant cultivars [35]. TPC was generally higher than the level reported for ‘Jonkheer Van Tets’ by Djordjevic et al. [33], but two times lower compared to the results reported by Celik and Islam [4]. The lowest TPC content in red currant was found by Djordjevic et al. [35] (60.2 mg 100 g−1), and the highest by Celik and Islam [4], 464.84 mg/100 g−1.
In a previous study in Romania, Petrisor et al. [32] (Table 5) reported lower TPC (92.21–150.35 mg GAE 100 g−1), while higher vitamin C and TAC were found in their study (35.4–52.3 mg 100 g−1 and 20.51–44.56 mg C3G 100 g−1, respectively). The same authors determined lower TSS and TTA (11.2–13.4% and 2.33–3.12%, respectively). Anthocyanin content fell between the values reported by Djordjevic et al. [33] (18.8 mg C3G 100 g−1) and Celik and Islam [4] (25.15 mg C3G 100 g−1). For other red currant cultivars, the range of TAC variation was very large, from 0.0 to 135.0, according to Djordjevic et al. [35].
All these variations reflect the differences between cultivars or berries’ ripening degree and applied technologies and the species’ response to the climatic conditions to which the culture was exposed. Red currant is a temperate-climate-loving species. Its optimal minimum temperature is 10 °C and the maximum optimum is 22 °C, while the absolute minimum and maximum are 5 °C and 25 °C, respectively [35]. Beyond these limits, physiological processes (and therefore photosynthesis) are greatly slowed down. On the other hand, thermal stress during the summer can increase respiration, the process by which carbohydrates are consumed. Through their chemical structure, polyphenols, and among them, anthocyanins, are also involved in processes related to the protection of plants against ultraviolet radiation, which is why under certain conditions (extended duration of sunshine), they are synthesized in larger quantities. However, their synthesis is controlled by several external factors’ interaction.
Among compost constituents, humic acids are related to the plant’s resistance against salinity and alkalinity due to their capacity to chelate sodium cations [36]. The authors mentioned that high salinity results in high osmotic pressure in the soil, which increases the plant’s effort to establish a continuous gradient of water potential. To maintain their hydric balance, plants accumulate inorganic ions in the osmotic adjustment process, which create higher toxicity and impair other nutrient absorption (potassium and nitrate) [37,38,39]. In the present study, high soil humus content increased berries’ total titratable acidity and vitamin C content, which was only insignificantly correlated to dry weight increase. A similar acidity increase under humus addition was also found in a previous study by Cova et al. [40] on mini watermelon cultivars.
High nitrogen content fertilizers are known for their effect on stimulating vegetative growth instead of fruit quality. Moreover, to consume the nitrogen taken to the soil solution, plants must produce organic compounds, and therefore they also consume the available carbon (C). Vitamin C is used not for sugar synthesis but for nitrogen-containing organic compounds in these conditions. This is why only a weak positive correlation of organic C to TSC was found and a negative one (nonsignificant) to N. A similar case was reported by Jamaly et al. [41] for cranberries cultivated in Eastern Canada, in which TSS and TAC were negatively correlated with the nitrogen provided by fertilization. In addition, Jamaly et al. [41] found that slow-release fertilizers delayed fruit ripening.
An increase in nitrogen-containing fertilizer significantly reduced total phenolics accumulation [42]. It is considered that an increase in phenolic constituents reflects the plant’s response to stress conditions [43], as TPC almost doubled in the water stress variant. Our study registered no TPC increase in compost treatments compared to the control. Therefore, it can be considered that the nutrients contained in the doses of applied compost created adequate growth conditions and did not expose the plants to abiotic stress. Both compost types assured protection against abiotic stress.
Phosphorous is part of the structure of nucleic acids, phospholipids, and macroergic molecules, which energetically support synthesis or membrane transport processes. Its level is also positively correlated to acidity and only insignificantly to sugars, an aspect probably also explained by the preferential direction towards the synthesis process of nitrogen-containing organic compounds. On the other hand, in soil, phosphorous forms insoluble complexes and has low availability for plants. Pontigo et al. [44] reviewed a series of studies that referred to the fact that one of the strategies developed by plants subjected to mineral stress, including phosphorus deficiency, is the synthesis of phenolic compounds. In our study, it could be observed that increased levels of TPC were found in variants MSVOC 20 t ha−1 and VOC 30 t ha−1, in which small doses of the two types of compost were applied. This indicates a possible phosphorus deficiency correlated with the doses but not with the origin of the compost.
The effects of compost fertilization reported in the literature were variable, influenced by the quality and origin of the composts [45,46,47,48]. Moreover, large variations were reported, especially in fruit production between experimental years or plantation sites [45,46]. Improvements in the quality of the fruits and higher production were reported for pomegranates by Kassem [47], in the variant treated with compost tea and by Pérez-Murcia et al. [48], when the compost of vegetable origin was applied in combination with tomato soup. Fertilization with composts reduced the risk of soil acidification, existing in the case of applying conventional fertilization, with NPK in the apple orchard and ensured a higher C/N ratio [49], an important aspect if it is taken into account that a high intake of N stimulates vegetative growth, to the detriment of fruit quality. However, Hernández et al. [18] recommend combined compost-mineral fertilizer fertilization to maintain fruit quality and fruit production. In addition, by improving time and the characteristics of the soil (such as increasing the moisture retention capacity, and proper aeration) [18], the development of the root system and the optimal uptake of nutrients from the soil are favored and the stress conditions related to low soil suitability are decreased.

5. Conclusions

The effect of composts on the quality of red currant fruits is constantly dynamic. Chemical or microbiological transformations occur gradually and are influenced by environmental factors (especially temperature and humidity), but also by type and the amount of compost applied, as the microbiological and physiochemical processes that lead to the improvement of the soil condition take place. According to our study, at the end of the third year after the application of composts, higher berry nutritional value by increasing their dry matter and vitamin C content resulted under VOC 30 t ha−1 treatment, while VOC 40 t ha−1 led to higher berry weight. Red currant quality varied related to the soil chemical characteristics, and the most intense correlations established were those of TTA, positive with soil pH, humus content, organic C, total N, mobile P, and K, but negative with Mn. Another positive correlation was found between total sugar content and Fe. Compost fertilization can be considered beneficial by providing plants with adequate nutrient levels to face environmental stress factors, as proven by TPC levels. Between the two origin composts, vegetal origin compost significantly improved berry quality by increasing the dry matter and vitamin C content, when was applied in a 30 t ha−1 dose, and berry weight, when was applied in a 40 t ha−1 dose. By increasing soil humus, nitrogen, and organic carbon content and providing a higher soil pH, vegetal origin compost improved some berry quality parameters. Therefore, vegetal origin compost represents an effective fertilization solution in organic red currant orchard technology.

Author Contributions

Conceptualization, M.F.C., G.P., C.U. and I.C.M.; methodology, M.F.C., G.P. and C.U.; software, I.C.M.; validation, C.U., M.F.C. and I.C.M.; formal analysis, G.P., M.F.C. and I.C.M.; investigation, C.U. and G.P; M.F.C. and I.C.M.; resources, D.S.Ș., M.F.C. and I.C.M.; data curation, M.F.C. and I.C.M.; writing—original draft preparation, M.F.C. and I.C.M.; writing—review and editing, C.U.; visualization, D.S.Ș., M.F.C. and I.C.M.; supervision, C.U.; project administration, M.F.C. and I.C.M.; funding acquisition, M.F.C. and I.C.M. All authors have read and agreed to the published version of the manuscript.

Funding

This work has been funded by the European Social Fund from the Sectoral Operational Program Human Capital 2014–2020, through the Financial Agreement with the title “Training of Ph.D. students and postdoctoral researchers in order to acquire applied research skills—SMART”, Contract no. 13530/16.06.2022—SMIS code: 153734.

Data Availability Statement

Not applicable.

Conflicts of Interest

The authors declare no conflict of interest.

References

  1. Zdunić, G.; Šavikin, K.; Pljevljakušić, D.; Djordjević, B. Black (Ribes nigrum L.) and Red Currant (Ribes rubrum L.) Cultivars. In Nutritional Composition of Fruit Cultivars; Simmonds, M.S.J., Preedy, V.R., Eds.; Academic Press: Cambridge, MA, USA, 2016; pp. 101–126. [Google Scholar]
  2. Dhalaria, R.; Verma, R.; Kumar, D.; Puri, S.; Tapwal, A.; Kumar, V.; Nepovimova, E.; Kuca, K. Bioactive Compounds of Edible Fruits with Their Anti-Aging Properties: A Comprehensive Review to Prolong Human Life. Antioxidants 2020, 9, 1123. [Google Scholar] [CrossRef] [PubMed]
  3. Morales, P.; Ferreira, I.C.; Carvalho, A.M.; Fernández-Ruiz, V.; Sánchez-Mata, M.C.; Cámara, M.; Morales, R.; Tardío, J. Wild edible fruits as a potential source of phytochemicals with capacity to inhibit lipid peroxidation. Eur. J. Lipid. Sci. Technol. 2013, 115, 176. [Google Scholar] [CrossRef]
  4. Çelik, E.; İslam, A. Investigations on some properties of currant and gooseberry varieties grown in organic condition. Int. J. Agric. For. Life Sci. 2019, 3, 64–74. [Google Scholar]
  5. Sumedrea, D.; Isac, I.; Iancu, M.; Olteanu, A.; Coman, M.; Dutu, I. Trees, fruit bushes, strawberry—Technical and economic guide. In Romanian: Pomi, Arbusti Fructiferi, Capsun—Ghid Tehnic si Economic; Invel Multimedia: Otopeni, Romania, 2014; pp. 231–237. [Google Scholar]
  6. Ropelewska, E. Assessment of the Influence of Storage Conditions and Time on Red Currants (Ribes rubrum L.) Using Image Processing and Traditional Machine Learning. Agriculture 2022, 12, 1730. [Google Scholar] [CrossRef]
  7. Hummer, K.E.; Barney, D.L. Currants. HortTechnology 2002, 12, 377. [Google Scholar] [CrossRef]
  8. Wiethold, J. Red currant and black current, new cultivated fruits in late medieval and early modern Europe: Historic and archaeobotanical evidence. In Des Fruits d’ici et d’ailleurs. Regards sur l’histoire de Quelques Fruits Consommés en Europe; Ruas, M.-P., Ed.; Histoire des savoirs: Omniscience, Paris, 2016; pp. 267–284. [Google Scholar]
  9. Gülmez, G.; Şen, A.; Şekerler, T.; Algül, F.A.; Kaya, Ö.T.C.; Sneer, A. The antioxidant, anti-inflammatory, and antiplatelet effects of Ribes rubrum L. fruit extract in the diabetic rats. J. Food Biochem. 2022, 46, e14124. [Google Scholar] [CrossRef]
  10. Yalcin, O.; Bassil, N.V.; Kafkas, N.E. Wild Edible Small Fruits in Turkey and their Fruit Characteristics. Proc. Latv. Acad. Sci. Sect. B. Nat. Exact Appl. Sci. 2022, 76, 417–423. [Google Scholar] [CrossRef]
  11. Tabart, J.; Franck, T.; Kevers, C.; Pincemail, J.; Serteyn, D.; Defraigne, J.-O.; Dommes, J. Antioxidant, and anti-inflammatory activities of Ribes nigrum extracts. Food Chem. 2012, 131, 1116. [Google Scholar] [CrossRef]
  12. Kowalska, K.; Olejnik, A. Current evidence on the health-beneficial effects of berry fruits in the prevention and treatment of metabolic syndrome. Curr. Opin. Clin. Nutr. Metab. Care. 2016, 19, 446. [Google Scholar] [CrossRef]
  13. Viskelis, P.; Bobinaitė, R.; Rubinskiene, M.; Sasnauskas, A.; Lanauskas, J. Chemical Composition and Antioxidant Activity of Small Fruits, Horticulture; Maldonado, A.I.L., Ed.; IntechOpen Ltd.: London, UK, 2012; ISBN 978-953-51-0252-6. Available online: http://www.intechopen.com/books/horticulture/chemical-composition-and-antioxidant-activity-of-small-fruits (accessed on 5 March 2023).
  14. Milošević, T.; Milošević, N. Vegetative growth, productivity, berry quality attributes and leaf macronutrients content of currants as affected by species and cultivars. Erwerbs-Obstbau 2018, 60, 53. [Google Scholar] [CrossRef]
  15. Picariello, E.; Pucci, L.; Carotenuto, M.; Libralato, G.; Lofrano, G.; Baldantoni, D. Compost and Sewage Sludge for the Improvement of Soil Chemical and Biological Quality of Mediterranean Agroecosystems. Sustainability 2021, 13, 26. [Google Scholar] [CrossRef]
  16. Rosiek, K. Directions and Challenges in the Management of Municipal Sewage Sludge in Poland in the Context of the Circular Economy. Sustainability 2020, 12, 3686. [Google Scholar] [CrossRef]
  17. European Environment Agency (EEA). Circular by Design—Products in the Circular Economy; EEA Report No 6/2017; Publications Office of the European Union: Luxembourg, 2017. Available online: https://www.eea.europa.eu/publications/circular-bydesign (accessed on 17 December 2022).
  18. Hernández, T.; Chocano, C.; Moreno, J.L.; García, C. Towards a more sustainable fertilization: Combined use of compost and inorganic fertilization for tomato cultivation. Agric. Ecosyst. Environ. 2014, 196, 178–184. [Google Scholar] [CrossRef]
  19. Pinto-Morales, F.; Retamal-Salgado, J.; Lopéz, M.D.; Zapata, N.; Vergara-Retamales, R.; Pinto-Poblete, A. The Use of Compost Increases Bioactive Compounds and Fruit Yield in Calafate Grown in the Central South of Chile. Agriculture 2022, 12, 98. [Google Scholar] [CrossRef]
  20. Singh, R.P.; Singh, P.; Ibrahim, M.H.; Hashim, R. Land Application of Sewage Sludge: Physicochemical and Microbial Response. Environ. Contam. Toxicol. 2011, 214, 41–61. [Google Scholar]
  21. Tavantzis, S.; Larkin, R.P.; Alyokhin, A.; Erich, M.; Bernard, E.; Gross, S. A systems approach for enhancing soil quality and plant health under organic and conventional conditions: Introduction. In Proceedings of the Northeast Potato Technology Forum, Bangor, ME, USA, 10–11 March 2009; p. 10. [Google Scholar]
  22. Gergen, I. Analiza Produselor Agroalimentare; Editura Eurostampa: Timisoara, Romania, 2004. [Google Scholar]
  23. Fuleki, T.; Francis, F.J. Extraction and determination of total anthocyanin in cranberries. J. Food Sci. 1968, 33, 72. [Google Scholar] [CrossRef]
  24. Singleton, V.L.; Orthofer, R.; Lamuela-Raventós, R.M. Analysis of total phenols and other oxidation substrates and antioxidants by means of Folin Ciocalteu reagent. Method. Enzymol. 1999, 299, 152. [Google Scholar] [CrossRef]
  25. Ciucu-Paraschiv, M.; Hoza, D. The effect of foliar application with organic and inorganic products on the biochemical quality indicators of highbush blueberry (Vaccinium corymbosum L.). Sci. Papers. Ser. B Hortic. 2021, 65, 48–57. [Google Scholar]
  26. Mishra, P.; Pandey, C.M.; Singh, U.; Gupta, A.; Sahu, C.; Keshri, A. Descriptive statistics and normality tests for statistical data. Ann. Card. Anaesth. 2019, 22, 67. [Google Scholar]
  27. Schmidt, H.P.; Kammann, C.; Niggli, C.; Evangelou, M.W.; Mackie, K.A.; Abiven, S. Biochar and biochar-compost as soil amendments to a vineyard soil: Influences on plant growth, nutrient uptake, plant health and grape quality. Agric. Ecosyst. Environ. 2014, 191, 117–123. [Google Scholar] [CrossRef]
  28. Hargreaves, J. The Use of Composts and Compost Teas in the Production of Strawberries and Raspberries. Ph.D. Dissertation, Dalhousie University, Halifax, NS, Canada, 2008. [Google Scholar]
  29. Sánchez-Monedero, M.A.; Cayuela, M.L.; Sánchez-García, M.; Vandecasteele, B.; D’Hose, T.; López, G.; Martínez-Gaitán, C.; Kuikman, P.J.; Sinicco, T.; Mondini, C. Agronomic evaluation of biochar, compost and biochar-blended compost across different cropping systems: Perspective from the European project FERTIPLUS. Agronomy 2019, 9, 225. [Google Scholar] [CrossRef]
  30. Jindo, K.; Chocano, C.; Melgares de Aguilar, J.; Gonzalez, D.; Hernandez, T.; Garcia, C. Impact of compost application during 5 years on crop production, soil microbial activity, carbon fraction, and humification process. Commun. Soil Sci. Plant Anal. 2016, 47, 1907–1919. [Google Scholar] [CrossRef]
  31. Ribas-Agustí, A.; Seda, M.; Sarraga, C.; Montero, J.I.; Castellari, M.; Muñoz, P. Municipal solid waste composting: Application as a tomato fertilizer and its effect on crop yield, fruit quality and phenolic content. Renew. Agric. Food Syst. 2017, 32, 358–365. [Google Scholar] [CrossRef]
  32. Petrisor, C.; Ilie, A.; Moale, C. Production, and quality potential of different black and red currant cultivars in Baneasa Research Station condition. J. Hortic. For. Biotechnol. 2013, 17, 76. [Google Scholar]
  33. Djordjević, B.; Savikin, K.; Zdunić, G.; Janković, T.; Vulić, T.; Oparnica, C.; Radivojević, D. Biochemical properties of red currant varieties in relation to storage. Plant Foods Hum. Nutr. 2010, 65, 326. [Google Scholar] [CrossRef]
  34. Nazaryuk, N.; Sorokopudov, V.; Sorokopudova, O.; Nigmatzyanov, R. Comprehensive assessment of red currant varieties in Altai. E3S Web Conf. 2021, 254, 01040. [Google Scholar] [CrossRef]
  35. Djordjević, B.; Rakonjac, V.; Akšić, M.F.; Šavikin, K.; Vulić, T. Pomological and biochemical characterization of European currant berry (Ribes sp.) cultivars. Sci. Hortic. 2014, 165, 156. [Google Scholar] [CrossRef]
  36. El Hasini, S.; De Nobili, M.; Azim, K.; Douaik, A.; Laghrour, M.; El idrissi, Y.; El Alaoui El Belghiti, M.; Zouahri, A. The influence of compost humic acid quality and its ability to alleviate soil salinity stress. Int. J. Recycl. Org. Waste Agric. 2020, 9, 21. [Google Scholar]
  37. Hussin, S.; Geissler, N.; Koyro, H.W. Effect of NaCl salinity on Atriplex nummularia (L.) with special emphasis on carbon and nitrogen metabolism. Acta Physiol. Plant. 2013, 35, 1025–1038. [Google Scholar] [CrossRef]
  38. Blum, A. Osmotic adjustment is a prime drought stress adaptive engine in support of plant production. Plant Cell Environ. 2017, 40, 4–10. [Google Scholar] [CrossRef]
  39. Hasanuzzaman, M.; Bhuyan, M.B.; Nahar, K.; Hossain, M.S.; Mahmud, J.A.; Hossen, M.S.; Masud, A.A.C.; Fujita, M.; Fujita, M. Potassium: A vital regulator of plant responses and tolerance to abiotic stresses. Agronomy 2018, 8, 31. [Google Scholar] [CrossRef]
  40. Cova, A.M.W.; de Souza, A.S.; Gheyi, H.R.; de Azevedo Neto, A.D. Humus contribution to the production and post-harvest quality of mini watermelon cultivars. Water Resour. Irrig. Manag. 2020, 9, 35. [Google Scholar]
  41. Jamaly, R.; Parent, S.É.; Parent, L.E. Fertilization and soil nutrients impact differentially cranberry yield and quality in eastern Canada. Horticulturae 2021, 7, 191. [Google Scholar] [CrossRef]
  42. Radušienė, J.; Marksa, M.; Ivanauskas, L.; Jakštas, V.; Çalişkan, Ö.; Kurt, D.; Odabaş, M.S.; Çirak, C. Effect of nitrogen on herb production, secondary metabolites and antioxidant activities of Hypericum pruinatum under nitrogen application. Ind. Crops Prod. 2019, 139, 111519. [Google Scholar] [CrossRef]
  43. Adak, N.; Gubbuk, H.; Tetik, N. Yield, quality and biochemical properties of various strawberry cultivars under water stress. J. Sci. Food Agric. 2018, 98, 304. [Google Scholar] [CrossRef]
  44. Pontigo, S.; Ulloa, M.; Godoy, K.; Nikolic, N.; Nikolic, M.; Mora, M.D.L.L.; Cartes, P. Phosphorus efficiency modulates phenol metabolism in wheat genotypes. J. Soil Sci. Plant Nutr. 2018, 18, 904. [Google Scholar] [CrossRef]
  45. Chan, K.Y.; Fahey, D.J.; Newell, M.; Barchia, I. Using composted mulch in vineyards—Effects on grape yield and quality. Int. J. Fruit Sci. 2010, 10, 441–453. [Google Scholar] [CrossRef]
  46. Adekiya, A.O.; Ejue, W.S.; Olayanju, A.; Dunsin, O.; Aboyeji, C.M.; Aremu, C.; Adegbite, K.; Akinpelu, O. Different organic manure sources and NPK fertilizer on soil chemical properties, growth, yield and quality of okra. Sci. Rep. 2020, 10, 16083. [Google Scholar] [CrossRef]
  47. Kassem, M.S.M. Effect of Compost Tea or some Botanical Extracts on the Fruit Quality of Pomegranate Trees at Upper Egypt. Alex. Sci. Exch. 2021, 42, 435–444. [Google Scholar]
  48. Pérez-Murcia, M.D.; Bustamante, M.Á.; Orden, L.; Rubio, R.; Agulló, E.; Carbonell-Barrachina, Á.A.; Moral, R. Use of Agri-Food Composts in Almond Organic Production: Effects on Soil and Fruit Quality. Agronomy 2021, 11, 536. [Google Scholar] [CrossRef]
  49. Ge, S.; Zhu, Z.; Jiang, Y. Long-term impact of fertilization on soil pH and fertility in an apple production system. JPNSS 2018, 18, 282–293. [Google Scholar] [CrossRef]
Figure 1. Climatic data registered in the study area between 2020 and 2022, compared to multiannual averages (temperatures) and sums (sunshine and rain); * Data are presented as the multiannual average of the monthly values registered in the 1969–2021 period.
Agronomy 13 01363 g001
Figure 2. Correlations of fruit quality parameters with climatic factors in 2020–2022 interval (Pearson correlation coefficients are presented); soil humus, organic carbon, and total nitrogen was expressed as %, while mobile P, mobile K, Zn, Cu, Fe, and Mn were expressed as mg kg−1. Dry matter = DM (%), total soluble solids = TSS (°Brix), total sugar content = TSC (%), total titratable acidity = TTA (% citric acid), vitamin C = Vit. C (mg 100 g−1), total phenolic content = TPC (mg GAE kg−1), total anthocyanin content = TAC (mg C3G kg−1).
Agronomy 13 01363 g002
Figure 3. Correlations of fruit quality parameters with some soil chemical characteristics (Pearson correlation coefficients are presented); soil humus, organic carbon, and total nitrogen were expressed as %, while mobile P, mobile K, Zn, Cu, Fe, and Mn were expressed as mg kg−1. Dry matter = DM (%), total soluble solids = TSS (°Brix), total sugar content = TSC (%), total titratable acidity = TTA (% citric acid), vitamin C = Vit. C (mg 100 g−1), total phenolic content = TPC (mg GAE kg−1), total anthocyanin content = TAC (mg C3G kg−1).
Agronomy 13 01363 g003
Table 1. Chemical parameters of the soil treated with compost MSVOC, obtained from municipal sludge and vegetal residues in 20 and 40 t ha−1 doses, and compost VOC, obtained from vegetal residues in 20 and 30 t ha−1 doses.
Compost TreatmentpH Humus (%)Total N (%)Total Organic C (%)Mobile P
(mg
kg−1)
Mobile K
(mg
kg−1)
Zn (mg kg−1)Cu (mg kg−1)Fe (mg
kg−1)
Mn (mg
kg−1)
MSVOC (Municipal sludge and vegetal waste-origin compost)6.25211.2513.92112.862637.7
VOC (Vegetal waste origin compost)7.15241.2212.18127.142115.93
V1 = Untreated soil 5.492.050.120.7151.67121.331.906.43140.0353.00
V2 = MSVOC 20 t ha−1 (9 kg/plant)5.752.350.141.79118.67213.0011.476.67147.1342.73
V3 = MSVOC 40 t ha−1 (18 kg/plant)5.922.610.152.39129.00192.3314.706.47152.1741.27
V4 = VOC 30 t ha−1 (13 kg/plant)6.173.140.172.19113.67184.008.175.90117.6332.37
V5 = VOC 40 t ha−1 (18 kg/plant)6.383.260.203.19177.00204.0012.106.27106.5329.97
Table 2. Correlation matrix between red currant fruit quality parameters (Pearson Coefficients and significance).
DWTSS TSC TTA Vitamin C TPC TAC
Berry weight−0.494 **−0.703 ***−0.372 *−0.466 **−0.644 ***−0.730 ***−0.697 ***
DM 10.609 ***0.824 ***0.2430.478 ***0.487 ***0.273
TSS 10.577 ***0.2510.434 ***0.728 ***0.572 ***
TSC 10.1260.370 *0.390 **0.193
TTA 10.800 ***0.392 **0.540 ***
Vit. C 10.619 ***0.737 ***
TPC 10.701 ***
*** Correlation is significant at the 0.05 level (2-tailed). ** Correlation is significant at the 0.01 level (2-tailed). * Correlation is significant at the 0.001 level (2-tailed). DM = dry matter (%), total soluble solids = TSS (°Brix), total sugar content = TSC (%), total titratable acidity = TTA (% citric acid), vitamin C = Vit. C (mg 100 g−1), total phenolic content = TPC (mg GAE kg−1), total anthocyanin content = TAC (mg C3G kg−1).
Table 3. Compost and year effect on red currant dry matter (DM %), total soluble solid (TSS), vitamin C content, and total phenolic content (TPC).
Year
(Y)
Compost Treatment (CO)Berry Weight (g)DM
(%)
TSS
(°Brix)
TTA
(%)
Vit. C
(mg 100 g−1)
TPC
(mg GAE kg−1)
2020V1 = Control0.51 ± 0.08 a18.27 ± 0.84 a10.50 ± 0.26 a1.61 ± 0.02 b35.49 ± 1.34 a1314.49 ± 66.42 b
V2 = MSVOC 20 t ha−10.63 ± 0.08 a17.25 ± 0.27 a11.27 ± 0.67 a1.28 ± 0.03 d30.36 ± 0.76 b1460.87 ± 58.50 a
V3 = MSVOC 40 t ha−10.64 ± 0.06 a15.29 ± 0.79 b10.90 ± 0.44 a1.22 ± 0.08 d26.99 ± 1.34 bc1314.50 ± 52.42 b
V4 = VOC 30 t ha−10.59 ± 0.08 a15.07 ± 0.32 b10.50 ± 0.17 a1.72 ± 0.09 a29.04 ± 2.33 ab1363.77 ± 63.65 ab
V5 = VOC 40 t ha−10.61 ± 0.06 a14.88 ± 0.24 b10.60 ± 0.46 a1.49 ± 0.07 c25.60 ± 1.64 c1189.86 ± 82.19 c
p 0.2040.0000.2180.0000.0000.007
2021V1 = Control0.36 ± 0.05 a16.48 ± 0.54 a11.90 ± 0.30 ab1.76 ± 0.02 bc41.47 ± 1.88 ab1669.57 ± 252.06 a
V2 = MSVOC 20 t ha−10.41 ± 0.07 a16.98 ± 0.74 a12.17 ± 0.35 a1.64 ± 0.04 c36.39 ± 1.99 b1702.90 ± 178.33 a
V3 = MSVOC 40 t ha−10.42 ± 0.04 a16.78 ± 0.05 a12.37 ± 0.51 a1.81 ± 0.13 b37.51 ± 2.42 ab1642.03 ± 66.55 a
V4 = VOC 30 t ha−10.45 ± 0.09 a17.15 ± 0.23 a12.13 ± 0.25 a2.01 ± 0.07 a42.53 ± 5.10 a1668.11 ± 47.70 a
V5 = VOC 40 t ha−10.46 ± 0.05 a16.70 ± 0.82 a11.40 ± 0.17 b2.02 ± 0.03 a41.80 ± 2.64 ab1694.20 ± 176.63 a
p 0.3720.6430.0450.0000.1080.991
2022V1 = Control0.36 ± 0.05 b17.90 ± 0.26 b12.53 ± 0.60 a1.38 ± 0.12 c32.17 ± 2.57 b1794.18 ± 79.46 a
V2 = MSVOC 20 t ha−10.37 ± 0.02 b18.63 ± 0.21 ab12.70 ± 0.26 a1.65 ± 0.08 b37.50 ± 1.29 ab1786.53 ± 50.21 a
V3 = MSVOC 40 t ha−10.43 ± 0.03 ab18.53 ± 0.40 ab13.00 ± 0.36 a1.66 ± 0.20 b35.52 ± 5.06 ab1610.91 ± 37.09 b
V4 = VOC 30 t ha−10.41 ± 0.06 ab18.87 ± 0.47 a12.67 ± 0.21 a1.98 ± 0.05 a39.90 ± 3.17 a1770.06 ± 31.54 a
V5 = VOC 40 t ha−10.46 ± 0.05 a18.20 ± 0.56 ab11.87 ± 0.12 a1.84 ± 0.03 ab36.93 ± 2.18 ab1494.73 ± 85.56 c
p 0.1080.0950.0290.0010.1100.000
AverageV1 = Control0.41 ± 0.09 b17.55 ± 0.97 a11.64 ± 0.97 bc1.58 ± 0.18 c36.38 ± 4.43 a1592.75 ± 255.01 ab
V2 = MSVOC 20 t ha−10.47 ± 0.13 a17.62 ± 0.87 a12.04 ± 0.74 a1.52 ± 0.19 c34.75 ± 3.55 ab1650.10 ± 175.75 a
V3 = MSVOC 40 t ha−10.50 ± 0.12 a 16.87 ± 1.47 b12.09 ± 1.01 a1.56 ± 0.29 c33.34 ± 5.63 b1522.48 ± 163.25 bc
V4 = VOC 30 t ha−10.48 ± 0.11 a17.03 ± 1.67 b11.77 ± 0.99 ab1.91 ± 0.15 a37.16 ± 6.98 a1600.65 ± 188.00 ab
V5 = VOC 40 t ha−10.51 ± 0.09 a16.59 ± 1.53 b11.29 ± 0.61 c1.78 ± 0.24 b34.78 ± 7.44 ab1459.60 ± 244.35 c
CT main effect 0.0120.001<0.001<0.001<0.001<0.001
Partial eta squared 0.3420.4730.4710.8230.2750.366
2020Average0.60 ± 0.08 a16.15 ± 1.48 c10.75 ± 0.48 c1.46 ± 0.20 c29.5 ± 3.78 c1328.7 ± 106.21 b
2021Average0.42 ± 0.07 b16.82 ± 0.53 b11.99 ± 0.45 b1.85 ± 0.16 a39.94 ± 3.64 a1675.36 ± 139.75 a
2022Average0.40 ± 0.06 b18.43 ± 0.49 a12.55 ± 0.49 a1.7 ± 0.23 b 36.4 ± 3.73 b1691.28 ± 133.61 a
Y main effect<0.001<0.0010.001<0.0010.0410.007
Partial eta squared0.7550.8390.8560.8420.7980.784
CT × Y effect0.750<0.0010.389<0.0010.0010.212
Partial eta squared0.1430.4750.2270.7070.5700.281
Mean0.4717.1311.771.6735.281565.11
Std. Deviation0.111.340.890.255.69210.02
Variation coefficient (%)23.157.827.5615.1616.1413.42
Range0.404.923.300.9423.96821.74
Minimum0.3014.4810.101.1324.001126.09
Maximum0.7019.4013.402.0747.961947.83
Average of three replicates are presented; different letters on the columns indicate significant differences between means, according to the Duncan Multiple Range Test (α = 0.05) following two-way ANOVA analysis of variance (p ≤ 0.05 are considered significant).
Table 4. Compost and year effect on red currant total sugar content (TSC) and anthocyanin content (TAC).
Year
(Y)
Compost
Treatment (CO)
TSC
(%)
TAC
(mg C3G kg−1)
AverageV1 = Control8.14 * ± 0.58 214.42 ± 63.73
V2 = MSVOC 20 t ha−18.39 ± 0.26 224.07 ± 57.50
V3 = MSVOC 40 t ha−18.59 ± 0.77 189.10 ± 69.10
V4 = VOC 30 t ha−18.00 ± 0.64p = 0.031 **187.96 ± 70.30
V5 = VOC 40 t ha−17.60 ± 0.84 209.99 ± 50.11
2020Average7.75 ± 0.86 133.77 ± 22.51
2021 8.10 ± 0.54 270.84 ± 14.79
2022 8.59 ± 0.39 210.70 ± 31.80
CT effect ***0.036 0.762
Y effect0.010 <0.001
Mean8.15 205.11
Std. Deviation0.71 61.41
Variation coefficient (%)8.66 29.94
Range2.83 189.87
Minimum6.41 106.87
Maximum9.24 296.74
* Average of three replicates; ** according to Dunn’s pairwise test (α = 0.05); *** Kruskal-Wallis H Test was performed (p ≤ 0.05 are considered significant).
Table 5. Synthesis of the literature data regarding the content of red currants in dry weight (DW), total soluble solids (TSS), 17 sugars (TSC), organic acids (TTA), vitamin C, phenolic compounds (TPC), and anthocyanins (TAC).
References DW%TSSTSCTTAVitamin C *TPCTAC
[1]10 cvs.-9.8–15.3%6.9–10.2%1.2–3.9%29.3–71.267.2–153.47.1–19.3
[1]Jonker van Teets-9.7–11.66.8–7.8%1.6–3.1%39.5–51.396.4 (2.8)18.8 (2.1)
[4]2 cvs.-9.9–10.1 2.43–2.54%15.5–22.2304.86–464.8411.06–22.22
[4]Jonker van Teets-9.14-2.85%19.75338.4125.15
[32]3 cvs16.21–18.4111.2–13.4°Brix-2.33–3.12 g citric ac.
100 mL−1
35.4–52.395.21–150.3520.51–44.56
[33]10 cvs.-10.4–12.68.5–9.8%1.0–1.7%50.5–71.667.2–153.47.1–19.3
[33]Jonker van Teets-9.9 (0.2)6.9% (0.2)1.3% (0.1)52.8 (4.0)96.4 (2.8)18.8 (2.1)
[34]15 cvs.-11.5%
(8.0–14.9)
7.4%
(4.7–11.6)
2.0%
(0.9–3.2)
43.0
(17.0–104.0)
--
[35]29 cvs-12.6
(9.7–18.2)
-5.3%
(1.3–9.4)
96.0
(45.8–172.2)
137.3
(60.2–278.9)
36.4
(0.0–135.4)
* Vitamin C, TPC, and TAC are expressed as mg 100 g−1.
Disclaimer/Publisher’s Note: The statements, opinions and data contained in all publications are solely those of the individual author(s) and contributor(s) and not of MDPI and/or the editor(s). MDPI and/or the editor(s) disclaim responsibility for any injury to people or property resulting from any ideas, methods, instructions or products referred to in the content.

