Abstract
Wheat stripe rust (Puccinia striiformis Westend f. sp. tritici; Pst) is a severe disease that affects wheat-growing areas worldwide. In the last few years, Pst head infection (PstHI) was recorded to cause severe yield damage in Egypt. Little information is known about PstHI. In the current study, a set of 34 Egyptian cultivars were evaluated for their Pst foliar infection (PstFI) and PstHI in two growing seasons (2021 and 2022) in Egypt. High genotypic variations in PstFI and PstHI were found. A very weak correlation was found between the resistance to PstFI and PstHI in both growing seasons. Therefore, the resistance to each symptom might be controlled by different genetic systems. The effect of PstFI and PstHI on kernel traits was investigated. PstHI was found to significantly reduce kernel width and weight in heavily diseased years. Therefore, a significant reduction in wheat yield and quality is expected in case of severe PstHI. Three Egyptian genotypes were resistant to PstFI and PstHI in both growing seasons. These genotypes could help in improving the resistance to both symptoms. However, due to the low genetic distance among them, looking for additional sources of resistance is recommended. In 2021, higher head infection was found compared with 2022. Highly significant differences in maximum temperature, minimum temperature, maximum dew point, and average dew point were found between the two growing seasons. Out of these four factors, dew point and ambient temperature were found to be possible reasons for increasing PstHI. Furthermore, 51 isolines carrying different resistance genes were included in the evaluation. At least ten stripe rust resistance genes were found to be effective against PstFI and PstHI. These ten genes should be included in future breeding programs to improve Pst resistance and understand the effect of climate change on Pst.
1. Introduction
Wheat stripe rust caused by Puccinia striiformis Westend f. sp. tritici (Pst) is a devasting disease that affects wheat (Triticum spp.) globally [1,2,3,4,5,6]. In Egypt, it is considered the most rust (Puccinia spp.) devastating disease [7,8,9,10,11,12,13]. Due to the continuous changes in Pst virulence/avirulence in the Egyptian fields, highly aggressive Pst races have appeared and broken the resistance of previously resistant genotypes [8,9,14]. These new races have spread throughout Egypt including Upper Egypt where the weather is relatively hotter and drier. The appearance of new Pst races that are adapted to warmer temperatures has been reported in many other areas of the world [15,16,17]. Moreover, unusual symptoms were noticed in wheat plants. One of these symptoms is head/spike infection with stripe rust that we noticed in the Egyptian fields mainly in the last two to three years. Head infection was identified previously in the 1970s and 1980s [18,19]. However, it was believed to be an extension of the foliar infection in highly susceptible genotypes [20]. In recent years, head infection appeared as an epidemic infection in many Egyptian wheat regions. Furthermore, it was observed that genotypes that are resistant to the foliar Pst infection may show susceptibility to Pst head infection. Few previous studies have been conducted to understand head infection [21]. The current study is the first one to study head infection in Egyptian wheat germplasm.
Stripe rust head infection occurs with Pst urediniospores that could infect the heads once they emerge (Zadoks’ growth stage GS55 to flowering GS61) [22]. Conditions for Pst infection are particularly favorable when the lemma and palea open during pollination. Pst spores could germinate and sporulate on glumes, lemma, and palea. Infected heads discolor or bleach in early infections which could be falsely mistaken as Fusarium head blight infection. However, opening the floret and seeing Pst pustules inside the spikes clearly differentiate stripe rust head infection from Fusarium head blight infection. As Pst head infection usually occurs at heading to the milk stage, re-infection is generally unlikely to have an impact due to the plant maturing shortly thereafter. Despite the short period of head infection compared with foliar infection, a reduction of grain yield and quality was reported to reach 20% as a result of head infection [23,24].
Unfortunately, little is known about Pst head infection and the genetics of resistance in wheat. Previous reports have suggested that low temperatures with high humidity during the flowering time could be considered the most important factor that enhances head infection [24]. Therefore, understanding climate change and how it may increase or reduce head infection could help the plant breeder improve wheat resistance to foliar and head infection as part of a strategy to develop climate-resilient wheat. In general, many climate factors affect Pst infection such as relative humidity, rainfall, and air temperature. It was reported that temperatures between 4 and 16 °C combined with ≤0.1 mm rainfall and humidity > 92% are favorable climate conditions for Pst fungus to grow and infect wheat plants [25,26]. Most of the studies that investigated the favorable weather conditions for Pst depended on foliar plant infection data. Therefore, studying the favorable climate conditions that lead to head infection with its different microclimate is required. Due to the lack of information about Pst head infection, the effect of head infection on wheat yield is poorly understood. Therefore, a better understanding of head infection and comparing it with the known foliar infection symptoms and effects are urgently required. Previous studies predicted that Pst head infection could lead to severe loss in grain yield due to its effect on the ear [21]. This prediction was based on the importance of ear photosynthesis which provides developing grains with 10–76% of the important photoassimilates. Thus, infection of the head can lead to a decrease in head photosynthesis and photoassimilates [21]. Furthermore, ear infections could threaten wheat breeding programs that require longer floret opening, hence providing a greater opportunity for the entry of Pst urediniospores.
The objectives of this study were to: (1) study the relationship between Pst head and foliar infection, (2) identify the most important climate factors that may affect Pst head infection, (3) investigate possible genes that provide resistance to both Pst head and foliar infections based on the evaluation of differential lines, (4) understand the effect of Pst head infection on grain yield in a comparison of Pst foliar infection, and (5) select the most resistant genotypes to both head and foliar infection to be used as parents in future breeding programs.
2. Material and Methods
2.1. Plant Materials
In the current study, a set of 86 wheat genotypes was evaluated for resistance against Pst. These genotypes could be classified into two sets, tested genotypes and isolines. The tested genotypes consisted of seven breeding lines and 27 popular Egyptian cultivars (Table S1). Seeds of the Egyptian cultivars were obtained from the Egyptian governorate while seeds of the seven breeding lines were obtained from Prof. Dr. Qadry Omara, Genetics Department, Faculty of Agriculture, Assuit University, Assuit, Egypt. The isolines set consisted of 51 lines carrying different stripe rust resistance genes. One susceptible check ‘Morocco’ was included to investigate the effectiveness of the natural stripe rust infection (Table S2). Seeds of these isolines were obtained from the International Maize and Wheat Improvement Center, Mexico (CIMMYT).
2.2. Experimental Design and Stripe Rust Infection
All 86 genotypes (isolines and tested genotypes) were evaluated at the field station of the Wheat Disease Research Department, Sakha Agricultural Research Station, Agriculture Research Centre, Kafr Elsheikh, Egypt for two growing seasons, 2021 and 2022. In each growing season, the experimental design was randomized complete block design (RCBD) with three replications. In each replication, each genotype was presented in a one-meter row with a space of 30 cm between rows. In each row 3 gm from each genotype were planted. Furthermore, in each season the experiment was surrounded by two rows of Morocco susceptible check as a spreader for the infection. The infection occurred naturally as Sakha is the epicenter of stripe rust infection in the Egyptian fields.
2.3. Evaluation of Stripe Rust Foliar and Head Infection and Kernel Traits
In each growing season, Pst evaluation was done separately for the foliar plant parts and head infection. For the foliar evaluation, the evaluation began at the first appearance of Pst on the susceptible check Morocco. Evaluations were repeated every ten days thereafter until the plants closely reached physiological maturity (the peduncle turned yellow). The infection was recorded as disease severity (DS) and infection type (IT). DS was expressed as a percentage of leaf coverage with Pst spores [27]. While IT was recorded according to a modified Stakman’s scale [28] as described in [29]. In this modified scale stripe rust IT was recorded as I (for immune genotypes), R (for resistant genotypes), MR (for moderately resistant genotypes), MS (for moderately susceptible genotypes), and S (for susceptible genotypes). After that IT scores were converted to a numeric scale as follows: immune = 0.0, TrR = 0.1, highly resistant (R) = 0.2, TrMR = 0.3, MR = 0.4, M = 0.6, TrMS = 0.7. MS = 0.8, TrS = 0.9, and S = 1. The coefficient of infection (CI) was calculated by multiplying DS by IT and resistant genotypes were identified as genotypes with CI ≤ 4% (e.g., 10% DS × 0.4 IT) as described in [9]. Susceptible genotypes were identified as genotypes with more than 4% CI values.
Stripe rust head evaluation was done three times in each growing season starting from the first infection of heads in the susceptible check Morocco and thereafter repeated every ten days for two more evaluations. Due to the limited information provided on Pst head infection, no specific rust-based scale was identified for the evaluation. Instead, we used the scale for other wheat diseases that mainly affect heads such as common bunt (Tilletia tritici (syn. Tilletia caries) and T. laevis (syn. T. foetida)). Therefore, Pst head evaluation was done using the following formula [30]
Using this scale, genotypes were classified as very resistant genotypes (VR) = 0% infected heads, resistant genotypes (R) = 0.1–5.0%, moderately resistant (MR) = 5.1–10%, moderately susceptible (MS) = 10.01–30%, susceptible (S) = 30.1–50%, and very susceptible (VS) = 50.1–100% [31].
Furthermore, for both Pst foliar and head infection, the area under the disease progress curve (AUDPC) was estimated using the following formula
where yi is the assessment of stripe rust disease (coefficient of infection for the foliar infection and percentage of infected heads for head infection) at the ith observation, ti is time in days at the ith observation, and n is the total number of observations [32].
To provide more understanding of the effect of Pst foliar and head infection on the wheat plants, kernel traits such as kernel length (KL, cm), kernel width (KW, cm), kernel area (KA, cm2), and thousand kernel weight (TKW, gm) were evaluated after maturity. KL and KW were evaluated using a normal ruler by measuring the length and width of 25 to 30 random kernels from each genotype/replication. The average value was recorded for each replication and used in further analyses. KA and TKW were estimated on 100 grains that were randomly collected for each genotype/replication. KA was calculated using ImageJ 1.53 software [33]. TKW was estimated by weighing 100 seeds/replication using an electronic balance and multiplying their weight by 10.
2.4. Data on Climatic Conditions
Climatic parameters such as maximum temperature (), minimum temperature (), maximum humidity (%), average humidity (%), minimum humidity (%), maximum dew point (), average dew point (), and minimum dew point () were obtained from the weather station at Sakha Agricultural Research Stations. This meteorological data was obtained for wheat growing months (January, February, March, April, and May) for each growing season (2021 and 2022). Differences between maximum and minimum temperatures were calculated manually from the collected data.
2.5. Statistical Analysis of Stripe Rust Resistance and Climate Parameters
To conduct analysis of variance (ANOVA), CI and percentage of infection were used for foliar and head infection, respectively. The ANOVA was performed using PLABSTAT software Version 2N. Ref. [34] using the following model
where Yijk is an observation of genotype i in replication j which was planted in year k; µ is the general mean; gi, ri, and Ek are the main effects of genotypes (fixed effects), replications, and years (random effects), respectively; and eijk is the error. Broad-sense heritability was calculated in each year using the following formula:
where and are the variances of the genotypes and the residuals, respectively. r is the number of replicates.
Yijk = µ + gi + rj + yk + gyik + eijk
Phenotypic correlations were calculated and visualized using SRPlot online database available at http://www.bioinformatics.com.cn/srplot (accessed on 15 October 2022). Furthermore, the same online database was used to visualize the AUDPC and correlation between head infection (%) and foliar infection (%), a 3D plot and a scatter plot, respectively, using the same online database.
2.6. Genotyping of the Tested Materials and Calculating the Genetic Distance
The wheat genotypes were genotyped using a 25K Infinium iSelect array (25K-SNPs). For this purpose, the DNA was extracted, and SNP genotyping was performed by SGS Institute Fresenius GmbH TraitGenetics Section (Gatersleben, Germany). The genotyping method was illustrated in detail in [35,36]. In total, 21,093 SNP markers were generated for only 31 genotypes. The marker data of the tested materials was used to calculate the genetic distance among the genotypes following a simple matching coefficient model using TASSEL software V. 5.0 [37] and visualized as a phylogenetic tree using iTOL website, available at https://itol.embl.de/upload.cgi (accessed on 20 October 2022).
3. Results
Previously, Pst head infection was known to occur in highly susceptible wheat genotypes and was thought to be an extension of foliar infection. However, recently head infection in highly resistant genotypes was identified in Egypt. These findings mean that genotypes with no Pst foliar infection (PstFI) could have Pst head infection (PstHI) (Figure 1a,b). The infected heads contained many Pst spores inside their floral parts (Figure 1c). Wheat kernels produced from these infected heads were very shriveled compared to the kernels produced from healthy heads harvested at the same time (Figure 1d). Therefore, this phenomenon and comparing it with Pst foliar infection was worth studying to understand more about PstHI and its resistance.
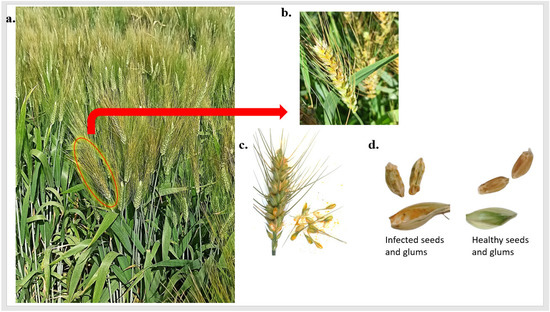
Figure 1.
Stripe rust head infection (PstHI) symptoms, (a) genotype that is highly resistant to stripe rust foliar disease and had infected heads, (b) wheat infected heads, (c) the presence of stripe rust spores inside the glums, and (d) the differences between healthy and infected wheat kernels and glums.
3.1. Evaluation of Stripe Rust Infection in the Egyptian Wheat Germplasm
3.1.1. Phenotypic Variation in Pst Foliar Infection
To determine the level of stripe rust infection, infection in the susceptible check, Morocco, was investigated. In each growing season, Morocco was highly susceptible to stripe rust with a CI of 100 for foliar infection in both seasons (Table S1). The analysis of variance (ANOVA) revealed highly significant differences among the genotypes for PstFI as well as genotype × years interaction (Table 1). Moreover, no significant differences between the two seasons (2021 and 2022) for PstFI were found. A highly significant correlation was found between PstFI in the two growing seasons with r = 0.87, p-value < 0.00001 (Figure S1a). High broad-sense heritability was found with a value of 0.92. Based on the average of both seasons, the coefficient of infection (CI) ranged from 0% to 84% (Figure 2a). Out of the 34 tested genotypes, seven genotypes were resistant in both growing seasons and two additional genotypes were resistant in 2021, but not in 2022, to PstFI with a CI value ≤ 4% (Figure S2 and Table S1). Out of these seven resistant genotypes, one breeding line (Qadry_7) was immune in both years.

Table 1.
Analysis of variance of stripe rust symptoms on the foliar parts and wheat heads in the studied Egyptian genotypes.
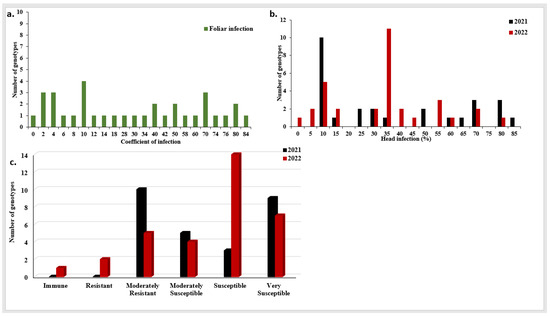
Figure 2.
Stripe rust head (PstHI) and foliar (PstFI) infection in the two growing seasons in the tested Egyptian genotypes, (a) coefficient of PstFI mean of the two growing seasons, (b) distribution of PstHI in each growing season, (c) the number of genotypes showed different degrees of stripe rust PstHI in each growing season.
3.1.2. Phenotypic Variation in Stripe Rust Head Infection
The susceptible check, Morocco, showed a high degree of PstHI with a percentage of 100% in both growing seasons (Table S1). The analysis of variance (ANOVA) for PstHI showed highly significant differences between the two growing seasons (Table 1). Furthermore, highly significant differences among the tested genotypes and genotype × years interaction were found. No significant correlation was found between PstHI in the two growing seasons (r = 0.252, p-value = 0.196) (Figure S1b). The degree of broad-sense heritability was 0.78. In 2021, the percentage of PstHI ranged from 6.67% to 83.33% while it ranged from 0% to 80% in 2022 (Figure 2b). Furthermore, no genotypes showed an immune or resistant response in 2021, while ten genotypes showed moderately resistant (MR) responses. The remaining genotypes showed different degrees of susceptibility with five, three, and nine moderately susceptible (MS), susceptible (S), and very susceptible (VS) genotypes, respectively (Figure 2c). In 2022, one, two, and five genotypes showed immune, R, and MR responses, respectively (Figure 2c). The remaining genotypes had different degrees of susceptibility with four, 14, and 7 MS, S, and VS genotypes, respectively. In total, ten resistant genotypes were found in 2021 with a percentage of infection ranging from 6.67 to 10%. While, in 2022, eight resistant genotypes were found with a percentage of infection ranging from 0% (Giza 139) to 10% (three genotypes, BeniSweif-6, Gimmiza10, and Sids13) (Figure 2b and Table S1). Out of these resistant genotypes, six genotypes were resistant in both growing seasons (Figure S2b and Table S1).
3.2. The Relation between Stripe Rust Foliar and Head Infection
To understand the relation between PstHI and PstFI, the correlation between the two symptoms was tested in each growing season separately. Very low significant correlations were found with r values of 0.23 and 0.13 in 2021 and 2022, respectively (Figure 3a,b). Furthermore, the area under the disease progress curve (AUDPC) was calculated for each disease symptom in each season separately. In 2021, the lowest AUDPC for PstHI was found for Misr2 genotype while this genotype was one of the highest ten genotypes based on AUDPC for PstFI (Figure 3c). On the same pattern, Giza_139 (which had the lowest value of AUDPC for PstHI in 2022) was not among the best genotypes based on the AUDPC for PstFI and had an intermediate CI value (Figure 3d). As it appears from Figure 3c,d, many genotypes had different responses to PstFI and PstHI. Furthermore, no significant correlation was found between AUDPCs for the two symptoms in the growing seasons (Figure S3).
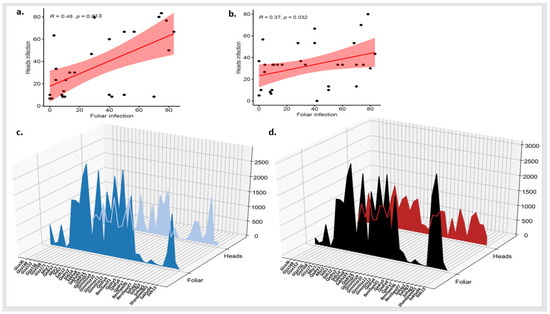
Figure 3.
Correlation between stripe rust foliar and head infection (PstFI and PstHI) in 2021 (a) and 2022 (b) growing seasons, and the area under disease progress curve (AUDPC) for foliar and head infection in 2021 growing season (c) and 2022 growing season (d).
The number of foliar and head resistant genotypes was investigated in both growing seasons. In 2021, three genotypes were found to be resistant to both foliar and head infection, three were resistant to PstHI only, and six genotypes were resistant to PstFI only (Figure S3a). While, in 2022, three genotypes were resistant to both foliar and head infection, five were resistant to PstHI only, and four genotypes were resistant to PstFI only (Figure S3b). The three resistant genotypes to both foliar and head infections were the same in both growing seasons.
3.3. Climate Parameters That Affect Stripe Rust Infection
Due to the presence of highly significant differences in PstHI in the two growing seasons, all the available climatic parameters were collected for the wheat growing period in both seasons (from January to April). The ANOVA revealed highly significant differences in maximum temperature, minimum temperature, average dew point, and maximum dew point between the two years with no significant differences in the remaining climate factors (Table S3). The climate records of these four significant climatic parameters were plotted with the disease symptoms on the same dates to investigate the relationship between the infection and these factors. In both growing seasons, PstFI was found to increase when the four factors were getting smaller and decrease when they start to go higher (Figure 4a,b). In 2021, a great increase in PstHI was noticed when a reduction in maximum dewpoint was combined with a stable minimum temperature (Figure 4c). Such an increase in PstHI was not noticed in 2022 when the decrease in maximum dewpoint was combined with a great reduction in minimum temperature (Figure 4d).
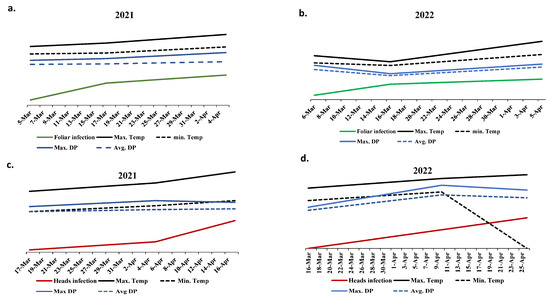
Figure 4.
The relationship between the four significant climate factors (℉) and percentage of foliar infection (%) (a,b) as well as head infection (c,d) in the two growing seasons (2021 (a,c) and 2022 (b,d)).
As PstHI was increased in Egypt over the last few years, it was worth identifying the changes that occurred in the climate in the last period. Therefore, the records of the four important climatic parameters during the grain filling (March and April) were compared over the last ten years (Figure S5). As noted, the average and maximum dew point began to decrease in March with great differences between March and April, especially in the last two years (2021 and 2022). Furthermore, a decrease in maximum and minimum temperature in March was found in the last four years with a great increase in April (Figure S5c,d). April minimum temperature was a little bit stable in the 2019–2021 growing seasons (Figure S5d).
3.4. Evaluation of the Isolines to Both Stripe Rust Symptoms
To investigate possible genes that control the resistance to Pst foliar and head infections, a set of 51 isolines that are carrying different Yr-resistant genes were evaluated for two years (Table S2). Out of these isolines, ten were resistant to PstFI and PstHI in both growing seasons (Figure 5a). These ten isolines were found to be immune to PstFI and PstHI, except Yr37 and YrALD which had 10% of infected heads in 2022 (Figure 5b). The remaining eight immune isolines were found to carry Yr5, Yr15, YrSP, Yr51, YrKK, Yr3 (Tartara), Yr18 (Super Kauz), and Yr18 and Yr31 for OPATA/PASTOR (Figure 5b). Moreover, three and seven isolines were resistant to PstHI in both years as well as PstFI in at least one growing season (2021 or 2022). Out of the 51 isolines that carried different Yr genes, 17 and 13 genes were resistant to PstFI in 2021 and 2022, respectively. Furthermore, 30 and 27 genes were resistant to PstHI in 2021 and 2022, respectively (Table S2 and Figure 5a).
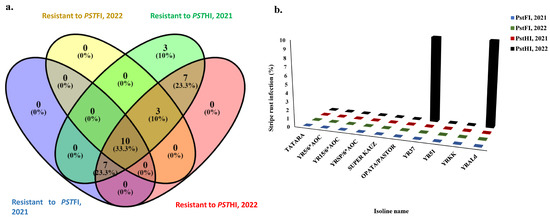
Figure 5.
The response of the tested isoline to stripe rust foliar (PstFI) and head infection (PstHI) symptoms, (a) the number of isolines that are resistant to each symptom in each growing season, (b) the percentage of infection in the resistant isoline to both symptoms in each growing season.
3.5. Effect of PstFI and PstHI on Important Kernel Traits
The ANOVA represented highly significant differences among genotypes for KL and TKW (Table 2). Furthermore, significant differences were found between the two growing seasons for KL and KW with no significant differences between the two seasons for TKW. The correlation between PstFI and PstHI individually and kernel traits was performed to better understand the interrelationship of the disease and grain filling. In 2021, a significant negative correlation was found between PstFI and each KL, KW, and TKW. In addition, significant negative correlations were found between PstHI and both KW and TKW with no significant correlation between PstHI and KL. Both PstFI and PstHI were not significantly correlated with KA (Figure 6a). In 2022, significant negative correlations were found between PstFI and KL, KA, and TKW, while no significant correlation was found between PstHI and any of the studied kernel traits (Figure 6b).
Table 2.
Analysis of variance for the studied kernel traits (kernel length (KL), kernel width (KW), and thousand kernel weight (TKW)) under stripe rust conditions.
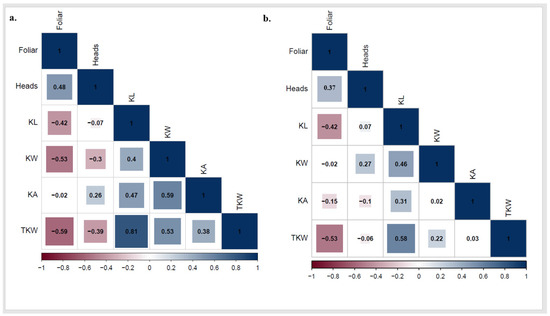
Figure 6.
Correlation between kernel traits (kernel length (KL), kernel width (KW), kernel area (KA), and thousand kernel weight (TKW)) and stripe rust foliar and head infection in 2021 (a) and 2022 (b) growing seasons.
To investigate the effect of the disease on kernel traits, the tested genotypes were classified into four groups based on their response to both PstFI and PstHI. The distribution of each kernel trait in each group of genotypes was investigated. In 2021, the greatest KL was found in the genotypes that are resistant to PstFI. While the genotypes that are resistant to PstFI and PstHI also had a good range of KL. Interestingly, genotypes that are only resistant to PstHI had KL lower than genotypes that are susceptible to PstFI and PstHI (Figure 7a). For KW, the highest values were found in the group of genotypes that are resistant to both PstFI and PstHI followed by genotypes that are resistant to PstFI and then genotypes that are resistant to PstHI (Figure 7b). KA was very similar for the four groups of genotypes (Figure 7c). The greatest values of TKW were observed in the PstFI-resistant group followed by the PstHI-resistant group which was very similar to the group that was resistant to both PstFI and PstHI (Figure 7d).
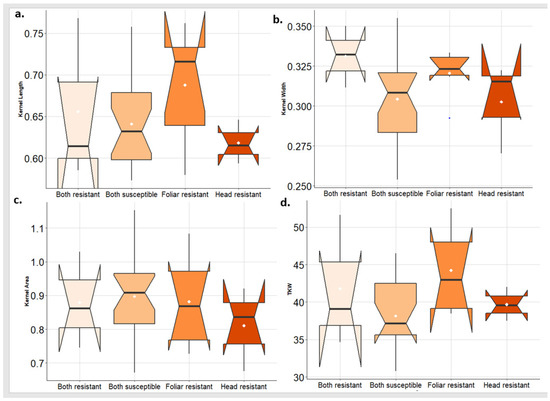
Figure 7.
Comparison of the kernel traits (kernel length (KL) (a), kernel width (KW) (b), kernel area (KA) (c), and thousand kernel weight (TKW) (d)) in the genotypes that are resistant to foliar and head infection, resistant to foliar infection only, resistant to head infection only, and susceptible to both symptoms in 2021 growing season.
In 2022, the highest values of KL and KA were found in the group of genotypes that are resistant to PstHI followed by the PstFI-resistant group (Figure 8a,c). While the greatest values of KW were found in the PstFI-resistant group of genotypes followed by PstHI-resistant groups (Figure 8b). The highest value of TKW was obtained in the group of genotypes that are resistant to both symptoms followed by the PstFI-resistant group and then the PstHI-resistant group (Figure 8d).
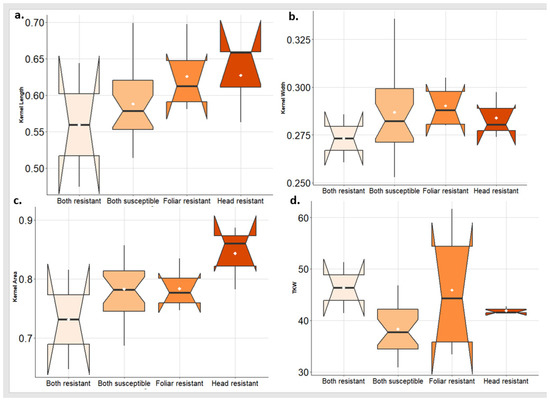
Figure 8.
Comparison of the kernel traits (kernel length (KL) (a), kernel width (KW) (b), kernel area (KA) (c), and thousand kernel weight (TKW) (d)) in the genotypes that are resistant to foliar and head infection, resistant to foliar infection only, resistant to head infection only, and susceptible to both symptoms in 2022 growing season.
3.6. Selection of Superior Genotypes for Both Stripe Rust Infection Symptoms
To improve stripe rust resistance in the Egyptian wheat germplasm, resistant genotypes to both PstFI and PstHI, as well as resistant genotypes to at least one symptom, were detected and selected from the tested materials (Table 3). Three genotypes were found to be resistant to PstFI and PstHI. Notably, none of these three resistant genotypes was immune to head infection. Furthermore, the percentage of head infection in the genotypes that were resistant only to PstHI ranged from 0% for Giza-139 in 2022 to 10% for Giza-152 in 2021. Remarkably, Giza-139 was immune to PstHI in 2022 and had a percentage of 8.33% PstHI in 2021.
Table 3.
List of genotypes that showed the same response of stripe rust foliar and head resistance in both growing seasons (2021 and 2022).
To genetically investigate the possibility of improving Pst resistance in the Egyptian wheat germplasm using these genotypes as parents, the genetic distance among all the tested genotypes was calculated and represented in Table S4 and Figure 9. The genotypes are grouped into three clusters with three, four, and 24 genotypes in cluster1, cluster2, and cluster3, respectively. Out of the three selected genotypes that are resistant to both PstFI and PstHI, two genotypes, Sids-13 and Sohag-3, were located in cluster 3 with a genetic distance of 0.47. While the third superior genotype Giza-168 was located in cluster 1 and was separated from Sids-13 and Sohag-3 with a distance of 0.34 and 0.49, respectively (Table S4). The three genotypes that were resistant only to PstHI were located in the same clusters (cluster 1 and 3) as the group of genotypes that are resistant to both symptoms. The four genotypes that are resistant only to PstFI were clustered in cluster 3. The greatest genetic distance among the four PstFI-resistant genotypes and PstHI-resistant genotypes was found between BeniSweif-7 and Giza_171 with a distance of 0.489, while the greatest distance between these four genotypes and genotypes resistant to both PstFI and PstHI was 0.497 between BeniSweif-7 and Giza_168. Notably, all genotypes that were located in cluster 2 were found to be susceptible to both PstFI and PstHI.
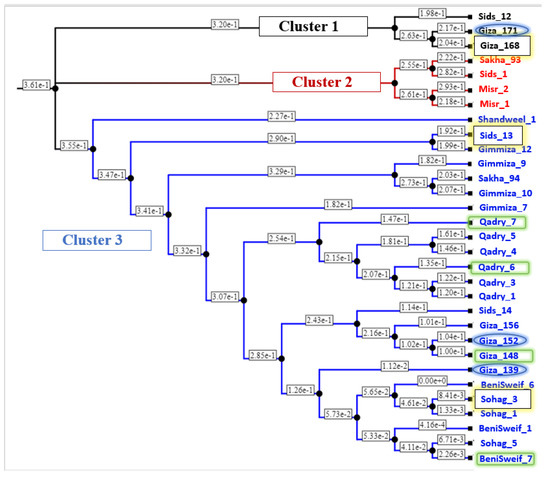
Figure 9.
The phylogeny tree represents the genetic distance among the Egyptian distance genotypes. Yellow highlighted genotypes are resistant to both Pst head and foliar infection, blue highlighted genotypes are resistant only to Pst head infection, and green highlighted genotypes are resistant to Pst foliar infection only.
4. Discussion
Many efforts have been made to improve wheat stripe rust resistance in Egyptian wheat germplasm [9,14,38]. Global climate changes have been predicted to increase wheat stripe rust infection and crop losses [39,40,41]. In the last few years, PstHI has been noticed in Egyptian wheat as a separate disease symptom that could occur in genotypes highly resistant to PstFI (Figure 1). Very few studies have reported the same phenomena in wheat globally [21]. Therefore, genetic control and the possibility of improving PstHI are still poorly understood. This study is the first report of PstHI in Egyptian wheat and can increase our understanding of its effect on kernel traits as well as test the possibility of improving resistance in Egyptian wheat germplasm.
4.1. Phenotypic Evaluation of Stripe Rust Foliar and Head Infection
In both growing seasons, the susceptible check, Morocco, showed a highly susceptible reaction to PstFI and PstHI which confirms the presence of highly aggressive stripe rust infection. The presence of highly significant differences among the tested genotypes for both symptoms confirmed the successes of the phenotypic assay. Furthermore, the presence of highly significant differences among genotypes confirmed the presence of high genetic variation in the tested Egyptian genotypes (Table 1). High genetic variation, when it includes resistant genotypes, is very useful in selecting cultivars for release and parent lines for future breeding. Furthermore, the presence of a significant difference between years for PstHI with no significant differences for PstFI indicated that the response of the genotypes in both years was the same for PstFI while they differ in their response for PstHI. Thus, the resistance to both PstFI and PstHI seem to be controlled by different genetic systems. No significant correlation was found between PstFI and PstHI in the two seasons confirming that PstFI and PstHI are different phenomena. Furthermore, the presence of some genotypes with different AUDPC for both symptoms in both growing seasons confirmed our results (Figure 2c,d). The three resistant genotypes to PstFI and PstHI were identified previously as PstFI resistant genotypes under Egyptian conditions [38,39]. However, the percentage of PstHI in these genotypes was high which confirmed that PstFI and PstHI are not correlated. A greater percentage of head infection was found in 2021 compared to 2022 which indicates the presence of more aggressive infection in this season (Table S1 and Figure 2b). The high values of broad-sense heritability for both PstFI and PstHI indicated that the phenotypic variation in the resistance to both PstFI and PstHI is stable and mainly due to the genotypic variation. Therefore, selecting highly resistant genotypes from the current tested material is possible. However, the degree of broad-sense heritability for PstHI was lower than PstFI which suggested that PstHI is more affected by the environment. High degrees of wheat resistance to PstFI were reported previously [4,9,14,41,42].
4.2. Climate Changes and Stripe Rust Infection
The two growing seasons differed for maximum temperature, minimum temperature, average dew point, and maximum dew point suggesting that the GxE effects for PstHI could be due to these weather factors. All these four climatic factors are within the preferred ranges by Pst fungus. However, PstHI was found to rapidly increase when the maximum dewpoint decreased with a slight increase in the maximum temperature starting from 5 April 2021 (Figure 4c). Despite the decrease in maximum dew point on 10 April 2022, PstHI did not increase. This result may be explained by the presence of a stable maximum temperature with an extreme reduction in the minimum temperature (Figure 4d). It was reported that the perfect dew point for Pst is between 59 and 68 (15 °C to 20 °C) [43]. The average dew point in 2021 was lower than in 2022 and neither season had dew points that exceeded the preferred range for infection. The higher percentage of PstHI in 2021 could be due to the lower average dew point temperature. The average dew point decreased during April in the last three years compared with previous years (Figure S4). Therefore, PstHI is expected to increase if the lower dew point continues due to climate change which will increase the importance of having resistance to PstHI.
4.3. Effective Stripe-Rust-Resistant Genes to Both PstFI and PstHI Symptoms
The isoline set evaluated in this study was very useful to shed light on the possible resistant genes to both symptoms under Egyptian conditions. This set is widely used in identifying the possible resistant genes to stripe rust [44,45]. Ten isolines carrying at least nine different resistant genes (Yr3, Yr5, Yr18, Yr25, Yr31, Yr37, Yr51, YrAld, and YrSP) were resistant to PstFI and PstHI (Figure 6a,b). These nine genes are useful genes that should be included in future breeding programs to produce highly resistant wheat genotypes. Furthermore, ten other genes (Yr8, Yr10, Yr17, Yr18, Yr33, Yr34, Yr54, Yr57, YrKK, and Yr4PL) were resistant to PstHI in both growing seasons. These genes could be added to recent PstFI-resistant genotypes to improve PstHI as a useful gene pyramid for Egyptian conditions.
4.4. Effect of PstFI and PstHI on Kernel Traits
A highly positive correlation was found between TKW and the studied kernel traits in both growing seasons, except KA in 2022. High genetic variation was found among the tested genotypes for KL and TKW confirming that these genotypes are a good source for wheat breeders to produce high-yielding genotypes that are resistant to Pst (Table 2). KL, KW, and KA were reported as highly correlated traits to kernel weight and milling quality [46,47,48,49,50]. No significant differences were found among the tested genotypes for KW suggesting that Egyptian wheat genotypes have almost similar KW. Improving KW in the Egyptian wheat germplasm would be difficult using these genotypes. The presence of highly significant differences between the two growing seasons for KL and KW suggests the different effects of Pst infection on these kernel traits in the two seasons. However, no significant differences in TKW were found between the two years suggesting that Pst did not affect the harvested grain for TKW in both years.
Notably, significant negative correlations were found between PstFI and all the studied kernel traits in both growing seasons (except KA in 2021). These negative correlations confirm the negative effect of PstFI on wheat kernel quality. The presence of the negative effect of PstFI in the two growing seasons supported the absence of a significant GxE for PstFI between the two seasons; thus, both seasons had the same effect on kernel traits. Furthermore, the negative correlation between PstHI and both TKW and KW in 2021 suggests that head infection reduces kernel width and weight with no effect on KL and KA in the harvested grain. This effect notably appears when comparing kernels produced from healthy spikes and kernels produced from infected heads (Figure 1d). A significant correlation was not found in 2022 suggesting that PstHI did not affect kernel traits in that growing season. However, significant GxE was found between the two growing seasons for PstHI with a lower percentage of infection in 2022 (Figure 2b,c and Table 1). Therefore, the effect of PstHI infection on kernel traits may have been too small to affect the PstHI results in 2022.
Notably, in 2021, resistant genotypes to PstFI had greater KL than resistant genotypes to PstFI and PstHI suggesting that there was little effect of PstHI on KL. This result was expected due to a non-significant correlation between KL and PstHI and the presence of a highly significant negative correlation between KL and PstFI (Figure 7a). Furthermore, higher values of TKW were found in the PstFI-resistant genotypes than in genotypes that are resistant to both symptoms. It was reported that, during the grain-filling growth stage, a considerable amount of photosynthates/carbohydrates is needed for grain filling. These photosynthates mainly come from the stem and foliar parts [51]. Therefore, resistant genotypes to PstFI should produce higher TKW than susceptible genotypes or genotypes that are resistant only to PstHI. Moreover, many endeavors have improved wheat resistance to PstFI globally as well as in Egypt [9,14,52,53]. Therefore, higher TKW in the PstFI-resistant group than in resistant genotypes to PstFI and PstHI is possible. Moreover, KA had the same average in all four groups of genotypes confirming that PstFI and PstHI do not have any effect on this trait. Higher values of KW were found in the genotypes that are resistant to PstFI and PstHI than in genotypes resistant to only PstFI or PstHI (Figure 8b). Thus, including resistance to PstHI as a selection criterion in future breeding programs may be important. In 2022, the percentage of PstHI was lower than in 2021; therefore, the effect of PstHI on kernel traits was not as damaging. However, higher values of TKW and KW were found in the group of genotypes that are resistant only to PstFI which again confirms the role of foliar plant parts in kernel growth and filling. The higher values of KL and KA were found in the genotypes that are resistant only to PstHI. However, PstHI did not affect these two kernel traits and the presence of higher values in the resistant genotypes could not be related to their resistance. PstFI was recorded to decrease TKW [20,38,54,55]. Therefore, resistant genotypes were expected to have higher values of TKW in both growing seasons. No previous studies investigated the effect of PstHI on kernel traits. All the studied kernel traits had a high degree of heritability; hence, the selection of resistant genotypes with high kernel quality seems to be possible using these genotypes.
4.5. Selection of Resistant Genotypes to Both Stripe Rust Symptoms
Three genotypes (Giza-168, Sohag_3, and Sids_13) were identified to be resistant to PstFI and PstHI (Table 3). Furthermore, four genotypes (Giza 148, BeniSweif-7, Qadry_07, and Qadry_06) were resistant only to PstFI. Previous studies reported the resistance of Giza 168, Sohag_3, Sids_13, Giza_148, and BeniSweif-7 to PstFI under Egyptian conditions [9,14,38]. The presence of intermediate PstFI resistance was reported previously in Giza_152 and Giza_171 genotypes [9,38]. In our study, these genotypes became susceptible to PstFI and resistant to PstHI suggesting the presence of independent PstHI-resistant genes in their germplasm. These genes became insufficient for PstFI resistance but sufficient for PstHI resistance which confirmed that PstFI and PstHI are uncorrelated and genetically controlled by different genetic systems. The ten selected genotypes could be a good source to improve stripe rust resistance to PstFI and PstHI under Egyptian conditions. However, due to the high percentage of PstHI in the selected genotypes and the absence of immune genotypes to PstHI, looking for other sources of head infection is needed.
Unfortunately, not all the ten selected genotypes were genetically distant from each other. Some genotypes were genetically very near to each other, such as Giza_152, Giza_148, and Giza_139, and may have similar resistance alleles. Crossing between genetically distant genotypes is often preferred as those genotypes may have different alleles [56]. Therefore, related genotypes should be used as parents with care in future breeding programs. The greatest genetic distance was found between Giza_168 (resistant to PstFI and PstHI) and Benisweif-7 (resistant to PstFI only) with a value of 0.4969 (Table S4). However, due to the high percentage of head infection in Giza_168 (10% and 5%), looking for other sources of resistance to PstFI is needed.
5. Conclusions
In conclusion, our study elucidates, for the first time, the importance of emerging wheat PstHI under Egyptian conditions. Stripe rust head infection has increased and became noticed in Egypt. Climate changes (including weather fluctuations), especially dew point and ambient temperature, are possible reasons for increasing PstHI. Resistance to PstHI was not correlated with resistance to PstFI and the resistance to each symptom seems to be controlled by different genetic systems. Hence, wheat breeders may need to pay more attention to PstHI and consider it as a selection criterion in future wheat breeding programs. PstHI was found to significantly reduce kernel width and weight in heavily diseased years. Therefore, a significant reduction in wheat yield and quality is expected in case of severe PstHI. The three selected genotypes that are resistant to PstFI and PstHI could be a good source for improving Pst resistance in Egyptian wheat germplasm. However, due to the low genetic distance among these genotypes as well as the high percentage of PstHI, finding other sources of resistance in a wider genetic base is needed.
Supplementary Materials
The following supporting information can be downloaded at: https://www.mdpi.com/article/10.3390/agronomy13061509/s1, Figure S1: Correlation between Pst foliar infection in 2021 and 2022 growing seasons (a) and Pst head infection in 2021 and 2022 growing seasons (b); Figure S2: (a,b) Number of genotypes that showed the same response in both growing seasons. Figure S3: Correlation between area under disease progress curve (AUDPC) for stripe rust heads and foliar infection in 2021 (a) and 2022 (b) growing seasons. Figure S4: The number of genotypes that are resistant to stripe rust foliar and heads infection in 2021 (a) and 2022 (b) growing seasons. Figure S5: The average of dewpoint (a), maximum dewpoint (b), maximum temperature (c), and minimum temperature (d) during the grain filling period (March and April) among the last ten years in Kafr ElSheik, Egypt. Table S1: List of the tested genotypes, their pedigree, and their foliar infection and head infection in each of the growing seasons. Table S2: The response of the tested set of isolines in both growing seasons for stripe rust foliar and heads infection. Table S3: Analysis of variance of weather conditions in Sakha in the two growing seasons 2021 and 2022. Table S4: Matrix of genetic distance among the studied 34 Egyptian genotypes.
Author Contributions
S.M.E. designed the experiment, evaluated the genotypes, and helped in drafting the manuscript. G.E.O. helped in evaluating the genotypes. W.M.E.-O. helped in designing the experiment. A.B. reviewed the manuscript. A.M.I.M. helped in designing the experiment, performed the genetic and phenotyping analysis, discussed the results, and drafted the manuscript. All authors have read and agreed to the published version of the manuscript.
Funding
This work was financially partially supported by Alexander von Humboldt foundation. Costs for open access publishing were partially funded by the Deutsche Forschungsgemeinschaft (DFG, German Research Foundation, grant 491250510).
Data Availability Statement
The datasets used and/or analyzed during the current study are available from the corresponding author on reasonable request.
Acknowledgments
The authors would like to thank Sakha’s station team of wheat disease for help in conducting the experiment. The authors would like to thank P. Stephen Baenziger, Department of Agronomy and Horticulture, University of Nebraska-Lincoln, USA for his help in editing the manuscript and discussing the results.
Conflicts of Interest
The authors declare no conflict of interest.
Abbreviations
PstFI: stripe rust (Pst) foliar infection, PstHI: stripe rust (Pst) head infection, CI: coefficient of infection, AUDPC: area under disease progress curve, MR: moderately resistant genotype, R: resistant genotype, S: susceptible genotype, VS: very susceptible genotype.
References
- Lagudah, E.S.; Krattinger, S.G.; Herrera-Foessel, S.; Singh, R.P.; Huerta-Espino, J.; Spielmeyer, W.; Brown-Guedira, G.; Selter, L.L.; Keller, B. Gene-Specific Markers for the Wheat Gene Lr34/Yr18/Pm38 Which Confers Resistance to Multiple Fungal Pathogens. Theor. Appl. Genet. 2009, 119, 889–898. [Google Scholar] [CrossRef] [PubMed]
- Markell, S.G.; Milus, E.A. Emergence of a Novel Population of Puccinia striiformis f. sp. tritici in Eastern United States. Phytopathology 2008, 98, 632–639. [Google Scholar] [CrossRef] [PubMed]
- Lara, E.P. Mapping of Genomic Regions Associated with Agronomic Traits and Resistance to Diseases in Canadian Spring Wheat. Ph.D. Thesis, University of Alberta, Edmonton, AB, Canada, 2017. [Google Scholar]
- Yuan, F.P.; Zeng, Q.D.; Wu, J.H.; Wang, Q.L.; Yang, Z.J.; Liang, B.P.; Kang, Z.S.; Chen, X.H.; Han, D.J. QTL Mapping and Validation of Adult Plant Resistance to Stripe Rust in Chinese Wheat Landrace Humai 15. Front. Plant Sci. 2018, 9, 968. [Google Scholar] [CrossRef] [PubMed]
- Singh, A.; Knox, R.E.; DePauw, R.M.; Singh, A.K.; Cuthbert, R.D.; Campbell, H.L.; Shorter, S.; Bhavani, S. Stripe Rust and Leaf Rust Resistance QTL Mapping, Epistatic Interactions, and Co-Localization with Stem Rust Resistance Loci in Spring Wheat Evaluated over Three Continents. Theor. Appl. Genet. 2014, 127, 2465–2477. [Google Scholar] [CrossRef]
- Li, J.; Dundas, I.; Dong, C.; Li, G.; Trethowan, R.; Yang, Z.; Hoxha, S.; Zhang, P. Identification and Characterization of a New Stripe Rust Resistance Gene Yr83 on Rye Chromosome 6R in Wheat. Theor. Appl. Genet. 2020, 133, 1095–1107. [Google Scholar] [CrossRef]
- Omara, R.; El-Naggar, D.; Abd El-Malik, N.; Ketta, H. Losses Assessment in Some Egyptian Wheat Cultivars Caused by Stripe Rust Pathogen (Puccinia striiformis). Egypt. J. Phytopathol. 2016, 44, 191–203. [Google Scholar] [CrossRef]
- Shahin, A.; Shaheen, S.; Abu, A.A.A. Virulence and Diversity of Wheat Stripe Rust Pathogen in Egypt. J. Am. Sci. 2015, 11, 47–52. [Google Scholar]
- Abou-Zeid, M.A.; Mourad, A.M.I. Genomic Regions Associated with Stripe Rust Resistance against the Egyptian Race Revealed by Genome-Wide Association Study. BMC Plant Biol. 2021, 21, 42. [Google Scholar] [CrossRef]
- Esmail, S.M.; Draz, I.S.; Ashmawy, M.A.; El-Orabey, W.M. Emergence of New Aggressive Races of Puccinia striiformis f. sp. tritici Causing Yellow Rust Epiphytotic in Egypt. Physiol. Mol. Plant Pathol. 2021, 114, 101612. [Google Scholar] [CrossRef]
- Morgounov, A.; Abugalieva, A.; Akan, K.; Akln, B.; Baenziger, S.; Bhatta, M.; Dababat, A.A.; Demir, L.; Dutbayev, Y.; El Bouhssini, M.; et al. High-Yielding Winter Synthetic Hexaploid Wheats Resistant to Multiple Diseases and Pests. Plant Genet. Resour. Characterisation Util. 2017, 16, 273–278. [Google Scholar] [CrossRef]
- Elbasyoni, I.S.; El-Orabey, W.M.; Morsy, S.; Baenziger, P.S.; Al Ajlouni, Z.; Dowikat, I. Evaluation of a Global Spring Wheat Panel for Stripe Rust: Resistance Loci Validation and Novel Resources Identification. PLoS ONE 2019, 14, e0222755. [Google Scholar] [CrossRef] [PubMed]
- El-Orabey, W.M.; Ashmawy, M.A.; Shahin, A.A.; Ahmed, M.I. Screening of Cimmyt Wheat Genotypes against Yellow Rust in Egypt. Int. J. Phytopathol. 2020, 9, 51–70. [Google Scholar] [CrossRef]
- Mourad, A.M.I.; Abou-Zeid, M.A.; Eltaher, S.; Baenziger, P.S.; Börner, A. Identification of Candidate Genes and Genomic Regions Associated with Adult Plant Resistance to Stripe Rust in Spring Wheat. Agronomy 2021, 11, 2585. [Google Scholar] [CrossRef]
- Hovmøller, M.S.; Walter, S.; Bayles, R.A.; Hubbard, A.; Flath, K.; Sommerfeldt, N.; Leconte, M.; Czembor, P.; Rodriguez-Algaba, J.; Thach, T.; et al. Replacement of the European Wheat Yellow Rust Population by New Races from the Centre of Diversity in the Near-Himalayan Region. Plant Pathol. 2016, 65, 402–411. [Google Scholar] [CrossRef]
- Hubbard, A.; Lewis, C.M.; Yoshida, K.; Ramirez-Gonzalez, R.H.; de Vallavieille-Pope, C.; Thomas, J.; Kamoun, S.; Bayles, R.; Uauy, C.; Saunders, D.G.O. Field Pathogenomics Reveals the Emergence of a Diverse Wheat Yellow Rust Population. Genome Biol. 2015, 16, 23. [Google Scholar] [CrossRef]
- Milus, E.A.; Kristensen, K.; Hovmøller, M.S. Evidence for Increased Aggressiveness in a Recent Widespread Strain of Puccinia striiformis f. sp. tritici Causing Stripe Rust of Wheat. Phytopathology 2009, 99, 89–94. [Google Scholar] [CrossRef]
- Cromey, M.G. Infection and Control of Stripe Rust in Wheat Spikes. New Zeal. J. Crop Hortic. Sci. 1989, 17, 159–164. [Google Scholar] [CrossRef]
- Allan, R.E.; Pritchett, J.A. Relationships of Stripe Rust Spike Infection to Morphologic and Agronomic Traits of Wheat. Crop Sci. 1972, 12, 412–414. [Google Scholar] [CrossRef]
- Singh, R.; Mahmoudpour, A.; Rajkumar, M.; Narayana, R. A Review on Stripe Rust of Wheat, Its Spread, Identification and Management at Field Level. Res. Crop. 2017, 18, 528–533. [Google Scholar] [CrossRef]
- Bouvet, L.; Percival-Alwyn, L.; Berry, S.; Fenwick, P.; Holdgate, S.; Mackay, I.J.; Cockram, J. Genetic Resistance to Yellow Rust Infection of the Wheat Ear Is Controlled by Genes Controlling Foliar Resistance and Flowering Time. Crop Sci. 2022, 62, 1758–1770. [Google Scholar] [CrossRef]
- Zadoks, J.C.; Chang, T.T.; Konzak, C.F. A Decimal Code for the Growth Stages of Cereals. Weed Res. 1974, 14, 415–421. [Google Scholar] [CrossRef]
- Purdy, L.H.; Allan, R.E. Stripe Rust Head Infection in Five Pacific Northwest Wheats. Plant Dis. Report. 1965, 49, 335–338. [Google Scholar]
- Cromey, M.G. Occurrence and Effects of Stripe Rust in Wheat Spikes in New Zealand. New Zeal. J. Crop Hortic. Sci. 1989, 17, 155–158. [Google Scholar] [CrossRef]
- El Jarroudi, M.E.; Kouadio, L.; Bock, C.H.; El Jarroudi, M.E.; Junk, J.; Pasquali, M.; Maraite, H.; Delfosse, P. A Threshold-Based Weather Model for Predicting Stripe Rust Infection in Winter Wheat. Plant Dis. 2017, 101, 693–703. [Google Scholar] [CrossRef] [PubMed]
- Te Beest, D.E.; Paveley, N.D.; Shaw, M.W.; Van Den Bosch, F. Disease-Weather Relationships for Powdery Mildew and Yellow Rust on Winter Wheat. Phytopathology 2008, 98, 609–617. [Google Scholar] [CrossRef] [PubMed]
- Peterson, R.; Campbell, A.; Hannah, A. A Diagrammitic Scale for Estimating Rust Intensity on Leaves and Stems of Cereals. Can. J. Res. 1948, 26, 496–500. [Google Scholar] [CrossRef]
- Stakman, E.C.; Stewart, D.M.; Loegering, W.Q. Identification of Physiologic Races of Puccinia Graminis Var. Tritici; USDA_ARS: Washington, DC, USA, 1962; Volume Washington. [Google Scholar]
- Roelfs, A.P.; Singh, R.P.; Saari, E.E. Rust Diseases of Wheat: Concepts and Methods of Disease Management; Mexico, D.F., Ed.; CYMMIT: Zapopan, Mexico, 1992; ISBN 968612747X. [Google Scholar]
- Mourad, A.M.I.; Sallam, A.; Belamkar, V.; Mahdy, E.; Bakheit, B.; El-wafaa, A.A.; Baenziger, P.S. Genetic Architecture of Common Bunt Resistance in Winter Wheat Using Genome-Wide Association Study. BMC Plant Biol. 2018, 18, 280. [Google Scholar] [CrossRef]
- Veisz, O.; Szunics, L.; Szunics, L. Effect of Common Bunt on the Frost Resistance and Winter Hardiness of Wheat (Triticum aestivum L.) Lines Containing Bt Genes. Euphytica 2000, 114, 159–164. [Google Scholar] [CrossRef]
- Simko, I.; Piepho, H.P. The Area under the Disease Progress Stairs: Calculation, Advantage, and Application. Phytopathology 2012, 102, 381–389. [Google Scholar] [CrossRef]
- Schneider, C.A.; Rasband, W.S.; Eliceiri, K.W. NIH Image to ImageJ: 25 Years of Image Analysis. Nat. Methods 2012, 9, 671–675. [Google Scholar] [CrossRef]
- Utz, H. PLABSTAT: A Computer Program for Statistical Analysis of Plant Breeding Experiments; Version 2N; University of Hohenheim: Stutgart, Germany, 1997. [Google Scholar]
- Esmail, S.M.; Omar, G.E.; Mourad, A. In-Depth Understanding of the Genetic Control of Stripe Rust Resistance (Puccinia striiformis f. sp. tritici) Induced in Wheat (Triticum aestivum L.) by Trichoderma asperellum T34. Plant Dis. 2023, 107, 457–472. [Google Scholar] [CrossRef] [PubMed]
- Aleksandrov, V.; Kartseva, T.; Alqudah, A.M.; Kocheva, K.; Tasheva, K.; Börner, A.; Misheva, S. Genetic Diversity, Linkage Disequilibrium and Population Structure of Bulgarian Bread Wheat Assessed by Genome-wide Distributed SNP Markers: From Old Germplasm to Semi-dwarf Cultivars. Plants 2021, 10, 1116. [Google Scholar] [CrossRef] [PubMed]
- Bradbury, P.J.; Zhang, Z.; Kroon, D.E.; Casstevens, T.M.; Ramdoss, Y.; Buckler, E.S. TASSEL: Software for Association Mapping of Complex Traits in Diverse Samples. Bioinformatics 2007, 23, 2633–2635. [Google Scholar] [CrossRef] [PubMed]
- Shahin, A.; Ashmawy, M.; El-Orabey, W.; Esmail, S. Yield Losses in Wheat Caused by Stripe Rust (Puccinia striiformis) in Egypt. Am. J. Life Sci. 2020, 8, 127. [Google Scholar] [CrossRef]
- Draz, I.; Esmail, S.; Abou-zeid, M.; Hafez, Y. Changeability in Stripe Rust Infection and GrainyYield of Wheat Associated to Climatic Conditions. Env. Biodiv. Soil Secur. 2019, 2, 143–153. [Google Scholar] [CrossRef]
- Zhang, N.; Liao, Z.; Wu, S.; Nobis, M.P.; Wang, J.; Wu, N. Impact of Climate Change on Wheat Security through an Alternate Host of Stripe Rust. Food Energy Secur. 2022, 11, e356. [Google Scholar] [CrossRef]
- Mateen, A.; Khan, M.A. Identification of Yellow Rust Virulence Pattern on Wheat Germplasm in Relation to Environmental Conditions in Faisalabad. Acad. J. Agric. Res. 2015, 3, 137–155. [Google Scholar] [CrossRef]
- Beukert, U.; Pfeiffer, N.; Ebmeyer, E.; Hinterberger, V.; Lueck, S.; Serfling, A.; Ordon, F.; Schulthess, A.W.; Reif, J.C. Efficiency of a Seedling Phenotyping Strategy to Support European Wheat Breeding Focusing on Leaf Rust Resistance. Biology 2021, 10, 628. [Google Scholar] [CrossRef]
- Grabow, B.S.; Shah, D.A.; DeWolf, E.D. Environmental Conditions Associated with Stripe Rust in Kansas Winter Wheat. Ph.D. Thesis, Kansas State University, Manhattan, KS, USA, 2016. [Google Scholar]
- Zhang, P.I.; Lan, C.; Singh, R.P.; Huerta-Espino, J.; Li, Z.; Lagudah, E.; Bhavani, S. Identification and Characterization of Resistance Loci to Wheat Leaf Rust and Stripe Rust in Afghan Landrace. Front. Plant Sci. 2022, 13, 1534. [Google Scholar] [CrossRef]
- Liu, D.; Yuan, C.; Singh, R.P.; Randhawa, M.S.; Bhavani, S.; Kumar, U.; Huerta-espino, J.; Lagudah, E.; Lan, C. Stripe Rust and Leaf Rust Resistance in CIMMYT Wheat Line “Mucuy” Is Conferred by Combinations of Race-Specific and Adult-Plant Resistance Loci. Front. Plant Sci. 2022, 13, 2963. [Google Scholar] [CrossRef]
- Cui, F.; Ding, A.; Li, J.; Zhao, C.; Li, X.; Feng, D.; Wang, X.; Wang, L.; Gao, J.; Wang, H. Wheat Kernel Dimensions: How Do They Contribute to Kernel Weight at an Individual QTL Level? Indian Acadmy Sci. 2011, 90, 409–425. [Google Scholar] [CrossRef] [PubMed]
- Iqbal, Z.; Pasha, I.; Abrar, M.; Arif, A.M.; Mashi, S. Single Kernel Characterization of Wheat Varieties in Relation to Milling Quality. J. Glob. Innov. Agric. Soc. Sci. 2015, 3, 136–141. [Google Scholar] [CrossRef]
- Ma, J.; Zhang, H.; Li, S.; Zou, Y.; Li, T.; Liu, J.; Ding, P.; Mu, Y.; Tang, H.; Deng, M.; et al. Identification of Quantitative Trait Loci for Kernel Traits in a Wheat Cultivar Chuannong16. BMC Genet. 2019, 20, 77. [Google Scholar] [CrossRef] [PubMed]
- Mourad, A.M.I.; Amin, A.E.E.A.Z.; Dawood, M.F.A. Genetic Variation in Kernel Traits under Lead and Tin Stresses in Spring Wheat Diverse Collection. Environ. Exp. Bot. 2021, 192, 104646. [Google Scholar] [CrossRef]
- Mourad, A.M.I.; Eltaher, S.; Börner, A.; Sallam, A. Unlocking the Genetic Control of Spring Wheat Kernel Traits under Normal and Heavy Metals Stress Conditions. Plant Soil 2023, 484, 257–278. [Google Scholar] [CrossRef]
- Sallam, A.; Alqudah, A.M.; Dawood, M.F.A.; Baenziger, P.S.; Börner, A. Drought Stress Tolerance in Wheat and Barley: Advances in Physiology, Breeding and Genetics Research. Int. J. Mol. Sci. 2019, 20, 3137. [Google Scholar] [CrossRef]
- Shahin, A.A. Occurrence of New Races and Virulence Changes of the Wheat Stripe Rust Pathogen (Puccinia striiformis f. sp. tritici) in Egypt. Arch. Phytopathol. Plant Prot. 2020, 53, 552–569. [Google Scholar] [CrossRef]
- Shahin, A. Effective Genes for Resistance to Wheatyellow Rust and Virulence of Puccinia striiformis f. sp. tritici in Egypt. Egypt. Acad. J. Biol. Sci. 2017, 8, 1–10. [Google Scholar] [CrossRef]
- He, C.; Zhang, Y.; Zhou, W.; Guo, Q.; Bai, B.; Shen, S.; Huang, G. Study on Stripe Rust (Puccinia striiformis) Effect on Grain Filling and Seed Morphology Building of Special Winter Wheat Germplasm Huixianhong. PLoS ONE 2019, 14, e0215066. [Google Scholar] [CrossRef]
- Al-maaroof, E.M.; Nori, A.M. Effect of Yellow Rust Disease on Quantitative and Qualitative Traits of Some Wheat Genotypes Under Rain-Fed Conditions. J. Appl. Biol. Sci. 2019, 13, 75–83. [Google Scholar]
- Bertan, I.; Carvalho, F.I.F.; De Oliveira, A.C. Parental Selection Strategies in Plant Breeding Programs. J. Crop Sci. Biotechnol. 2007, 10, 211–222. [Google Scholar]


Disclaimer/Publisher’s Note: The statements, opinions and data contained in all publications are solely those of the individual author(s) and contributor(s) and not of MDPI and/or the editor(s). MDPI and/or the editor(s) disclaim responsibility for any injury to people or property resulting from any ideas, methods, instructions or products referred to in the content. |
© 2023 by the authors. Licensee MDPI, Basel, Switzerland. This article is an open access article distributed under the terms and conditions of the Creative Commons Attribution (CC BY) license (https://creativecommons.org/licenses/by/4.0/).