Article

Integrated Nutrient Management Enhances Yield, Improves Soil Quality, and Conserves Energy under the Lowland Rice–Rice Cropping System

1
Indian Council of Agricultural Research-Central Coastal Agricultural Research Institute, Old Goa 403402, Goa, India
2
Department of Ecology and Environmental Science, Assam University, Silchar 788011, Assam, India
3
Feed the Future Innovation Lab for Collaborative Research on Sustainable Intensification, College of Agriculture, Kansas State University, Manhattan, KS 66506, USA
4
Department of Agronomy, Kansas State University, Manhattan, KS 66506, USA
*
Author to whom correspondence should be addressed.
Agronomy 2023, 13(6), 1557; https://doi.org/10.3390/agronomy13061557
Submission received: 5 May 2023 / Revised: 26 May 2023 / Accepted: 28 May 2023 / Published: 5 June 2023
(This article belongs to the Special Issue Integrated Nutrient Management for Farming Sustainability)

Abstract

:
Identifying sustainable crop production systems that improve yield from existing farmland while improving resource use efficiency is critical to meet the growing demands of the increasing human population and diminishing natural resources. Considering the increasing cost associated with inorganic fertilizer, integrated nutrient management using both organic and inorganic sources is important. Therefore, optimizing nutrient management practices that increase yield, improve soil quality, build up soil organic carbon storage, and maintain energy balance can help achieve sustainability in farming systems. In this regard, different nutrient management practices under the rice–rice (Oryza sativa L.) cropping system were evaluated using five different criterions, namely, (i) crop yield response, (ii) soil quality, (iii) soil carbon stock, (iv) energy efficiency, and (v) profitability under lowland situations in the Goa state situated in the western coast of India. We tested six nutrient management treatments, namely, inorganic fertilizers, organic (farmyard manure), rice straw, and their combinations over three years from 2016 to 2019. The results revealed that integrated nutrient management improved soil carbon stock, microbial biomass carbon, and soil fertility more than the other treatments. The integrated use of farmyard manure and chemical fertilizer showed significantly higher crop yield (9.86 v/s 9.41 Mg ha−1), microbial biomass carbon (354 v/s 233.7 mg kg−1 soil), soil carbon stock (36.65 v/s 25.5 Mg C ha−1), energy efficiency (23.8 v/s 22.3), and net return (1776 v/s 1508 USD) than those associated with chemical fertilizer alone. We conclude that the application of chemical fertilizers/organic sources alone may not be sustainable for the rice–rice cropping system in the Goa state of India; the focus should be on integrated nutrient management systems.

1. Introduction

Rice (Oryza sativa L.) is an important cereal crop cultivated in different ecosystems, uplands, lowlands, and deep-water conditions [1]. Rice is a staple food in the Asia-Pacific region, including India, and is the staple food for half of the world’s population [2]. The rice–rice cropping sequence is the predominant cropping system used under lowland conditions in the west coast region of India. The continuous use of the rice–rice cropping system depletes water and soil nutrients and significantly impacts soil structure [3]. Moreover, due to high nutrient requirements, the cost of fertilizer can lead to a decline in net returns per unit area [4]. Furthermore, imbalanced fertilization and continuous mono-cropping lead to a decline in soil organic carbon (SOC) storage in such systems [5,6]. This situation demands soil nutrient replenishment to maintain productivity under such a cropping system. Agricultural practices, such as balanced fertilization, cereal-legume sequence/rotations, and crop residue incorporation, result in higher productivity, better soil quality, and the build-up of SOC stock [5,7,8]. The light-textured acidic soils of west coast India containing higher iron (Fe) and aluminum oxides are intrinsically deficient in macro- and micro-nutrients [6,9]. The leaching of nutrients, especially cations, such as potassium (K), calcium (Ca), and magnesium (Mg), leads to nutrient deficiencies. The application of chemical fertilizers without using organic manure and micronutrients further escalates deficiencies of soil nutrients [10,11]. These imbalanced nutrients reduce soil and crop quality and directly affect farm families’ food and nutritional security.
Inadequate and improper use of fertilizer has been reported on the west coast of India [12], resulting in lower crop yields in the rice–rice cropping system without harnessing the full yield potential of the crop varieties [6]. A balanced integration of inorganic and organic nutrient sources can be an efficient strategy for minimizing the yield gap and enhancing soil quality [13,14]. However, the fertilizer application increases production costs and has an environmental burden on air pollution, greenhouse gas emissions, and associated warming, groundwater contamination, and eutrophication [15,16]. This necessitates fully or partially replacing chemical fertilizers with an organic source of nutrients or crop residue recycling to achieve economic and environmental sustenance [17,18,19,20,21,22]. The beneficial effect of the combined application of FYM and chemical fertilizer on nutrient uptake, yield, and yield parameters was reported by Satyanarayana et al. [23]. Further, Prasad et al. [24] reported the positive effect of chemical fertilizer and the application of green manure and FYM in improving the pod yield of groundnut under rice—a groundnut cropping system. Earlier workers highlight the advantages of INM in enhancing soil quality, crop yield [25], and net returns [26] more than what could be achieved by chemical fertilizer alone. A meta-analysis of INM practices under the rice–wheat cropping system of India revealed yield improvements in INM of 1.2% in rice and 4.5% in wheat greater than the chemical fertilizer treatment. Furthermore, INM reduces the need for inorganic fertilizers and protects soil quality/health from the negative impacts of synthetic fertilizers, demonstrating the advantages of using INM over chemical fertilizers [27]. The INM system enhances soil quality by controlling soil pH, increasing SOC, enhancing soil physical characteristics, and increasing nutrient solubility/mobility [28]. The extra SOC from combining organic and inorganic sources can help sustain agriculture for a greater length of time than inorganic sources alone, especially in the tropical environment of the Indian subcontinent where temperatures stay high and organic matter breakdown is quick [27].
The indicators, such as energy use efficiency, soil quality, soil carbon sequestration, and sustainable yield index, are critical indicators of sustainable land use. Further, this system helps identify soil quality indicators sensitive to different management systems [29]. Energy analyses of crop production systems are essential to understanding their energy consumption patterns in the form of labor, fertilizers, insecticides, fossil fuels (diesel and petrol), machinery usage, irrigation water, and electricity, as well as their environmental concerns, including the emission of greenhouse gases [30,31]. Nutrient management practices (NMP) that reduce CO2 emission [32] and promote C sequestration in vegetation, and eventually in soils [5,33], help achieve energy efficiency in agricultural land-use management. Improving SOC storage and sequestration depends on the amount of C input applied in residue recycling, root biomass, or organic manure application [34,35]. In any agroecosystem, inorganic fertilizer application has been the primary energy input [16,30,36], which significantly influences the production cost and environmental consequences [35,37]. Limited information is available in the literature on the impact of NMP on the C pool, nutrient uptake, energy analysis, and soil C sequestration in the lowland rice–rice cropping system. Therefore, the present study was conducted in a rice–rice cropping system under unique lowland situations in the west coast region of India. This research investigates the impact of different NMPs on yield, soil quality, and energy efficiency under the rice–rice cropping system. Our goal was to understand the impact of different NMP on SOC pools in a lowland instance of the rice –rice cropping system. Results from this research will help identify the balanced NMP, frame a policy for best nutrient management practices that enhances yield, and improve soil quality. It was hypothesized that a combination of organic and inorganic sources of nutrients would positively and significantly influence SOC pool, energy efficiency, soil quality, and grain yields.

2. Materials and Methods
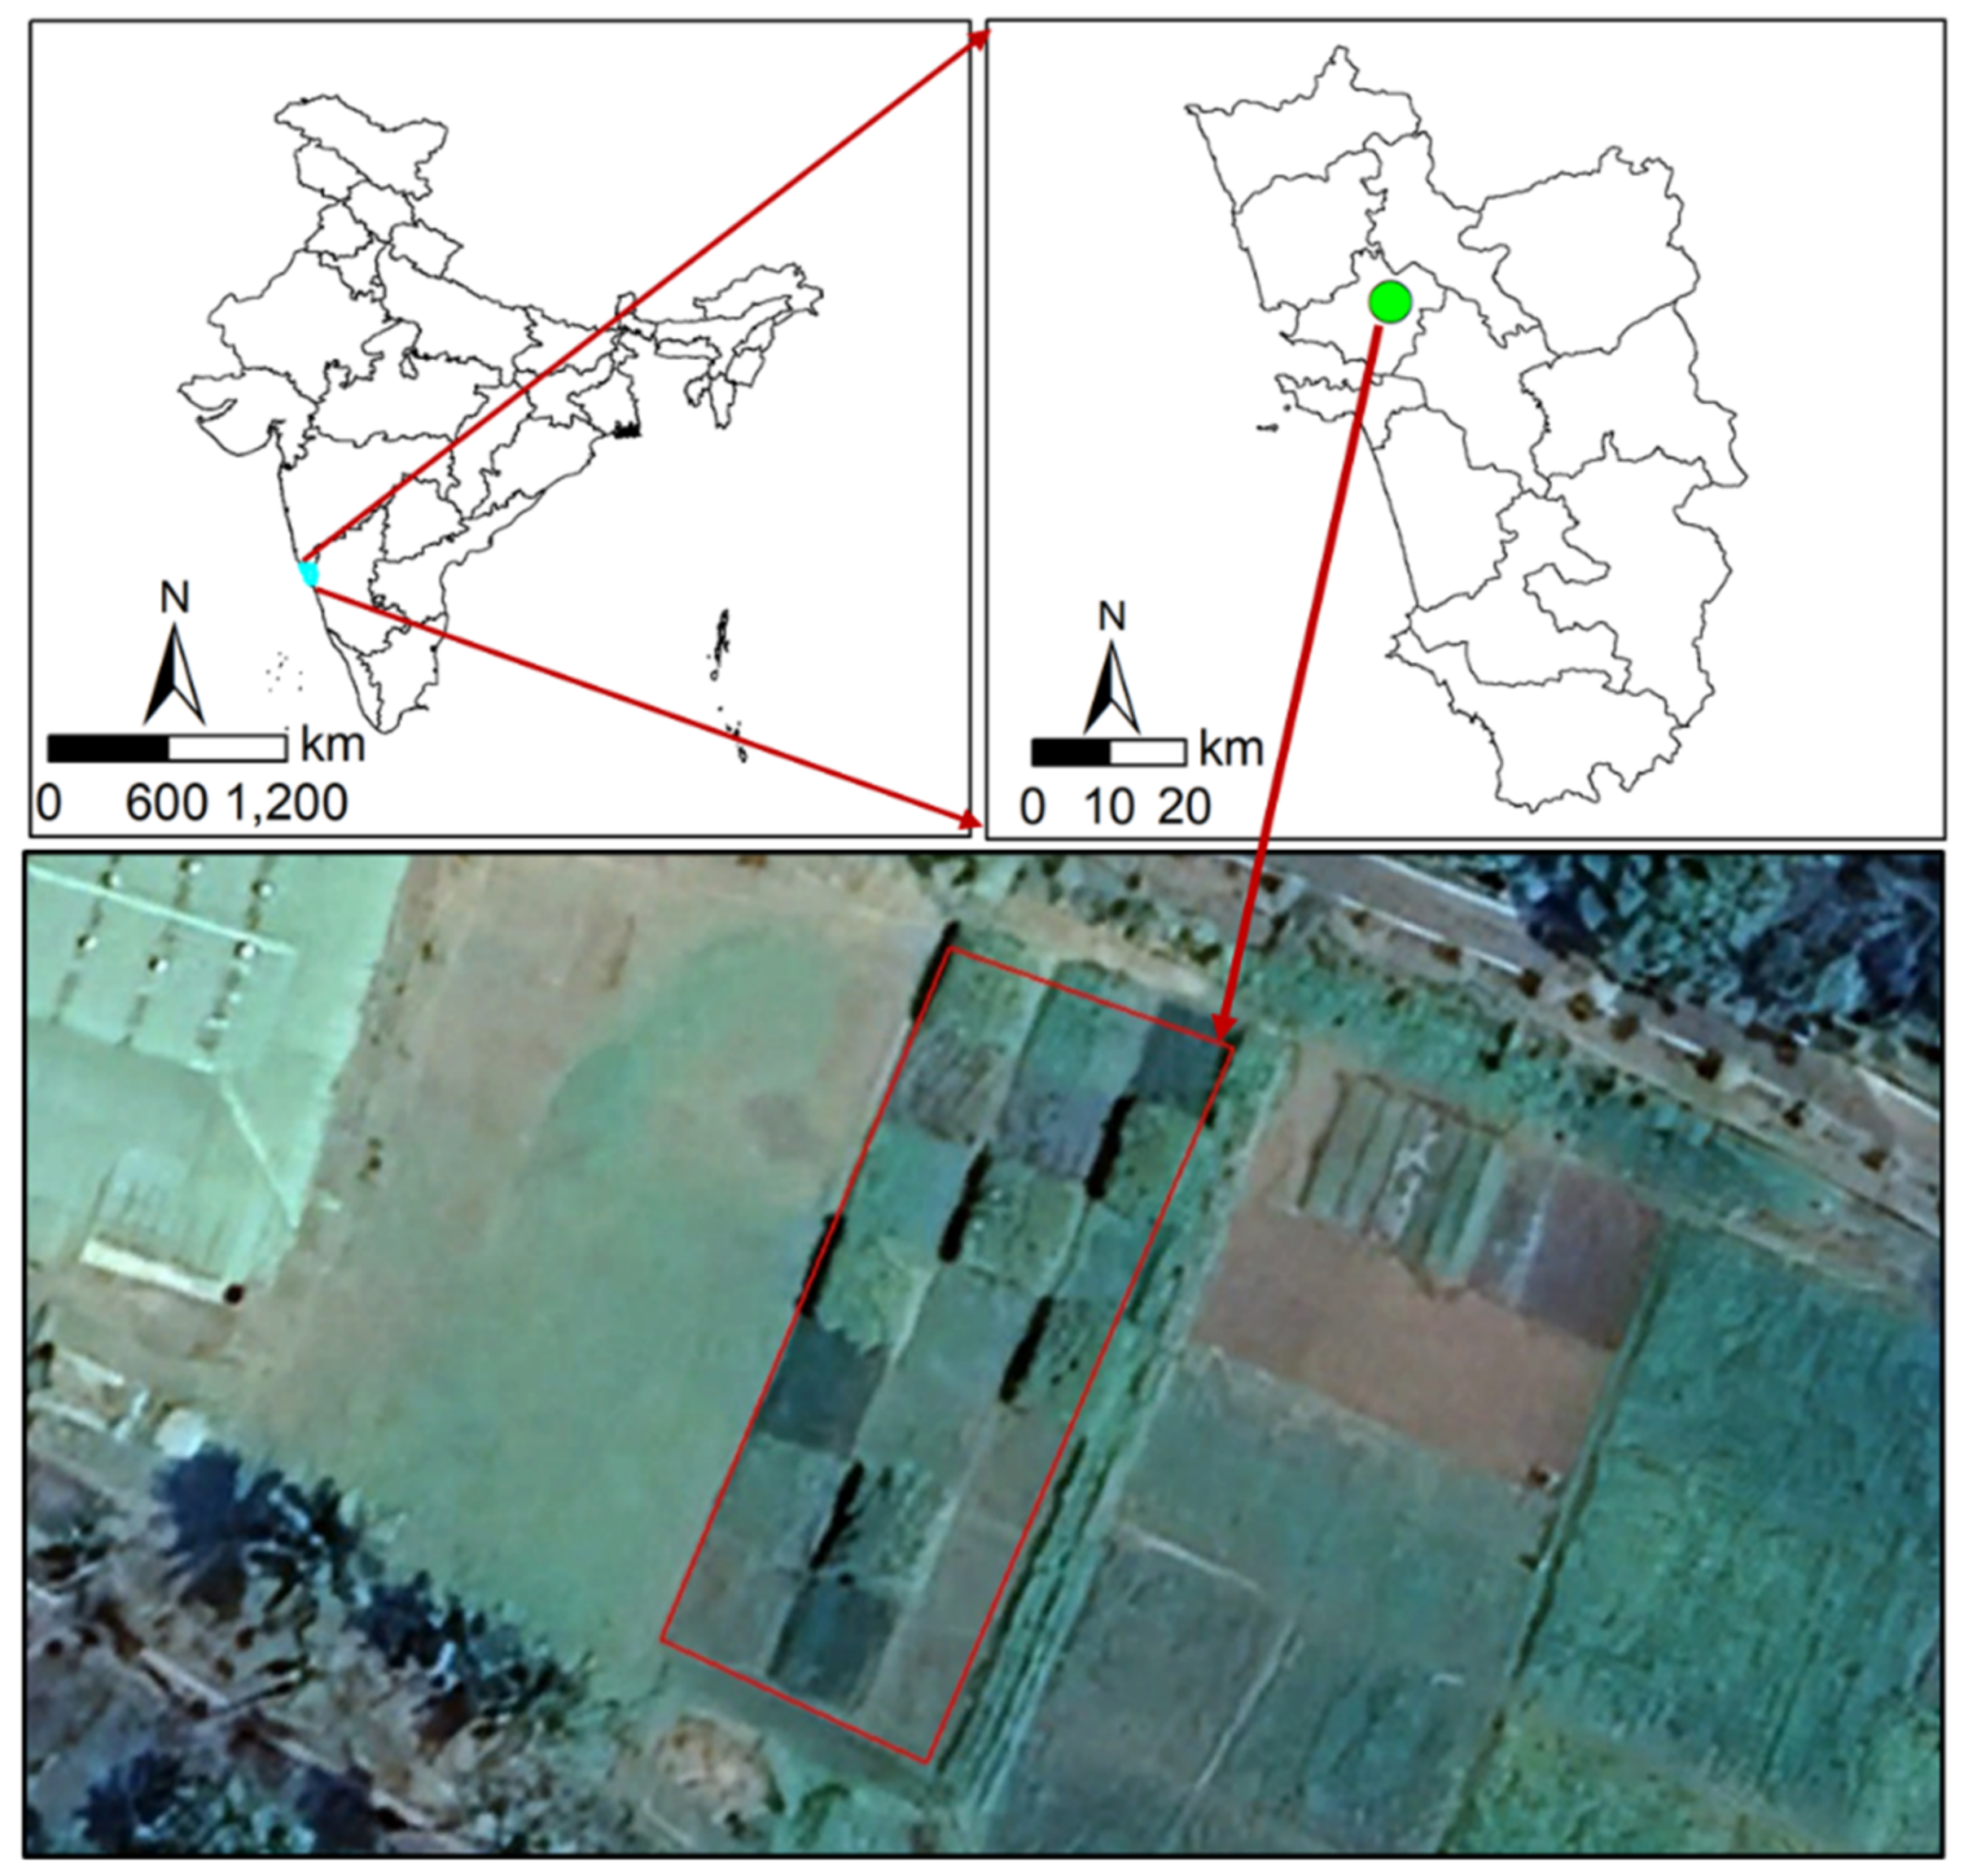
2.1. Study Area

The experimental site was at the Indian Council of Agricultural Research (ICAR) at the Central Coastal Agricultural Research Institute (CCARI) research farm (Latitude: 15°30′52′′ N; Longitude: 73°55′01′′ E) in Goa, India. This study was conducted during the 2016–2019 period; the study area map is shown in Figure 1. The climate of Goa is warm and humid during most of the year. The annual long-term (30 years) mean precipitation was 2910 mm. The mean annual temperature was 27.8 °C, with a mean maximum and minimum of 30.2 °C and 26.4 °C, respectively [38]. Cool and pleasant weather prevailed from December to February. The soil temperature regime has been classified as iso-hyperthermic [39]. The initial soil sample analysis indicated that the soil was higher in soil organic carbon (0.85%), lower in available nitrogen (N)—122 kg/ha and potassium (K)—135 kg/ha, and medium in available phosphorus (P)—12 kg/ha.

2.2. Experimental Details

The six treatments of this study were control (without any fertilizer and manure); 100% nitrogen (N) through neem-coated urea (NCU); 100% N through farmyard manure (FYM); 75% N through NCU and 25% N through FYM; 75% N through NCU and 25% N through rice straw incorporation (RSI); and 50% N through NCU, 25% N through FYM, and 25% N through RSI. We followed the same treatment in both seasons during the 2016–2019 period. The N, phosphorus (P), and potassium (K) were applied through urea, rock phosphate, and muriate of potash, respectively. Half of the total N, the entire amount of the P, and three-fourths of the K were applied as a basal dose after draining out the standing water before the final puddling. The remaining N were top-dressed in two equal splits each at tillering (3 weeks after transplanting) and at the panicle initiation stage. The remaining one-fourth was applied at the panicle initiation stage. FYM was applied twice a year (both in Kharif and Rabi), while rice straw was incorporated once a year during the Kharif (rainy) season. On average, FYM and paddy straw contained 1.2 and 0.65% N, 0.65 and 0.1% P2O5, and 1.3 and 1.35% K2O, respectively. The experiment was conducted with four replications and the size of the individual plot was 8 m × 6 m. The treatments were allocated in a randomized block design.

2.3. Biometric Observation, Plant Sample Analysis, and Nutrient Uptake

We recorded important yield-related characters, namely, the number of productive tillers, panicle length, panicle weight, and the number of mature grains/panicles at harvest. Additionally, dry matter produced through straw and grain was computed. Each crop’s representative plant samples (stalk and kernel/grain) were collected for nutrient analysis. The plant samples were dried in an oven at 65 °C to the constant weight obtained. Air-dried grain samples and oven-dried plant samples were processed in a Macro-Wiley Mill to pass through a 40-mesh screen in three replications. Each treatment took 0.5 g of grain and straw samples for nutritional analysis. The N, P, and K concentrations in straw and grain were determined by micro-Kjeldahl digestion and distillation [40], the vanadate-molybdate yellow color method [41], and atomic absorption spectrometry, respectively. Nutrient uptake (N, P, and K) was calculated as the product of the nutrient concentration in the grain/straw and the dry weight of the plant biomass (grain and straw).

2.4. Soil Sampling and Laboratory Analysis

Initial and final soil samples were collected from each experimental plot’s topsoil layer (0–30 cm). In the sampling scheme, provision was made to collect five samples. Collected samples were thoroughly mixed and a composite sample of 500 g was bagged for laboratory analysis. Sub-samples were stored at a low temperature (4 °C) for analyzing microbial activity. Core samples in duplicates were also collected for determining bulk density. In the laboratory, soil samples were initially air-dried and ground using a wooden mortar and pestle, followed by a 2 mm sieve screening. Soil bulk density was determined [42] following the protocols for core samples. SOC concentration was determined using the wet oxidation method [43]. SOC pools, namely, very labile carbon (VLC), labile carbon (LC), less-labile carbon (LLC), and non-labile carbon (NLC) fractions, were determined following the protocols of Chan et al. [44]. Total organic carbon (TOC) was determined by the dry combustion method, using a Vario EL cube analyzer in the CHNS mode (Elementar, Langenselbold, Germany). Very labile and labile carbon constitute the active pool (AP) of carbon, whereas less-labile and non-labile carbon were summed together to obtain a passive carbon pool (PP) [45].
The soil chemical properties, such as pH [41], available nitrogen (N) using Kjeldahl Nitrogen Analyzer (Pelican Kelplus) [46], available phosphorus (P) using a spectrophotometer (ThermoFisher Scientific) [47], and available potassium (K) using flame photometer (ANALAB, FlameCal100) [48] and available sulfur (S) [49], were then determined. The micronutrient concentration (zinc, copper, iron, and manganese) was estimated using AAS (analytikjena) [50]. Boron (B) concentration was analyzed via the hot water extractant method [51]. The microbial biomass carbon (MBC) was determined using the fumigation and extraction method [52] and basal soil respiration (BSR) was estimated using the incubation and titration method [53]. In addition, the 2-3-5-triphenyltetrazolium-chloride-reduction technique [54] was employed for assessing dehydrogenase activity, whereas urease activity was estimated by measuring the hydrolysis of urea [55].

2.5. Lability Index (LI)

The following equation calculated the lability index of SOC:
L a b i l i t y   i n d e x = V L C T O C × 3 + L C T O C × 2 + L L C T O C × 1
In the equation, the weightages of 3, 2, and 1 were given to VLC, LC, and LLC based on their oxidation [56].

2.6. Energy Budgeting

Energy input under the rice–rice cropping system was estimated from the quantity of fertilizer NPK, FYM, and rice straw used with their respective energy equivalents (Table 1). First, the energy input through fertilizer NPK, FYM, and rice straw was summed (Table 2) to estimate the total energy input (EI). Next, the energy output was estimated from the quantity of above-ground biomass (grain and straw yield) produced by multiplying them with their respective energy equivalents. Finally, the amount of energy produced from the above-ground biomass (grain plus straw in unhusked rice) was summed to estimate total energy output (EO).
Different energy indices, namely, energy productivity (EP), specific energy (ES), energy use efficiency (EUE), and net energy gain (NEG) for an individual crop, were calculated using the following equations (Equations (2)–(5)):
E n e r g y   u s e   e f f i c i e n c y =   E n e r g y   O u t p u t   M J / h a   E n e r g y   I n p u t   M J / h a  
N e t   E n e r g y = T o t a l   E n e r g y   o u t p u t   M J / h a T o t a l   E n e r g y   i n p u t   M J / h a
S p e c i f i c   e n e r g y   M J / k g = E n e r g y   i n p u t   M J / h a T o t a l   y i e l d   k g / h a
E n e r g y   p r o d u c t i v i t y   k g / M J = T o t a l   y i e l d   k g / h a   E n e r g y   i n p u t   M J / h a

2.7. Statistical Analysis

The treatments were ranked from 1 to 6 using indicators, such as system productivity, net returns, EUE, NEG, TOC stock, and SMBC, for the most suitable choice to determine which would be ranked 1. The impact of different NMPs on grain yield, soil properties, biomass, and soil carbon stocks was tested using analysis of variance in SAS version 9.4 (North Carolina, USA). We compared the mean values at a 5% probability level of significance.

3. Results

3.1. Yield Parameters

The results indicated that the rice–rice cropping system’s yield-related parameters were consistent across different treatments during the three-year study period. Applications of different sources of nutrients increased tillers (m−2), panicles (m−2), panicle length (cm), panicle weight (g), and grains panicle−1 more than the control. The significantly higher yield parameters were observed in 75% N-NCU + 25% N-FYM. However, 100% N-NCU recorded equivalent yield parameters. The partial replacement of N through FYM positively influenced the yield parameters over using chemical fertilizer and organic alone. The yield attributes in both seasons were significantly (p < 0.05) influenced by the year, while year × treatment effects were non-significant (Table 3).

3.2. Crop Productivity

The application of different sources of nutrients through inorganic fertilizers, FYM, and rice straw significantly influenced rice yield in both seasons. In both seasons, rice yield was higher in 75% N-NCU + 25% N-FYM, which was on par with the 100% N-NCU treatment. The 75% N-NCU + 25% N-FYM resulted in 135% and 12.6% higher yields in the Kharif season and 135% and 11.9% higher yields in the Rabi season than the control and the 100% N-FYM treatment, respectively (Table 3). The combined NCU, FYM, and rice straw incorporation produced a significantly higher (75% N-NCU + 25% N-RSI and 50% N-NCU + 25% N-FYM + 25% N-RSI) grain and straw yield. The yield varied significantly (p < 0.05) over the years, but not by year × treatment interactions (Table 3).

3.3. Nutrient Uptake

Nutrient uptake varied significantly (p < 0.05) over the years, but not by year × treatment interactions (Table 4). Nutrient management treatments significantly increased the uptake of nutrient elements (N, P, and K) in comparison to the control. The significantly higher N and K uptake values were associated with 75% N-NCU + 25% N-FYM followed by 100% N-FYM, while the P uptake was found to be higher in 100% N-FYM for both seasons. The application of 75% N-NCU + 25% N-FYM ensued in 231%, 308%, and 134% higher N, P, and K uptake, respectively, in the rice–rice system in comparison to the control (Table 4).

3.4. Soil Quality

The experimental soil was acidic and soil pH did not vary significantly (p < 0.05) among the NMPs (Table 5). The bulk density (BD) varied significantly (p < 0.05), and its lower values were associated with 100% N-FYM, followed by a balanced supply of 75% N-NCU + 25% N-FYM. Soil BD was significantly higher with the control, followed by the 100% N-NCU treatment. The application of 100% N-FYM recorded a significantly higher concentration of available nutrients (NPK) in the soil that those of the control and 100% N-NCU. The zinc (Zn) and iron (Fe) availability did not vary significantly (p < 0.05). The soil microbial properties, such as dehydrogenase activity, phosphatase activity, SMBC, BSR, and urease activity, were significantly higher with the organic treatment (100% N-FYM), followed by the integrated NMP (75% N-NCU + 25% N-FYM and 75% N-NCU + 25% N-RSI). The percent improvement in 100% N-FYM for DHA, PHA, SMBC, BSR, and urease activity were 35%, 119%, 69%, 119%, and 123%, respectively, over those of 100% N-NCU. After three years of rice–rice cropping, all of the INM practices improved the soil fertility, available nutrients, and soil microbial activity (Table 5).

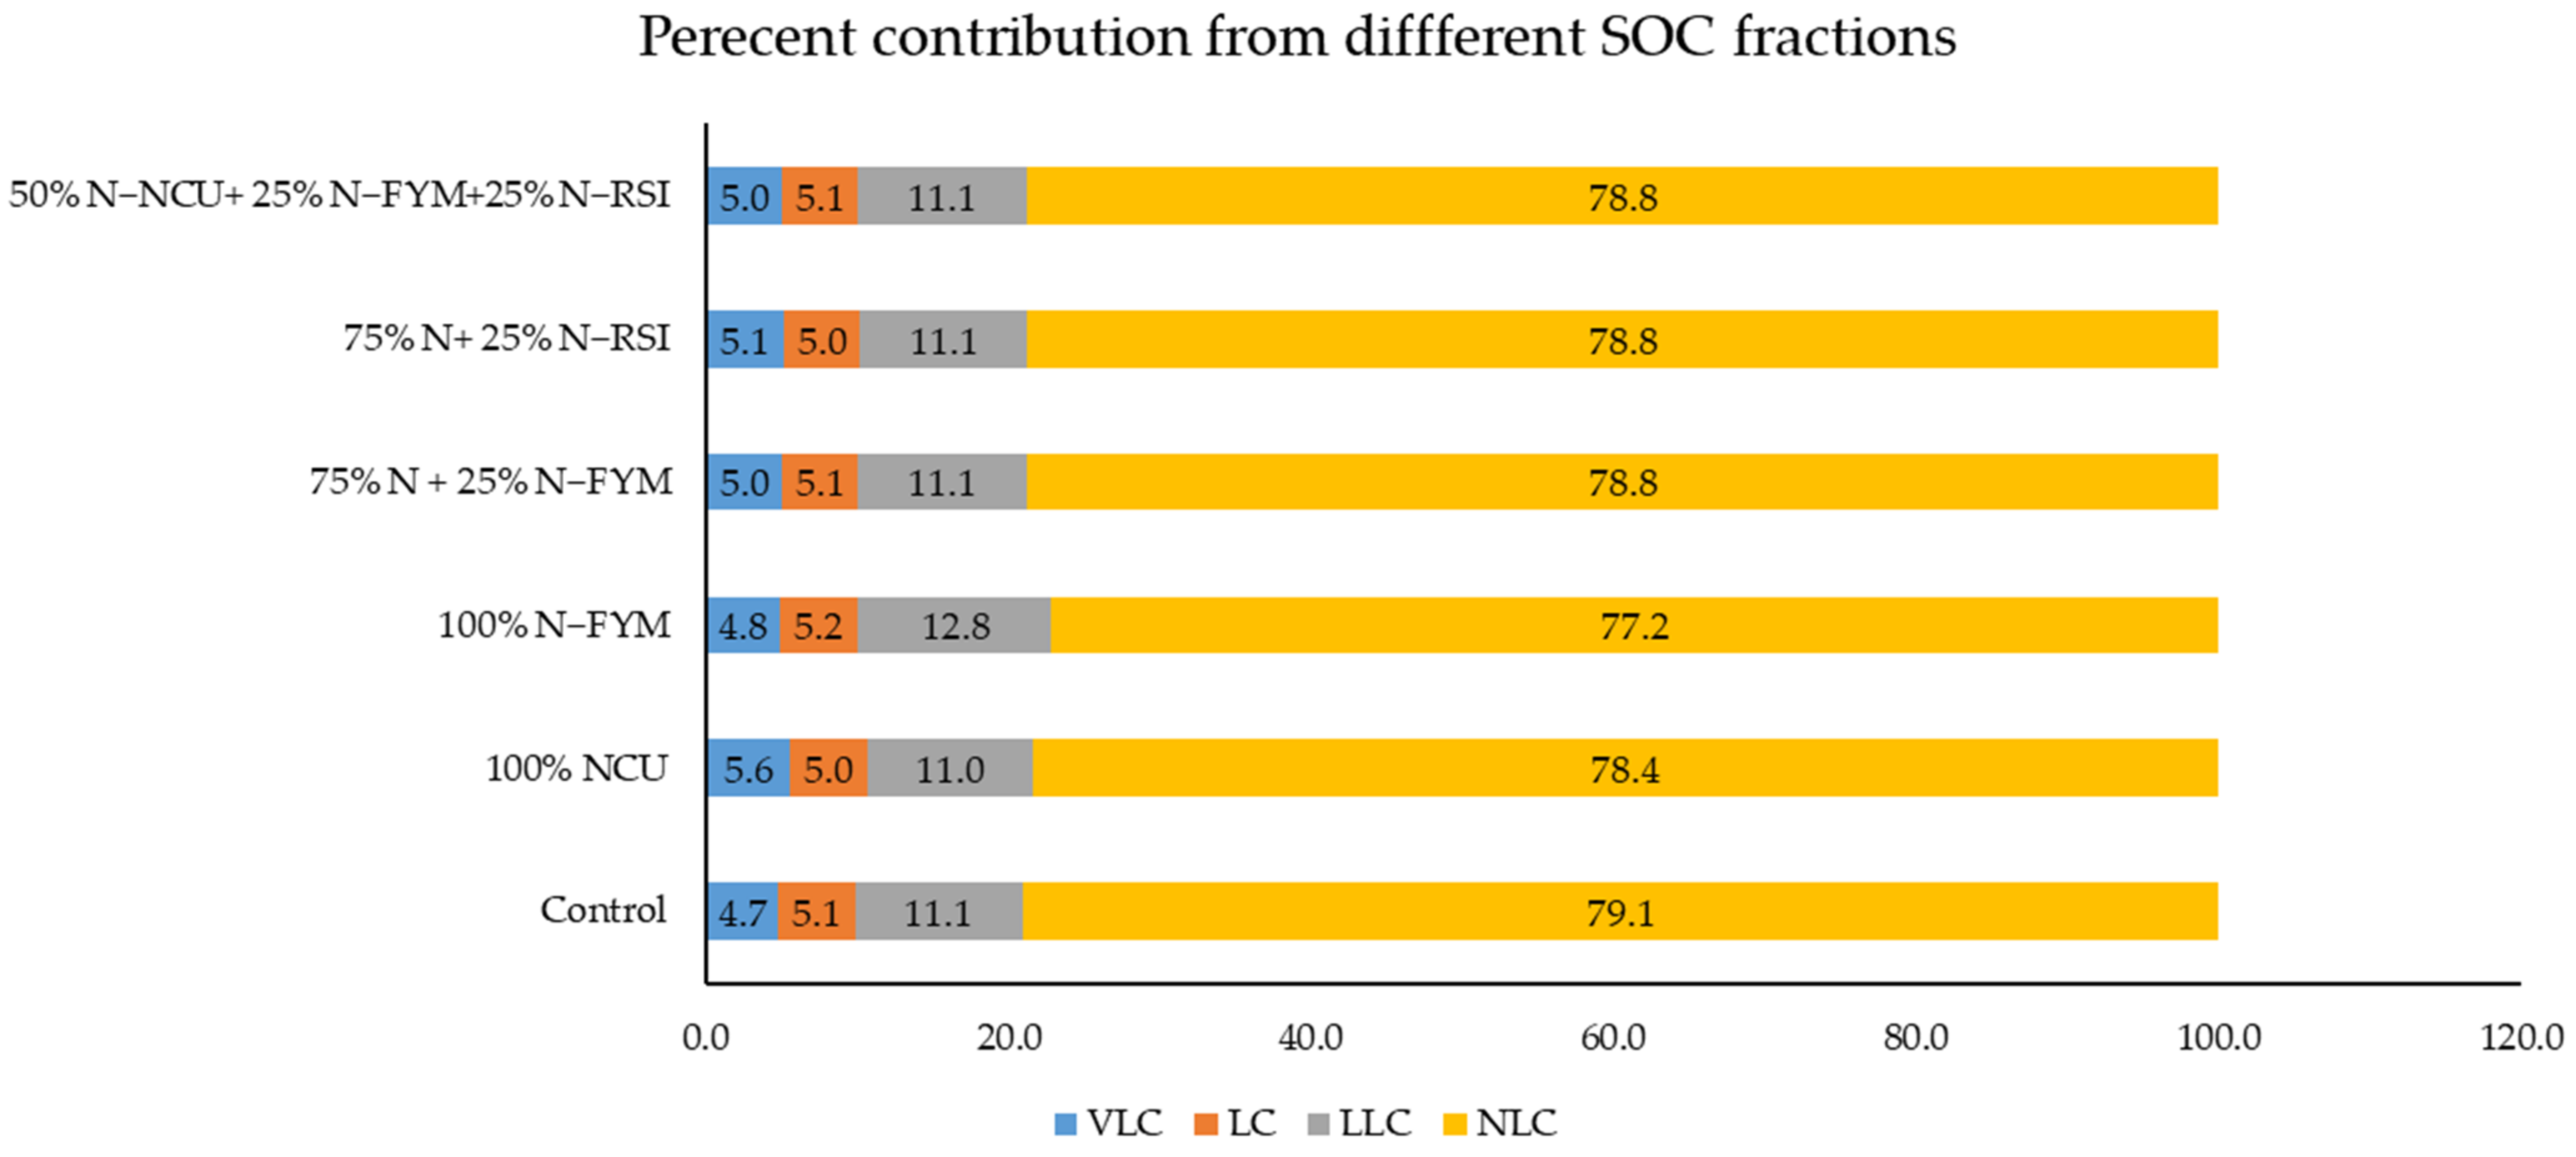
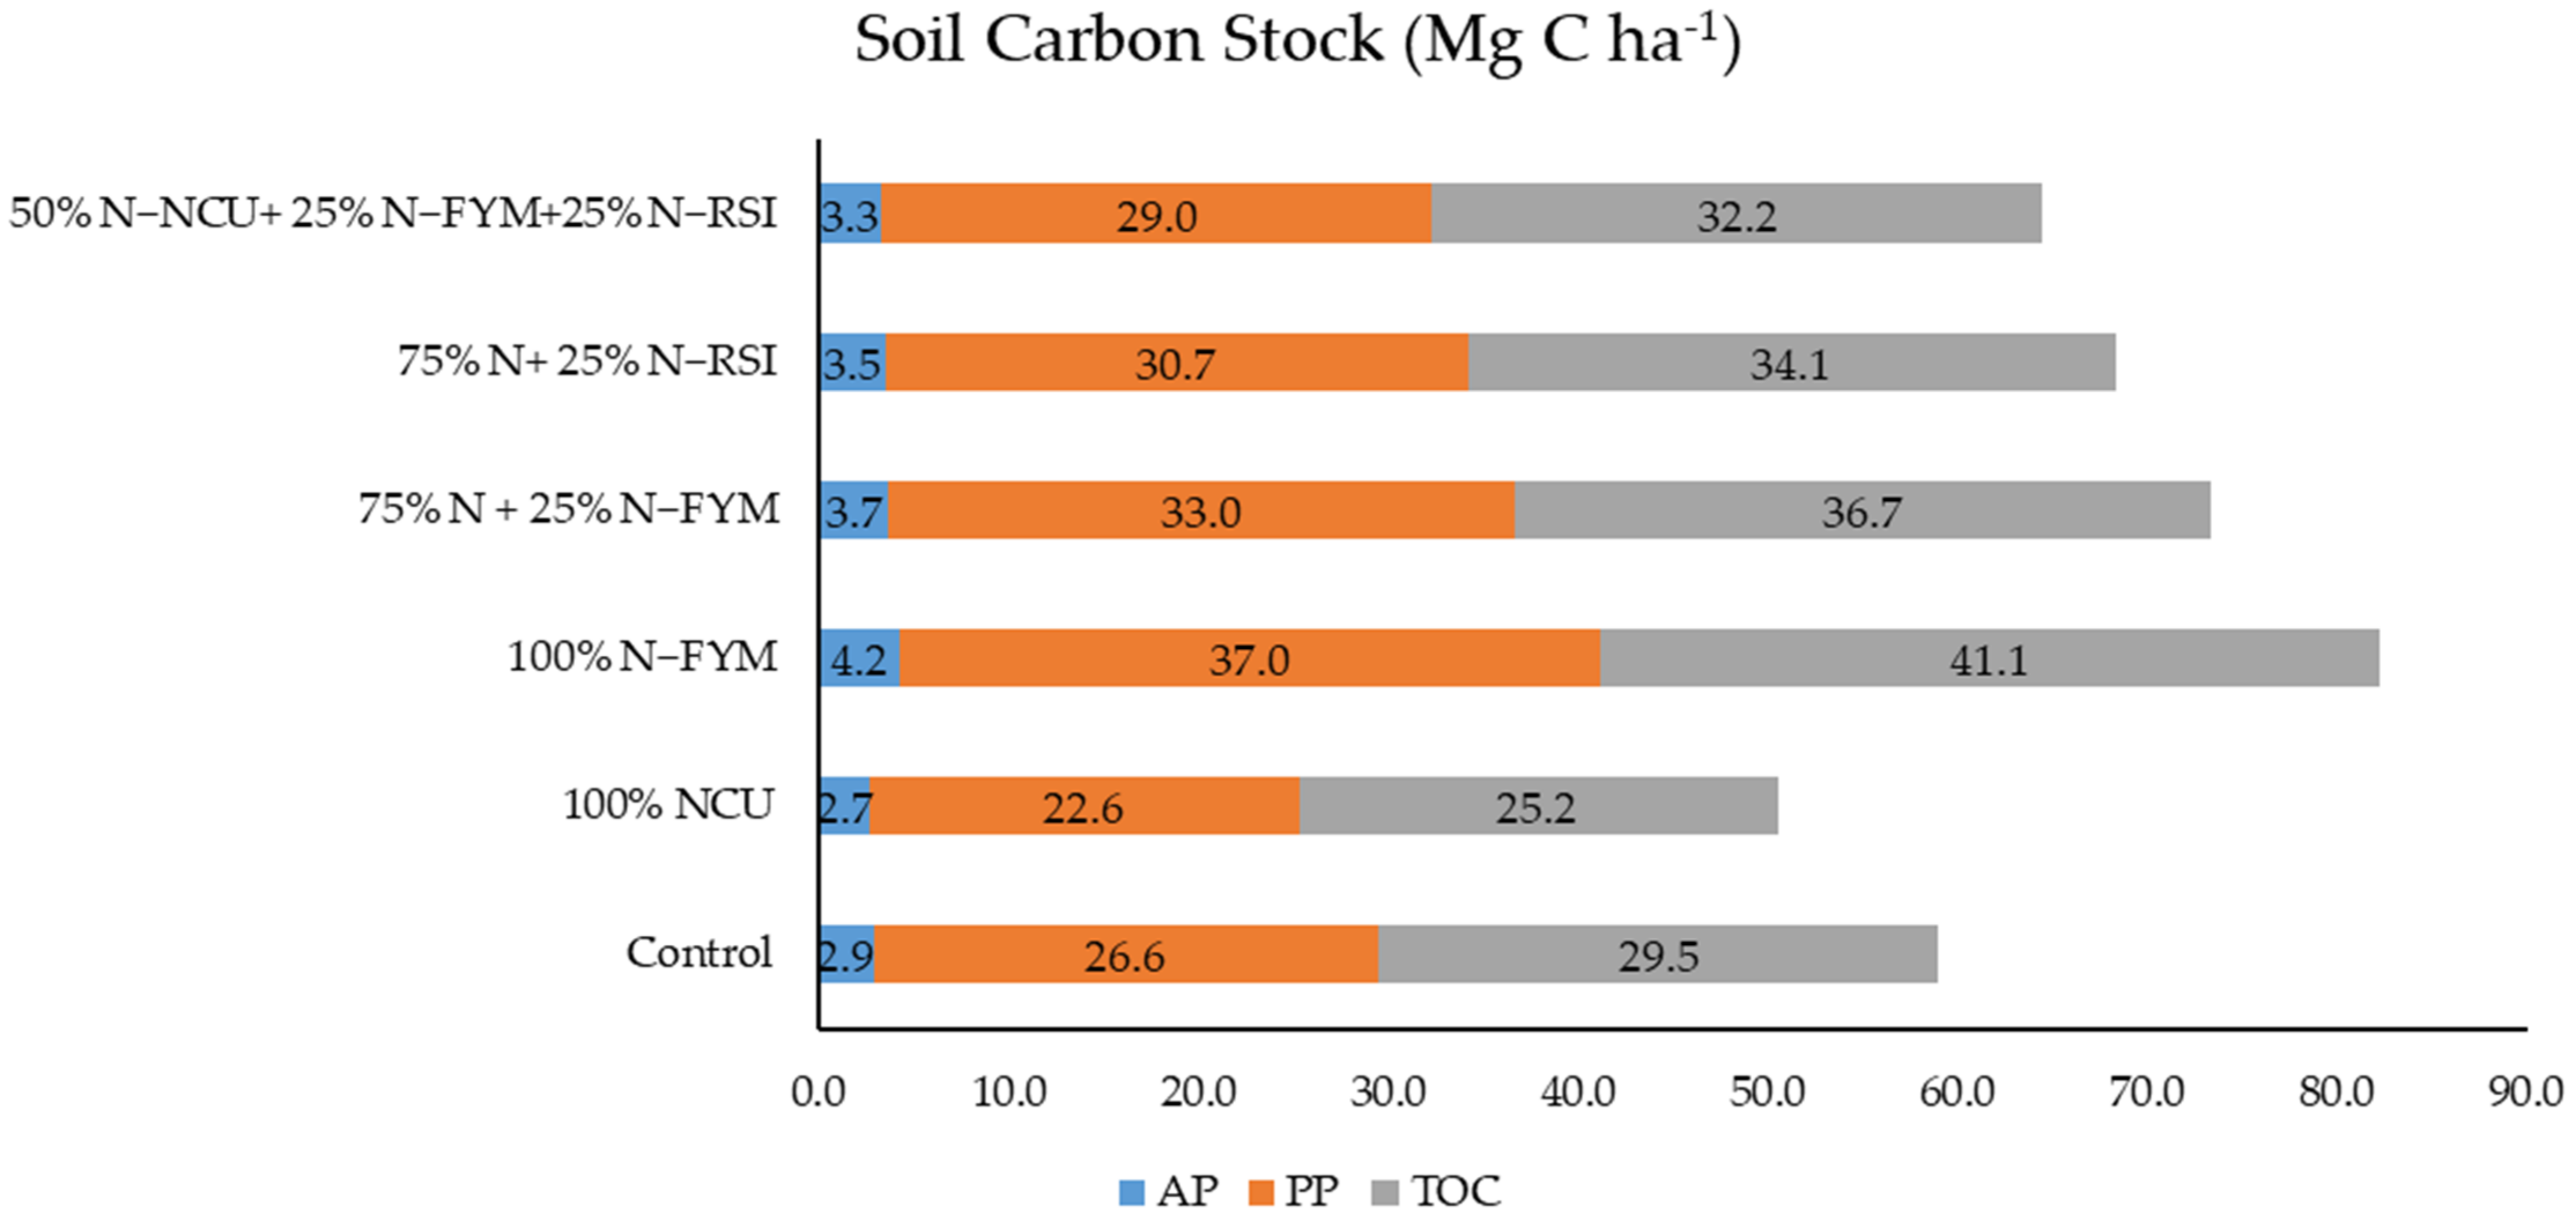
3.5. Soil Organic Carbon Stock

The different SOC fractions varied significantly (p < 0.05) due to NMP (Table 6). The implementation of a continuous rice–rice cropping system without applying nutrients (control) and 100% N-NCU for three years recorded lower VLC, LC, LLC, and NLC than other NMPs. The higher SOC fractions and TOC were found with 100% N-FYM, which was consistent with 75% N-NCU + 25% N-FYM. The significantly higher SOC stock values of VLC (1.99 Mg C ha−1) and LC (2.14 Mg C ha−1) were recorded in the 100% N-FYM treatment (Figure 2). Likewise, the highest values of LLC (5.24 Mg ha−1) and NLC (31.7 Mg ha−1) were also recorded with the 100% N-FYM treatment. Under different nutrient management, the total SOC stocks varied from 25.19 Mg C ha-1 in 100% N-NCU to 41.06 Mg C ha-1 in 100% N-FYM. The integrated nutrient management treatment of 75% N-NCU + 25% N-FYM recorded the SOC storage of 36.7 Mg ha−1. In all of the NMPs, the proportion of NLC and LLC was found to be higher. The proportion of NLC to the SOC stocks varied between 77.2% and 79% (Figure 3). In contrast, the proportion of LLC to SOC stocks ranged between 11% and 12.8%. The percentage contributions of VLC (4.7 to 5.6%) and LC (5 to 5.2%) to the total SOC stock were low. The higher AP (4.13 Mg C ha−1) and PP (36.9 Mg C ha−1) carbon were observed under 100% N-FYM, followed by 75% N-NCU + 25% N-FYM. The lowest values were obtained with the control treatment (Figure 4).

3.6. Energy Analysis

A significantly lower energy input was observed in 100% N-FYM, followed by 75% N-NCU + 25% N-FYM; the highest energy input in terms of applied nutrients was observed in 50% N-NCU + 25% N-FYM + 25% N-RSI (Table 7). A significantly higher energy output was observed under 100% N-NCU, followed by 75% N-NCU + 25% N-FYM. The EUE and EP were found to be higher in the 100% N-FYM treatment, followed by 75% N-NCU + 25% N-FYM; meanwhile, the NEG was found to be significantly higher in 100% N-NCU. A 69% improvement in EUE in 100% N-FYM was observed over that in 100% N-NCU. The specific energy was significantly lower in 100% N-FYM and the integrated treatment (75% N-NCU + 25% N-FYM). However, a higher value of specific energy was observed with the 75% N-NCU + 25% N-RSI treatment.

3.7. Economic Analysis

The highest cost of cultivation for the rice –rice cropping system was associated with 100% N-FYM, followed by 100% N-NCU (Table 8). The lowest cost of cultivation was noticed in the control, followed by 50% N-NCU+ 25% N-FYM + 25% N-RSI. The monetary advantage in terms of gross return was found to be higher in 100% N-FYM. The balanced application of chemical fertilizer and FYM (75% N-NCU + 25% N-FYM) recorded a higher net return and B: C ratio than that of 100% N-NCU (Table 8).

4. Discussion

4.1. Crop Productivity

The productivity of the rice–rice cropping system was higher in 100% N-NCU and 75% N-NCU + 25% N-FYM. This was mainly due to the increased and slow availability of N from NCU and FYM, which enabled better uptake of nutrients by the crops (Table 4). The increased nutrient uptake might have led to improved growth, yield parameters, and yield in both seasons (Table 3). The application of FYM with NCU increased the yield by 433 kg ha−1 over that of 100% N-NCU. These results were consistent with the earlier studies in the maize (Zea mays L.)–wheat (Triticum aestivum L.) cropping system [14] and French bean (Phaseolus vulgaris L.) [58]. Furthermore, the slow release of nutrients from FYM synchronizes crop nutrient demand at critical crop growth stages [21,59]. As the region’s soils are deficient in N and K, the regular supply of these nutrients through organic means greatly influenced crop growth and yield. It is well known that FYM improves soil microbial activity, thereby increasing soil nutrient availability and crop nutrient uptake [13,36].

4.2. Nutrient Uptake by Rice-Rice System

The rice–rice system’s higher crop nutrient (N, P, and K; Table 4) uptake under 75% N-NCU + 25% N-FYM and 100% N-FYM was mainly due to the supply and availability of nutrients from organic sources. In addition, it might have improved crop root growth, helping to increase nutrient uptake and further leading to an increased concentration in grain and straw [60]. The higher P uptake in 100% N-FYM could be due to the increased bioavailability of P in the soil [61]. Plant growth and nutrient uptake were greatly influenced by applying the optimal and adequate amount of inorganic fertilizer and organic manure. This is an essential factor for enhancing crop growth and nutrient uptake and a vital component in supporting the crop life cycle and yield potential [62,63].

4.3. Soil Quality

Significantly higher soil quality indicators in the organic and integrated nutrient management treatments were mainly due to increased soil microbial activity (DHA, SMBC, PHA, and urease). They engaged in nutrient conversions, nutrient solubility, and a release from the root zone soil to the plant roots. The organic manure/INM practice also improves root growth and root aeration and raises nutrient-use efficiency. The higher soil microbial activity under organic and INM treatments, as opposed to those under the control and chemical fertilizer, may be due to a favorable nutritional environment stimulating soil biological activity [64]. Dutta et al. [65] also reported the importance of balanced fertilization in maintaining soil quality under a long-term maize–wheat cropping system. Similarly, Ghosh et al. [66] observed an increase in dehydrogenase activity and soil nutrient availability due to the addition of FYM in the rice–wheat cropping system. The soil quality indicators affecting system productivity were intricately linked to management practices, such as the type of cropping system, source of nutrients, and soil nutrient balance [67]. Adopting intensive cultural practices without applying organic manures has several environmental impacts, including land degradation [68]. Therefore, attention should be given to the source, amount, and type of nutrients required to improve soil fertility and productivity.

4.4. Soil Carbon

The application of 100% N-FYM and substitution of 25% N through FYM improved the SOC content and SOC stock significantly over those of 100% N-NCU. A similar accrual of SOC was reported with the application of fertilizer combined with manure [14,69], vermicompost [70], paddy straw [71], and green manure [72]. Hemalatha and Chellamuthu [73] found that the use of inorganic fertilizers alone reduced the SOC level due to a reduction in the use of organic manures and crop residue incorporation in a long-term field experiment. the enrichment of SOC stock depends majorly on the external application of organic manures, level of soil microbial activity, and land use [74]. An increase in the passive carbon pool in all of the treatments might be due to the slow rate of C oxidation under high rainfall coupled with acidic soil conditions [5,34,75]. Therefore, under organic or integrated NMP, the incomplete decomposition and reduced humification of organic matter under submerged conditions might have resulted in the net accumulation of organic carbon under a passive pool of carbon [76]. Complete and partial N supplement through FYM increased the total SOC stock by 63% and 45%, respectively, over that of chemical fertilizer alone. Inorganic fertilizers reduced SOC compared to control but, when integrated with FYM, improved the storage significantly. The application of FYM with chemical fertilizers adds organic C. It also increases plant C inputs to the soil through stubble root residue and rhizodeposition [77] because of the higher crop yield (Table 3).

4.5. Energy Analysis

The higher EUE and EP in 100% N-FYM were mainly due to reduced energy input, especially in chemical fertilizers with a higher energy equivalence. The energy requirement for rice–rice cropping in 100% N-FYM was about two times less than that of 100% N-NCU. Similar results were reported in earlier studies on organic nutrient management in lowland rice [78,79], rice–wheat cropping systems [80], areca nut (Areca catechu L.) [16,81], and maize–wheat cropping systems [82,83]. The higher NEG under 100% N-NCU and 75% N-NCU + 25% N-FYM over that of FYM was mainly due to a higher biomass production leading to greater energy output. The treatments, including rice residue incorporation, recorded a higher energy input due to the higher energy equivalence of rice straw. The specific energy indicates that the amount of energy required per unit of output was significantly lower in 100% N-FYM and the integrated treatment (75% N-NCU + 25% N-FYM). The net energy gain is necessary to improve the input use efficiency and land use efficiency in order to meet the burgeoning food demand [84]. Considering all the energy indices, the application of 75% N-NCU + 25% N-FYM was the most efficient nutrient management option for the rice–rice cropping system on the west coast of India.

4.6. System Economics

The higher gross return under 100% N-FYM was attributed to a premium price for organic produce compared to other NMPs. However, the net return was higher in the balanced application of chemical fertilizer and FYM (75% N-NCU + 25% N-FYM), indicating that only organic/chemical sources of nutrients are less profitable. Although inorganic and integrated treatments were expensive, they are still profitable because of the higher crop yields and better prices. Earlier workers reported similar economic benefits of combined chemical fertilizer application and FYM [13,59,85]. A balanced application of plant nutrients through fertilizer and FYM will be profitable for the farmers. Additionally, it reduces cultivation costs through residue recycling and increases net returns [86].

4.7. Ranking of Nutrient Management Practices

The different nutrient management treatments’ rankings revealed the highest rank was associated with 75% N-NCU + 25% N-FYM, followed by 100% N-FYM (Table 9). Therefore, this study indicates that the application of 75% N-NCU + 25% N-FYM and 100% N-FYM are the best management practices under rice–rice cropping to ensure sustainable crop production while enhancing environmental health management and increasing profitability.

5. Conclusions

Substituting 25% nitrogen through FYM in the crop fertilization calendar increases the grain yield under the rice–rice cropping system in the acidic soils of the west coast of India. The integrated use of inorganic fertilizer and organic manure has a positive influence on crop productivity, soil quality, energy use efficiency, nutrient uptake, and profitability. An adequate supply of nutrients, achieved by integrating organic and inorganic sources or using organic sources alone, improved soil quality by improving soil nutrient availability and enhancing soil organic C content, microbial biomass C, and soil enzymatic activity. Therefore, the application of 75% nitrogen through chemical fertilizers and 25% nitrogen through FYM is the best combination for producing higher crop yields and maintaining environmental health by increasing soil carbon sequestration. However, the supply of nutrients through chemical fertilizers alone may not be sustainable for rice–rice cropping systems. Further evaluation of these INM practices under different ecology and genotypes in coastal situations is essential to extend the benefit of balanced nutrition in enhancing both crop production and soil health.

Author Contributions

Conceptualization, V.P., P.K., K.K.M., and B.D.; methodology and validation, V.P. and T.B.; formal analysis, investigation, V.P. and B.F.D.; writing—original draft preparation, review, and editing, V.P., A.J.N., P.K., K.K.M., B.D., P.K.J., and P.V.V.P. All authors have read and agreed to the published version of the manuscript.

Funding

This research received no external funding.

Data Availability Statement

Data will be made available on request from the corresponding author.

Acknowledgments

Indian Council of Agricultural Research, New Delhi, India, and ICAR-Central Coastal Agricultural Research Institute, Goa, India, are acknowledged for their support.

Conflicts of Interest

The authors declare no conflict of interest.

References

  1. Surendran, U.; Raja, P.; Jayakumar, M.; Subramoniam, S.R. Use of efficient water saving techniques for production of rice in india under climate change scenario: A Critical Review. J. Clean. Prod. 2021, 309, 127272. [Google Scholar] [CrossRef]
  2. Fuhrmann, I.; Maarastawi, S.; Neumann, J.; Amelung, W.; Frindte, K.; Knief, C.; Lehndorff, E.; Wassmann, R.; Siemens, J. Preferential flow pathways in paddy rice soils as hot spots for nutrient cycling. Geoderma 2019, 337, 594–606. [Google Scholar] [CrossRef]
  3. Maiti, S.; Saha, M.; Banerjee, B.; Pal, S. Integrated nutrient management under hybrid rice-(Oryza Sativa) hybrid rice cropping sequence. Indian J. Agron. 2006, 51, 157–159. [Google Scholar]
  4. Meena, B.L.; Raja, R.; Dotaniya, M.L.; Nanda, G.; Meena, R.S. Integrated nutrient management for sustainable rice-based cropping systems and soil quality. In Sustainable Agriculture; Meena, R.S., Ed.; Scientific Publishers (India): Jodhpur, India, 2019; p. 1. ISBN 9789388043625. [Google Scholar]
  5. Nayak, A.K.; Gangwar, B.; Shukla, A.K.; Mazumdar, S.P.; Kumar, A.; Raja, R.; Kumar, A.; Kumar, V.; Rai, P.K.; Mohan, U. Long-term effect of different integrated nutrient management on soil organic carbon and its fractions and sustainability of rice–wheat system in indo gangetic plains of India. Field Crops Res. 2012, 127, 129–139. [Google Scholar] [CrossRef]
  6. Manjunath, B.L.; Paramesh, V.; Mahajan, G.R.; Das, B.; Reddy, K.V.; Chakurkar, E.B.; Singh, N.P. Sustainability through resource recycling, soil fertility and carbon sequestration from integrated farming systems in West Coast India. Bioscan 2017, 12, 1–6. [Google Scholar]
  7. Swarup, A.; Manna, M.C.; Singh, G.B.; Lal, R. Impact of land use and management practices on organic carbon dynamics in soils of India. In Global Climate Change and Tropical Ecosystems; CRC Press: Boca Raton, FL, USA, 2000; pp. 261–281. [Google Scholar]
  8. Kong, A.Y.Y.; Six, J.; Bryant, D.C.; Denison, R.F.; van Kessel, C. The relationship between carbon input, aggregation, and soil organic carbon stabilization in sustainable cropping systems. Soil Sci. Soc. Am. J. 2005, 69, 1078–1085. [Google Scholar] [CrossRef]
  9. Sujatha, S.; Bhat, R. Resource use and benefits of mixed farming approach in arecanut ecosystem in India. Agric. Syst. 2015, 141, 126–137. [Google Scholar] [CrossRef]
  10. Seth, A.; Sarkar, D.; Datta, A.; Mandal, B.; Chowdhury, A.; Masto, R.E.; Chakravarty, A.K.; Hazra, G.C.; Badole, S.; Batyabal, K.; et al. Suitability of complex extractants for assessment of available soil zinc for nutrition of rice (Oryza Sativa L.) in subtropical India. Soil Sci. 2017, 182, 28–35. [Google Scholar] [CrossRef]
  11. Batabyal, K.; Mandal, B.; Sarkar, D.; Murmu, S. Assessment of nutrient management technologies for eggplant production under subtropical conditions: A comprehensive approach. Exp. Agric. 2017, 53, 588–608. [Google Scholar] [CrossRef]
  12. Mahajan, G.R.; Manjunath, B.L.; Narendra Pratap, S.; Ramesh, R.; Verma, R.R.; Marutrao, L.A.; Ruenna, D.; Natasha, B.; Rahul, K. effect of organic and inorganic sources of nutrients on soil microbial activity and soil organic carbon build-up under rice in West Coast of India. Arch. Agron. Soil Sci. 2017, 63, 414–426. [Google Scholar] [CrossRef]
  13. Batabyal, K.; Mandal, B.; Sarkar, D.; Murmu, S.; Tamang, A.; Das, I.; Hazra, G.C.; Chattopadhyay, P.S. Comprehensive assessment of nutrient management technologies for cauliflower production under subtropical conditions. Eur. J. Agron. 2016, 79, 1–13. [Google Scholar] [CrossRef]
  14. Sarkar, D.; Baishya, L.K.; Meitei, C.B.; Naorem, G.C.; Thokchom, R.C.; Singh, J.; Bhuvaneswari, S.; Batabyal, K.; Das, R.; Padhan, D.; et al. Can Sustainability of maize-mustard cropping system be achieved through balanced nutrient management? Field Crops Res. 2018, 225, 9–21. [Google Scholar] [CrossRef]
  15. Mueller, T.G.; Pusuluri, N.B.; Mathias, K.K.; Cornelius, P.L.; Barnhisel, R.I.; Shearer, S.A. Map quality for ordinary kriging and inverse distance weighted interpolation. Soil Sci. Soc. Am. J. 2004, 68, 2042–2047. [Google Scholar] [CrossRef]
  16. Paramesh, V.; Arunachalam, V.; Nikkhah, A.; Das, B.; Ghnimi, S. Optimization of energy consumption and environmental impacts of arecanut production through coupled data envelopment analysis and life cycle assessment. J. Clean. Prod. 2018, 203, 674–684. [Google Scholar] [CrossRef]
  17. Meena, B.P.; Biswas, A.K.; Singh, M.; Chaudhary, R.S.; Singh, A.B.; Das, H.; Patra, A.K. Long-term sustaining crop productivity and soil health in maize–chickpea system through integrated nutrient management practices in vertisols of central India. F. Crop. Res. 2019, 232, 62–76. [Google Scholar] [CrossRef]
  18. Paramesh, V.; Dhar, S.; Vyas, A.K.; Dass, A. Studies on impact of phosphoenriched compost, chemical fertilizer and method of zinc application on yield, uptake and quality of maize (Zea Mays). Indian J. Agron. 2014, 59, 613–618. [Google Scholar]
  19. Paramesh, V.; Sridhara, C.J.; Shashidhar, K.S. Effect of integrated nutrient management and planting geometry on root parameter and nutrient uptake of aerobic rice. Agric. Update 2013, 8, 217–220. [Google Scholar]
  20. Paramesh, V.; Sridhara, C.J.; Shashidhar, K.S. Leaf area, leaf area index and leaf area duration influenced by integrated nutrient management and planting geometry in aerobic rice. Environ. Ecol. 2013, 31, 943–946. [Google Scholar]
  21. Paramesh, V.; Sridhara, C.J.; Shashidhar, K.S.; Bhuvaneswari, S. Effect of integrated nutrient management and planting geometry on growth and yield of aerobic rice. Int. J. Agric. Sci. 2014, 10, 49–52. [Google Scholar]
  22. Sarkar, D.; Baishya, L.K. Nutrient Use Efficiency. In Essential Plant Nutrient; Naeem, M., Ansari, A.A., Singh, S., Eds.; Springer: Gewerbestrasse, Switzerland, 2017; pp. 119–146. [Google Scholar]
  23. Basak, N.; Datta, A.; Mitran, T.; Roy, S.S.; Saha, B.; Biswas, S.; Mandal, B. Assessing soil-quality indices for subtropical rice-based cropping systems in India. Soil Res. 2016, 54, 20–29. [Google Scholar] [CrossRef]
  24. Satyanarayana, V.; Vara Prasad, P.V.; Murthy, V.R.K.; Boote, K.J. Influence of integrated use of farmyard manure and inorganic fertilizers on yield and yield components of irrigated lowland rice. J. Plant Nutr. 2002, 25, 2081–2090. [Google Scholar] [CrossRef]
  25. Prasad, P.V.V.; Satyanarayana, V.; Murthy, V.R.K.; Boote, K.J. Maximizing yields in rice–groundnut cropping sequence through integrated nutrient management. Field Crops Res. 2002, 75, 9–21. [Google Scholar] [CrossRef]
  26. Banerjee, H.; Pal, S. Integrated nutrient management for rice-rice cropping system. Oryza 2009, 46, 32–36. [Google Scholar]
  27. Patra, A.K.; Mishra, K.N.; Garnayak, L.M.; Halder, J.; Swain, S.K. Influence of long-term integrated nutrient management on productivity and soil properties in rice (Oryza Sativa)-rice cropping system in an acidic soil. Indian J. Agron. 2017, 62, 111–117. [Google Scholar]
  28. Sharma, S.; Padbhushan, R.; Kumar, U. Integrated nutrient management in rice–wheat cropping system: An evidence on sustainability in the indian subcontinent through meta-analysis. Agronomy 2019, 9, 71. [Google Scholar] [CrossRef] [Green Version]
  29. Pernes-Debuyser, A.; Tessier, D. Soil physical properties affected by long-term fertilization. Eur. J. Soil Sci. 2004, 55, 505–512. [Google Scholar] [CrossRef]
  30. Gelfand, I.; Snapp, S.S.; Robertson, G.P. Energy efficiency of conventional, organic, and alternative cropping systems for food and fuel at a site in the u.s. midwest. Environ. Sci. Technol. 2010, 44, 4006–4011. [Google Scholar] [CrossRef]
  31. Basavalingaiah, K.; Ramesha, Y.M.; Paramesh, V.; Rajanna, G.A.; Jat, S.L.; Dhar Misra, S.; Kumar Gaddi, A.; Girisha, H.C.; Yogesh, G.S.; Raveesha, S.; et al. Energy budgeting, data envelopment analysis and greenhouse gas emission from rice production system: A case study from puddled transplanted rice and direct-seeded rice system of karnataka, india. Sustainability 2020, 12, 6439. [Google Scholar] [CrossRef]
  32. Linquist, B.; Groenigen, K.J.; Adviento-Borbe, M.A.; Pittelkow, C.; Kessel, C. An agronomic assessment of greenhouse gas emissions from major cereal crops. Glob. Chang. Biol. 2012, 18, 194–209. [Google Scholar] [CrossRef]
  33. Singh, P.; Benbi, D.K. Soil organic carbon pool changes in relation to slope position and land-use in indian lower himalayas. CATENA 2018, 166, 171–180. [Google Scholar] [CrossRef]
  34. Benbi, D.K.; Toor, A.S.; Kumar, S. Management of organic amendments in rice-wheat cropping system determines the pool where carbon is sequestered. Plant Soil 2012, 360, 145–162. [Google Scholar] [CrossRef]
  35. Singh, P.; Benbi, D.K. Nutrient management impacts on net ecosystem carbon budget and energy flow nexus in intensively cultivated cropland ecosystems of north-western India. Paddy Water Environ. 2020, 18, 697–715. [Google Scholar] [CrossRef]
  36. Paramesh, V.; Dhar, S.; Dass, A.; Kumar, B.; Kumar, A.; El-Ansary, D.O.; Elansary, H.O. Role of integrated nutrient management and agronomic fortification of zinc on yield, nutrient uptake and quality of wheat. Sustainability 2020, 12, 3513. [Google Scholar] [CrossRef]
  37. Nabavi-Pelesaraei, A.; Rafiee, S.; Mohtasebi, S.S.; Hosseinzadeh-Bandbafha, H.; Chau, K. Energy consumption enhancement and environmental life cycle assessment in paddy production using optimization techniques. J. Clean. Prod. 2017, 162, 571–586. [Google Scholar] [CrossRef]
  38. Paramesh, V.; Singh, S.K.; Mohekar, D.S.; Arunachalam, V.; Misra, S.D.; Jat, S.L.; Kumar, P.; Nath, A.J.; Kumar, N.; Mahajan, G.R.; et al. impact of sustainable land-use management practices on soil carbon storage and soil quality in goa state, India. Land Degrad. Dev. 2022, 33, 28–40. [Google Scholar] [CrossRef]
  39. Sehgal, J.; Mandal, D.K. Soil Temperature Regimes in India; NBSS&LUP: Nagpur, India, 1994; ISBN 818546023X. [Google Scholar]
  40. Nelson, D.W.; Sommers, L.E. Total Nitrogen Analysis of Soil and Plant Tissues. J. Assoc. Off. Anal. Chem. 1980, 63, 770–778. [Google Scholar] [CrossRef]
  41. Jackson, H.C. Soil Chemical Analysis; Prentica Hall India Pvt. Ltd.: New Delhi, India, 1973. [Google Scholar]
  42. Blake, G.R. Methods of Soil Analysis; Klute, A., Ed.; SSSA Book Series; Soil Science Society of America, American Society of Agronomy: Madison, WI, USA, 1986; ISBN 9780891188643. [Google Scholar]
  43. Walkley, A.; Black, I.A. An examination of the degtjareff method for determining soil organic matter, and a proposed modification of the chromic acid titration method. Soil Sci. 1934, 37, 29–38. [Google Scholar] [CrossRef]
  44. Chan, K.Y.; Heenan, D.P.; Oates, A. Soil carbon fractions and relationship to soil quality under different tillage and stubble management. Soil Tillage Res. 2002, 63, 133–139. [Google Scholar] [CrossRef]
  45. Chesnin, L.; Yien, C.H. Turbidimetric determination of available sulfates. Soil Sci. Soc. Am. J. 1951, 15, 149–151. [Google Scholar] [CrossRef]
  46. Subbiah, B.V.; Asija, G.L. A Rapid procedure for the estimation of available nitrogen in soils. Curr. Sci. 1956, 25, 259–260. [Google Scholar]
  47. Bray, R.H.; Kurtz, L.T. Determination of total, organic, and available forms of phosphorus in soils. Soil Sci. 1945, 59, 39–46. [Google Scholar] [CrossRef]
  48. Hanway, J.J.; Heidel, H. Soil analysis methods as used in iowa state college soil testing laboratory. Iowa Agric. 1952, 57, 1–31. [Google Scholar]
  49. Lindsay, W.L.; Norvell, W.A. Development of a DTPA soil test for zinc, iron, manganese, and copper1. Soil Sci. Soc. Am. J. 1978, 42, 421. [Google Scholar] [CrossRef]
  50. Berger, K.C.; Truog, E. Boron determination in soils and plants. Ind. Eng. Chem. Anal. Ed. 1939, 11, 540–545. [Google Scholar] [CrossRef]
  51. Vance, E.D.; Brookes, P.C.; Jenkinson, D.S. An extraction method for measuring soil microbial biomass C. Soil Biol. Biochem. 1987, 19, 703–707. [Google Scholar] [CrossRef]
  52. Anderson, J.P.E. Soil Respiration. In Methods of Soil Analysis Part 2: Chemical and Microbiological Properties; Wiley: New York, NY, USA, 2015; pp. 831–871. [Google Scholar]
  53. Casida, L.E., Jr.; Klein, D.A.; Santoro, T. Soil dehydrogenase activity. Soil Sci. 1964, 98, 371–376. [Google Scholar] [CrossRef]
  54. Kandeler, E.; Gerber, H. Short-term assay of soil urease activity using colorimetric determination of ammonium. Biol. Fertil. Soils 1988, 6, 68–72. [Google Scholar] [CrossRef]
  55. Datta, A.; Basak, N.; Chaudhari, S.K.; Sharma, D.K. Soil properties and organic carbon distribution under different land uses in reclaimed sodic soils of north-west India. Geoderma Reg. 2015, 4, 134–146. [Google Scholar] [CrossRef]
  56. Singh, S.; Mittal, J.P. Energy in Production Agriculture; Mittal Publications: New Delhi, India, 1992; ISBN 8170994071. [Google Scholar]
  57. Kumar, M.; Jha, A.K.; Hazarika, S.; Verma, B.C.; Choudhury, B.U.; Ramesh, T.; Moirangthem, P.; Kumar, R.; Brajendra; Rajkhowa, D.J.; et al. Micronutrients (B, Zn, Mo) for improving crop production on acidic soils of northeast India. Natl. Acad. Sci. Lett. 2016, 39, 85–89. [Google Scholar] [CrossRef]
  58. Hashim, M.; Dhar, S.; Vyas, A.K.; Paramesh, V.; Kumar, B. Integrated nutrient management in maize (Zea mays)-wheat (Triticum aestivum) cropping system. Indian J. Agron. 2015, 60, 352–359. [Google Scholar]
  59. Das, A.; Patel, D.P.; Munda, G.C.; Ghosh, P.K. Effect of organic and inorganic sources of nutrients on yield, nutrient uptake and soil fertility of maize (Zea mays)-mustard (Brassica campestris) cropping system. Indian J. Agric. Sci. 2010, 80, 85–88. [Google Scholar]
  60. Gautam, A.K.; Kumar, D.; Shivay, Y.S.; Mishra, B.N. Influence of nitrogen levels and plant spacing on growth, productivity and quality of two inbred varieties and a hybrid of aromatic rice. Arch. Agron. Soil Sci. 2008, 54, 515–532. [Google Scholar] [CrossRef]
  61. Behera, U.K.; Sharma, A.R.; Pandey, H.N. Sustaining productivity of wheat–soybean cropping system through integrated nutrient management practices on the vertisols of central India. Plant Soil 2007, 297, 185–199. [Google Scholar] [CrossRef]
  62. Mavi, M.S.; Benbi, D.K. Potassium dynamics under integrated nutrient management in rice-wheat system. Agrochimica 2008, 52, 83–91. [Google Scholar]
  63. Majumder, B.; Mandal, B.; Bandyopadhyay, P.K.; Gangopadhyay, A.; Mani, P.K.; Kundu, A.L.; Mazumdar, D. Organic Amendments influence soil organic carbon pools and rice-wheat productivity. Soil Sci. Soc. Am. J. 2008, 72, 775–785. [Google Scholar] [CrossRef]
  64. Dutta, J.; Sharma, S.P.; Sharma, S.K.; Sharma, G.D.; Sankhyan, N.K. Indexing soil quality under long-term maize-wheat cropping system in an acidic alfisol. Commun. Soil Sci. Plant Anal. 2015, 46, 1841–1862. [Google Scholar] [CrossRef]
  65. Ghosh, S.; Wilson, B.; Ghoshal, S.; Senapati, N.; Mandal, B. Organic amendments influence soil quality and carbon sequestration in the indo-gangetic plains of India. Agric. Ecosyst. Environ. 2012, 156, 134–141. [Google Scholar] [CrossRef]
  66. Shah, Z.; Shah, S.H.; Peoples, M.B.; Schwenke, G.D.; Herridge, D.F. Crop residue and fertiliser n effects on nitrogen fixation and yields of legume–cereal rotations and soil organic fertility. Filed Crops Res. 2003, 83, 1–11. [Google Scholar] [CrossRef]
  67. Nath, A.J.; Brahma, B.; Sileshi, G.W.; Das, A.K. Impact of land use changes on the storage of soil organic carbon in active and recalcitrant pools in a humid tropical region of India. Sci. Total Environ. 2018, 624, 908–917. [Google Scholar] [CrossRef]
  68. Rudrappa, L.; Purakayastha, T.J.; Singh, D.; Bhadraray, S. Long-term manuring and fertilization effects on soil organic carbon pools in a typic haplustept of semi-arid sub-tropical India. Soil Tillage Res. 2006, 88, 180–192. [Google Scholar] [CrossRef]
  69. Sarma, B.; Farooq, M.; Gogoi, N.; Borkotoki, B.; Kataki, R.; Garg, A. Soil organic carbon dynamics in wheat—Green gram crop rotation amended with vermicompost and biochar in combination with inorganic fertilizers: A comparative study. J. Clean. Prod. 2018, 201, 471–480. [Google Scholar] [CrossRef]
  70. Verma, T.S.; Bhagat, R.M. Impact of rice straw management practices on yield, nitrogen uptake and soil properties in a wheat-rice rotation in northern India. Fertil. Res. 1992, 33, 97–106. [Google Scholar] [CrossRef]
  71. Yadav, R.; Dwivedi, B.; Pandey, P. Rice-wheat cropping system: Assessment of sustainability under green manuring and chemical fertilizer inputs. Filed Crops Res. 2000, 65, 15–30. [Google Scholar] [CrossRef]
  72. Hemalatha, S.; Chellamuthu, S. impacts of long term fertilization on soil nutritional quality under finger millet: Maize cropping sequence. J. Environ. Res. Dev. 2013, 7, 1571–1576. [Google Scholar]
  73. Mandal, B.; Majumder, B.; Adhya, T.K.; Bandyopadhyay, P.K.; Gangopadhyay, A.; Sarkar, D.; Kundu, M.C.; Choudhury, S.G.; Hazra, G.C.; Kundu, S.; et al. Potential of double-cropped rice ecology to conserve organic carbon under subtropical climate. Glob. Chang. Biol. 2008, 14, 2139–2151. [Google Scholar] [CrossRef]
  74. Sarkar, D.; Bungbungcha Meitei, C.; Baishya, L.K.; Das, A.; Ghosh, S.; Chongloi, K.L.; Rajkhowa, D. Potential of fallow chronosequence in shifting cultivation to conserve soil organic carbon in northeast India. CATENA 2015, 135, 321–327. [Google Scholar] [CrossRef]
  75. Sahrawat, K.L. Organic matter accumulation in submerged soils. In Advances in Agronomy; Academic Press: Cambridge, MA, USA, 2003; Volume 81, pp. 169–201. [Google Scholar]
  76. Manning, D.A.C.; Renforth, P. Passive sequestration of atmospheric CO2 through coupled plant-mineral reactions in urban soils. Environ. Sci. Technol. 2013, 47, 135–141. [Google Scholar] [CrossRef]
  77. Mendoza, T.C. Evaluating the benefits of organic farming in rice agroecosystems in the Philippines. J. Sustain. Agric. 2004, 24, 93–115. [Google Scholar] [CrossRef]
  78. Yuan, S.; Peng, S. Input-output energy analysis of rice production in different crop management practices in Central China. Energy 2017, 141, 1124–1132. [Google Scholar] [CrossRef]
  79. Saber, Z.; Esmaeili, M.; Pirdashti, H.; Motevali, A.; Nabavi-Pelesaraei, A. Exergoenvironmental-life cycle cost analysis for conventional, low external input and organic systems of rice paddy production. J. Clean. Prod. 2020, 263, 121529. [Google Scholar] [CrossRef]
  80. Paramesh, V.; Ravisankar, N.; Das, B.; Reddy, K.V.; Singh, N.P. Energy budgeting and sensitivity analysis of rice (Oryza sativa)–wheat (Triticum aestivum) cropping system in indogangentic plains of india. Int. J. Curr. Microbiol. App. Sci 2017, 6, 1534–1544. [Google Scholar]
  81. Paramesh, V.; Arunachalam, V.; Nath, A.J. Enhancing ecosystem services and energy use efficiency under organic and conventional nutrient management system to a sustainable arecanut based cropping system. Energy 2019, 187, 115902. [Google Scholar] [CrossRef]
  82. Šarauskis, E.; Buragienė, S.; Masilionytė, L.; Romaneckas, K.; Avižienytė, D.; Sakalauskas, A. Energy balance, costs and CO2 analysis of tillage technologies in maize cultivation. Energy 2014, 69, 227–235. [Google Scholar] [CrossRef]
  83. Singh, R.J.; Ghosh, B.N.; Sharma, N.K.; Patra, S.; Dadhwal, K.S.; Mishra, P.K. Energy budgeting and emergy synthesis of rainfed maize–wheat rotation system with different soil amendment applications. Ecol. Indic. 2016, 61, 753–765. [Google Scholar] [CrossRef]
  84. Soltani, A.; Rajabi, M.H.; Zeinali, E.; Soltani, E. Energy inputs and greenhouse gases emissions in wheat production in Gorgan, Iran. Energy 2013, 50, 54–61. [Google Scholar] [CrossRef]
  85. He, P.; Li, S.; Jin, J.; Wang, H.; Li, C.; Wang, Y.; Cui, R. Performance of an optimized nutrient management system for double-cropped wheat-maize rotations in north-central China. Agron. J. 2009, 101, 1489–1496. [Google Scholar] [CrossRef]
  86. Evans, E. Marginal analysis: An economic procedure for selecting alternative technologies/practices. EDIS 2005, 2005, 1–6. [Google Scholar] [CrossRef]
Figure 1. Study area map of the experiment.
Agronomy 13 01557 g001
Figure 2. Soil carbon stock in different nutrient management practices (Note: VLC−Very Labile Carbon; LC−Labile Carbon; LLC−Less Labile Carbon; and NLC−Non-Labile Carbon).
Agronomy 13 01557 g002
Figure 3. Percent contrition of soil carbon fractions under different nutrient management practices (Note: VLC−Very Labile Carbon; LC−Labile Carbon; LLC−Less Labile Carbon; and NLC−Non-Labile Carbon).
Agronomy 13 01557 g003
Figure 4. Active pool, passive pool, and total carbon stock under different nutrient management practices (Note: AP−active carbon pool; PP−passive carbon pool; and TOC−total organic carbon).
Agronomy 13 01557 g004
Table 1. Inputs and output of energy coefficients in the rice production system of Goa.
Inputs (Unit)Energy Equivalent (MJ Unit−1)
Inputs
Farmyard Manure (kg)0.47
Nitrogen (kg)66.1
Phosphorus (kg)12.4
Potassium (kg)11.1
Rice straw (kg)12.5
Output
Grain yield (kg)14.7
Straw yield (kg)12.5
Source: Singh and Mittal [57].
Table 2. Quantity of nutrients applied in the rice–rice cropping system and their energy equivalents.
TreatmentsQuantity Applied (kg ha−1)Energy Equivalent (MJ ha−1)
FYMN through FertilizerP through FertilizerK through FertilizerRice StrawFYMNPKRice Straw
T10000000000
T202001001000013,220124011100
T316,666000078330000
T44166150866201958991510666880
T501509203846099151145048,075
T6416610078038461958.026610967.2048,075
T1—Control; T2—100% N-NCU; T3—100% N-FYM T4—75% N + 25% N-FYM; T5—75% N+ 25% N-RSI; T6—50% N-NCU+ 25% N-FYM + 25% N-RSI.
Table 3. Yield and yield parameters of the rice–rice cropping system under different treatments in the rice–rice system.
TreatmentsKharif RiceRabi Rice
Tillers
m−2
Panicles
m−2
Panicle Length (cm)Panicle Weight (g)Grains Panicle−1Grain Yield
(t ha−1)
Straw Yield
(t ha−1)
Tillers m−2Panicles m−2Panicle Length (cm)Panicle Weight (g)Grains Panicle−1Grain Yield (t ha−1)Straw Yield
(t ha−1)
T1184f129e12.2d5.5e51.3e2.19d2.74d169f119e11.2d5.1e47.2e2.0d2.5d
T2278b198b20.9b14.1b118.1b4.91b6.78b253b179b19.7b12.9b110.7b4.5b6.3b
T3222d163d16.4c9.8d105.0c4.58c6.18c204d150d15.1c9.0d96.6c4.2c5.7c
T4286a207a22.7a15.0a129.4a5.16a7.48a263a190a20.9a13.8a119.0a4.7a6.9a
T5236c175c17.5c10.8c100.6c4.62c5.78d217c161c16.1c9.9c92.6c4.3c5.3d
T6212e162d17.2c10.5c91.2d4.66c6.02c195e149d15.8c9.7c83.9d4.3c5.9c
Source of variationStatistical significance
Year****************************
Treatment****************************
Year x Treatmentnsnsnsnsnsnsnsnsnsnsnsnsnsns
Note: *, **, and *** indicate significant at p < 0.05, 0.01 and 0.001, respectively; ns, not significant. Similar letter in a row indicates non-significant difference between treatments.
Table 4. Nutrient uptake (kg ha−1) under different nutrient management practices in the rice–rice system.
TreatmentsKharif RiceRabi Rice
Total N UptakeTotal P UptakeTotal K UptakeTotal N UptakeTotal P UptakeTotal K Uptake
T130.93e3.56c41.01d27.04d3.11d35.84d
T293.13c11.57b91.82b84.19b10.48b81.06b
T3102.50a14.54a96.04a89.59a12.71a83.94a
T4102.94a12.90a96.11a86.35a10.68b87.14a
T588.59d10.63b87.55c77.43c9.29c76.52c
T697.69b10.50b94.98a85.38b9.18c83.01a
Source of variationStatistical significance
Year**********
Treatment**********
Year x Treatmentnsnsnsnsnsns
Note: * and *** significant at p < 0.05, 0.01 and 0.001, respectively; ns, not significant. Similar letter in a row indicates non-significant difference between treatments. T1—Control; T2—100% N-NCU; T3—100% N-FYM T4—75% N + 25% N-FYM; T5—75% N+ 25% N-RSI; T6—50% N-NCU+ 25% N-FYM + 25% N-RSI.
Table 5. Soil properties as influenced by different nutrient management practices in the rice–rice system.
TreatmentsBulk
Density
(Mg m−3)
Available
N (kg ha−1)
Available
P (kg ha−1)
Available
K (kg ha−1)
Fe
(mg kg−1)
Zn
(mg kg−1)
DHA
(mg TPF g−1 h−1)
Phosphatase
(µg PNP g−1 day−1)
SMBC
(mg kg−1 Soil)
Urease
(μg Urea g−1 h−1)
BSR
(mg CO2-
C g−1 day−1)
T11.43a108.7bc8.64c135.9d46.66.90210.0d169.8c166.0d1.5c15.8c
T21.42a116.3b10.78b145.3c49.97.33233.7c176.4c233.7c1.6c16.4c
T31.37b157.7a16.17a167.1a52.77.77315.9a385.9a394.6a3.5a36.6a
T41.39a151.3a15.20a161.0a49.78.48291.0a383.0a353.5a3.3a35.9a
T51.40a146.7a12.35b158.7b46.47.56253.8b335.0b327.4b2.9b31.1b
T61.38b127.5b13.99a160.8a50.87.85294.0a361.7a312.5b3.2a33.6a
SEM±0.013.980.792.471.580.9610.4815.0718.740.121.46
CD at 5%0.0412.52.487.79NSNS33.047.4759.050.384.60
Note: NS, non-significant, Similar letter in a row indicates non-significant difference between treatments. T1—Control; T2—100% N-NCU; T3—100% N-FYM; T4—75% N + 25% N-FYM; T5—75% N+ 25% N-RSI; T6—50% N-NCU+ 25% N-FYM + 25% N-RSI.
Table 6. Soil carbon fractions (g kg−1) as influenced by different nutrient management practices in rice–rice systems.
TreatmentsVLCLCLLCNLCTOCLIAPPP
T10.33b0.35b0.76d5.42c6.86c0.350.676.19
T20.33b0.30b0.65e4.64c5.92c0.380.635.29
T30.49a0.52a1.28a7.73a10.01a0.381.019.00
T40.44a0.45a0.98b6.95a8.81b0.360.897.92
T50.41a0.41a0.90b6.40b8.13b0.360.827.30
T60.39b0.39b0.86c6.13b7.77b0.360.786.99
SEM±0.030.020.050.350.42---
CD at 5%0.090.100.101.11.3---
Note: Similar letter in a row indicates non-significant difference between treatments. VLC-Very Labile Carbon; LC-Labile Carbon; LLC-Less Labile Carbon; NLC-Non Labile Carbon; TOC: Total Organic Carbon; LI: Lability Index; AP: Active Carbon Pool; and PP: Passive Carbon Pool. T1—Control; T2—100% N-NCU; T3—100% N-FYM T4—75% N + 25% N-FYM; T5—75% N+ 25% N-RSI; T6—50% N-NCU+ 25% N-FYM + 25% N-RSI.
Table 7. Influence of different nutrient practices on energy indices in the rice–rice system.
TreatmentsEnergy
Input
(MJ ha−1)
Energy
Output
(MJ ha−1)
Energy Use
Efficiency
Energy
Productivity
(kg MJ−1)
Specific
Energy
(MJ kg−1)
Net Energy Gain
(MJ ha−1)
T10139,074---139,074
T215,570346,72422.30.621.62331,154
T37833303,77538.81.120.89295,942
T413,628324,17923.80.741.35310,551
T559,135293,3885.00.156.67234,254
T657,610313,6845.40.166.44256,074
Table 8. Influence of different nutrient management practices on the economics (USD) of the rice–rice system.
TreatmentsCost of CultivationGross ReturnsNet ReturnsB: C Ratio
T1800841410.051
T21060256715081.42
T31173293117581.49
T4907268317761.95
T5920236514451.57
T6860238615261.77
Note: T1—Control; T2—100% N-NCU; T3—100% N-FYM T4—75% N + 25% N-FYM; T5—75% N+ 25% N-RSI; T6—50% N-NCU+ 25% N-FYM + 25% N-RSI.
Table 9. The criterion used for ranking different nutrient management practices.
TreatmentsSystem Productivity
(kg ha−1)
Net Returns
(USD ha−1)
EUENEG
(MJ ha−1)
TOC
(Mg C ha−1)
SMBC
(mg kg−1 Soil)
Rank Sum Score
Control4205 (6)41 (6)0 (6)139,074 (6)30 (5)166 (6)35
N-100% NCU9628 (2)1508 (4)23 (3)331,154 (1)26 (6)234 (5)21
100% N-FYM8794 (5)1758 (2)39 (1)295,942 (3)42 (1)395 (1)13
75% N + 25% N-FYM10060 (1)1776 (1)24 (2)310,552 (2)37 (2)354 (2)10
75% N+ 25% N-RR8871 (4)1446 (5)5 (5)234,254 (5)35 (3)328 (3)25
50% N-NCU+ 25% N-FYM + 25% N-RSI8948 (3)1526 (3)6 (4)256,075 (4)33 (4)313 (4)22
Disclaimer/Publisher’s Note: The statements, opinions and data contained in all publications are solely those of the individual author(s) and contributor(s) and not of MDPI and/or the editor(s). MDPI and/or the editor(s) disclaim responsibility for any injury to people or property resulting from any ideas, methods, instructions or products referred to in the content.

