Abstract
Fencing enclosures play an important role in improving ecological quality. There is a direct impact of implementing fencing enclosures on the change in soil quality. The soil quality index was used to examine the effects of fencing enclosures for different years (7 and 11 years) on soil quality in Biru County of Qinghai–Tibet Plateau, China. The fencing enclosure significantly increased soil water content, non-capillary porosity, soil organic matter, total nitrogen, total phosphorus, and alkali-hydrolyzable nitrogen, and significantly decreased the soil bulk density. The soil quality gradually improved as the fencing enclosure time length increased, probably due to the increase of vegetation coverage and biomass under the fencing enclosure. The minimum data set was composed of soil organic matter, capillary porosity, total potassium, and non-capillary porosity. The minimum data set was significantly correlated with the total data set and could replace the total data set for soil quality evaluation in the fencing enclosure project area. In summary, our study reflects that fencing enclosures significantly improve soil quality, and the implementation of the fencing enclosure project will effectively curb land degradation in Biru County of the Qinghai–Tibet Plateau, China.
1. Introduction
The Qinghai–Tibet Plateau is a significant ecological security barrier for both China and Asia due to its special geographical location and sensitivity to climate change [1]. In recent years, the Qinghai–Tibet Plateau has been facing serious ecological degradation issues due to frequent human activity and climate change. The principal effects of ecological degradation on the Qinghai–Tibet Plateau include soil erosion, reduction of biodiversity, accelerated thawing of the permafrost layer, and so on. These problems destroy the ecological structure and function of the Qinghai–Tibet Plateau and threaten the stability of the ecosystem. Additionally, the problem of ecological degradation seriously affects people’s life and production and has become an important area of concern in the ecological protection and restoration in the Qinghai–Tibet Plateau [2,3,4,5].
Ecological engineering can change the ecological security and the ecological carrying capacity. Additionally, ecological engineering can lead to changes in community structure, ecosystem service functions, and land use types in the implementation area [6,7,8]. With the further implementation of the ecological project in the Qinghai–Tibet Plateau, relevant research on the effect of fencing enclosures on the ecosystem has gradually deepened. Currently, some studies focus on the changes in community structure and vegetation dynamics after the implementation of the fencing enclosure. For example, Liu et al. (2021) compared and analyzed the differences in plant community structure between fencing enclosure and grazing areas in Sanjiangyuan grassland, and then evaluated the impact of fencing enclosure on grassland restoration. Their results showed that fencing enclosure significantly increased above-ground biomass [9]. Furthermore, Zhang et al. (2022) studied the changes in grassland plant communities during the fencing enclosure period and the regrazing period for nearly 20 consecutive years, and the results demonstrated that the height, coverage, and above-ground biomass of grassland vegetation increased rapidly during the three-year fencing period [10]. Some scholars focused on the research of soil quality in the Qinghai–Tibet Plateau. For example, Wan et al. (2021) studied the effects of different utilization methods on soil particle composition and fractal characteristics of four alpine grasslands (grazing, fencing enclosure, fencing enclosure + replanting, and undisturbed) in the Qinghai–Tibet Plateau [11]. Zhou et al. (2018) conducted a comprehensive assessment of the quality of degraded alpine grasslands on the southeastern edge of the Qinghai–Tibet Plateau, and their results showed that after 7 years of restoration by fencing enclosure, the soil physicochemical properties within the fence were improved [12].
Fencing enclosures are one of the main methods to renovate degraded ecosystems. They are also easy to operate, quick to take effect, and cost-efficient. Fencing enclosures are used to restore the ecosystem by prohibiting grazing to prevent human activities such as livestock foraging and trampling. They can promote ecosystem succession and restore ecosystem stability [13,14]. Additionally, the enclosures significantly improve soil physicochemical properties, water content, soil organic carbon, nitrogen, and phosphorus [15,16,17]; above- and below-ground biomass; productivity; species richness, evenness and complexity; soil microbial diversity, and ecosystem structure and function [18,19,20,21,22]. However, their effectiveness is influenced by the ecosystem types, the degree of degradation, the fencing enclosure method, and the time length [23,24]. Some studies have shown that fencing enclosures may have a negative impact on the food chain, the ecosystem web, and soil enzyme activity with increasing fencing enclosure time length [25,26,27,28]. However, the effects of fencing enclosure time length on soil quality have rarely been reported, especially in the severely degraded grasslands. The hypothesis of this study is that the fencing enclosure can significantly improve soil quality, and the improvement is related to the implementation years.
Soil degradation is a serious menace to mankind’s survival and economic development in society [29,30,31,32]. Land use is the most common, direct, and profound factor influencing soil quality. It can result in degradation phenomena of soil nutrient degradation, soil erosion, and land desertification [33,34]. Soil quality is a sensitive indication, reflecting the soil management changes and soil recovery ability from degradation [35]. The soil quality index (SQI) is a vital tool to assess the changes in soil quality [36,37,38,39]. It is very important that various soil properties are integrated into an overall indicator for assessing soil quality [40,41]. Larson and Pierce (1991) raised the idea that a minimum data set (MDS) was a good method by selecting the most representative soil properties to reflect the responses of soil quality to the different management practices [42].
With the implementation of ecological engineering in the Qinghai–Tibet Plateau, studies exploring the impact of fencing enclosures on the ecosystem structure and function, vegetation dynamics, and soil physicochemical properties have gradually increased. However, little research has focused on the effects of fencing enclosure on soil quality in the Qinghai–Tibet Plateau based on MDS. Taking the results of the preexisting research, we investigated the effects of fencing enclosures on soil quality based on MDS in Biru County of the Qinghai–Tibet Plateau, China. We aimed to investigate the following: (1) How fencing enclosure affects soil physical and chemical properties. (2) How the effect of the fencing enclosure on soil quality is assessed by using the SQI. (3) Whether the MDS can replace the total data set (TDS) to assess soil quality. Overall, our study could provide the scientific basis for the implementation of fencing enclosures in the Qinghai–Tibet Plateau, China.
2. Materials and Methods
2.1. Study Area
The study area is located in Biru County of the Qinghai–Tibet Plateau between the Nyingchi Tanggula and Tanggula Mountains (31°28′40.26″ N, 93°40′52.68″ E). The terrain is dominated by low hills with high mountain valleys and surrounded by icy mountains and snow-capped peaks, with an average elevation of about 4500 m. The annual average temperature is 2.9 °C, and the annual average rainfall is 580–650 mm. The main species in the study area include Kobresia pygmaea C. B. Clarke, Microula sikkimensis (C. B. Clarke) Hemsl., Potentilla chinensis Ser., and Leontopodium leontopodioides (Willd.) Beauverd. The grassland was used for grazing, and the main animals involved were Bos mutus and some species of endemic sheep.
2.2. Soil Sampling and Analysis
In July 2021, a 20 m × 20 m site was selected for each of the three conditions, including natural grassland (Control), a fencing enclosure for 7 years (FE7), and a fencing enclosure for 11 years (FE11). FE7 and FE11 were established in 2014 and 2010, respectively, by fencing a previous natural grassland. The fences were plugged into a soil depth of 0.5–1 m and the terrain of the fencing enclosure area was flat. The detailed information for each sample site is listed in Table 1. Three 3 m × 3 m plots were randomly chosen in the control, FE7 and FE11, respectively. Additionally, three soil samples of 0–10 cm, 10–20 cm, and 20–30 cm were randomly collected in each plot and brought back to the laboratory to determine the soil’s physicochemical properties. To investigate the vegetation indicators, nine 1 m × 1 m quadrats were randomly chosen in the control, FE7 and FE11 conditions. Then, the vegetation coverage and abundance were observed by a combination of photographic methods: First, the sample photos were obtained using a camera. Following this, the vegetation image elements were extracted by supervised classification using the ERDAS IMAGINE 2013 software. Finally, the proportion of vegetation image elements was calculated using ArcMap10.2, which represented the coverage of the sample square [43].

Table 1.
Vegetation and soil characteristics of different fencing enclosure times in Biru County of Qinghai–Tibet Plateau, China (sampling in July 2021).
The cutting ring method was used to determine the soil bulk density (BD), capillary porosity (CP), and non-capillary porosity (NCP) [44]. The soil water content (SWC) was determined by the gravimetric method [45]. Furthermore, the potassium dichromate method was used to determine the soil organic matter (SOM) [46]. The Kjeldahl method was also used to determine the total nitrogen (TN) [47]. The alkali fusion-Mo-Sb anti- spectrophotometric method was used to determine the total phosphorus (TP) [48]. Finally, the total potassium (TK) was measured with the method of sodium hydroxide fusion [49], and the alkali N-proliferation method was used to measure the alkali-hydrolyzable nitrogen (AN) [50].
2.3. Methods of Soil Quality Assessment
2.3.1. Determination of the MDS
The specific method for constructing the MDS is as follows: (1) We use principal component analysis (PCA) to analyze the raw data of soil properties. PCA is one of the most widely used algorithms for data dimensionality reduction and was used to analyze the raw data of soil properties in this study. According to the results of PCA, we retrieve information on the eigenvalues of PCs, the factor load value, the explanation, and the indicator communalities. The principal components (PCs) with eigenvalues ≥1 are extracted. (2) The highest load value factor and indicators within 90% of the highest load value in every principal component (PC) are classified into the MDS. (3) The correlation analysis of indicators under the same PC in MDS is taken as follows: If the indicators are highly correlated (R > 0.5), the indicator with the highest norm value is retained; if not, all indicators are retained. (4) If an indicator appears in both PCs in the MDS, it is assigned to the set of PCs with the lower load value [51,52]. Norm, also known as the modulus vector, is a length indicator of the modulus vector in a multidimensional space. With a longer length, the indicator will have a larger combined load value on all PCs. The formula is
where Nik is the combined load value of the ith variable on the first k PCs with eigenvalues ≥1. Uik is the load value of the ith variable on the kth PC, reflecting the importance of the ith variable in the k PC. is the kth PC eigenvalue.
2.3.2. Soil Quality Index
Because the units of each soil index are not consistent, the values of every index of the determined MDS are normalized to a dimensionless value of 0–1 by dequantizing the evaluation index score function [53,54,55]. The formula is
where Si is the liner score of the indicator, and 1 is the maximum value of the function. X is the indicator value. is the average value of each site indicator. Lastly, −2.5 is the slope of the function.
The weight of an indicator is the ratio of the variance of the indicator to the sum of the variances of all participating indicators [56,57]. The formula is
where Wi is the weight of the indicator. is the variance of the indicator. n is the number of indicators for the MDS.
Based on the above steps, the soil quality index (SQI) is calculated [39]. The formula is
where SQI is the soil quality index. is the weight of the ith indicator. is the standard score of the ith indicator. N is the number of participating indicators in each data set.
2.4. Statistical Analysis
We used the SPSS 27 software to perform the statistical analyses. A one-way ANOVA followed by Duncan’s post hoc test was applied to test the effects of fencing enclosure on SWC, BD, CP, NCP, SOM, TN, TP, TK, and AN. Additionally, using a two-way ANOVA, we analyzed the effects of fencing enclosure and soil depth and their interaction on the soil’s physical and chemical properties above. Principal component analysis (PCA) and correlation analysis were used to screen soil properties to construct the MDS.
3. Results
3.1. Effects of Fencing Enclosure on Soil Properties
The fencing enclosure time length significantly increased SWC (p < 0.001, Figure 1a and Table 2), and FE11 significantly increased SWC in the 0–10 cm range, while FE7 and FE11 significantly decreased SWC in the 20–30 cm range (p < 0.05, Figure 1a). Additionally, the fencing enclosure time length significantly affected NCP in the soil depth ranges of 0–10 cm and 20–30 cm (p < 0.05, Figure 1d). FE11 also significantly decreased BD in the 0–10 cm range (p < 0.05, Figure 1b). Additionally, there were significant interactions of fencing enclosure and soil depth on SWC and NCP (p < 0.05, Figure 1a,d and Table 2).
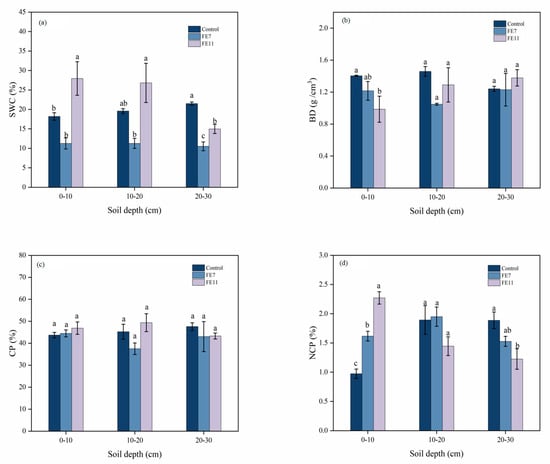
Figure 1.
(a) The soil water content (SWC), (b) soil bulk density (BD), (c) capillary porosity (CP), and (d) non-capillary porosity (NCP) in different fencing enclosure times and different soil depths in Biru County of Qinghai–Tibet Plateau, China. Values indicate means ± standard error (n = 3). Different letters above the boxes of the same soil depth indicate significant differences (p < 0.05) according to Duncan’s post hoc test.
Table 2.
F-values of the fencing enclosure time (FET), soil depth (SD), and the interaction effects on the soil properties in Biru County of Qinghai–Tibet Plateau, China.
Fencing enclosure time length significantly increased TP and AN (p < 0.05, Figure 2c,e and Table 2). Soil depth significantly affected SOM, TN, TP, and AN (p < 0.05, Figure 2a–c,e and Table 2), and significant interactions of fencing enclosure and soil depth on SOM, TN and AN were also observed (p < 0.01, Table 2). Additionally, FE11 significantly increased the SOM and TN in the 10–20 cm soil depth range (p < 0.05, Figure 2a).
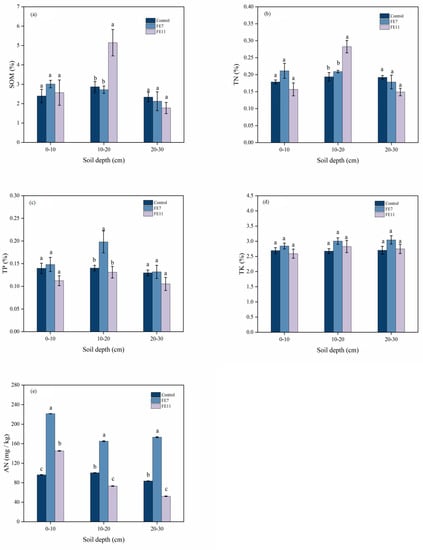
Figure 2.
(a) The soil organic matter (SOM), (b) total nitrogen content (TN), (c) total phosphorus content (TP), (d) total potassium content (TK), and (e) alkali-hydrolyzable nitrogen (AN) in different fencing enclosure times and different soil depths in Biru County of Qinghai–Tibet Plateau, China. Values indicate means ± standard error (n = 3). Different letters above the boxes of the same soil depth indicate significant differences (p < 0.05) according to Duncan’s post hoc test.
3.2. Soil Quality Assessment
3.2.1. Establishment of the Minimum Data Set
The eigenvalues of the four PCs were more than one and the indicators of these four PCs explained 80.127% of the overall results (Table 3). The results showed that the MDS could replace the total data set (TDS) to assess the soil quality of the different fencing enclosure time lengths. Four PCs could explain more than 80% of the variation in SWC, CP, NCP, and TN, and more than 70% of the variation in BD, TK, and AN. The indicator assigned to the MDS alternative in PC1 was SOM, with a factor load value of 0.486; the indicator assigned to the MDS alternative in PC2 was CP, with a factor load value of 0.542; the indicator assigned to the MDS alternative in PC3 was TK, with a factor load value of 0.581; and, lastly, the indicator assigned to the MDS alternative in PC4 was NCP, with a factor load value of 0.542. Correlation analysis was used to study the relationships between the alternative indicators (Table 4). Finally, CP, NCP, SOM, and TK were determined as the important properties for the integrated evaluation of soil quality based on the MDS.
Table 3.
Different principal components of different soil properties based on PCA in Biru County of Qinghai–Tibet Plateau, China.
Table 4.
Pearson correlation coefficients observed between different soil properties of soil water content (SWC), soil bulk density (BD), capillary porosity (CP), non–capillary porosity (NCP), soil organic matter (SOM), total nitrogen content (TN), total phosphorus content (TP), total potassium content (TK) and alkali–hydrolyzable nitrogen (AN) in Biru County of Qinghai–Tibet Plateau, China.
3.2.2. The Weights of the Indicators
The communalities of CP, NCP, SOM, and TK were 0.877, 0.822, 0.92, and 0.782, respectively (Table 5), and the weights of the four indicators, calculated according to Formula (3), were 0.2579, 0.2417, 0.2705, and 0.2299, respectively (Table 5).
Table 5.
Communalities and weights of the soil properties of capillary porosity (CP), non-capillary porosity (NCP), soil organic matter (SOM), and total potassium (TK) in minimum data set (MDS) in Biru County of Qinghai–Tibet Plateau, China.
3.2.3. Comprehensive Assessment of Soil Quality
In the 0–10 cm soil depth range, FE7 and FE11 significantly increased SQI, and the average SQI was 0.512 in FE7 and 0.524 in FE11, which respectively increased by 29.2% and 32.1% compared to the average SQI of 0.396 in the control (Figure 3). This observation showed that the implementation of fencing enclosures can indeed improve the soil environment and soil quality in the 0–10 cm range. In the 20–30 cm range, the SQI was 0.449 in FE7 and 0.382 in FE11, while the SQI was 0.496 in control. FE7 and FE11 significantly decreased the SQI (p < 0.05). Soil depth significantly affected SQI (p < 0.001, Table 2), and a significant interaction of fencing enclosure and soil depth on SQI was observed (p < 0.001, Table 2).
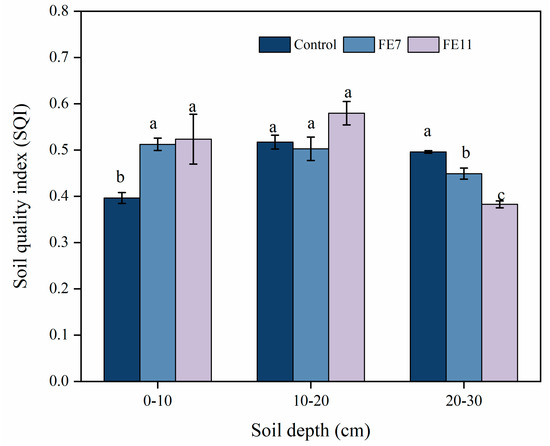
Figure 3.
Soil quality index (SQI) of the different fencing enclosure time lengths and different soil depths in Biru County of Qinghai–Tibet Plateau, China. Values indicate means ± standard error (n = 3). Different letters above the boxes of the same soil depth indicate significant differences (p < 0.05) according to Duncan’s post hoc test.
Soil quality changed with the vegetation coverage under fencing enclosures (Figure 4). The SQI of each index in MDS in the low-coverage area was observed to be in the order of CP > SOM > NCP > TK, and the SQI of each index in MDS in the high-coverage area was observed to be in the order of SOM > CP > NCP > TK. This indicated that soil quality in the low-coverage area was influenced mainly by CP, while soil quality in the high-coverage area was influenced mainly by SOM.
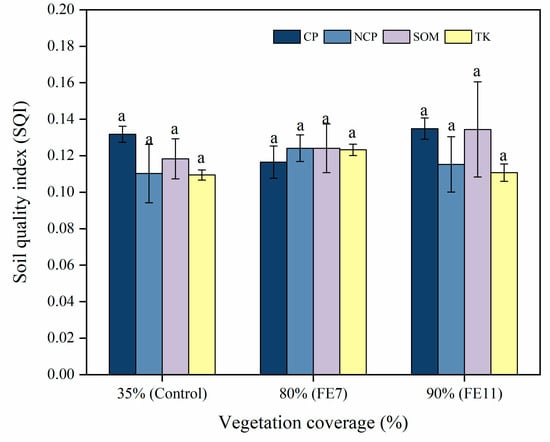
Figure 4.
Soil quality index (SQI) of different vegetation coverage in Biru County of Qinghai–Tibet Plateau, China. Values indicate means ± standard error (n = 3). Different letters above the boxes indicate significant differences (p < 0.05) according to Duncan’s post hoc test.
The percentage contributions of the soil properties to the SQI were similar in control, FE7, and FE11 (Figure 5). The contribution of SOM increased with the implementation years, and the range of values was 0.252–0.271, with a mean value of 0.259. The range of values of the contribution of CP was 0.239–0.281, with a mean value of 0.264; the range of values of the contribution of NCP was 0.233–0.254, with a mean value of 0.241; and the range of values of the contribution of TK was 0.224–0.253, with a mean value of 0.236.
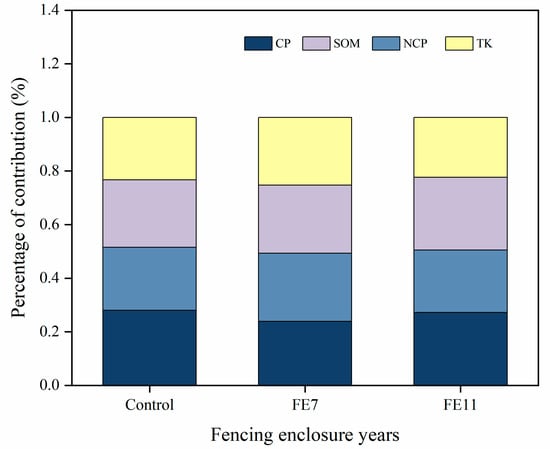
Figure 5.
Contribution rates of capillary porosity (CP), non-capillary porosity (NCP), soil organic matter (SOM), and total potassium (TK) to SQI of the different fencing enclosure time lengths in Biru County of Qinghai–Tibet Plateau, China.
To study the limiting factors of the SQI, the scores of soil quality properties at different soil depths for the different fencing enclosure time lengths were plotted as radar maps (Figure 6). The closer the crossing point is to the center of the radar, the stronger the limitation of the indicator to the SQI. The SQI was mainly influenced by the SOM in the 0–10 cm soil depth range in FE7 and the NCP in the 0–10 cm soil depth range in FE11, and other score values of each indicator were similar in FE7 and FE11.
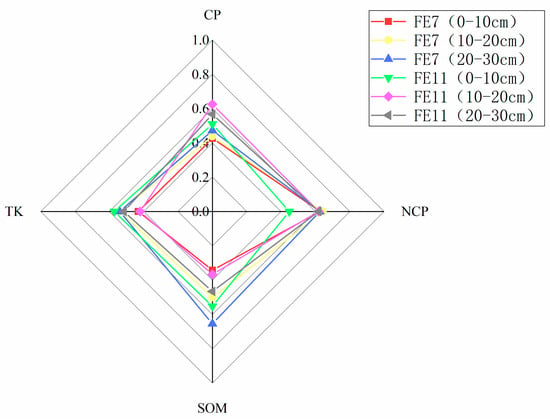
Figure 6.
Factors limiting the soil quality index (SQI) of the different fencing enclosure time lengths and different soil depths in Biru County of Qinghai–Tibet Plateau, China.
3.3. Verification of the MDS
In order to guarantee the rationality and reliability of the MDS index selection, the rationality of the MDS assessment index system was verified, which is an essential part of the soil evaluation process [58]. In the TDS, the SQI had a minimum value of 0.3399, a maximum value of 0.6133, and a mean value of 0.4798. In the MDS, the same values are 0.3680, 0.6256, and 0.4843, respectively. The correlation between the TDS and the MDS was significant (Figure 7), indicating that the MDS evaluation system has a good representation and can represent the TDS to assess the soil quality in the study area.
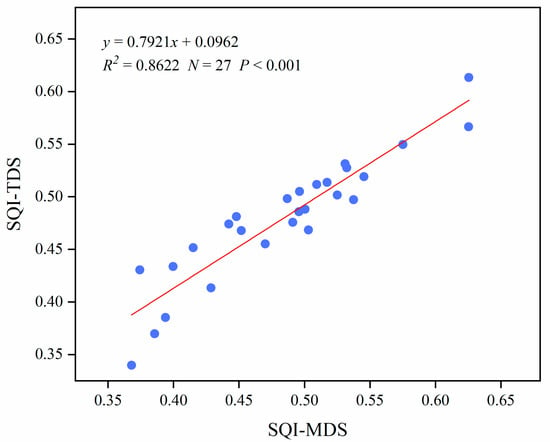
Figure 7.
Linear relationship of soil quality index (SQI)–minimum data set (MDS) to soil quality index (SQI)–total data set (TDS) in Biru County of Qinghai–Tibet Plateau, China.
4. Discussion
4.1. The Minimum Data Set
The SQI can be used to assess the impact of land use and management methods on soil quality because of its flexibility and manageability [31]. The construction of the MDS is an easy way to select and evaluate SQI. On the one hand, the MDS selects the most representative indicators from a large number of original soil properties as a way to reduce data redundancy. On the other hand, by analyzing the correlation between the commonality and characteristics of every indicator, the weight of each indicator can be generated and used to determine it’s importance. It can avoid human interference in the soil quality assessment process and reduce subjectivity. In this study, a total of nine potential properties were selected in the process of assessing soil quality. Several studies summarized that the soil quality evaluation indicators were frequently addressed during the construction of the MDS, and found that SOM was the most frequently addressed indicator. SOM is important in soil function as it is strongly related to processes, such as mineral transformation, microbial activity, and nitrogen cycling. Therefore, SOM is always included in the construction of the MDS in most of the soil quality evaluations, which coincides with our findings [59,60].
4.2. Soil Quality Index Analysis
As the ecosystem degrades, the loss of vegetation protection on the land surface leads to the loss of nutrients from the topsoil, which, in turn, reduces the soil quality. In this study, the contribution of SOM to SQI increased with the increasing vegetation coverage. This may be because SOM mainly comes from the residual secretions of plants and microorganisms, and the improvement in vegetation cover and apoptosis after the implementation of the fencing enclosure has caused an increase in the conversion of SOM [61]. SOM is important to soil fertility, aggregate stability, and nutrient effectiveness, and is an essential indicator reflecting soil function [62,63]. The increase in SOM after the implementation of the fencing enclosure indicates that the soil quality has improved, which in turn indicates that the influence of the fencing enclosure is positive. The quality of soil structure affects the operation of soil functions, including root growth, nutrient cycling, soil productivity, and biological activity [64,65]. In this study, the MDS included CP and NCP, indicating that the implementation of fencing enclosures had resulted in a change in soil structure, and this change is positive. This may be because, compared to the control area with low vegetation coverage, the vegetation coverage increases, the root activity in the project area increases, microbial activity is more frequent, the soil is no longer compacted, and the soil structure is better and more permeable. TK was mainly influenced by mineral types, and the role of TK was highlighted in the soil quality evaluation in low vegetation coverage, probably due to the reduced vegetation cover and accelerated ground weathering [66,67].
In the 0–10 cm range, the SQI significantly increased with the implementation years, indicating that implementing fencing enclosures could improve the soil quality in the surface soil, and the improvement effect was related to the fencing enclosure time. In terms of soil depth, the SQI of FE11 showed a trend to increase and then decrease with increasing soil depth. Conversely, the SQI of FE7 showed a decreasing tendency with increasing soil depth. Additionally, the SQI decreased significantly in the 20–30 cm depth range, which was different from the tendency in the surface soil. This observation may be due to the fact that the engineering area evolves for a longer period, with higher ecosystem stability, richer vegetation coverage and litter, and higher decomposition efficiency of microorganisms, enriching the surface nutrients. Furthermore, plant roots in the surface soil continue to absorb nutrients from the surface layer, resulting in less and less nutrients being able to migrate downward. The nutrient content decreased with depth, thus showing a decreasing tendency of SQI with the increase of soil depth [68,69].
4.3. Verification of the Minimum Data Set
The rationality of the MDS index selection will affect the precision of soil quality assessment, and, therefore, verification of the MDS is essential when assessing soil quality. In the research reported by Zhang et al. (2022), the R2 was approximately 0.50 [70], which indicated that the MDS could be used as a representation of TDS to evaluate soil quality. Liu et al. (2018) found an R2 of 0.895 [71], indicating that the MDS used to evaluate the SQI is reasonable in the Qinghai–Tibet Plateau. Our study verified the correlation between the TDS and the MDS and found that R2 was close to 0.86, and thus they were significantly correlated. This observation indicates that the properties filtered by the MDS can well take the place of the TDS to assess soil quality in this research.
4.4. The Impact of the Fencing Enclosure on Soil Properties
Fencing enclosure has influenced the soil physicochemical properties in the Biru County. The impact degree varies with the implementation years of the fencing enclosure and the depth of the soil layer. The improvement in soil water content was not significant in FE7 in the 0–20 cm soil depth range, while the improvement in soil water content was significant in FE11 in the same 0–20 cm range. The important influencing factor for these changes could be vegetation. Soil water content is determined by the combination of precipitation infiltration, water redistribution, water evaporation, and vegetation use, in which vegetation is an important part of the process [72]. Many studies have shown that vegetation roots are one of the factors affecting soil water content and that the two are closely related. The water consumed by plants will change with the heterogeneity of vegetation root distribution in the soil, and these changes will further lead to a certain regularity of soil water content and its distribution [73]. The soil organic matter content increased after the implementation of the fencing enclosure. This may be because soil organic matter mainly comes from the residue secretion of plants and microorganisms. The vegetation coverage and litter increased after implementing the fencing enclosure, resulting in an increase in the transformation of soil organic matter [61]. Overall, the improvement in the soil organic matter content in the 0–20 cm range was more obvious. This may be due to the vegetation coverage and litter in the soil surface layer being richer and microbial decomposition being more efficient, leading to an enrichment of nutrients at the surface [69]. In the 0–10 cm range, fencing enclosures increased the NCP and decreased the BD. A possible explanation for the increase in NCP and decrease in BD is that with the increase in vegetation coverage, the root activity in the project area increases, microbial activity is more frequent, the soil is no longer compacted, and the soil structure is more permeable. The distributions of TN were similar to SOM in different soil layers. A possible reason for the tendency might be that TN and SOM have a certain correlation (p < 0.01). FE7 significantly increased the AN. The reason for the increase in AN may be that the AN content depends on the soil organic matter content and the degree of maturation of the soil, and the soil with high organic matter content tends to maintain high levels of AN [74].
In the control plots, from 2010 to 2021, the species composition of the grassland was the same, and mainly included Gentiana straminea Maxim., Potentilla chinensis Ser. and Bryophyta, reflecting that the control plots from 2010 to 2021 are in degradation status and the degradation gradient is media-degradation [75]. After implementing the fencing enclosure, the species composition has gradually changed, especially the appearance of Kobresia pygmaea C. B. Clarke. Some studies found that Kobresia pygmaea C. B. Clarke could be used as a characterization of grassland degradation [76,77]. In FE11, an increasing proportion of Kobresia pygmaea C. B. Clarke was observed, indicating that the fencing grassland is gradually becoming healthy and the level of degradation is reducing.
5. Conclusions
This study analyzed the effect of the different fencing enclosure time lengths on soil quality in the Biru County of Qinghai–Tibet Plateau, China. Fencing enclosures improved the soil properties of SWC, NCP, SOM, TN, TP, and AN, and decreased BD, reflecting that fencing enclosure can improve soil quality. The improvements in soil quality caused by the fencing enclosure project gradually increased as the fencing enclosure time length increased in the surface soil. The SQI in the fencing enclosure area showed a certain regularity with the increase of soil depth, and the order of contributions of each soil index to the SQI was SOM > CP > NCP > TK. Additionally, the correlation between the MDS and the TDS was significant, and the constructed MDS could replace the TDS to complete the assessment of the soil quality of the fencing enclosure project. Collectively, our study verified the simplicity and accuracy of the constructed MDS, and the construction of the MDS should be focused on similar ecological engineering soil quality evaluation work in the future. Overall, this study provides ideas for further ecological engineering studies and acts as a scientific reference for related policy management in the Qinghai–Tibet Plateau, China.
Author Contributions
L.J., L.L. and C.X. performed conceptualization. L.J., L.L. and C.X. performed methodology. Z.W. performed software. Z.W. performed writing—original draft preparation. C.X., L.J., L.L., L.Y., W.S. and Z.G. performed writing—review and editing. All authors have read and agreed to the published version of the manuscript.
Funding
This work was supported by the National Natural Science Foundation of China (No. 42001262) and the Natural Science Foundation of Shandong Province of China (ZR2020QC173).
Data Availability Statement
Not applicable.
Acknowledgments
The authors thank the editors and the reviewers for their comments and constructive suggestions for improving this manuscript.
Conflicts of Interest
We declare that we have no known competing financial interest or personal relationships that could have appeared to influence the work reported in this paper.
References
- Sun, H.; Zheng, D.; Yao, T.; Zhang, Y. Protection and construction of the national ecological security shelter zone on Tibetan Plateau. Acta Geol. Sin. 2012, 67, 3–12. [Google Scholar]
- Hua, T.; Zhao, W.; Cherubini, F.; Hu, X.; Pereira, P. Sensitivity and future exposure of ecosystem services to climate change on the Tibetan Plateau of China. Landsc. Ecol. 2021, 36, 3451–3471. [Google Scholar] [CrossRef] [PubMed]
- Jiang, Y.; Song, H.; Lei, Y.; Korpelainen, H.; Li, C. Distinct co-occurrence patterns and driving forces of rare and abundant bacterial subcommunities following a glacial retreat in the eastern Tibetan Plateau. Biol. Fertil. Soils 2019, 55, 351–364. [Google Scholar] [CrossRef]
- Ren, Z.; Niu, D.; Ma, P.; Wang, Y.; Elser, J.J. C:N:P stoichiometry and nutrient limitation of stream biofilms impacted by grassland degradation on the Qinghai–Tibet Plateau. Biogeochemistry 2020, 150, 31–44. [Google Scholar] [CrossRef]
- Fu, B.; OuYang, Z.; Shi, P.; Fan, J.; Wang, X.; Zheng, H.; Zhao, W.; Wu, F. Current condition and protection strategies of Qinghai–Tibet Plateau ecological security barrier. Policy Manag. Res. 2021, 36, 1298–1306. [Google Scholar]
- Zhang, Y.; Fan, J.; Wang, S. Assessment of ecological carrying capacity and ecological security in China’s typical eco–engineering areas. Sustainability 2020, 12, 3293. [Google Scholar] [CrossRef]
- Guo, B.; Wang, J.; Liu, J.; Mantravadi, V.S.; Zhang, L.; Liu, G. Effect of climate and ecological restoration on vegetation changes in the “Three–River Headwaters” region based on remote sensing technology. Environ. Sci. Pollut. Res. 2022, 29, 16436–16448. [Google Scholar] [CrossRef] [PubMed]
- Zhang, H.; Fan, J.; Cao, W.; Zhong, H. Changes in multiple ecosystem services between 2000 and 2013 and their driving factors in the Grazing Withdrawal Program, China. Ecol. Eng. 2018, 116, 67–79. [Google Scholar] [CrossRef]
- Liu, Y.; Li, B.; Yuan, Y.; Qi, J.; Li, Y.; Li, R. Assessment of grazing exclusion on grassland restoration through the changes of plant community structure of alpine meadow in the Three River Headwater Region. Acta Ecol. Sin. 2021, 41, 7125–7137. [Google Scholar]
- Zhang, Y.; Fan, J.; Li, Y.; Xiang, X.; Zhang, H.; Wang, S. Effects of grassland reuse after short–term grazing exclusion of plant community. Acta Ecol. Sin. 2022, 43, 3295–3306. [Google Scholar]
- Wan, Q.; Wang, J.; Wang, X.; Liu, G.; Zhang, C. Effects of different meadow use types on the fractal characteristics of soil particle in the Qinghai–Tibet Plateau. Acta Ecol. Sin. 2022, 42, 1716–1726. [Google Scholar]
- Zhou, T.; Gao, J.; Wang, J.; Sun, J.; Xu, B.; Xue, J.; He, J.; Xie, Y.; Wu, Y. Effects of 7-year enclosure on an alpine meadow at the south-eastern margin of Tibetn Plateau based on community structure and soil physico-chemical properties. Acta Pratacult. Sin. 2018, 27, 1–11. [Google Scholar]
- Du, C.; Jing, J.; Shen, Y.; Liu, H. Short-term grazing exclusion improved topsoil conditions and plant characteristics in degraded alpine grasslands. Ecol. Indic. 2020, 108, 105680. [Google Scholar] [CrossRef]
- Li, Y.; Zhao, X.; Chen, Y.; Luo, Y.; Wang, S. Effects of grazing exclusion on carbon sequestration and the associated vegetation and soil characteristics at a semi–arid desertified sandy site in Inner Mongolia, northern China. Can. J. Soil Sci. 2015, 92, 807–819. [Google Scholar] [CrossRef]
- Rong, Y.; Yuan, F.; Ma, L. Effectiveness of exclosures for restoring soils and vegetation degraded by overgrazing in the Junggar Basin, China. Grassl. Sci. 2014, 60, 118–124. [Google Scholar] [CrossRef]
- Fan, Y.; Hou, X.; Shi, H.; Shi, S. Effects of grazing and fencing on carbon and nitrogen reserves in plants and soils of alpine meadow in the three headwater resource regions. Russ. J. Ecol. 2013, 44, 80–88. [Google Scholar] [CrossRef]
- Sun, J.; Ma, B.; Lu, X. Grazing enhances soil nutrient effects: Trade-offs between aboveground and belowground biomass in alpine grasslands of the Tibetan Plateau. Land Degrad. Dev. 2018, 29, 337–348. [Google Scholar] [CrossRef]
- Wang, Y.; Long, R.; Deng, B.; Ren, G.; Xin, G.; Ding, L.; Shang, Z.; Liu, Z. The effect of three years of fencing enclosure on soil seed banks and the relationship with above-ground vegetation of degraded alpine grasslands of the Tibetan plateau. Plant Soil. 2013, 364, 229–244. [Google Scholar]
- Fenetahun, Y.; You, Y.; Xu, X.; Wang, Y. Effects of grazing enclosures on species diversity, phenology, biomass, and carrying capacity in Borana Rangeland, Southern Ethiopia. Front. Ecol. Evol. 2021, 8, 623–627. [Google Scholar] [CrossRef]
- Wei, X.; Yan, C. Grassland dynamics and the driving factors based on net primary productivity in Qinghai province, China. ISPRS Int. J. Geo-Inf. 2019, 8, 73. [Google Scholar]
- Wang, T.; Zhang, Z.; Li, Z.; Li, P. Grazing management affects plant diversity and soil properties in a temperate steppe in northern China. Catena 2017, 158, 141–147. [Google Scholar] [CrossRef]
- Chen, B.; Zhang, X.; Tao, J.; Wu, J. The impact of climate change and anthropogenic activities on alpine grassland over the Qinghai–Tibet Plateau. Agric. For. Meteorol. 2014, 189–190, 11–18. [Google Scholar] [CrossRef]
- Løvschal, M.; Gravesen, M.L. De-/Fencing grasslands: Ongoing boundary making and unmaking in postcolonial Kenya. Land 2021, 10, 786. [Google Scholar] [CrossRef]
- Xu, L.; Nie, Y.; Chen, B.; Xin, X.; Yang, G.; Xu, D.; Ye, L. Effects of fence enclosure on vegetation community characteristics and productivity of a degraded temperate meadow steppe in northern China. Appl. Sci. 2020, 10, 2952. [Google Scholar] [CrossRef]
- Wen, L.; Zhen, L.; Wang, J.; Shi, S.; Cao, W. Six years of grazing exclusion is the optimum duration in the alpine meadow–steppe of the north-eastern Qinghai–Tibetan Plateau. Sci. Rep. 2018, 8, 17269. [Google Scholar]
- Sun, J.; Liang, E.; Barrio, I.C.; Chen, J.; Fu, B. Fences undermine biodiversity targets. Science 2021, 374, 269. [Google Scholar] [CrossRef] [PubMed]
- Hao, L.; Sun, J.; Liu, Y.; Gao, Z.; He, J. Effects of precipitation on grassland ecosystem restoration under grazing exclusion in Inner Mongolia, China. Landsc. Ecol. 2014, 29, 1657–1673. [Google Scholar] [CrossRef]
- Liu, J.; Wu, J.; Su, H.; Gao, Z.; Wu, Z. Effects of grazing exclusion in Xilin Gol grassland differ between regions. Ecol. Eng. 2017, 99, 271–281. [Google Scholar] [CrossRef]
- Garcia-Palacios, P.; Maestre, F.T.; Kattge, J.; Wall, D.H. Climate and litter quality differently modulate the effects of soil fauna on litter decomposition across biomes. Ecol. Lett. 2013, 16, 1045–1053. [Google Scholar] [CrossRef]
- Yu, Y.; Zheng, L.; Zhou, Y.; Sang, W.; Zhao, J.; Liu, L.; Li, C.; Xiao, C. Changes in soil microbial community structure and function following degradation in a temperate grassland. J. Plant Ecol. 2021, 14, 384–397. [Google Scholar] [CrossRef]
- Du, S.; Bai, G.; Yu, J. Soil properties and apricot growth under intercropping and mulching with erect milk vetch in the loess hilly-gully region. Plant Soil. 2014, 390, 431–442. [Google Scholar] [CrossRef]
- Nabiollahi, K.; Golmohamadi, F.; Taghizadeh–Mehrjardi, R.; Kerry, R.; Davari, M. Assessing the effects of slope gradient and land use change on soil quality degradation through digital mapping of soil quality indices and soil loss rate. Geoderma 2018, 318, 16–28. [Google Scholar] [CrossRef]
- Horel, Á.; Tóth, E.; Gelybó, G.; Kása, I.; Bakacsi, Z.; Farkas, C. Effects of land use and management on soil hydraulic properties. Open Geosci. 2015, 7, 742–754. [Google Scholar] [CrossRef]
- Marzaioli, R.; D’Ascoli, R.; De Pascale, R.A.; Rutigliano, F.A. Soil quality in a Mediterranean area of southern Italy as related to different land use types. Appl. Soil Ecol. 2010, 44, 205–212. [Google Scholar] [CrossRef]
- Salomé, C.; Coll, P.; Lardo, E.; Metay, A. The soil quality concept as a framework to assess management practices in vulnerable agroecosystems: A case study in Mediterranean vineyards. Ecol. Indic. 2016, 61, 456–465. [Google Scholar] [CrossRef]
- Chaer, G.M.; Myrold, D.D.; Bottomley, P.J. A soil quality index based on the equilibrium between soil organic matter and biochemical properties of undisturbed coniferous forest soils of the Pacific Northwest. Soil Biol. Biochem. 2009, 41, 822–830. [Google Scholar] [CrossRef]
- Obade, V.P.; Lal, R. A standardized soil quality index for diverse field conditions. Sci. Total Environ. 2016, 541, 424–434. [Google Scholar] [CrossRef]
- De Laurentiis, V.; Secchi, M.; Bos, U.; Horn, R.; Laurent, A.; Sala, S. Soil quality index: Exploring options for a comprehensive assessment of land use impacts in LCA. J. Clean. Prod. 2019, 215, 63–74. [Google Scholar] [CrossRef]
- Dengiz, O. Soil quality index for paddy fields based on standard scoring functions and weight allocation method. Arch. Agron. Soil Sci. 2019, 66, 301–315. [Google Scholar] [CrossRef]
- Paz-Kagan, T.; Shachak, M.; Zaady, E.; Karnieli, A. Evaluation of ecosystem responses to land–use change using soil quality and primary productivity in a semi-arid area, Israel. Agr. Ecosyst. Environ. 2014, 193, 9–24. [Google Scholar] [CrossRef]
- Hemati, Z.; Selvalakshmi, S.; Xia, S.; Yang, X. Identification of indicators: Monitoring the impacts of rubber plantations on soil quality in Xishuangbanna, Southwest China. Ecol. Indic. 2020, 116, 106491. [Google Scholar] [CrossRef]
- Larson, W.E.; Pierce, F.J. Conservation and enhancement of soil quality. In Evaluation for Sustainable Land Management in the Developing World, Proceedings of the International Workshop on Evaluation for Sustainable Land Management in the Developing World, Chiang Rai, Thailand, 15–21 September 1991; International Board for Soil Research and Management: Bangkok, Thailand, 1991. [Google Scholar]
- Yang, Q.; Pu, H.; Zhao, X.; Wang, Z.; Cheng, H.; Dong, R.; Chen, Y.; Jin, B. Comparison of different plant cover investigation methods for three artificial grasslands. Chin. J. Appl. Environ. Biol. 2021, 27, 220–227. [Google Scholar]
- Jin, C.N. Measurement of compaction degree of aeolian sand roadbed formed by dry compaction with immersion plus Cutting Ring Method. In Proceedings of the International Conference on Equine Exercise Physiology 2017, Guilin, China, 23–24 June 2012. [Google Scholar]
- Xu, X.; Cui, Z.; Huang, H.; Wang, H.; Hou, Y.; Wang, Y.; Yin, H. Contrastive analysis on soil moisture data between FDR and Drying methods. J. Shandong Agric. Univ. 2013, 44, 190–192. [Google Scholar]
- Huang, R. Analysis of test method for organic matter content of soil –potassium dichromate method and loss on ignition method. China Plant Eng. 2022, 7, 86–88. [Google Scholar]
- Liu, Z.; Cai, X.; Wen, T.; Zhao, C.; Sun, W. Determination of total nitrogen in soil by graphite digester-Kjeldahl method. Chem. Anal. Meterage 2022, 31, 55–58. [Google Scholar]
- Syers, J.K.; Williams, J.D.; Walker, T.W. The determination of total phosphorus in soils and parent materials. N. Z. J. Agric. Res. 2012, 11, 757–762. [Google Scholar] [CrossRef]
- Du, X.; Yang, M.; Yu, L.; Peng, Y. Rapid determination of total potassium in soil by microwave alkaline digestion. Yunnan Chem. Technol. 2022, 49, 85–87. [Google Scholar]
- Du, E.; Xia, N.; Tang, Y.; Guo, Z.; Guo, Y.; Wang, Y.; Vries, W.D. Anthropogenic and climatic shaping of soil nitrogen properties across urban-rural-natural forests in the Beijing metropolitan region. Geoderma 2022, 406, 115524. [Google Scholar] [CrossRef]
- Li, X.; Zhu, W.; Shu, S.; Sheng, Z.; Wang, W. Soil quality assessment of grassland in dry and warm valley of Dadu River based on principal component analysis. Acta Ecol. Sin. 2021, 41, 3891–3900. [Google Scholar]
- Li, F.; Zhang, X.; Zhao, Y.; Song, M.; Liang, J. Soil quality assessment of reclaimed land in the urban-rural fringe. Catena 2023, 220, 106692. [Google Scholar] [CrossRef]
- Zhang, Y.; Xu, X.; Li, Z.; Liu, M.; Xu, C.; Zhang, R.; Luo, W. Effects of vegetation restoration on soil quality in degraded karst landscapes of southwest China. Sci. Total Environ. 2019, 650, 2657–2665. [Google Scholar] [CrossRef] [PubMed]
- Volchko, Y.; Norrman, J.; Rosen, L.; Bergknut, M.; Josefsson, S.; Soderqvist, T.; Norberg, T.; Wiberg, K.; Tysklind, M. Using soil function evaluation in multi–criteria decision analysis for sustainability appraisal of remediation alternatives. Sci. Total Environ. 2014, 485–486, 785–791. [Google Scholar] [CrossRef] [PubMed]
- Karaca, S.; Dengiz, O.; Turan, I.D.; Özkan, B.; Dedeoğlu, M.; Gülser, F.; Sargin, B.; Demirkaya, S.; Ay, A. An assessment of pasture soils quality based on multi–indicator weighting approaches in semi–arid ecosystem. Ecol. Indic. 2021, 121, 107001. [Google Scholar] [CrossRef]
- Vasu, D.; Singh, S.K.; Ray, S.K.; Duraisami, V.P.; Tiwary, P.; Chandran, P.; Nimkar, A.M.; Anantwar, S.G. Soil quality index (SQI) as a tool to evaluate crop productivity in semi-arid Deccan plateau, India. Geoderma 2016, 282, 70–79. [Google Scholar] [CrossRef]
- Askari, M.S.; Holden, N.M. Indices for quantitative evaluation of soil quality under grassland management. Geoderma 2014, 230, 131–142. [Google Scholar] [CrossRef]
- Qiao, Y.; Zhong, X.; Miao, S. Evaluation indicators of soil quality in plough layer of aeolian sandy land in northeast China based on minimum data set. J. Soil Water Conserv. 2019, 26, 132–138. [Google Scholar]
- Bünemann, E.K.; Bongiorno, G.; Bai, Z.; Creamer, R.E. Soil quality—A critical review. Soil Biol Biochem. 2018, 120, 105–125. [Google Scholar] [CrossRef]
- Zhang, Y.; Xu, X.; Li, Z.; Xu, C.; Luo, W. Improvements in soil quality with vegetation succession in subtropical China karst. Sci. Total Environ. 2021, 775, 145876. [Google Scholar] [CrossRef]
- Cotrufo, M.F.; Soong, J.L.; Horton, A.J.; Campbell, E.E.; Haddix, M.L.; Wall, D.H.; Parton, W.J. Formation of soil organic matter via biochemical and physical pathways of litter mass loss. Nat. Geosci. 2015, 8, 776–779. [Google Scholar] [CrossRef]
- Pojasok, T. Assessment of a combination of wet sieving and turbidimetry to characterize the structural stability of moist aggregates. Can. J. Soil Sci. 1989, 70, 33–42. [Google Scholar] [CrossRef]
- Yao, R.; Yang, J.; Zhang, T.; Gao, P.; Yu, S.; Wang, X. Short-term effect of cultivation and crop rotation systems on soil quality indicators in a coastal newly reclaimed farming area. J. Soils Sediments 2013, 13, 1335–1350. [Google Scholar] [CrossRef]
- Ball, B.C. Field assessment of soil structural quality—A development of the Peerlkamp test. Soil Use Manag. 2007, 23, 329–337. [Google Scholar] [CrossRef]
- Guimarães, R.M.L.; Ball, B.C.; Tormena, C.A. Improvements in the visual evaluation of soil structure. Soil Use Manag. 2011, 27, 395–403. [Google Scholar] [CrossRef]
- Masto, R.E.; Chhonkar, P.K.; Singh, D.; Patra, A.K. Alternative soil quality indices for evaluating the effect of intensive cropping, fertilisation and manuring for 31 years in the semi–arid soils of India. Environ. Monit. Assess. 2008, 136, 419–435. [Google Scholar] [CrossRef] [PubMed]
- Li, P.; Zhang, T.; Wang, X.; Yu, D. Development of biological soil quality indicator system for subtropical China. Soil Till Res. 2013, 126, 112–118. [Google Scholar] [CrossRef]
- Wang, Y.; Sun, J.; Liu, Z.; Qiao, Y.; Zhang, X. Soil fertility quality assessment of Magnolia officinalis communities in Qinba mountains. Acta Ecol. Sin. 2015, 36, 5133–5141. [Google Scholar]
- Wang, H.; Li, J.; Zheng, W. Soil stoichiometric characteristics in the timberline ecotone of Abies georgei var. smithii forest in Sejila Mountain. J. West China For. Sci. 2022, 51, 161–168. [Google Scholar]
- Zhang, Z.; Han, J.; Yin, H.; Xue, J.; Jia, L.; Zhen, X.; Chang, J.; Wang, S.; Yu, B. Assessing the effects of different long-term ecological engineering enclosures on soil quality in an alpine desert grassland area. Ecol. Indic. 2022, 143, 109426. [Google Scholar] [CrossRef]
- Liu, X.; Wang, Y.; Lv, M.; Sun, Y.; Yang, W.; Zhao, J. Soil quality assessment of alpine grassland in permafrost regions of Tibetan Plateau based on principal component analysis. J. Glaciol. Geocryol. 2018, 40, 469–479. [Google Scholar]
- Ran, W.; Xie, Y.; Hao, M. Study on change of soil water in orchards of different planting–life in gully region of Loess Plateau. Acta Agr. Boreali-Occident. Sin. 2008, 17, 229–233. [Google Scholar]
- Zhu, W.; Niu, J.; Liu, G.; Liang, H. The influence of vegetation types on the soil moistures during growing season in Loess area. J. Arid Land Resour. Environ. 2016, 30, 152–156. [Google Scholar]
- Zhu, Z.; Zhu, T.; Yang, L.; Luo, L.; Xie, Y. The spatial relationship between soil alkeline–nitrogen content and environmental factors in China. Ecol. Environ. Sci. 2019, 28, 2199–2207. [Google Scholar]
- Ren, J.; Xu, G.; Li, X.; Lin, H.; Tang, Z. Trajectory and prospect of China’s prataculture. Chin. Sci. Bull. 2016, 61, 178–192. (In Chinese) [Google Scholar]
- Lin, L.; Li, B.; Fan, B.; Lan, Y.; Si, M. Response and adaptation of plant community in alpine Kobresia meadow to different grazing intensities. Chin. J. Grassl. 2022, 44, 19–30. [Google Scholar]
- Lin, L.; Li, Y.; Zhang, F.; Du, Y.; Guo, X.; Li, J.; Liu, S.; Cao, G. Soil nitrogen and phosphorus stoichiometry in a degradation series of Kobresia humulis meadows in the Tibetan Plateau. Acta Ecol. Sin. 2013, 33, 5245–5251. [Google Scholar] [CrossRef]


Disclaimer/Publisher’s Note: The statements, opinions and data contained in all publications are solely those of the individual author(s) and contributor(s) and not of MDPI and/or the editor(s). MDPI and/or the editor(s) disclaim responsibility for any injury to people or property resulting from any ideas, methods, instructions or products referred to in the content. |
© 2023 by the authors. Licensee MDPI, Basel, Switzerland. This article is an open access article distributed under the terms and conditions of the Creative Commons Attribution (CC BY) license (https://creativecommons.org/licenses/by/4.0/).