Article

Transcriptome Revealed the Effect of Shading on the Photosynthetic Pigment and Photosynthesis of Overwintering Tea Leaves

1
Tea Research Institute, Qingdao Agricultural University, Qingdao 266109, China
2
Tea Research Institute, Shandong Academy of Agricultural Sciences, Jinan 250100, China
3
Tea Research Institute, Rizhao Academy of Agricultural Sciences, Rizhao 276800, China
*
Authors to whom correspondence should be addressed.
Agronomy 2023, 13(7), 1701; https://doi.org/10.3390/agronomy13071701
Submission received: 19 May 2023 / Revised: 15 June 2023 / Accepted: 24 June 2023 / Published: 25 June 2023
(This article belongs to the Special Issue Advances in Tea Agronomy: From Yield to Quality — Volume II)

Abstract

:
The physiological state of overwintering tea leaves is crucial for the growth and quality formation of spring tea shoots. Low temperatures in winter can easily cause damage to overwintering tea plants, leading to leaf chlorosis and abnormal physiological functions. Many pieces of research have shown that shading could promote chlorophyll (Chl) accumulation in tea leaves, but the impact on overwintering tea plants is not yet known. In this study, different shading rates (no-shading, S0%; 30% shading, S30%; 75% shading, S75%) were used to treat overwintering tea plants, which explored the effect of shading on the color and physiological functions of tea leaves. The results showed that Chl, carotenoid, and soluble sugar (SS) contents were S75% > S30% > S0%, and the net photosynthetic rate (Pn) was S75% > S30% > S0%. Transcriptome analysis showed that the genes involved in chlorophyll and carotenoid metabolism (such as protochlorophyllide reductase POR and zeaxanthin epoxidase ZEP) and photosynthesis (such as photosystem II P680 reaction center D2 protein PsbA and photosystem II CP47 chlorophyll apoprotein PsbB) were significantly up-regulated under shading. In addition, many differentially expressed genes (DEGs) were enriched in “starch and sucrose metabolism (ko00500)” and “anthocyanin biosynthesis (ko00942)” pathways. In summary, this study provided a theoretical basis and technical support for maintaining green leaves and normal physiological functions of overwintering tea plants.

1. Introduction

Tea (Camellia sinensis (L.) O. Kuntze) is native to subtropical regions and has gradually developed ecological habits of “liking warmth but afraid of cold” and “liking light but afraid of the sun” through long-term systematic development. The winter temperature is relatively low in the tea regions of northern China. This may cause irreversible damage to tea leaves, leading to chlorosis, redness, or browning, which is not conducive to the growth and development of tea plants and tea picking in the following spring. In conclusion, low temperatures can reduce tea yield and quality and seriously affect the economic benefits of the tea industry. Therefore, a simple and efficient method is needed to keep the leaves of tea plants green during overwintering.
Environmental temperature not only affects the growth and development of plants but also affects their physiological metabolism. Studies have shown that low temperatures could reduce the content of carotenoid and chlorophyll in tea plants, affect the normal physiological activities of tea plants, and reduce the tea quality [1]. Meanwhile, Tian et al. (2023) showed that under low-temperature stress, the chlorophyll content of tea leaves decreased [2]. In addition, continuous low temperatures could cause damage to tea plants, leading to a decrease in soluble sugar content [3].
Plant photosynthesis is greatly influenced by temperature. Under low-temperature stress, the net photosynthetic rate (Pn) and Fv/Fm value of tea plants decrease with the extension of stress time; this seriously reduces the tea quality [4]. The Fv/Fm and Pn were measured in summer, autumn, and winter. Fv/Fm showed the highest performance in summer and the lowest in winter, and Pn was also the same, which seriously affected the growth and development of tea plants [5].
Shading, as a traditional agricultural method, has been popularly used in China, Japan, and other tea-producing countries. Studies have shown that shading could promote a large chlorophyll accumulation of tea leaves, which might be achieved by up-regulating the expression of CsPORL-2 [6]. Sano et al. showed (2018) that under normal growth temperatures, the chlorophyll content and SPAD value of tea plants were enhanced under shading [7]. Long-term shading (14 d, 90% shading rate) could promote the expression of genes related to the synthesis, such as CsPSY, and further boost the accumulation of carotenoids in tea plants [8]. This indicated that shading could regulate the synthesis of photosynthetic pigments in tea leaves. However, these studies mostly focus on normal growth temperature conditions, and it is not yet clear whether shading can regulate the synthesis of photosynthetic pigments in leaves under low-temperature conditions in winter.
Therefore, in this study, different shading rates were used to treat overwintering tea plants. Pigment content, photosynthetic parameters, and soluble sugar content were determined. In addition, transcriptome sequencing was combined to analyze the expressions of genes related to chlorophyll and carotenoid synthesis pathway, photosynthesis pathway, and sugar metabolism pathway. This study will provide a theoretical basis and technical support for the overwintering protection of tea plants.

2. Materials and Methods

2.1. Plant Materials and Shading Treatment

This study was conducted from November 2021 to April 2022 at the Rizhao Tea Research Institute (Rizhao, Shandong, China, 35°51′ N, 119°66′ E). Taking “Zhongcha 102” 5-year-old tea plants as the experimental material, the study was carried out under different shading conditions. In this study, two kinds of shading (shading 30%, S30% and shading 75%, S75%) and no-shading (control, S0%) were carried out with three treatments using black shading nets. The environmental parameters for tea plant growth are shown in Supplementary Materials (Figure S1). In April 2022, tea leaves were sampled under different treatment conditions, immediately put into liquid nitrogen, and then stored in a −80 °C ultralow-temperature refrigerator for RNA sequencing and physiological and biochemical parameters. Each treatment of transcriptome had three biological replicates, and the physiological and biochemical parameters had six replicates. On the day of sampling, the light intensity under different treatments was measured (Table 1).

2.2. Determination of the Physiological Biochemistry Indexes of the Tea Plant

2.2.1. Determination of Fv/Fm

Tea leaves were fully dark-adapted for 20 min by using dark-adaptation clamps and then using the FP110-LM/D instrument (PS I, Drásov, Czech Republic) to measure the maximum photochemical quantum yield of PS II (Fv/Fm) value of tea leaves. Each treatment had six replicates.

2.2.2. Determination of Chlorophyll and Carotenoid Content

The determination of the pigment content of the leaves was carried out by extraction with a mixture of acetone, absolute ethanol, and water at a ratio of 4.5:4.5:1. The amount of 0.1 g of tea plant leaves was weighed under each treatment, and then cut into pieces; 10 mL of the mixed solution was added, and it was extracted in a dark place until the leaves were completely white (about 12 h); the sample was shaken for the 30 s every 2 h. Taking the mixed solution as a control, the supernatant was taken to measure the absorbance value at 663, 645, and 470 nm and calculated the content of chlorophyll a (Chla), b (Chlb), total chlorophyll (Chl), and carotenoid. Each treatment had six replicates. The chlorophyll formula is as follows:
Ca = 12.72 ∗ A663 − 2.59 ∗ A645
Cb = 22.88 ∗ A645 − 4.67 ∗ A663
Ct = 20.29 ∗ A645 + 8.05 ∗ A663
Cc = (1000 ∗ A470 − 3.27 ∗ Ca − 104 ∗ Cb)/229
Chloroplast pigment content(mg/g) = (C ∗ V ∗ N)/W/1000
C: pigment content mg/L, V: volume of extract mL 10, N: dilution ratio 1, W: sample quality g.

2.2.3. Determination of Photosynthetic Parameters

From 9:00 a.m. to 12:00 a.m., the net photosynthetic rate (Pn), stomatal conductance (Gs), intercellular CO2 concentration (Ci), and transpiration rate (Tr) of tea leaves were measured by the portable photosynthesis measurement system (ciras-3, USA). Each treatment had six replicates.

2.2.4. Determination of Soluble Sugar (SS) Content

The SS content of tea plants under different shading was determined with the kit of Suzhou Grace Biotechnology Co., Ltd. (Suzhou, China). Each treatment had six replicates; the following instructions were applied:
Weigh 0.1 g of tea leaves stored at −80 °C, add 0.8 mL of 80% ethanol, homogenize in an ice bath, pour into a centrifuge tube, and then rinse the mortar with 80% ethanol and transfer to a centrifuge tube to a constant volume of 1.5 mL. Place in a 50 °C water bath for 20 min. After cooling, centrifuge at 12,000 rpm for 10 min at room temperature and take the supernatant for backup.
Measuring tube: take 2.5 μL sample solution and add 97.5 μL distilled water, 30 μL working fluid, and 250 μL concentrated sulfuric acid. Blank tube: add 100 μL distilled water, 30 μL working fluid, and 250 μL concentrated sulfuric acid. After mixing well, place in a 100 °C water bath for 10 min. After cooling to room temperature, transfer 200 μL to the 96-well conveyor, and when encountering 620 nm, read the absorbance value A. ΔA = A measurement tube—A blank tube.
The calculation formula for soluble sugar (mg/g) is as follows:
0.718 ∗ (ΔA + 0.0103)/W ∗ D
W: sample quality g; D: self dilution ratio, 10.

2.3. RNA Extraction and Library Construction

Tea leaves that were stored at −80 °C were taken out, and RNAprep Pure Plant Kit (Tiangen, China) was used to extract total RNA from tea leaves under different treatments, with three biological replicates per treatment. Then, sequencing libraries were generated using Illumina’s NEBNext®UltraTM RNA Library Prep Kit (Illumina, San Diego, CA, USA). Finally, Agilent 2100 Bioanalyzer (Agilent Technologies, Santa Clara, CA, USA) was used to detect the insert size of the library, and PCR was used to accurately quantify the effective concentration of the library to ensure its quality. After qualification, Illumina sequencing was performed.

2.4. Transcriptome Analysis

Transcriptome analysis was conducted by Wuhan Metware Biotechnology Co., Ltd. (Wuhan, China). Fastp v 0.19.3 was used to filter the original data, mainly to remove reads with adapters. When the N content in any of the sequencing reads exceeds 10% of the base number of the reads or the number of low-quality (Q ≤ 20) bases contained in reads exceeds 50% of the bases of the reads, the paired reads were removed. Clean reads were used for subsequent analysis. HISAT v2.1.0 was used to construct the index and compare clean reads to the reference genome Camellia sinensis ‘Shuchazao’ (CSS_ChrLev, http://tpia.teaplant.org/download.htm, 6 June 2022).

2.5. Identification of Differentially Expressed Genes (DEGs)

FeatureCounts v1.6.2 /StringTie v1.3.4d was used to calculate the gene alignment and FPKM. DESeq2 v1.22.1/edgeR v3.24.3 was used to analyze the differential expression between the two groups, and the p-value was corrected using the Benjamini & Hochberg method. The corrected p-value and|log2 foldchange|are used as the threshold for significant differential expression.

2.6. Annotation of Gene Function

The sequence of the new gene was extracted from the genome and diamond was used to compare the new gene with the sequence of KEGG, GO, NR, Swiss-Prot, TrEMBL, and KOG databases to obtain the annotation result. The alignment condition was Evaluate 1 × 10⁻⁵. The plant transcription factor prediction was conducted using iTAK software, which integrated two databases, PlnTFDB and PlantTFDB.

2.7. Quantitative Real-Time PCR (qRT-PCR) Verification

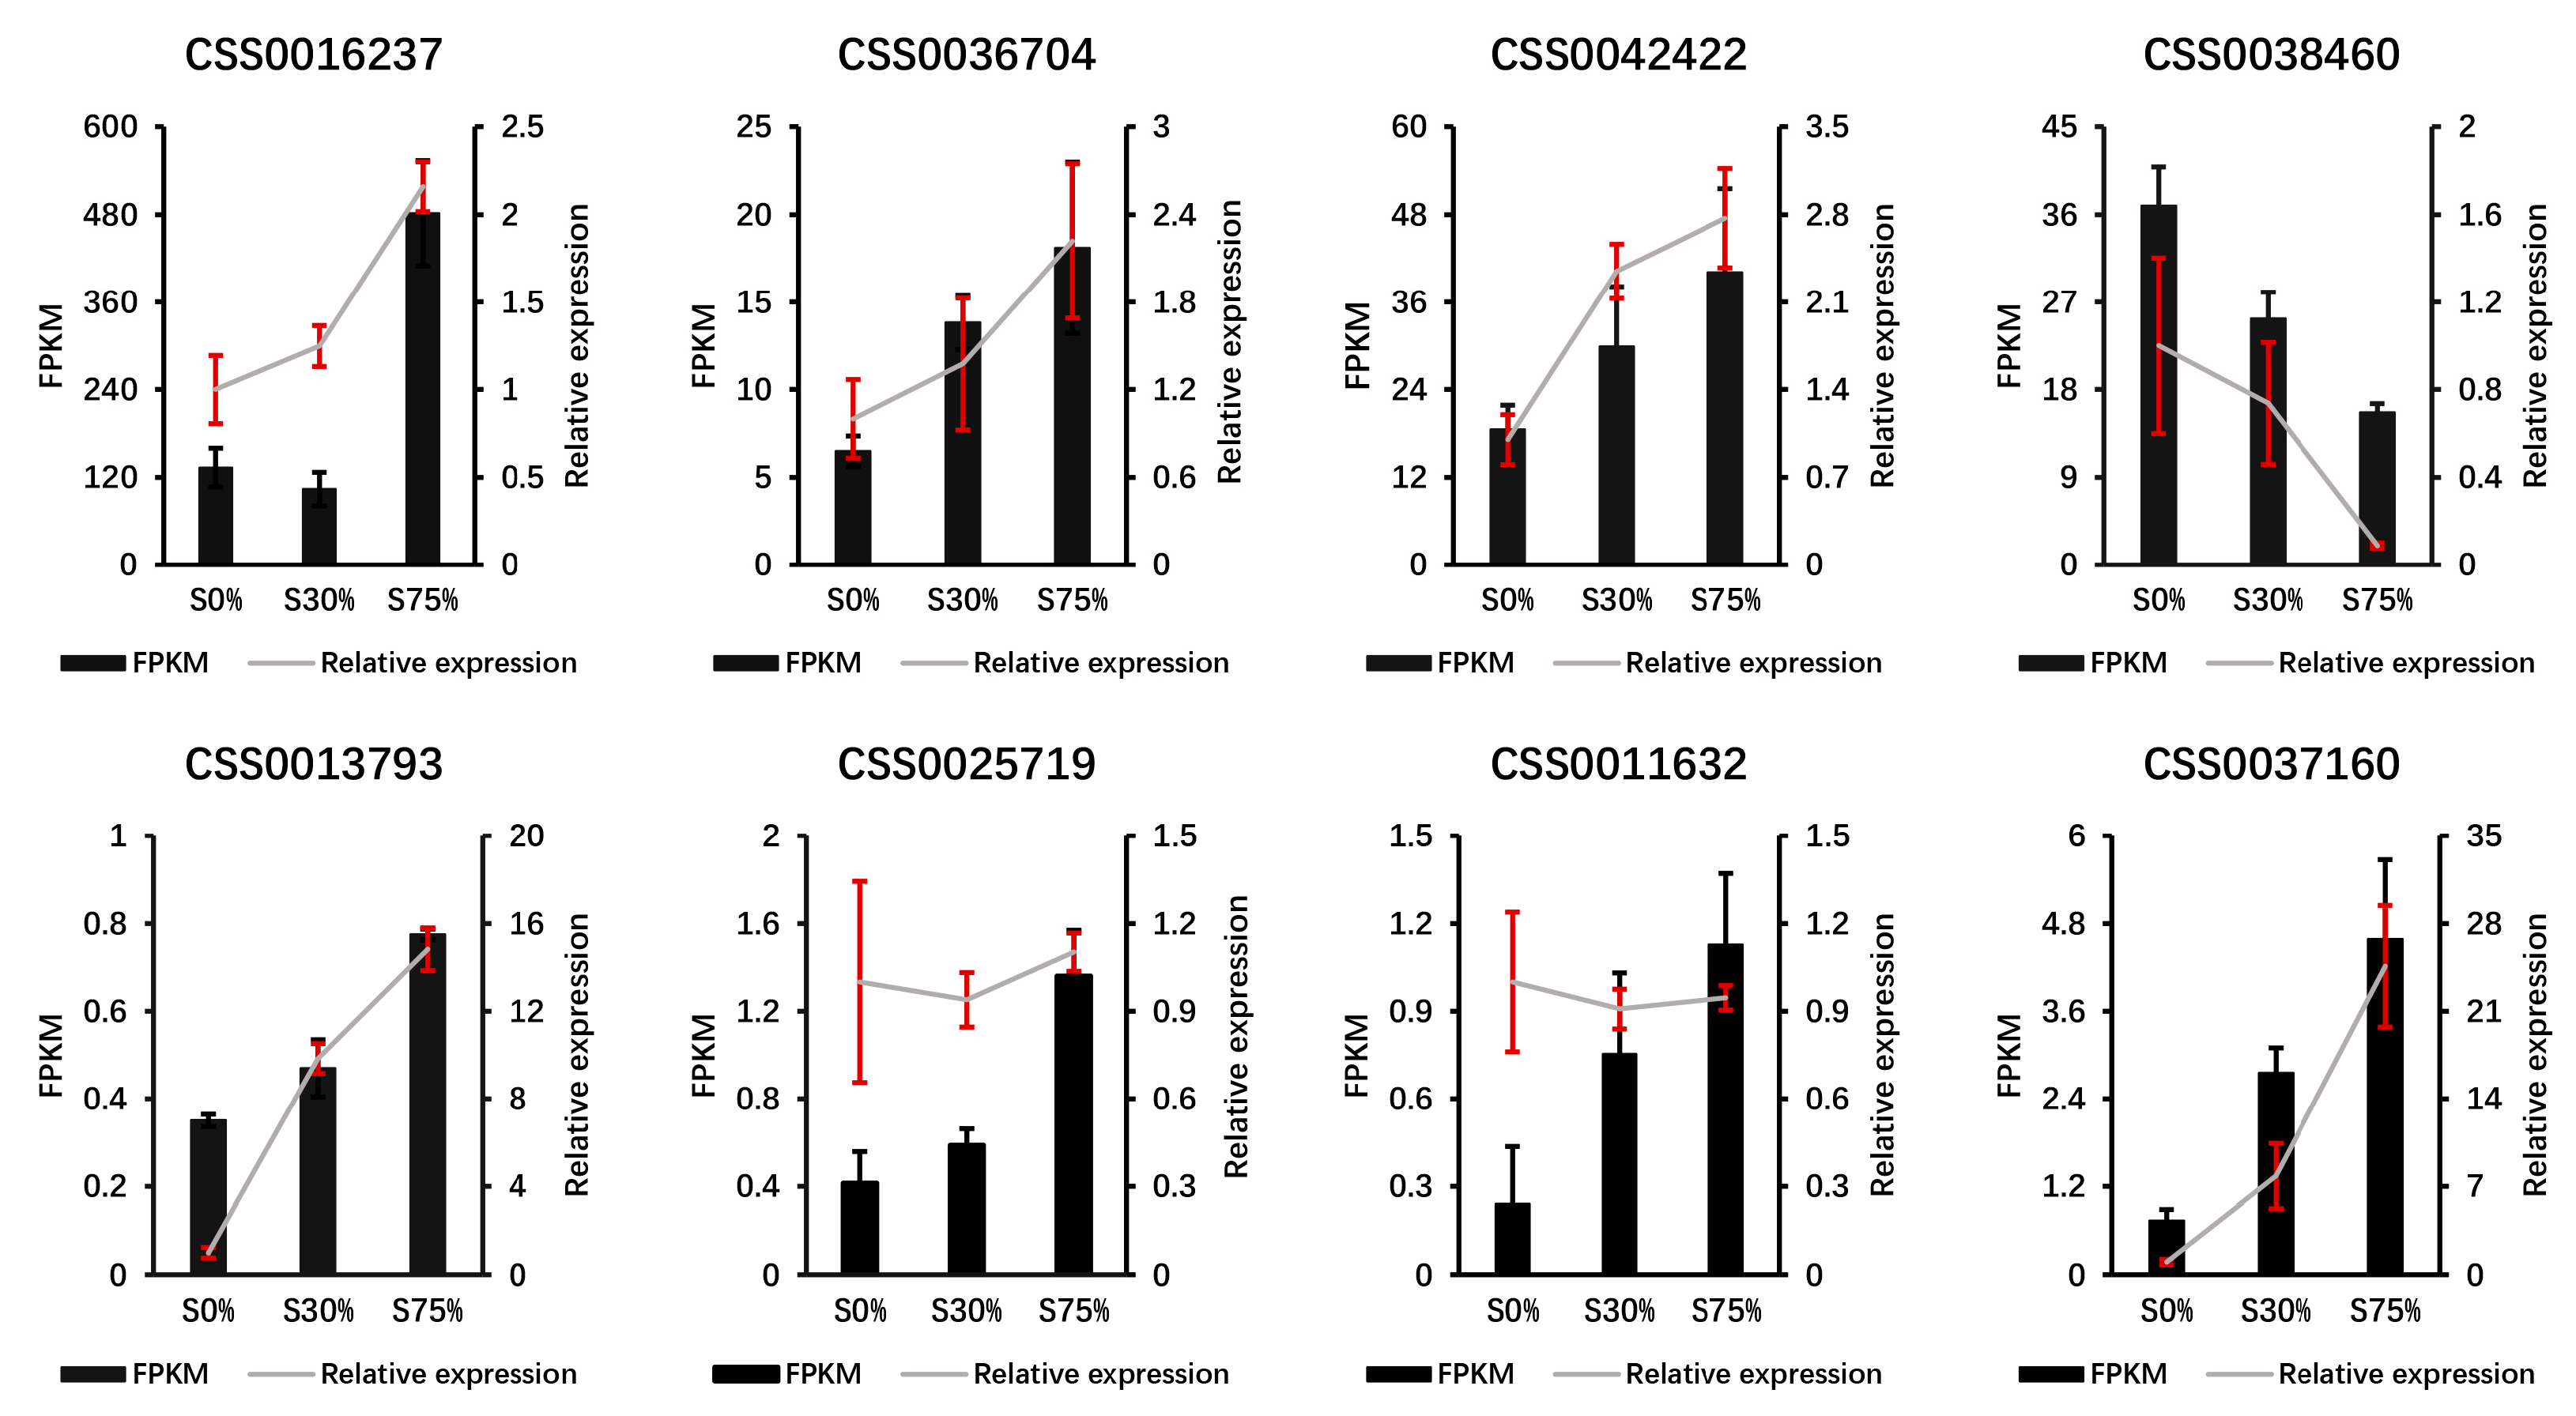
To prove the reliability of transcriptome data, eight DEGs were used for the validation of the expression level. Primer Premier 5.0 was used to design primers, and the primer sequence was shown in Table S1. qRT-PCR was performed using 2 × SYBR® Green premixed solution (DF, China) on an Analytik Jena-qTOWER2.2 fluorescence quantitative PCR instrument (Analytik Jena Life Science, Jena, Germany). Three biological replicates were analyzed. Glyceraldehyde 3-phosphate dehydrogenase (CsGAPDH) gene was used as a reference gene, and the relative expression level of genes was calculated by 2−ΔΔCt.

2.8. Statistical Analysis

Statistical analysis was conducted using one-way analysis of variance (ANOVA) and Duncan’s multiple intervals were determined with SPSS 18.0 software (SPSS Inc., Chicago, IL, USA). The differences were considered statistically significant when the p-value < 0.05. The graphics were created with the use of Adobe Photoshop 2020 and GraphPad Prism 8.0.2.

3. Results

3.1. Effects of Different Shading Rates on the Chlorophyll and Carotenoid Contents of Overwintering Tea Leaves

The leaf phenotypes of tea plants with different treatments are shown in Figure 1A. Tea leaves were seriously damaged and showed signs of browning and withering under S0%; tea leaves were slightly damaged and slightly yellow under S30%; and tea leaves were undamaged and had the greenest leaves under S75%, indicating that shading could maintain the green color of overwintering tea leaves.
In order to understand the effect of shading on the pigment content of tea leaves, Chl and carotenoid contents were measured. The results showed that the total Chl, Chla, and Chlb contents were S75% > S30% > S0% (Figure 1B–D). The ratio of Chla to Chlb (Chla/Chlb) was S30% > S0% > S75%, with no significant difference (Figure S2A). Carotenoid content was S75% > S30% > S0% (Figure 1E). In addition, the ratio of chlorophyll to carotenoid (Chl/carotenoid) was S75% > S30% > S0% (Figure S2B).

3.2. Effects of Different Shading Rates on Photosynthesis and Sugar Accumulation of Overwintering Tea Leaves

To understand the differences in photosynthesis of overwintering tea plants under different shading conditions, the Fv/Fm, Pn, Ci, Gs, and Tr values were measured. The results showed that Fv/Fm, Pn, Gs, and Tr were S75% > S30% > S0% (Figure 2A–D); Ci was S30% > S75% > S0% (Figure 2E).
In order to understand the effect of shading on sugar accumulation in overwintering tea leaves, the SS content of tea leaves was measured. The results showed that the SS content was S75% > S30% > S0% (Figure 2F). this indicates that shading could enhance the accumulation of sugar in overwintering tea leaves.

3.3. RNA-Seq Quality, DEGs Identification, and Functional Annotation

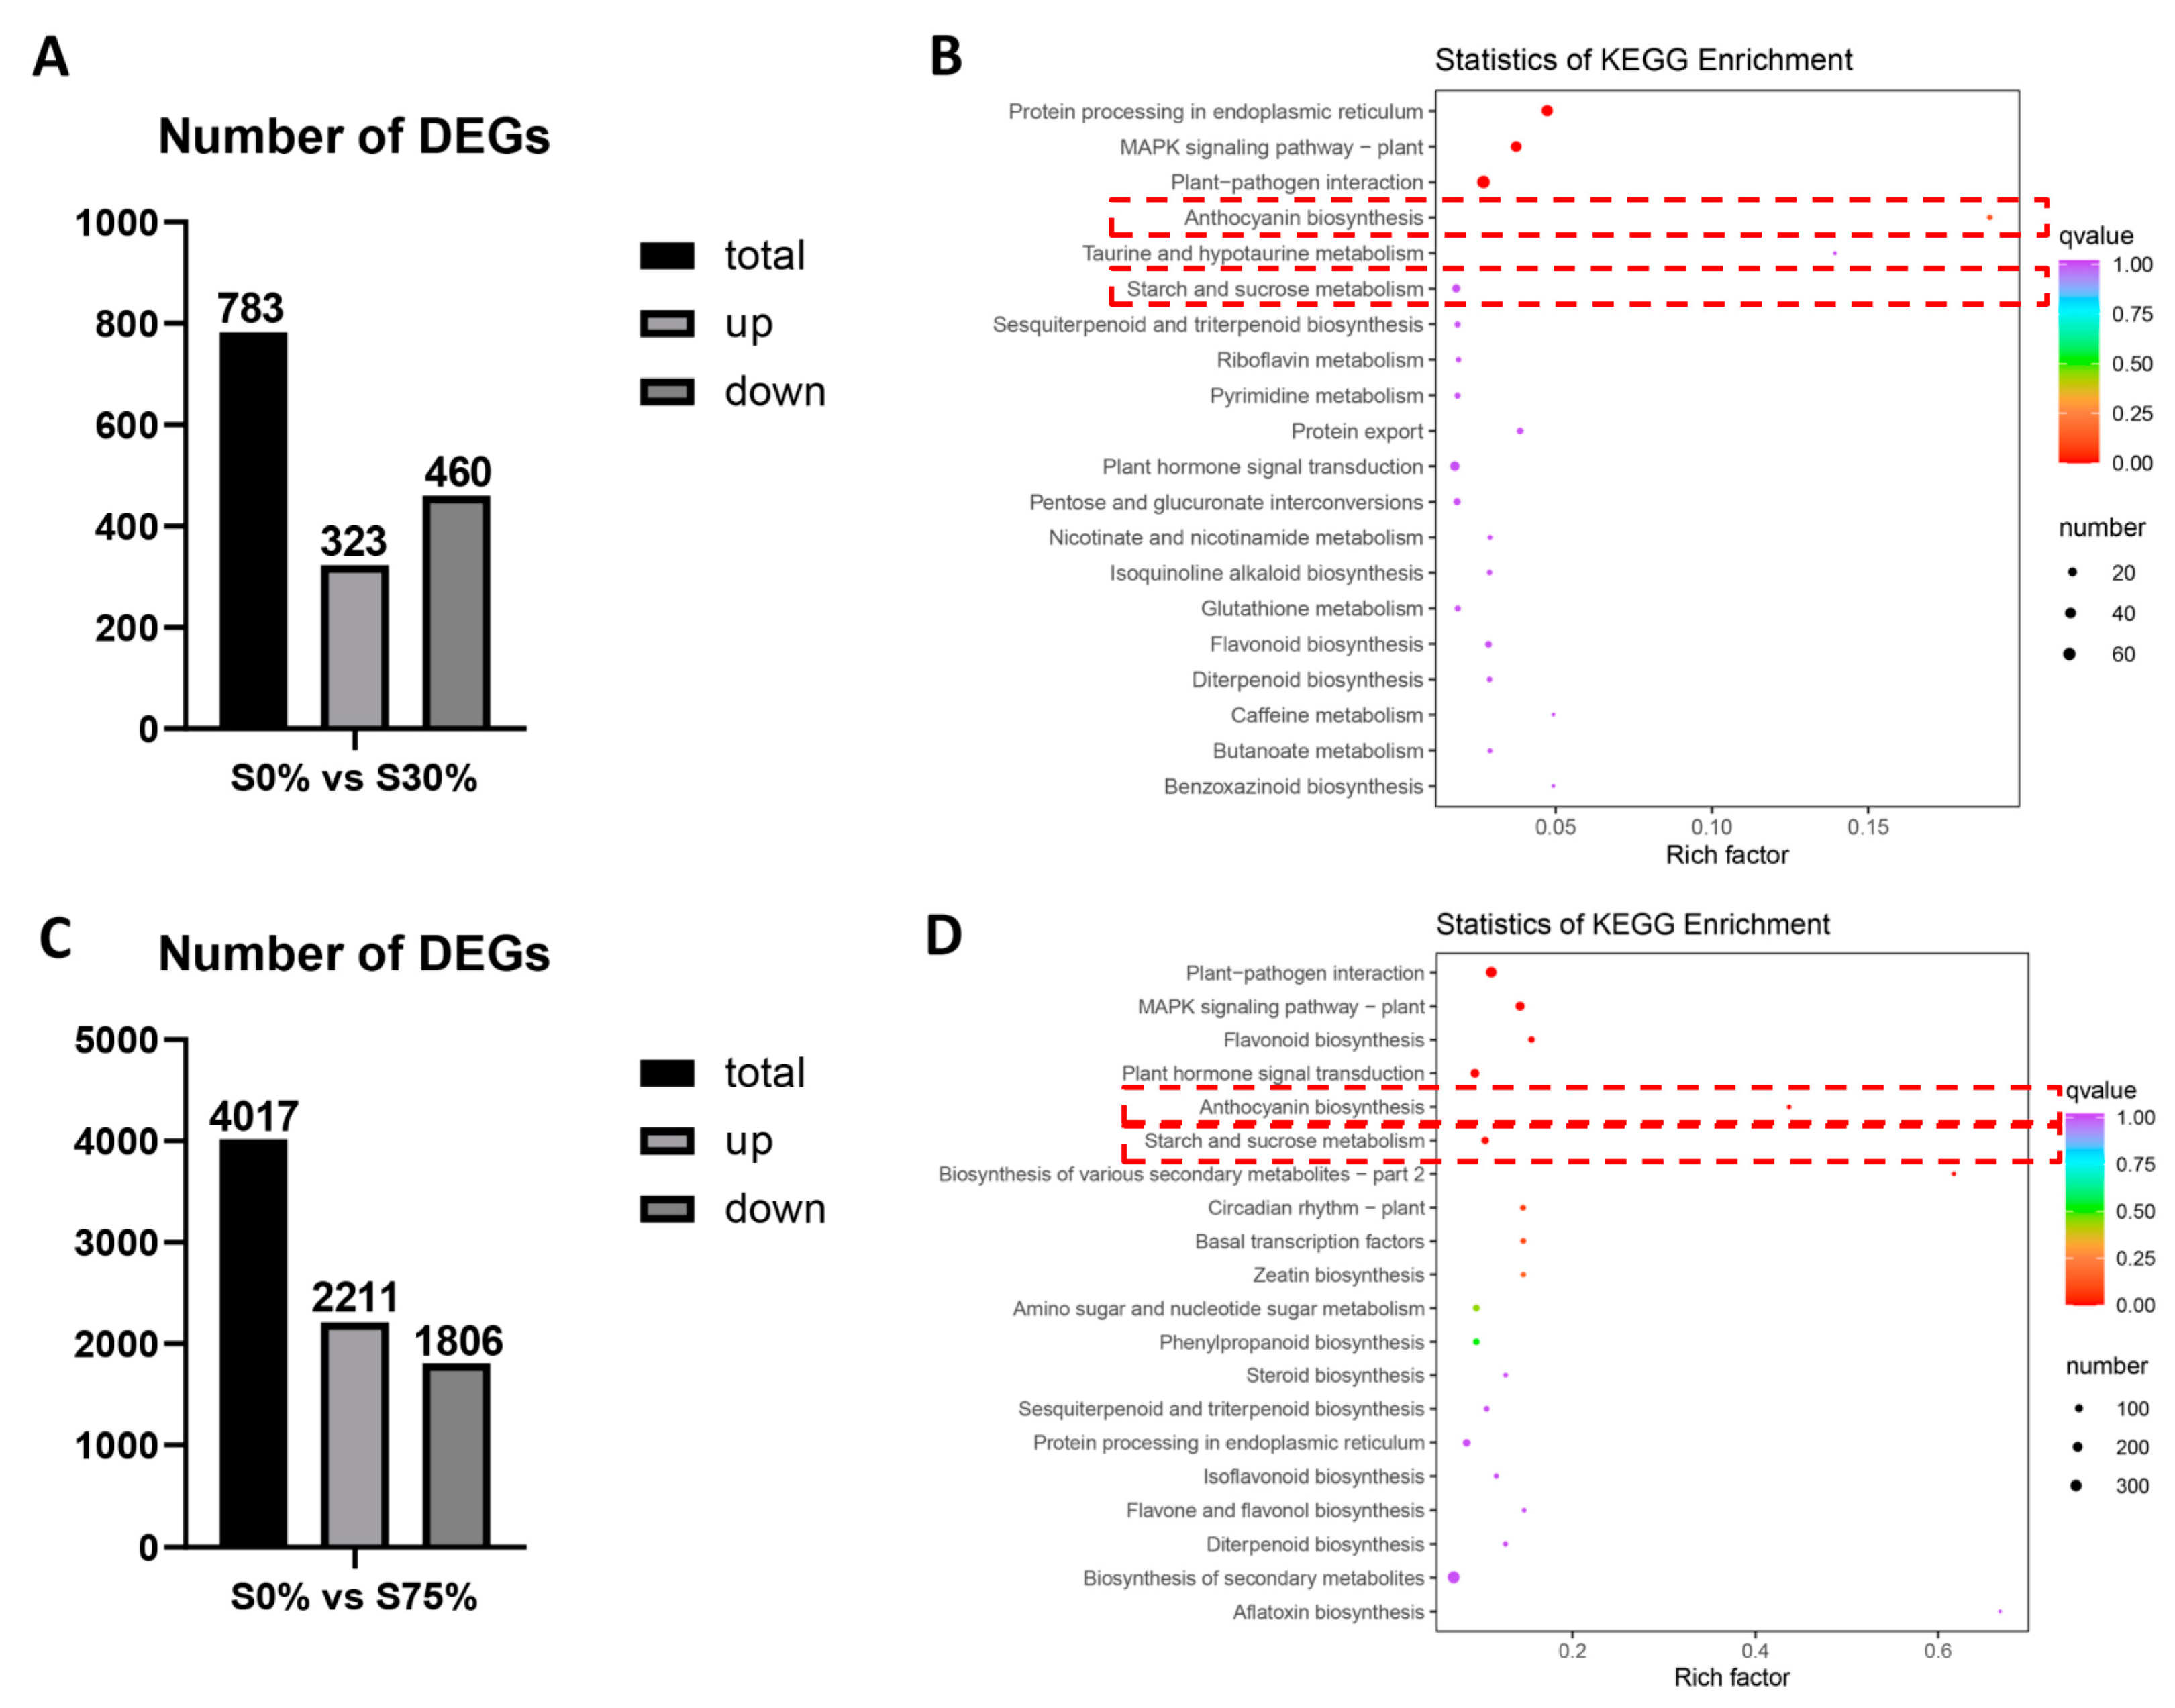
Nine samples from three treatments were collected for RNA-seq (Table S2). Two pairwise comparison methods, S30% and S0% (S0% vs. S30%) and S75% and S0% (S0% vs. S75%), were used to study the quantity of DEGs in tea plants under different shading rates. Compared with S0%, 783 DEGs were identified under S30%, among which 323 were up-regulated and 460 were down-regulated (Figure 3A). Compared with S0%, a total of 4017 DEGs were identified in S75%, among which 2211 were up-regulated and 1806 were down-regulated (Figure 3C). Thus, S75% showed greater transcriptional differences. A total of 4168 DEGs were identified by the two methods, and KEGG was used to analyze these DEGs. The results showed that multiple DEGs were significantly enriched in the “anthocyanin biosynthesis (ko00942)” and “starch and sucrose metabolism (ko00500)” pathways (Figure 3B,D).

3.4. Effects of Different Shading Rates on the Gene Expression of Chlorophyll and Carotenoid Metabolism

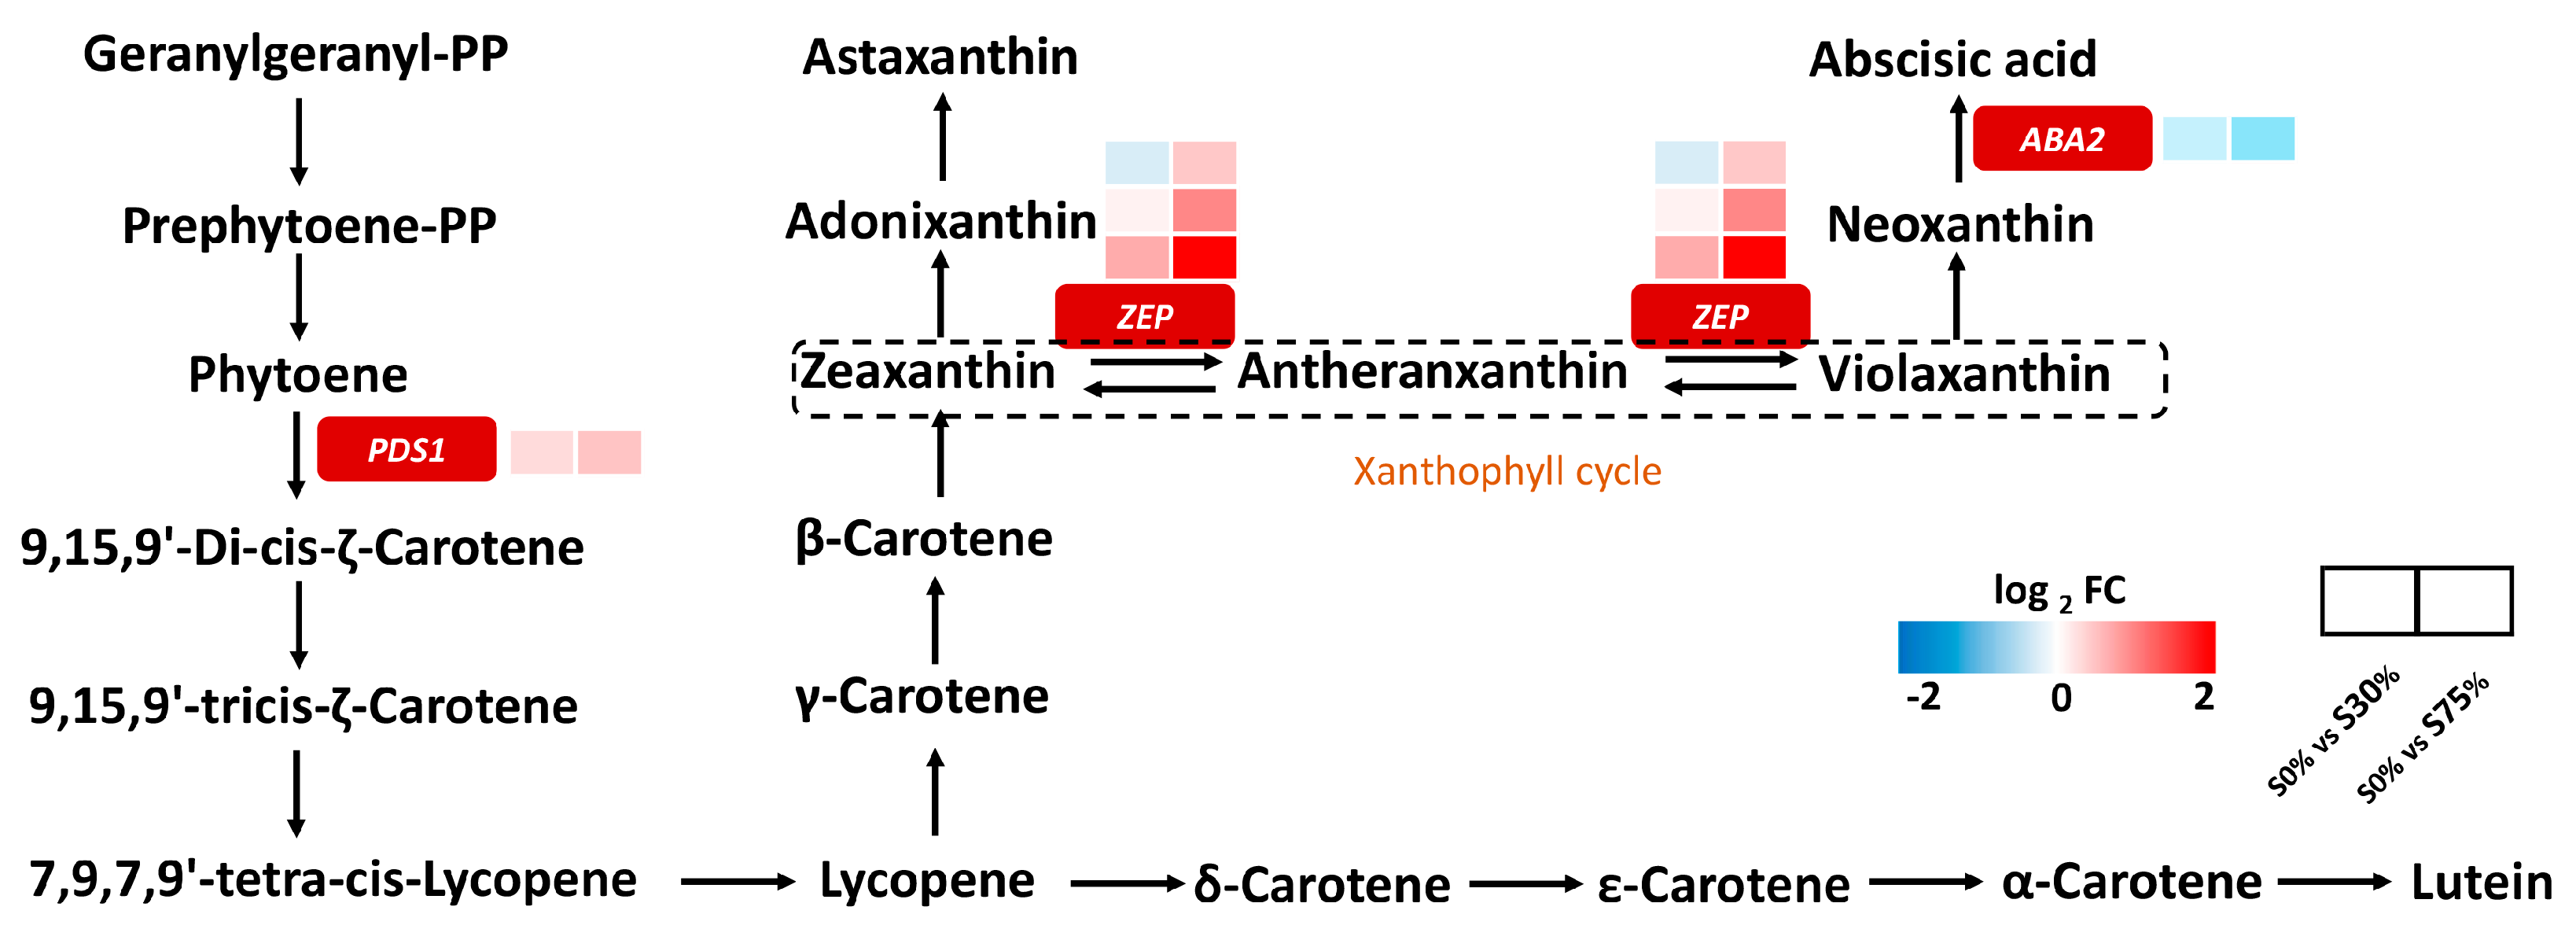
To further reveal the internal molecular mechanism of shading affecting chlorophyll and carotenoid contents in tea leaves, the “porphyrin and chlorophyll metabolism (ko00860)” and “carotenoid biosynthesis (ko00906)” pathways were analyzed. The results showed that in the chlorophyll synthesis pathway, compared with S0%, one glutamate-1-semialdehyde 2,1-aminomutase gene (hemL, CSS0015127), one protochlorophyllide reductase gene (POR, CSS0004684), one chlorophyllide a oxygenase gene (CAO, CSS0041527), one glutamyl-tRNA reductase gene (hemA, CSS0020466), and one magnesium chelatase subunit H gene (CHLH, CSS0031926) were up-regulated under S30% and S75%. Two magnesium dechelatase genes (SGR, novel.16965 and novel.3812) were down-regulated under S30% and S75% (Figure 4, Table S3). In the carotenoid synthesis pathway, compared with S0%, one 15-cis-phytoene desaturase gene (PDS1, CSS0022193) and three zeaxanthin epoxidase genes (ZEP, CSS0003685, CSS0016077, and CSS0018095) were up-regulated under S30% and S75%. One xanthoxin dehydrogenase gene (ABA2, CSS0010756) was down-regulated under S30% and S75% (Figure 5, Table S4).

3.5. Effects of Different Shading Rates on Photosynthesis and Related Gene Expression of Overwintering Tea Plants

To further elucidate the intrinsic molecular mechanism underlying the differences in the photosynthesis of tea plants under different shading rates, the “photosynthesis (ko00195)” and “photosynthesis antenna protein (ko00196)” pathways were analyzed. As shown in Figure 6, compared with S0%, two F-type H+/Na+-transporting ATPase subunit beta genes (atpD, novel.9017 and novel.9071), five photosystem II CP47 chlorophyll apoprotein genes (PsbB, novel.11975, novel.14406, novel.14609, novel.15095, and novel.1455), one photosystem II 10 kDa protein gene (PsbR, CSS0016237), two photosystem II P680 reaction center D1 protein genes (PsbA, CSS0045141 and CSS0050033), two F-type H+-transporting ATPase subunit epsilon genes (atpC, CSS0036704 and CSS0042422), one light-harvesting complex I chlorophyll a/b binding protein 5 gene (Lhca5, CSS0013793), and two light-harvesting complex II chlorophyll a/b binding protein 3 genes (Lhcb3, CSS0011632 and CSS0025719) were up-regulated under S30% and S75%. One ferredoxin--NADP+ reductase gene (PetH, CSS0038460) was down-regulated under S30% and S75% (Table S5).

3.6. Effects of Different Shading Rates on Gene Expression of Anthocyanin Synthesis

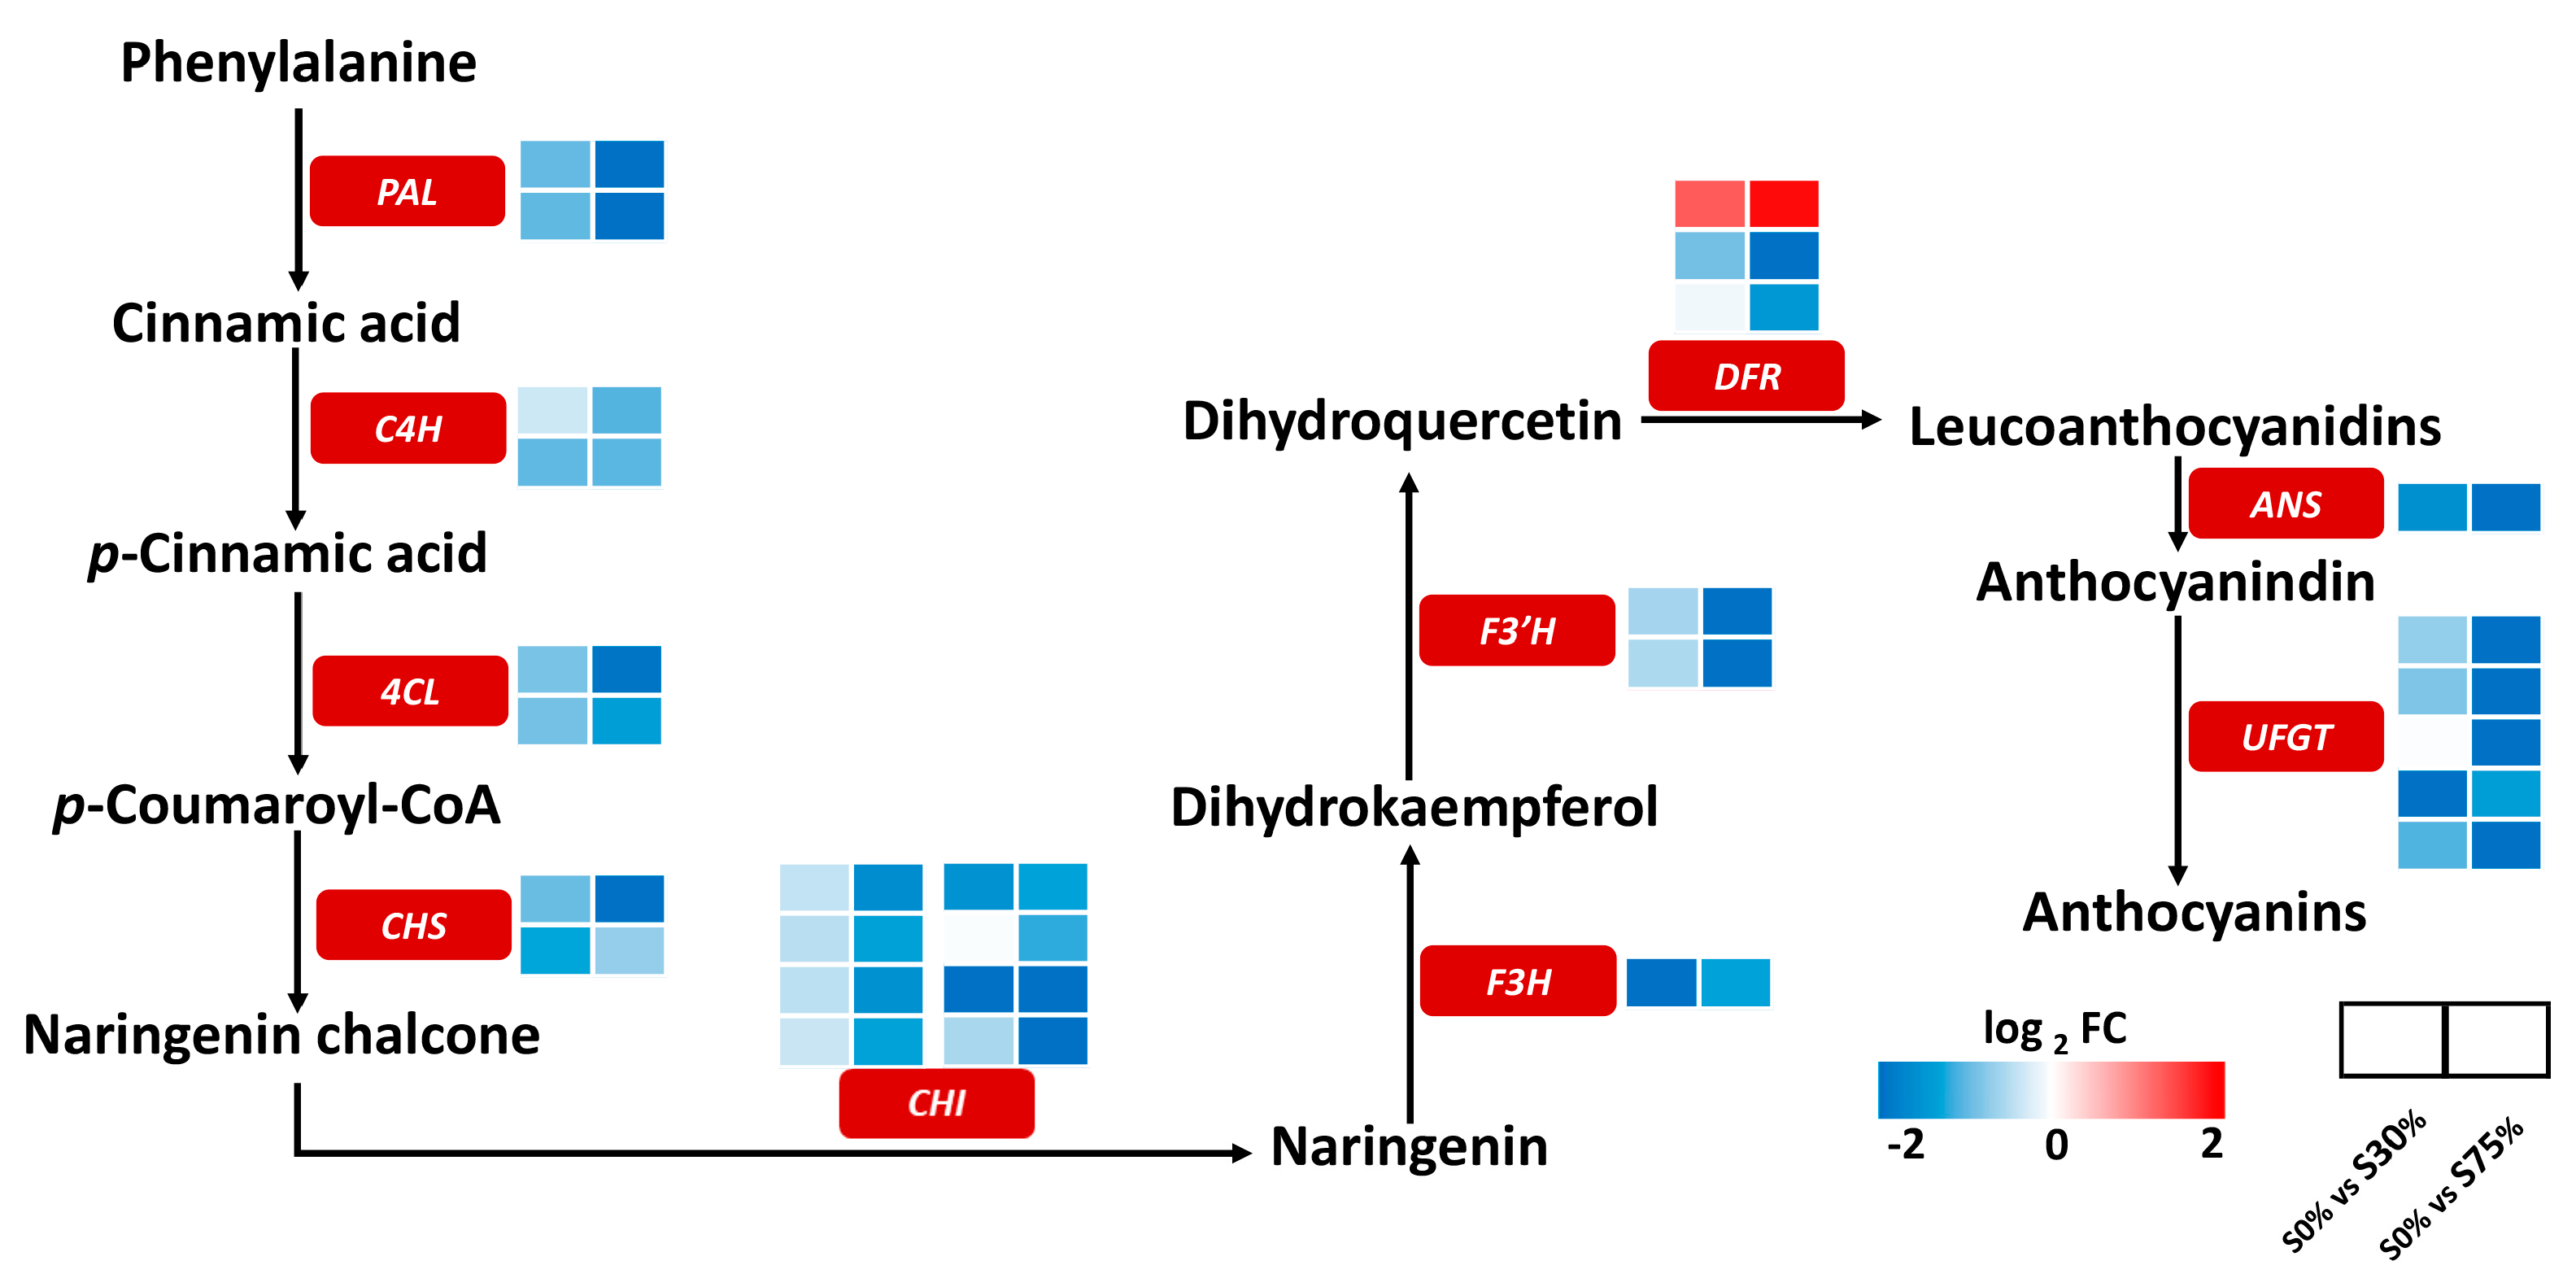
Due to many DEGs being enriched in the “anthocyanin biosynthesis (ko00942)” pathway, anthocyanin biosynthesis-related genes were analyzed. The results showed that compared with S0%, two phenylalanine ammonia-lyase genes (PAL, CSS0048281 and CSS0041448), two cinnamate 4-hydroxylase genes (C4H, CSS0005999 and CSS0002737), two 4-coumarate-CoA ligase genes (4CL, CSS0003013 and CSS0016246), two chalcone synthase genes (CHS, CSS0030597 and CSS0007714), eight chalcone isomerase genes (CHI, CSS0012595, CS0023458, CSS0028549, CSS0050436, CSS0045026, CSS0010290, novel.15150, and novel.17390), one naringenin 3-dioxygenase gene (F3H, CSS0016177), two flavonoid 3′-monooxygenase genes (F’3H, CSS0048905 and CSS0030176), two bifunctional dihydroflavonol 4-reductase genes (DFR, CSS0000672 and CSS0016543), one anthocyanidin synthase gene (ANS, CSS0010687), and five anthocyanidin 3-O-glucosyltransferase genes (UFGT, CSS0020068, CSS0014534, CSS0047476, CSS0043119, and CSS0010045) were down-regulated under S30% and S75%. One DFR (CSS0000871) was up-regulated under S30% and S75% (Figure 7, Table S6).

3.7. Effects of Different Shading Rates on the Gene Expression of Starch and Sucrose Metabolism

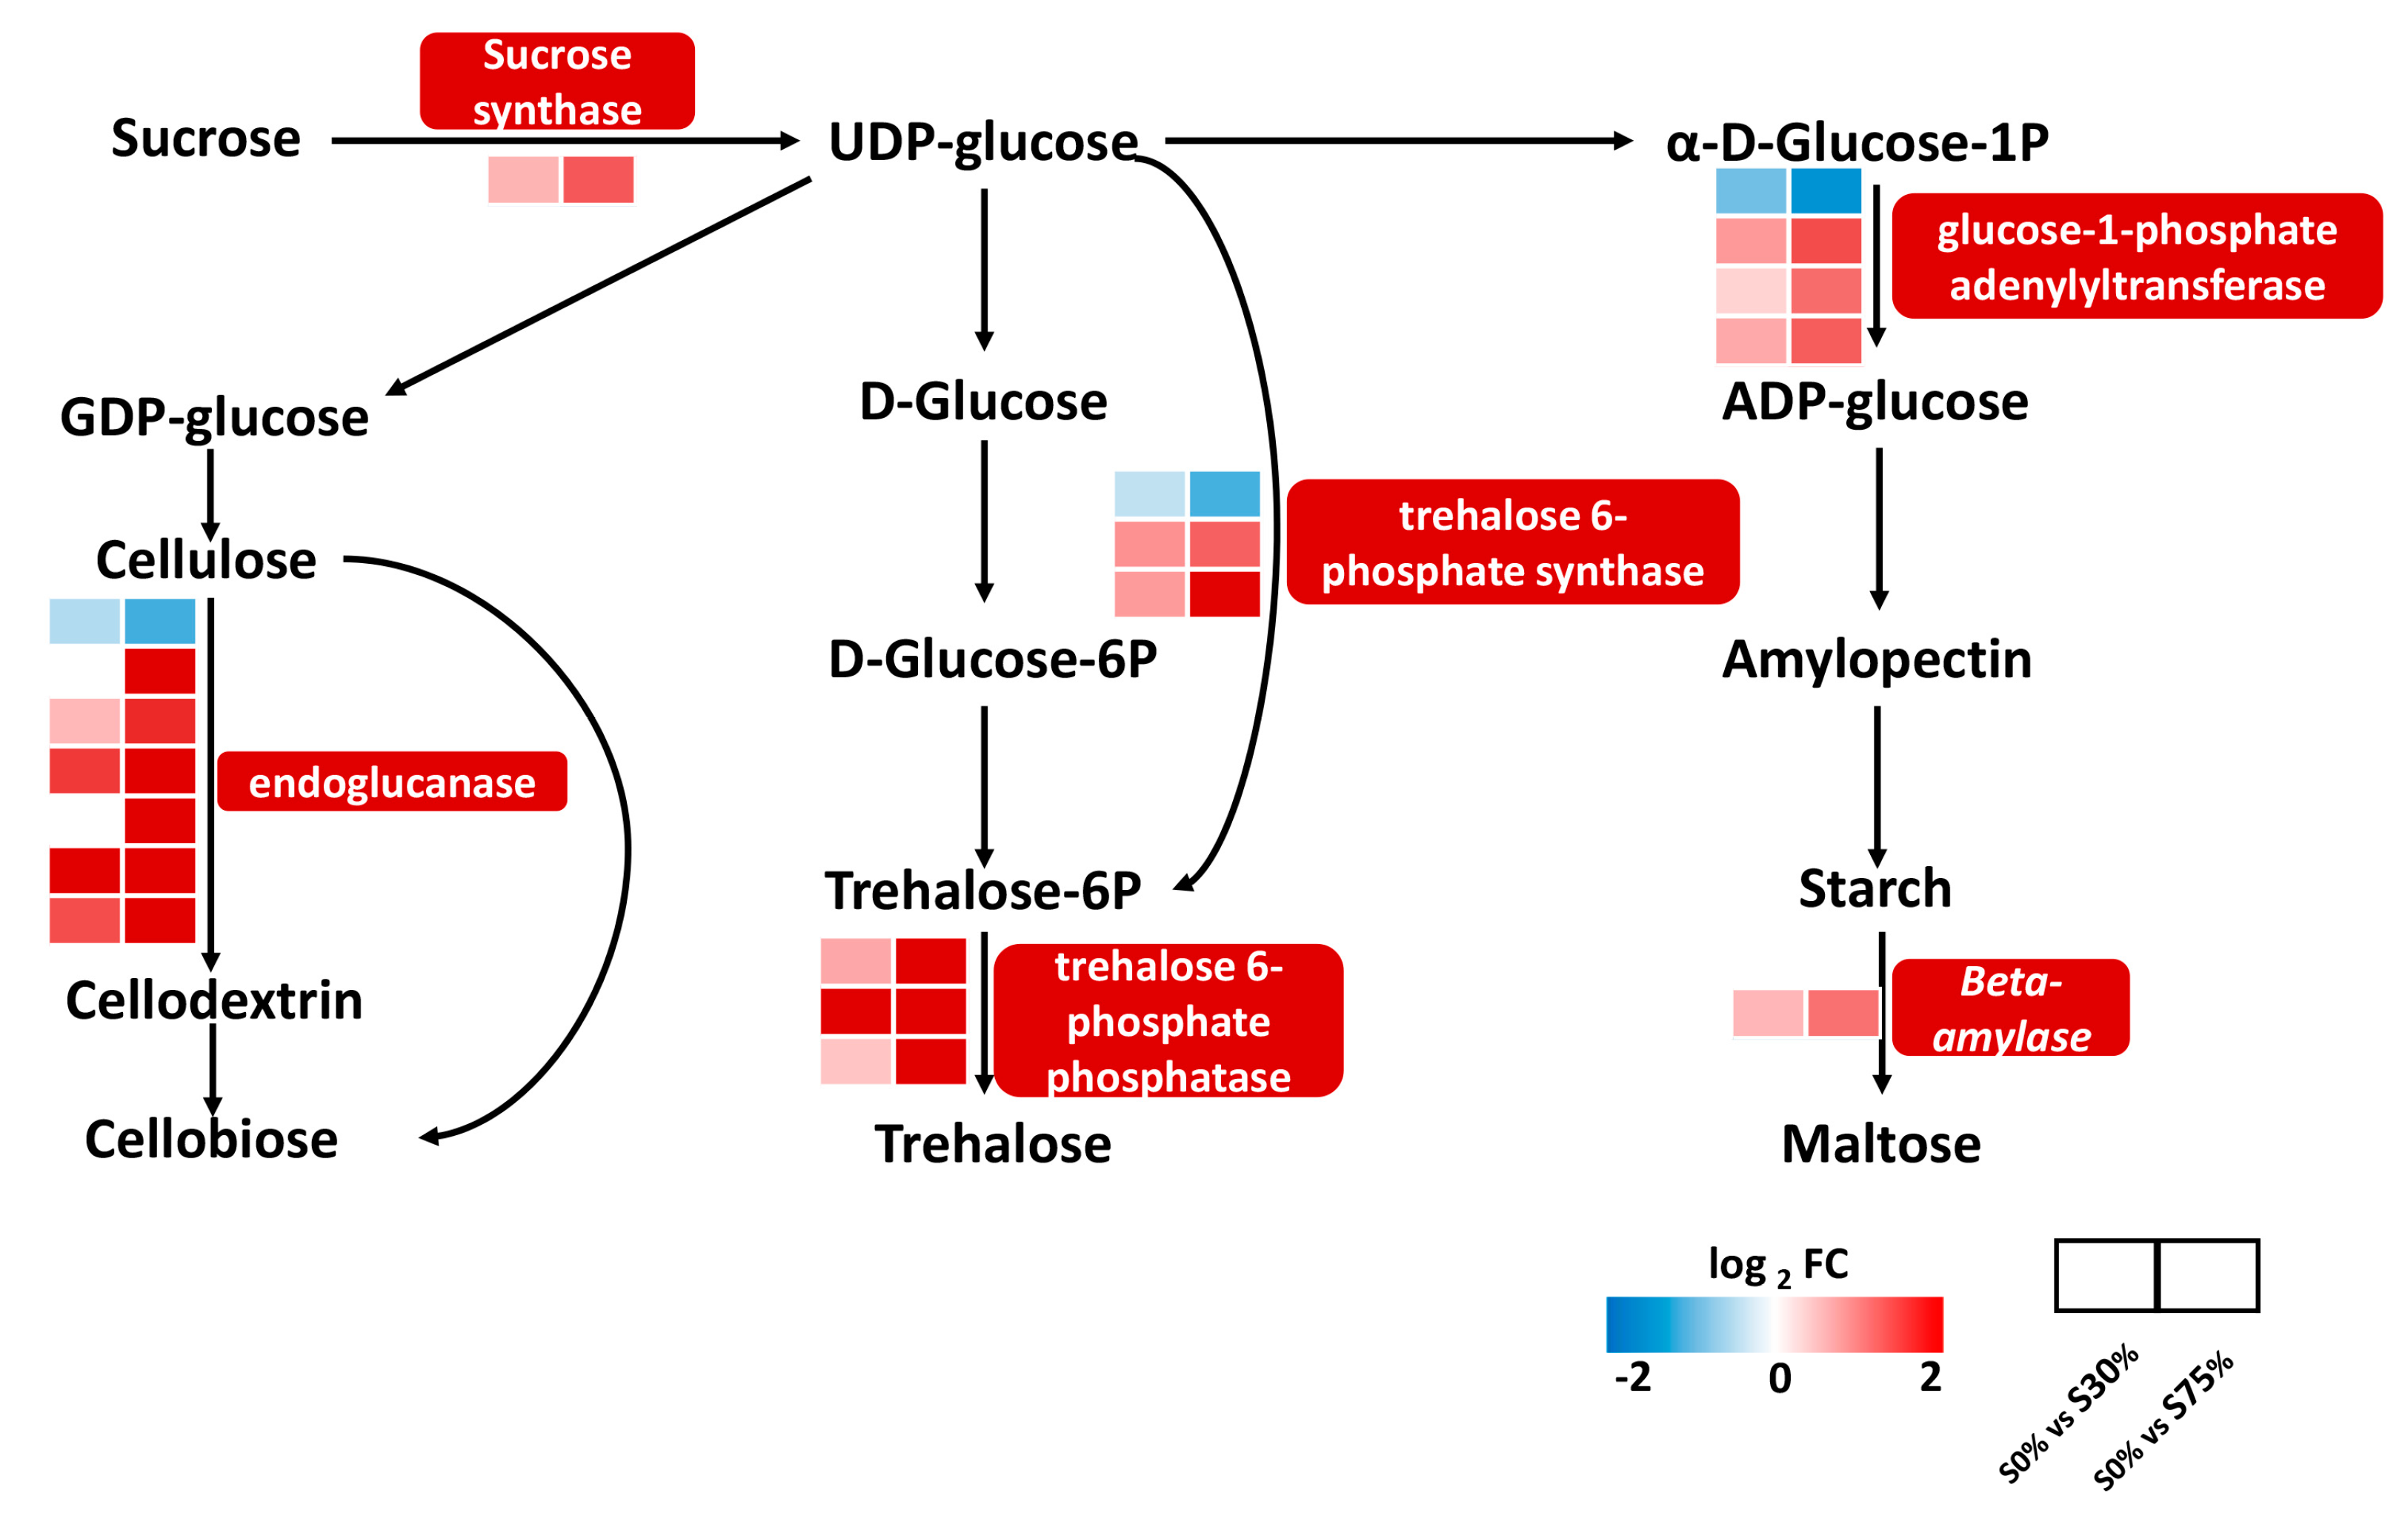
In this study, there were differences in the SS content of tea plants under different shading conditions: S75% > S30% > S0% (Figure 2F). Moreover, multiple DEGs were enriched in the “starch and sucrose metabolism (ko00500)” pathway; this pathway was analyzed. As shown in Figure 8, compared with S0%, one sucrose synthase gene (SUS, novel.14133), three glucose-1-phosphate adenylyltransferase genes (glgc, CSS0017966, CSS0019219, and CSS0041856), three trehalose 6-phosphate phosphatase genes (TPP, CSS0017044, CSS0012987, and CSS0009951), one beta-amylase gene (BAM, CSS0006318), two trehalose 6-phosphate synthase genes (TPS, CSS0015171 and CSS0011901), and six endoglucanase genes (CSS0043852, CSS0024186, CSS0026103, novel.4780, CSS0037232, and novel.16220) were up-regulated at S30% and S75%, with more significant upregulation at S75%. One glgc gene (CSS0004417), one TPS gene (CSS0046135), and one endoglucanase gene (CSS0018657) were down-regulated under S30% and S75% (Table S7).

3.8. qRT-PCR Verification

To prove the reliability of transcriptome data, eight DEGs were used for the validation of the expression level. qRT-PCR results showed that the expression level of most genes was consistent with that of the transcriptome (Figure 9). Therefore, our transcriptome data is reliable.

4. Discussion

4.1. Shading Maintained the Green Color of Overwintering Tea Leaves by Regulating the Metabolism of Chlorophyll, Carotenoid, and Anthocyanin

Protochlorophyllide oxidoreductase (POR) catalyzes the light-dependent step in chlorophyll biosynthesis, which is essential for photosynthesis [9,10,11]. SGR enzymes play an important role in the degradation of chlorophyll [12]. A previous study showed that shading significantly increased the chlorophyll content of Phoebe bournei, and with the increase of the shading rate, the chlorophyll content increased more obviously. In addition, shading increased the expression of the POR gene [13]. Meanwhile, shading not only increased the content of chlorophyll but also induced the expression of CsPOR in tea plants [6]. However, a study showed that shading decreased the expression of POR and increased the expression of SGR in Juglans mandshurica [14]. In this study, compared with S0%, POR was up-regulated under S30% and S75%, while SGR was down-regulated under S30% and S75% (Figure 4). These results suggest that shading could promote chlorophyll accumulation in overwintering tea leaves by up-regulating POR and down-regulating SGR expression, thereby keeping the leaves green.
The color of plant leaves is not only influenced by chlorophyll but also by carotenoids. In this study, the carotenoid content was S75% > S30% > S0% (Figure 1C). A previous study showed that ZEP was a key gene for the accumulation of carotenoids [15]. ABA2 encodes a key enzyme in ABA biosynthesis, and its down-regulation may facilitate the accumulation of carotenoids [16]. In tea plants, with the extension of shading time, the carotenoid content significantly increased compared to the no-shading [17]. In addition, ZEP genes were up-regulated under shade compared to the controls in Pinus koraiensis [18]. In this study, compared with S0%, ZEP and ABA2 were up-regulated and down-regulated, respectively, under shade conditions (Figure 5). This indicated that under low-temperature conditions, shading might promote carotenoid synthesis and accumulation in tea leaves by up-regulating ZEP and down-regulating ABA2 expression. The color of plant leaves mainly depends on the ratio of Chl to carotenoid. In this study, although the carotenoid content was the highest under S75%, the Chl/carotenoid was S75% > S30% > S0% (Figure 1D), which was also the reason why leaves could be kept green under shade conditions. In addition, carotenoids are the main lipophilic antioxidants found in chloroplasts. They can prevent and regulate the reproduction of lipid peroxidation by eliminating ROS and lipid peroxidation free radicals, which is crucial to photosynthesis and photoprotection [19,20]. This suggests that shading could enable tea plants to maintain photosynthesis at low temperatures, which might be closely related to high carotenoid content.
Chlorophyll, carotenoid, and anthocyanin provide the basis for the color coordination of plant tissue, and anthocyanin also plays a major role in the coloring of plant leaves [21]. Research has reported that anthocyanin was the main pigment that caused nongreen leaves in plants [22,23]. Shen et al. (2019) showed that under low-temperature conditions, tea leaves appeared reddish brown and their anthocyanin content was significantly higher than that of normal green leaves [24]. This indicates that the browning and withering of tea leaves under low-temperature conditions were related to the high anthocyanin content. Multiple studies have shown that light intensity could directly affect the anthocyanin content and cause severe inhibition of anthocyanin synthesis by shading [25,26]. The anthocyanin content of Sliene germana treated with full light was significantly higher than that of plants treated with natural shading [27]. This indicates that shading could reduce the synthesis and accumulation of anthocyanin in plants. The synthesis of anthocyanins is catalyzed by PAL, CHS, CHI, F3H, DFR, ANS, and UFGT using L-phenylalanine as the raw material through the phenylalanine pathway [28]. A previous study showed that high amounts of light could significantly induce anthocyanin accumulation and high expression of DFR, CHS, CHI, and F3H in Rabbiteye blueberry [29]. In addition, the expression of structural genes involved in anthocyanin biosynthesis was down-regulated after shading in Purple broccoli, including PAL, CHS, CHI, F3H, and DFR [30]. In this study, compared with S0%, PAL, CHS, CHI, F3H, ANS, and UFGT were significantly down-regulated under shading (Figure 7). This suggests that shading might reduce the content of anthocyanins in tea leaves. In summary, the browning of tea leaves under low-temperature and no-shading conditions is closely related to the high content of anthocyanins. Shading can keep tea leaves green due to the low anthocyanin content and the high chlorophyll content.

4.2. Shading Maintained Photosynthesis of Overwintering Tea Leaves by Regulating Photosynthetic Proteins

Photosynthesis is the largest source of energy for plants, and it can be inhibited under sustained low-temperature environmental conditions. The Fv/Fm value reflects the potential quantum efficiency of Photosystem II and can be used as a sensitive indicator of plant photosynthetic performance. The Fv/Fm value of most plants is around 0.83 [31], and the Fv/Fm value decreases when plants are subjected to environmental stress [32]. In this study, the Fv/Fm values were S75% (0.82) > S30% (0.71) > S0% (0.65) (Figure 2A), indicating that shading under low-temperature conditions can protect the photosynthetic system of tea plants and enable them to maintain normal growth and physiological activities. Net photosynthetic rate (Pn): S75% > S30% > S0% (Figure 2B), which also indicated that shading protected the photosynthetic system of tea plants under low-temperature conditions. Plant photosynthesis depends on the functional coordination of photosystem I (PS I) and photosystem II (PS II) [33]. Psa and Psb are the important components of photosystem I and II, which are the key elements of the photosynthesis [34,35]. In this study, compared with S0%, PsbA, PsbB, and PsbR were up-regulated under S30% and S75%, with the highest expression under S75% (Figure 6C). Meanwhile, compared with no-shading, a 70% shading rate promoted the expression of PsbA and PsbB in tea plants [36]. In addition, light-harvesting chlorophyll a/b binding protein (LHC) plays a major role in the heat dissipation of excess energy and maintaining photoprotection of efficient photosynthesis [37]. These protein complexes are necessary for the light-dependent reaction of photosynthesis, and they participate in light-trapping and chlorophyll metabolism [38]. In this study, Lhca5 and Lhcb3 were up-regulated at S30% and S75% compared with S0%. The above results indicate that shading under low-temperature conditions might up-regulate the expression of PsbA, PsbB, PsbR, Lhca5, and Lhcb3 to maintain normal photosynthesis in tea plants, enabling them to engage in normal physiological activities.

4.3. Shading Maintains the Soluble Sugar Content in Overwintering Tea Leaves by Regulating Starch and Carbohydrate Metabolism

Soluble sugar (SS) is the basis of plant metabolism, which can provide energy and metabolic intermediates for plant growth and development, including maltose, sucrose, trehalose, and the raffinose family. In this study, the SS content was as follows: S75% > S30% > S0% (Figure 2F). The expression regulation of enzyme-related genes in starch and sucrose metabolism plays an important role in the SS content [39,40,41]. Multiple studies have shown that sucrose synthase (SUS) had a positive impact on the synthesis and accumulation of plant starch [42,43]. As a typical external hydrolase, beta-amylase (BAM) is mainly used to degrade starch in plants. Meanwhile, the β-starch cleavage has been proven to be the main source of maltose [44,45]. In addition, VvBAM1 can increase the soluble sugar content of tomato plants and promote ROS clearance to improve cold resistance [46]. In this study, the expression of SUS and BAM was up-regulated under shading conditions (Figure 8), indicating that shading might boost the synthesis of starch in tea leaves by inducing SUS expression and then inducing the expression of BAM to lyse into more maltose. Previous studies have shown that trehalose was synthesized in two steps: first, it was catalyzed by trehalose 6-phosphate synthase (TPS), which synthesized trehalose-6P using UDP-glucose as the substrate, and then by trehalose 6-phosphate phosphatase (TPP) dephosphorylates trehalose-6P to synthesize trehalose [47,48]. In this study, both TPS and TPP genes were up-regulated under shading conditions (Figure 8), indicating that shading might promote trehalose synthesis by inducing the expression of TPS and TPP genes. In summary, the above results suggested that shading might promote the synthesis and accumulation of SS in tea leaves by up-regulating the expression of genes such as SUS, BAM, TPS, and TPP, which was crucial for maintaining the normal physiological activities of tea plants.

5. Conclusions

Shading treatment on overwintering tea plants could maintain the green and normal physiological activity of tea leaves. The chlorophyll, carotenoid, soluble sugar contents, and net photosynthetic rate of tea leaves under shade treatment were higher than those under no-shading treatment. Based on transcriptome data, chlorophyll, carotenoid, and photosynthesis-related genes (such as POR, ZEP, PsbA, and PsbB) were differentially expressed under different treatments. In addition, shading down-regulated the expression of anthocyanin biosynthesis-related genes (such as PAL and CHS) and up-regulated the expression of starch and sucrose metabolism-related genes (such as TPP and TPS). In summary, this study revealed the molecular mechanism by which shading maintained the green color and normal physiological functions of overwintering tea leaves, providing a theoretical basis for protecting overwintering tea plants.

Supplementary Materials

The following supporting information can be downloaded at https://www.mdpi.com/article/10.3390/agronomy13071701/s1; Table S1: Primers used for real-time PCR analysis; Table S2: Transcriptome sequencing; Table S3: Gene annotation related to chlorophyll metabolism; Table S4: Gene annotation related to carotenoids metabolism; Table S5: Gene annotation related to photosynthesis; Table S6: Gene annotation related to anthocyanin biosynthesis; Table S7: Gene annotation related to starch and sucrose metabolism. Figure S1: Environmental Parameters for tea plant growth, including (A) Air Temperature (°C); (B) Air Humidity (%); (C) Soil Temperature (°C); (D) Soil Moisture (%). In the figure, “W” represents exceeding the limit value, and “A” represents exceeding the limit value by 20%. Figure S2: (A) The ratio of chlorophyll a to chlorophyll b; (B) The ratio of chlorophyll to carotenoids. (p-value < 0.05), The Y-axis represents its ratio number.

Author Contributions

X.H. conducted the experiment, analyzed the data, and wrote the manuscript; Y.S. (Yaozong Shen) and J.S. directed and reviewed the manuscript; H.W., S.D., H.C. and Y.X. collected samples; K.F. put forward hypotheses, designed experiments, and reviewed the manuscript; Z.D. and Y.W. put forward hypotheses and designed experiments; Y.M. and Y.S. (Yujie Song) participated in the experimental design and guided the research. All authors have read and agreed to the published version of the manuscript.

Funding

This research was funded by the Technology System of Modern Agricultural Industry in Shandong Province (SDAIT-19-01), the Special Foundation for Distinguished Taishan Scholar of Shandong Province (No.ts201712057), the Livelihood Project of Qingdao City (21-1-4-ny-2-nsh), the Special Talent Program of SAAS (CXGC2023A11), and the Agricultural Improved Variety Project of Shandong Province (2020LZGC010).

Data Availability Statement

The raw data for RNA-seq have been uploaded to the NCBI SRA with accession number PRJNA943476.

Acknowledgments

Thanks are due to the whole research group for their active role in the experimental process, data analysis, and manuscript revision.

Conflicts of Interest

The authors declare no conflict of interest.

References

  1. Yang, Y.Z.; Li, T.; Teng, R.M.; Han, M.H.; Zhuang, J. Low temperature effects on carotenoids biosynthesis in the leaves of green and albino tea plant (Camellia sinensis (L.) O. Kuntze). Sci. Hortic. 2021, 285, 110164. [Google Scholar] [CrossRef]
  2. Li, Y.; Zhang, Q.; Ou, L.; Ji, D.; Jin, L. Response to the Cold Stress Signaling of the Tea Plant (Camellia sinensis) Elicited by Chitosan Oligosaccharide. Agronomy 2020, 10, 915. [Google Scholar] [CrossRef]
  3. Wang, Y.; Li, Y.; Wang, J.; Xiang, Z.; Xi, P.; Zhao, D. Physiological Changes and Differential Gene Expression of Tea Plants (Camellia sinensis (L.) Kuntze var. niaowangensis Q.H. Chen) Under Cold Stress. DNA Cell Biol. 2021, 40, 906–920. [Google Scholar] [PubMed]
  4. Li, X.; Ahammed, G.J.; Li, Z.X.; Zhang, L.; Wei, J.P.; Yan, P.; Zhang, L.P.; Han, W.Y. Freezing stress deteriorates tea quality of new flush by inducing photosynthetic inhibition and oxidative stress in mature leaves. Sci. Hortic. 2017, 230, 155–160. [Google Scholar] [CrossRef]
  5. Oh, S.; Koh, S. Photosystem II photochemical efficiency and photosynthetic capacity in leaves of tea plant (Camellia sinensis L.) under winter stress in the field. Hortic. Environ. Biotechnol. 2014, 55, 363–371. [Google Scholar] [CrossRef]
  6. Chen, J.; Wu, S.; Dong, F.; Li, J.; Zeng, L.; Tang, J.; Gu, D. Mechanism Underlying the Shading-Induced Chlorophyll Accumulation in Tea Leaves. Front. Plant Sci. 2021, 12, 779819. [Google Scholar] [CrossRef]
  7. Sano, T.; Horie, H.; Matsunaga, A.; Hirono, Y. Effect of shading intensity on morphological and color traits and on chemical components of new tea (Camellia sinensis L.) shoots under direct covering cultivation. J. Sci. Food Agric. 2018, 98, 5666–5676. [Google Scholar] [CrossRef]
  8. Fu, X.; Chen, J.; Li, J.; Dai, G.; Tang, J.; Yang, Z. Mechanism underlying the carotenoid accumulation in shaded tea leaves. Food Chem. X 2022, 14, 100323. [Google Scholar] [CrossRef]
  9. Bourque, D.P.; Naylor, A.W. Large Effects of Small Water Deficits on Chlorophyll Accumulation and Ribonucleic Acid Synthesis in Etiolated Leaves of Jack Bean (Canavalia ensiformis [L.] DC.). Plant Physiol. 1971, 47, 591–594. [Google Scholar] [CrossRef] [Green Version]
  10. Lopez-Figueroa, F.; Perez, R.; Niell, F.X. Effects of red and far-red light pulses on the chlorophyll and biliprotein accumulation in the red alga Corallina elongata. J. Photochem. Photobiol. B Biol. 1989, 4, 185–193. [Google Scholar] [CrossRef]
  11. Huang, W.; Ma, H.Y.; Huang, Y.; Li, Y.; Wang, G.L.; Jiang, Q.; Wang, F.; Xiong, A.S. Comparative proteomic analysis provides novel insights into chlorophyll biosynthesis in celery under temperature stress. Physiol. Plant 2017, 161, 468–485. [Google Scholar] [CrossRef]
  12. Jiao, B.; Meng, Q.; Lv, W. Roles of stay-green (SGR) homologs during chlorophyll degradation in green plants. Bot. Stud. 2020, 61, 25. [Google Scholar] [CrossRef]
  13. An, J.; Wei, X.; Huo, H. Transcriptome analysis reveals the accelerated expression of genes related to photosynthesis and chlorophyll biosynthesis contribution to shade-tolerant in Phoebe bournei. BMC Plant Biol. 2022, 22, 268. [Google Scholar] [CrossRef]
  14. Zhang, X.; Li, Y.; Yan, H.; Cai, K.; Li, H.; Wu, Z.; Wu, J.; Yang, X.; Jiang, H.; Wang, Q.; et al. Integrated metabolomic and transcriptomic analyses reveal different metabolite biosynthesis profiles of Juglans mandshurica in shade. Front. Plant Sci. 2022, 13, 991874. [Google Scholar] [CrossRef] [PubMed]
  15. Suematsu, K.; Tanaka, M.; Kurata, R.; Kai, Y. Comparative transcriptome analysis implied a ZEP paralog was a key gene involved in carotenoid accumulation in yellow-fleshed sweetpotato. Sci. Rep. 2020, 10, 20607. [Google Scholar] [CrossRef] [PubMed]
  16. González-Guzmán, M.; Apostolova, N.; Bellés, J.M.; Barrero, J.M.; Piqueras, P.; Ponce, M.R.; Micol, J.L.; Serrano, R.; Rodríguez, P.L. The short-chain alcohol dehydrogenase ABA2 catalyzes the conversion of xanthoxin to abscisic aldehyde. Plant Cell 2002, 14, 1833–1846. [Google Scholar] [CrossRef] [PubMed] [Green Version]
  17. Chen, X.; Ye, K.; Xu, Y.; Zhao, Y.; Zhao, D. Effect of Shading on the Morphological, Physiological, and Biochemical Characteristics as Well as the Transcriptome of Matcha Green Tea. Int. J. Mol. Sci. 2022, 23, 14169. [Google Scholar] [CrossRef] [PubMed]
  18. Li, Y.; Zhang, X.; Cai, K.; Zhang, Q.; Jiang, L.; Li, H.; Lv, Y.; Qu, G.; Zhao, X. Comparative Transcriptomic and Metabolic Analyses Reveal the Coordinated Mechanisms in Pinus koraiensis under Different Light Stress Conditions. Int. J. Mol. Sci. 2022, 23, 9556. [Google Scholar] [CrossRef] [PubMed]
  19. Munne-Bosch, S.; Alegre, L. The function of tocopherols and tocotrienols in plants [Review]. Crit. Rev. Plant Sci. 2002, 21, 31–57. [Google Scholar] [CrossRef]
  20. Møller, I.M.; Jensen, P.E.; Hansson, A. Oxidative modifications to cellular components in plants. Annu. Rev. Plant Biol. 2007, 58, 459–481. [Google Scholar] [CrossRef] [Green Version]
  21. Zhang, Q.; Wang, L.; Liu, Z.; Zhao, Z.; Zhao, J.; Wang, Z.; Zhou, G.; Liu, P.; Liu, M. Transcriptome and metabolome profiling unveil the mechanisms of Ziziphus jujuba Mill. peel coloration. Food Chem. 2020, 312, 125903. [Google Scholar] [CrossRef] [PubMed]
  22. Gould, K.S. Nature’s Swiss Army Knife: The Diverse Protective Roles of Anthocyanins in Leaves. J. Biomed. Biotechnol. 2004, 2004, 314–320. [Google Scholar] [CrossRef] [PubMed] [Green Version]
  23. Tanaka, Y.; Sasaki, N.; Ohmiya, A. Biosynthesis of plant pigments: Anthocyanins, betalains and carotenoids. Plant J. 2008, 54, 733–749. [Google Scholar] [CrossRef] [PubMed]
  24. Shen, J.; Zhang, D.; Zhou, L.; Zhang, X.; Liao, J.; Duan, Y.; Wen, B.; Ma, Y.; Wang, Y.; Fang, W.; et al. Transcriptomic and metabolomic profiling of Camellia sinensis L. cv. ‘Suchazao’ exposed to temperature stresses reveals modification in protein synthesis and photosynthetic and anthocyanin biosynthetic pathways. Tree Physiol. 2019, 39, 1583–1599. [Google Scholar] [CrossRef]
  25. Albert, N.W.; Lewis, D.H.; Zhang, H.; Irving, L.J.; Jameson, P.E.; Davies, K.M. Light-induced vegetative anthocyanin pigmentation in Petunia. J. Exp. Bot. 2009, 60, 2191–2202. [Google Scholar] [CrossRef] [Green Version]
  26. Singh, M.S.; Sharma, R. Sunlight-induced anthocyanin pigmentation in maize vegetative tissues. J. Exp. Bot. 1999, 50, 1619–1625. [Google Scholar] [CrossRef]
  27. Narbona, E.; Jaca, J.; Del Valle, J.C.; Valladares, F.; Buide, M.L. Whole-plant reddening in Silene germana is due to anthocyanin accumulation in response to visible light. Plant Biol. 2018, 20, 968–977. [Google Scholar] [CrossRef]
  28. Niu, J.; Zhang, G.; Zhang, W.; Goltsev, V.; Sun, S.; Wang, J.; Li, P.; Ma, F. Anthocyanin concentration depends on the counterbalance between its synthesis and degradation in plum fruit at high temperature. Sci. Rep. 2017, 7, 7684. [Google Scholar] [CrossRef] [Green Version]
  29. Guo, X.; Shakeel, M.; Wang, D.; Qu, C.; Yang, S.; Ahmad, S.; Song, Z. Metabolome and transcriptome profiling unveil the mechanisms of light-induced anthocyanin synthesis in rabbiteye blueberry (vaccinium ashei: Reade). BMC Plant Biol. 2022, 22, 223. [Google Scholar] [CrossRef]
  30. Liu, C.; Yao, X.; Li, G.; Huang, L.; Xie, Z. Transcriptomic profiling of purple broccoli reveals light-induced anthocyanin biosynthetic signaling and structural genes. PeerJ 2020, 8, e8870. [Google Scholar] [CrossRef]
  31. Xu, Y.; Yang, M.; Cheng, F.; Liu, S.; Liang, Y. Effects of LED photoperiods and light qualities on in vitro growth and chlorophyll fluorescence of Cunninghamia lanceolata. BMC Plant Biol. 2020, 20, 269. [Google Scholar] [CrossRef] [PubMed]
  32. Allen, D.J.; Ort, D.R. Impacts of chilling temperatures on photosynthesis in warm-climate plants. Trends Plant Sci. 2001, 6, 36–42. [Google Scholar] [CrossRef] [PubMed]
  33. Kouřil, R.; Nosek, L.; Bartoš, J.; Boekema, E.J.; Ilík, P. Evolutionary loss of light-harvesting proteins Lhcb6 and Lhcb3 in major land plant groups--break-up of current dogma. New Phytol. 2016, 210, 808–814. [Google Scholar] [CrossRef] [PubMed] [Green Version]
  34. Wang, S.; Chen, W.; Yang, C.; Yao, J.; Xiao, W.; Xin, Y.; Qiu, J.; Hu, W.; Yao, H.; Ying, W.; et al. Comparative proteomic analysis reveals alterations in development and photosynthesis-related proteins in diploid and triploid rice. BMC Plant Biol. 2016, 16, 199. [Google Scholar] [CrossRef] [Green Version]
  35. Lambert, D.H.; Bryant, D.A.; Stirewalt, V.L.; Dubbs, J.M.; Stevens, S.E., Jr.; Porter, R.D. Gene map for the Cyanophora paradoxa cyanelle genome. J. Bacteriol. 1985, 164, 659–664. [Google Scholar] [CrossRef] [Green Version]
  36. Ye, J.H.; Lv, Y.Q.; Liu, S.R.; Jin, J.; Wang, Y.F.; Wei, C.L.; Zhao, S.Q. Effects of Light Intensity and Spectral Composition on the Transcriptome Profiles of Leaves in Shade Grown Tea Plants (Camellia sinensis L.) and Regulatory Network of Flavonoid Biosynthesis. Molecules 2021, 26, 5836. [Google Scholar] [CrossRef]
  37. Gerotto, C.; Franchin, C.; Arrigoni, G.; Morosinotto, T. In Vivo Identification of Photosystem II Light Harvesting Complexes Interacting with PHOTOSYSTEM II SUBUNIT S. Plant Physiol. 2015, 168, 1747–1761. [Google Scholar] [CrossRef] [Green Version]
  38. Yadav, K.N.; Semchonok, D.A.; Nosek, L.; Kouřil, R.; Fucile, G.; Boekema, E.J.; Eichacker, L.A. Supercomplexes of plant photosystem I with cytochrome b6f, light-harvesting complex II and NDH. Biochim. Biophys. Acta Bioenerg. 2017, 1858, 12–20. [Google Scholar] [CrossRef]
  39. Ruan, Y.L. Sucrose metabolism: Gateway to diverse carbon use and sugar signaling. Annu. Rev. Plant Biol. 2014, 65, 33–67. [Google Scholar] [CrossRef]
  40. Jiang, L.; Yu, X.; Qi, X.; Yu, Q.; Deng, S.; Bai, B.; Li, N.; Zhang, A.; Zhu, C.; Liu, B.; et al. Multigene engineering of starch biosynthesis in maize endosperm increases the total starch content and the proportion of amylose. Transgenic Res. 2013, 22, 1133–1142. [Google Scholar] [CrossRef]
  41. Koch, K. Sucrose metabolism: Regulatory mechanisms and pivotal roles in sugar sensing and plant development. Curr. Opin. Plant Biol. 2004, 7, 235–246. [Google Scholar] [CrossRef] [PubMed]
  42. Stein, O.; Granot, D. An Overview of Sucrose Synthases in Plants. Front. Plant Sci. 2019, 10, 95. [Google Scholar] [CrossRef] [PubMed] [Green Version]
  43. Piro, L.; Flütsch, S.; Santelia, D. Arabidopsis Sucrose Synthase 3 (SUS3) regulates starch accumulation in guard cells at the end of day. Plant Signal. Behav. 2023, 18, 2171614. [Google Scholar] [CrossRef] [PubMed]
  44. Fulton, D.C.; Stettler, M.; Mettler, T.; Vaughan, C.K.; Li, J.; Francisco, P.; Gil, M.; Reinhold, H.; Eicke, S.; Messerli, G.; et al. Beta-AMYLASE4, a noncatalytic protein required for starch breakdown, acts upstream of three active beta-amylases in Arabidopsis chloroplasts. Plant Cell 2008, 20, 1040–1058. [Google Scholar] [CrossRef] [Green Version]
  45. Monroe, J.D.; Breault, J.S.; Pope, L.E.; Torres, C.E.; Gebrejesus, T.B.; Berndsen, C.E.; Storm, A.R. Arabidopsis β-Amylase2 Is a K(+)-Requiring, Catalytic Tetramer with Sigmoidal Kinetics. Plant Physiol. 2017, 175, 1525–1535. [Google Scholar] [CrossRef] [Green Version]
  46. Liang, G.; He, H.; Nai, G.; Feng, L.; Li, Y.; Zhou, Q.; Ma, Z.; Yue, Y.; Chen, B.; Mao, J. Genome-wide identification of BAM genes in grapevine (Vitis vinifera L.) and ectopic expression of VvBAM1 modulating soluble sugar levels to improve low-temperature tolerance in tomato. BMC Plant Biol. 2021, 21, 156. [Google Scholar] [CrossRef]
  47. Elbein, A.D.; Pan, Y.T.; Pastuszak, I.; Carroll, D. New insights on trehalose: A multifunctional molecule. Glycobiology 2003, 13, 17r–27r. [Google Scholar] [CrossRef]
  48. O’Hara, L.E.; Paul, M.J.; Wingler, A. How do sugars regulate plant growth and development? New insight into the role of trehalose-6-phosphate. Mol. Plant 2013, 6, 261–274. [Google Scholar] [CrossRef] [Green Version]
Figure 1. Tea leaves under different shading rates. (A) Phenotypic differences of tea leaves; (B) Chl content; (C) Chla content; (D) Chlb content; (E) carotenoid content. The Y-axis represents the content value (unit: mg/g) (p-value < 0.05). The different letters represent significant differences.
Agronomy 13 01701 g001
Figure 2. Tea plant leaves under different shading rates. (A) Fv/Fm value; (B) Pn, μmol m−2 s−1; (C) Gs, mmol m−2 s−1; (D) Tr, mmol m−2 s−1; (E) Ci, μmol m−2; (F) SS content, mg/g. The Y-axis represents the respective numerical values (p-value < 0.05). The different letters represent significant differences.
Agronomy 13 01701 g002
Figure 3. S0% vs. S30%: (A) The number of DEGs identified; the Y-axis represents the number of DEGs. (B) KEGG enrichment map of DEGs; statistics of the top 20 pathways. S0% vs. S75%: (C) The number of DEGs identified; the Y-axis represents the number of DEGs. (D) KEGG enrichment map of DEGs; statistics of the top 20 pathways.
Agronomy 13 01701 g003
Figure 4. Chlorophyll biosynthesis pathway and related gene expression.
Agronomy 13 01701 g004
Figure 5. Carotenoid biosynthesis pathway and related gene expression.
Agronomy 13 01701 g005
Figure 6. (A) “Photosynthesis (ko00195)” pathway map; (B) “photosynthesis antenna protein (ko00196)” pathway map; (C) expression of “photosynthesis (ko00195)” and “photosynthesis antenna protein (ko00196)” pathways-related genes.
Agronomy 13 01701 g006
Figure 7. Anthocyanin biosynthesis pathway and related gene expression.
Agronomy 13 01701 g007
Figure 8. Starch and sucrose metabolism pathway map.
Agronomy 13 01701 g008
Figure 9. qRT-PCR verification of RNA-seq data. The left side represents the FPKM value of RNA-seq data, and the right side represents the relative expression level of qRT-PCR. In the figure, the column represents RNA seq data and the line represents qRT-PCR.
Agronomy 13 01701 g009
Table 1. Light intensity (PAR) data under different processing conditions on the day of sampling. The different letters represent significant differences.
TreatmentsShaderate (%)PAR (μmol m−2 s−1)
S0%0%1073.33 ± 10.08 a
S30%30%444.67 ± 10.21 b
S75%75%155.33 ± 5.91 c
Disclaimer/Publisher’s Note: The statements, opinions and data contained in all publications are solely those of the individual author(s) and contributor(s) and not of MDPI and/or the editor(s). MDPI and/or the editor(s) disclaim responsibility for any injury to people or property resulting from any ideas, methods, instructions or products referred to in the content.