Abstract
The plant disease recognition model based on deep learning has shown good performance potential. However, high complexity and nonlinearity lead to the low transparency and poor interpretability of such models. These limitations greatly limit the deployment and application of such models in field scenarios. To solve the above problems, we propose a dense caption generative model, Veg DenseCap. This model takes vegetable leaf images as input and uses object detection technology to locate abnormal parts of the leaf and identify the disease results. More importantly, it can describe the disease features it sees in natural language, and users can judge whether the relevant features are semantically consistent with human cognition based on these descriptions. First of all, a dataset containing Chinese feature description statements for images of 10 leaf diseases involving two vegetables (cucumber and tomato) was established. Secondly, Faster R-CNN was used as a disease detector to extract visual features of diseases, and LSTM was used as a language generator to generate description statements for disease features. Finally, the Convolutional Block Attention Module (CBAM) and the Focal Loss function were employed to overcome the imbalance between positive and negative samples and the weak performance of Faster R-CNN in obtaining key features. According to the test results, the Intersection-over-Union (IoU) and Meteor joint evaluation index of Veg-DenseCap achieved a mean Average Precision (mAP) of 88.0% on the dense captioning dataset of vegetable leaf disease images, which is 9.1% higher than that of the classical FCLN model. The automatically generated description statements are characterized by advantages of accurate feature description, correct grammar, and high diversity.
1. Introduction
Vegetables contain high concentrations of vitamins, antioxidants, minerals, and dietary fibers but low levels of fat, soluble sugar, and calories, making them an important part of a healthy diet [1,2]. China is an important country in vegetable cultivation, with an annual production of about 50% of the world’s total. In recent years, China’s vegetable planting area has reached 21.485 million hectares, accounting for 14.82% of the country’s total planting area of crops [3]. Meanwhile, China is also one of the countries suffering the most serious crop diseases in the world, with more than 700 kinds of diseases occurring all year round. These diseases have a wide distribution range, high frequency of occurrence, and strong suddenness, resulting in economic losses exceeding CNY 200 billion annually. Rapid and accurate recognition of vegetable diseases is the first step to take effective prevention and control measures to stop losses in time. However, the traditional disease recognition methods are generally limited by low speed, high subjectiveness, and high misjudgment rate, and cannot meet the needs of modern agricultural production.
Deep learning is a neural network that simulates the analysis and learning processes of the human brain. It aims to aggregate low-level features to form more abstract high-level representation attribute categories or features to discover the distributed feature representation of data, so as to solve complex pattern recognition problems. Recently, deep learning technology has been gradually applied to the field of plant disease detection, and has become a research hotspot with the achievement of more and more positive outcomes. Although plant disease recognition methods based on deep learning have shown great potential in the detection efficiency, accuracy, stability, and portability, their limitations are notable as well. These type of methods often cannot provide the mapping relationship between features in the disease image (e.g., color, shape, and texture) and the text semantics, making it impossible for users to understand the logical relationship between the visual features of diseases and the detection results, so that the disease diagnosis generated cannot be fully trusted and accepted. In the practice of field disease recognition, the output of the model should be explicitly understood by users in order to make it truly effective in assisting users in disease diagnosis. In other words, an ideal disease recognition model should be able to describe the disease features it “observes” in natural language, so as to allow users to make their own judgement based on the output of the model. Unfortunately, this ability is exactly what the existing models lack.
In order to establish a trust relationship between users and the disease recognition model, it is necessary to enhance the transparency and interpretability of the current models. Revealing the “black box” of deep learning still requires more support from mathematical theories in the future, and it is difficult to achieve considerable breakthroughs in the short term. Nevertheless, we may improve the interpretability of the model from another perspective, that is, to let the model “tell” the disease features it “observes” in the image in natural language. If these features are semantically consistent with human judgment, it would help build a trust relationship between users and the model. For this purpose, automatic image captioning technology can be used to analyze the visual content in the image and generate the corresponding text description. This technology has been widely used in the areas of image retrieval [4,5], medical diagnosis [6,7], automatic image labeling [8,9], and vegetable disease assistant diagnosis, and has attracted increasing attention and gradually become a new research hotspot. Gu et al. [10] proposed a cross-modal image retrieval method based on the contrastive self-supervised learning method, Deep InfoMax, which improved the retrieval performance of the model by adjusting the feature distribution of the text mode, image mode, and fusion mode. Zeng et al. [11] proposed an ultrasound image captioning method based on region detection, which uses a region detector to detect the focus area in the image and then uses a Long Short-Term Memory (LSTM) network to decode the information obtained to generate the labeling text of the focus area. The test results showed that the mAP of this method was about 75.4%, while its BLEU1 and BLEU2 were both increased by 1.0%. Liu et al. [12] proposed a hierarchical feature fusion attention network for medical diagnosis, and the experimental results showed that this model was able to generate grammatically correct and fluent description statements. Yang et al. [13] proposed a pixel-level automatic labeling method for detecting forest fire images, which uses the convex hull algorithm to reasonably select fire-affected areas and non-fire-affected areas in polygonal shapes. The experiment and analysis results showed that this method could effectively label forest fire images and videos at the pixel level. Mamat et al. [14] proposed an automatic annotation method for fruit images based on YOLOv5, and experiments showed that the method can achieve accurate annotation on fruit images. Aiming at the problem that the existing plant disease detection methods cannot provide detailed information on disease spots, Fuentes et al. [15] proposed a model that can not only locate the disease spot location, but also generate the relevant symptom description information. The test results showed that the mAP of this model reached 92.5%.
Image captioning technology, which has achieved impressive breakthroughs in other fields, provides a feasible approach to improve the interpretability of disease recognition models, but there are still problems when applying this technology directly to the field of vegetable diseases. First of all, the research on image captioning for vegetable diseases is still in its infancy, and there is currently a lack of public datasets for the relevant research. Secondly, because the color, shape, texture, and other features of the disease spots may change greatly with time, there are large intra-class differences but small inter-class differences between features of different diseases, making it difficult to accurately distinguish and describe these features. Finally, the process of detecting key regions in the disease image is subjected to a serious problem of unbalanced distribution between positive and negative samples, which may affect the detection precision. Therefore, in this paper, a dense captioning model for vegetable leaf disease images, namely, Veg-DenseCap, was proposed to generate sentences to describe the disease features the model “observes” in the image (Figure 1). This model provides semantic interpretation for the detection results to improve the transparency of its decision-making process. The model is composed of two parts. First, a two-stage target detection network is used as the encoder to extract the features of the region of interest. Second, the regional features extracted by the encoder are used as input, and then an LSTM network is used to generate disease symptom description statements and to output the disease category label at the same time.
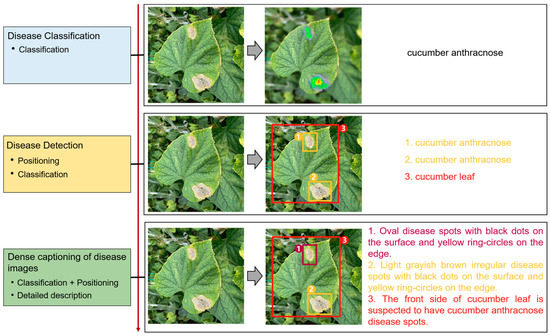
Figure 1.
Dense captioning of vegetable leaf disease images.
The main contributions of this paper are summarized as follows:
(1) A dense captioning dataset of vegetable leaf disease images was constructed, which contained 10 types of diseased leaves in two vegetables (tomato and cucumber), and was used to train and evaluate image dense captioning models. To our best knowledge, this is the first dataset of its sort in the vegetable disease recognition field.
(2) A model suitable for dense captioning of vegetable leaf disease images, namely, Veg-DenseCap, was proposed to generate description statements of disease features. It can provide auxiliary interpretation to help users understand the recognition results. This model uses a Faster R-CNN network as feature extractor to extract visual features, and uses a LSTM network as language generator to generate description statements.
(3) According to the task to be addressed in this paper, we optimized the Faster R-CNN network by considering its unique features and the specialty of our datasets. Specifically, the Convolutional Block Attention Module (CBAM) mechanism and Focal Loss were incorporated into the Faster R-CNN network to improve the ability of the model in capturing distinguishable features of the target and to alleviate the distribution imbalance between positive and negative samples.
2. Related Work
This paper drew on the recent achievements in the research of image captioning, target detection, and attention mechanism, which provides a technical basis for the detection of specific regions in the image and the generation of description texts.
2.1. Image Captioning
To date, a range of methods have been explored for the task of image captioning. These methods can be generally divided into two types according to the purpose of the task, namely, overall image captioning and dense image captioning. Overall image captioning is to generate a description statement for the entire image. At present, the mainstream methods of overall image captioning are based on the encoder–decoder framework, in which the encoder usually uses the deep convolutional neural network to extract image features and the decoder uses the RNN network to generate the description statement. For example, Vinyals et al. [16] proposed the NIC network model for image captioning in 2015. As the origin of the coder–decoder framework for the task of text generation from images, the NIC model uses the deep convolutional neural network GoogLeNet [17] to extract image features, which are then input into LSTM as the initial words to generate description statements. Xu et al. [18] further incorporated the attention mechanism for generating description text in order to change the degree of attention of the model to the target object. Huang et al. [19] proposed an Attention-to-Attention (AoA) module, which is applied to both the encoder and decoder to obtain the relationship between different objects in the image and filter out irrelevant content, so as to improve the smoothness of image captioning. Cornia et al. [20] proposed a Transformer-based structure to generate image captions. In this approach, the authors augment visual features with a set of memory vectors in a self-attention mechanism at each encoder layer.
The task of dense image captioning (as shown in Figure 2) is based on image classification, target detection, and overall image captioning. Its purpose is to detect a group of local regions of interest in the image and generate the feature description text for each region. Johnson et al. [21] proposed an architecture of full convolutional location network (FCLN), which is composed of the convolutional neural network, a new dense positioning layer, and the recursive neural network for generating description text, and applied this architecture to dense image captioning tasks. Yang et al. [22] designed a network structure combining joint inference and contextual analysis by employing the Faster R-CNN network to obtain local regions of interest. By using both global and local features in the image, this method effectively improved the quality of image captioning.
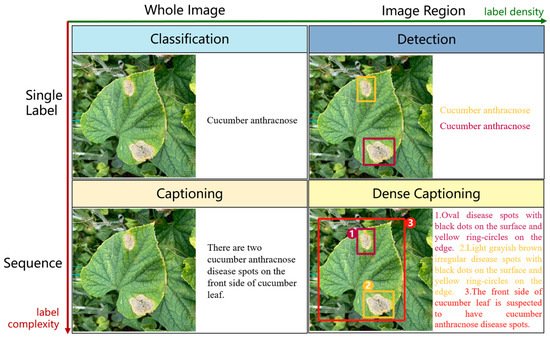
Figure 2.
Dense image captioning task (lower right).
2.2. Target Detection Model
With deep learning technology being widely applied to various computer vision tasks, methods based on convolutional neural network are now playing a leading role in target detection. In the meantime, the network structure of such methods is constantly innovating. The R-CNN model [23] is the first target detection model based on convolutional neural network. It uses the Select Search algorithm [24] first to extract the region proposal box, which serves as a potential bounding box, and then rescales each proposed region to a fixed size to extract features using the CNN model. Finally, the support vector machine is used to carry out bounding box regression and category prediction, and the Non-Maximum Suppression (NMS) algorithm [25] is used to remove duplicate bounding boxes to obtain the final result. Fast R-CNN [26] and Faster R-CNN [27], as improved versions of R-CNN, further improved the target detection performance and speed. Specifically, Fast R-CNN is incorporated with the RoI pooling layer so as to support end-to-end training. With establishment of a Region Proposal Network (RPN) structure, Faster R-CNN can generate region proposals more efficiently and accurately. All the R-CNN series models aforementioned are called two-stage target detection algorithms. In two-stage algorithms, the first stage is to generate a group of region proposals, while the second stage is to further classify and optimize these region proposals. Unlike two-stage algorithms, YOLO and SSD are one-stage detection methods, and their detection speed is therefore faster. For example, the latest model of the YOLO series, YOLOv7 [28], has reached the detection speed of 171 FPS. The developer of YOLO abandoned the region proposal part and applied a single neural network to the whole image to obtain the region of interest through a series of convolutions. In comparison, SSD employs the multi-reference, multi-resolution detection technique, which greatly improves the detection precision of first-stage detection, especially for small objects. In the development of target detection technology, feature extractors and feature fusion modules have also been improved, and they are playing a significant role in the field of target detection.
2.3. Vegetable Disease Recognition
Deep learning technology provides a new solution idea for vegetable disease diagnosis, and it has been extensively explored by researchers in the field of disease recognition. Picon et al. [29] fused the contextual information into the convolutional neural network by the cascade method to identify 17 diseases, and the precision reached 98% on the test set. Zhao et al. [30] proposed a convolutional network based on inception and the residual structure, which was embedded with an improved convolutional block attention module, to identify leaf diseases. The experimental results showed that this method could effectively detect leaf diseases with a precision of 99.55%. Gulzar [31] proposed TL-MobileNetv2 network to classify 40 fruits, and the experimental results showed that the network can effectively classify fruits with 99% recognition accuracy. Zhang et al. [32] proposed an MF3 R-CNN model for detecting soybean leaf diseases in a real environment. The backbone network of this model, ResNet50, was added with jump links for feature fusion to improve the detection performance, and the results showed that this method achieved a better precision in soybean leaf disease detection. Li et al. [33] proposed a cucumber leaf disease detection model based on YOLOv5 by combining the CA attention mechanism, Transformer, and the feature fusion idea. The test results showed that this MTC-YOLOv5n model achieved a balanced performance between detection precision and speed, with the mAP reaching 84.9% and the FPS reaching 413. Li et al. [34] proposed an improved vegetable disease recognition algorithm based on YOLOv5s, which effectively increased the detection performance of YOLOv5s by making improvements to CSP, FPN, and NMS. The test results suggested that this algorithm had a mAP of 93.1%, able to meet the general recognition requirements. Although the research efforts above have achieved satisfactory results, they can only provide the bounding box representing the disease location and the label information representing the disease type, but not the description of visual disease diagnosis in natural language, so that the users cannot judge whether the disease-related features extracted by the model are semantically consistent with human perception. Therefore, in this paper, we incorporated the image dense captioning method into the disease detection task. While detecting and locating vegetable disease spots, our method can also provide the natural language description of disease-related features in order to help users judge the disease recognition results. By taking the image as input and the text description of disease features as output, we hope to build a trust relationship between users and the model.
3. Materials and Methods
3.1. Datasets
3.1.1. Data Acquisition and Labeling
The datasets used in this paper were sourced from the Xiaotangshan National Precision Agriculture Demonstration Base of China and the Langfang Base of the Chinese Academy of Agricultural Sciences. The self-collected datasets contained a total of 5090 images including leaf images of 10 types of diseases (i.e., tomato powdery mildew, tomato early blight, tomato late blight, tomato leaf mold, tomato gray mold, cucumber powdery mildew, cucumber target spot, cucumber downy mildew, cucumber gray mold, and cucumber anthracnose), as well as leaf images with mixed occurrence of two diseases (Table 1). In order to cover all kinds of lighting conditions in the field environment as far as possible, the images were captured at three different time periods of a day (i.e., morning, 7:00–8:00; noon, 11:00–12:00; evening, 17:00–18:00) and from different angles, and were included with complex backgrounds. The location of image collection was a greenhouse.

Table 1.
Number of images in the datasets.
To provide text description on the region of interest, labeling was used in this paper to label our datasets by referring to the labeling method for target detection. The format of the file with labeling information was “.xml”. To meet the format requirement of the model input, we refer to the dense caption dataset (Visuanl Genome) format using a Python script written by ourselves to convert the label file to “.json” format. In order to avoid the monotony of the generated text description statements due to a single text description style, we omitted part of the feature words and function words, and engaged 5 plant protection experts and 5 experienced vegetable growers in the labeling process. The plant protection experts were to help ensure the accuracy and standardization of the captioning texts, while the vegetable growers were to help increase the generality and diversity of the texts. An example of image labeling is shown in Table 2.
Table 2.
Example of image text labeling.
3.1.2. Data Preprocessing
Because there was a large difference in the number of images among different diseases, we carried out offline enhancements (flipping, color/contrast/brightness adjustment, etc.) on the images of those diseases with a small sample size. After enhancement, we obtained a total of 12,215 images in the final datasets (see Table 3 for the specific number of images for each type of disease). Since the images were collected from different devices including mobile phones and digital cameras, it was necessary to standardize the original images into a uniform size, which was set to 640 × 640 pixels. Finally, the images in the datasets were divided into the training set, validation set, and test set according to the ratio of 7:2:1.
Table 3.
Number of images after enhancement.
All text descriptions of the disease images were short sentences. These sentences needed to be processed by word segmentation, word-list construction, and text vectorization before entering into the network. The Jieba word segmentation tool was used to delete words that appeared less than 4 times. The length of text vectorization was set to 48 characters, and any original text shorter than this length would be supplemented with 0.
3.2. Construction of Veg-DenseCap
In this paper, a dense captioning model for vegetable disease images, namely, Veg-DenseCap, was proposed. This model is composed of two parts. The first part is a region-based convolutional neural network detector, which is used as the encoder to extract features of the region of interest including shape and color. The second part is a language generator, which is used as the decoder to generate text description statements with symptom details by taking the extracted features as the input. The structure of Veg-DenseCap is shown in Figure 3 and its working process is as follows.
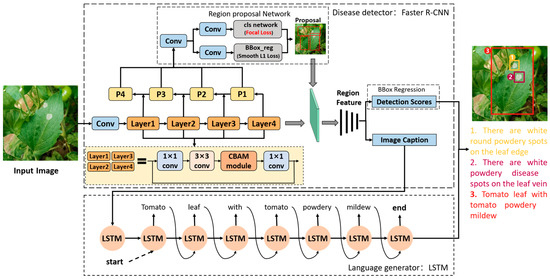
Figure 3.
Structure of the Veg-DenseCap model.
- (1)
- First, the disease detector extracts the features of a lesion in the image through feature extraction network, region proposal network.
- (2)
- Second, the extracted lesion features are applied to bounding box regression and text generation, respectively.
- (3)
- Finally, the bounding box and the generated text description sentences are matched and displayed in the image, and the user can judge whether the relevant features are consistent with the semantics of human cognition based on the generated lesion features.
3.2.1. Disease Detector
In the Veg-DenseCap model, the disease detector is responsible for detecting diseased regions and extracting features in the regions of interest. Referring to the encoder part of the FCLN model [21], we chose the Faster R-CNN network as the disease detector, which is a two-stage detection model. In the first stage, RPN takes the image feature mapping as the input to generate region proposals, while in the second stage, the region proposal feature vector is input into the classifier and regressor for boundary prediction and classification.
ResNet101+FPN. In this study, our datasets contained a range of different diseased leaves, which exhibited varying shapes and sizes of disease spots. In the process of image collection, due to the differences in shooting heights and angles, the sizes of disease spots in the image presented with multi-scale characteristics, and different diseases might show similar features. Therefore, how to deal with the multi-scaling problem during feature extraction is one of the key factors that affect the recognition precision. The original Faster R-CNN model only uses ResNet50 as the backbone network for feature extraction. ResNet50 is constructed by a 3 × 3 convolutional kernel, which can lead to the problem that targets of different sizes will have the same receptive field, thereby causing the loss of certain features. In addition, the ResNet50 network is relatively shallow, which is prone to incomplete feature extraction, producing a negative impact on the feature detection results for the region of interest. Thus, in this paper, ResNet101 was chosen as the backbone network to extract the features of disease spots, and the Feature Pyramid Network (FPN) was used for multi-scale feature fusion to improve the overall recognition precision. The structure of ResNet101+FPN is shown in Figure 4.
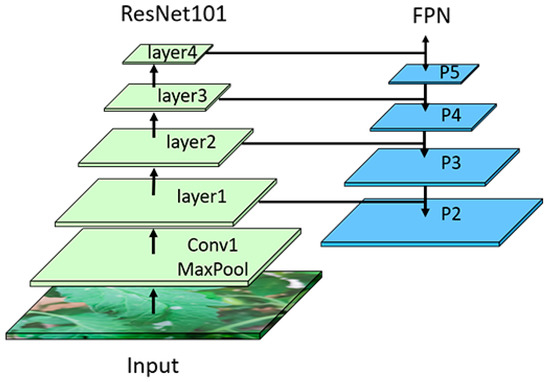
Figure 4.
Backbone network ResNet + FPN.
Convolutional Block Attention Module (CBAM). In the human visual system, the sensory system is able to screen out useful information and ignore irrelevant information. This behavior is known as the human brain attention. Inspired by this mechanism, researchers have proposed various attention mechanisms, which have been widely used in the field of computer vision. The nature of the attention mechanism is to distinguish key features from non-key features by applying more weights to the parts with higher levels of interest in the model, so as to help the model focus on the features in the region of interest. This is conducive to extracting key information and making more precise judgments. All the data in this paper were collected in the field environment, and the image backgrounds contained a variety of interference factors such as soil, water pipes, plastic films, fallen leaves, etc. These factors might easily exert adverse effects on the extraction of disease features. The use of the attention mechanism can make up for this deficiency of the convolutional neural network. The visual attention modules currently in use can be roughly divided into the channel attention modules, spatial attention modules and channel spatial attention modules. The channel attention modules and spatial attention modules can only refine features along the channel or spatial dimension, which limits their flexibility in learning the attention weights that change with the channel and space. The model we intended to build in this paper needed to take into account both spatial information and channel information, so we decided to add a channel spatial attention module, i.e., the CBAM [35], to the residual structure in order to guide the model to focus on key regions of the image. The optimized residual module is shown in Figure 5a. CBAM takes into account both spatial attention and channel attention. Its specific structure is shown in Figure 5b. In CBAM, the input feature is sequentially multiplied by the output of the channel attention module and the output of the spatial attention module. In the channel attention module, the feature F first aggregates the spatial information of the feature map through operations of the average pooling layer and maximum pooling layer to generate two different spatial context features, namely, the average pooling feature and the maximum pooling feature. Then, the average pooling feature and the maximum pooling feature further generate the channel attention feature () through a shared network called Multi-Layer Perceptron (MLP). In the spatial attention module, same as the channel attention module, the channel feature is first aggregated along the channel direction through the maximum pooling layer and the average pooling layer, and then the two-dimensional spatial attention feature () is generated through a standard convolution layer. Finally, the feature F multiplies with and , respectively, to obtain the output feature O. The formula of CBAM can be expressed by Equations (1)–(3) as follows:
where , MLP, Conv2d and O refer to the sigmoid activation function, the MLP, the convolution layer, and the final output, respectively.
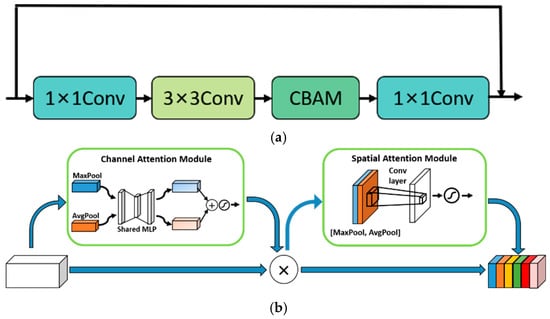
Figure 5.
The optimized residual module and CBAM. (a) Optimized residual module, Conv is a convolutional layer; (b) CBAM [35].
Focal Loss. In addition to the above challenge raised by feature extraction, the training process of vegetable leaf disease recognition faces the problem of unbalanced distribution between disease categories, especially in the part of RPN. In the training process of RPN, the model will generate tens of thousands of anchors according to the preset parameters. After bounding box regression and classification, there are only 2000 region proposals left, which will cause a serious imbalance between positive and negative samples, thereby leading to a significant impact on the final region proposals. The classification loss function of the original RPN is a cross-entropy loss function, as shown in Equation (4):
For multiple samples, the cross-entropy loss function can be expressed as:
where m refers to the number of positive samples; n refers to the number of negative samples; and N refers to the total number of samples. It can be seen from Equation (5) that, when the number of negative samples is far greater than the number of positive samples, negative samples will dominate the loss, leading to a result inclined to negative samples, so that the model’s performance on positive samples is relatively weak. In view of the nature of RPN, the number of negative samples is far greater than the number of positive samples, exerting a negative impact on the quality of model training. Therefore, in order to solve this imbalance problem, we chose the Focal Loss function to reduce the proportion of loss of a large number of samples. Focal Loss is the cross-entropy loss of dynamic scaling, which can be expressed as:
where refers to the weighting factor that balances between positive and negative samples; refers to the prediction probability of positive samples; γ ≥ 0 is an adjustable focus parameter. As shown in Equation (6), for samples that are easily distinguishable, Focal Loss will reduce their loss weights, making the model pay more attention to samples that are difficult to distinguish. Through the loss of dynamic scaling, the model can avoid the situation that the loss is dominated by samples with a large number, so as to overcome extreme imbalance between positive and negative samples in the RPN.
3.2.2. Language Generator
The language generator is used to generate description statements containing the disease feature information. In this paper, LSTM was used as the language model to generate description text. LSTM can solve the short-term memory problem of recurrent neural network (RNN) to some extent by making improvement to the RNN. Each neural unit in LSTM contains an input gate, a forgetting gate and an output gate. These gates provide the ability of long-term memory to the model so as to better deal with problems highly related to the time series. The unit network structure of LSTM is shown in Figure 6.
 where refers to the memory state of the previous moment; refers to the hidden state of the previous moment; and refer to the memory state and hidden state of the current moment, respectively; σ refers to the sigmoid activation function; and tanh refers to the tanh activation function. The hidden state at t − 1 and the input at t are superimposed, which will derive a new memory state after passing through the forgetting gate and the input gate, as shown in Equation (7) as follows:
Figure 6.
The language generator LSTM.
After the new memory state passing through the sigmoid activation function, the output of the current state will be determined by the output gate. The activation function tanh controls the updated value of within the range of [−1,1] to prevent gradient explosion. Thus, at this moment can be calculated by Equation (8).
3.2.3. Loss Function
In this paper, the loss function consists of the detection loss ) and the captioning loss (), and further consists of the classification loss () and the bounding box regression loss (), as shown in Equation (9).
where and refer to the bounding box regression loss and the classification loss in the RPN, respectively; and refer to the bounding box regression loss and the classification loss in the second stage of Faster R-CNN, respectively. In this paper, the weight coefficients α and β were both set to 1.0.
4. Experiment and Analysis
All the tests were carried out in the Ubuntu 20.04 environment. The hardware configuration is as follows: processor Intel Xeon (R) Gold 6248R; memory 256 G; graphics card GeForce RTX 3090 24 G; CUDA version 11.4. In our proposed model, the training for the detection task was based on a learning rate of and the training for the image captioning task was based on a learning rate of . The Adam optimizer with weight_decay of 0.0005 was used to update the weights. The IoU threshold in the RPN part of the disease detector is set to 0.7, and the hidden layer dimension in the language generator LSTM is 512. In the process of experiment design and comparison, the network batch-size of the training set and the validation set was both set to 16, while the batch-size of the test set was set to 8. The epoch of all network models was set to 300.
4.1. Evaluation Indicators
In this study, mAP was used to comprehensively evaluate the precision of the model in terms of positioning and captioning, and Det_mAP was used to evaluate the degree of matching between the prediction box and the real box. According to the specific characteristics of the detection task, mAP and Det_mAP were both determined by the IoU threshold of [0.3,0.4,0.5], while the language accuracy was determined by the Meteor threshold of [0,0.05,0.1,0.15,0.2]. The average precision (AP) of all pairs of these thresholds was measured to further calculate the mAP.
4.2. Quantitative Analysis
In this section, the self-built dense captioning datasets of vegetable leaf disease images was used to evaluate the Veg-DenseCap model by quantitative analysis in terms of mAP and Det_mAP, in order to prove the validity of the model. Then, ablation test was carried out to test the effectiveness of each component.
4.2.1. Comparison between Different Models
The FCLN model, the model in Literature [15], and the dense captioning model combing joint inference and visual context fusion (JIVC) were used as controls for the evaluation of our proposed model. The test results are shown in Table 4.
Table 4.
Results of different models.
The evaluation results on the effectiveness of Veg-DenseCap on the dense captioning datasets of vegetable leaf diseases compared with FCLN, the model in Literature [15], and JIVC are shown in Table 3. It can be concluded that the Veg-DenseCap model delivered the best performance, with its mAP and Det_mAP reaching 88.0% and 91.7%, respectively, which was improved by 9.1% and 9.0% compared with the second-best performing model, FCLN. It further indicated that Veg-DenseCap was more conducive to solving the problem of low trust of planters in the model, and enhanced the interpretability and transparency of the model from another perspective.
4.2.2. Ablation Test
In order to further prove the effectiveness of our optimization scheme, an ablation test was performed according to the following scheme: the model with the backbone network of ResNet50 was named Scheme 0; the addition of ResNet101 as the backbone network on the basis of Scheme 0 was named Scheme 1; the addition of FPN on the basis of Scheme 1 was named Scheme 2; the addition of CBAM on the basis of Scheme 2 was named Scheme 3; the addition of Focal Loss on the basis of Scheme 3 was named Scheme 4 (i.e., the Veg-DenseCap model). The combinations of methods used in different schemes are shown in Table 5, and the ablation test results are shown in Table 6.
Table 5.
Ablation test design. √ indicates the use of the module, - indicates that the module is not used.
Table 6.
Ablation test results.
From the data in Table 6, it can be seen that all components have positive effects on the performance of the Veg-DenseCap model. First, the model is supposed to generate detailed description texts of diseases, which require the extraction of comprehensive image features, and ResNet101 has a good effect on this purpose. Second, the multi-scale feature fusion module has improved the ability of the model in capturing features of targets with different sizes, and it increases the mAP and Det_mAP of the model by 2.9% and 4.2%, respectively. Third, the images used in this study were collected in the field environment and contained complex backgrounds and many non-key features. CBAM can effectively guide the model to focus on the key disease features in the image, making the mAP and Det_mAP increase by 2.3% and 2.1%, respectively. Lastly, when generating region proposals, the RPN in the Faster R-CNN network faces the problem of imbalance between positive and negative samples. The use of Focal Loss can help alleviate this problem, which also improves the effect of the model to a certain extent.
4.2.3. Comparison between Different Attention Mechanisms
In order to evaluate the impact of different attention mechanisms on our model, we compared the effects between SE, SimAM, CA, ACmix and CBAM, and the results are shown in Table 7.
Table 7.
Comparison between different attention mechanisms.
As shown in Table 7, compared with other attention mechanisms, CBAM delivered the best performance by improving the mAP and Det_mAP by 88.0% and 91.7%, respectively. The increase in mAP achieved by CBAM was 1.5%, 1.1%, 3.0%, and 5.7% higher relative to SE, SimAM, CA, and ACmix, respectively. SE, as a channel attention mechanism, does not take into account spatial information and adopts the compression operation for channel information, so its performance is not good enough. SimAM and CA are spatial channel attention mechanisms, but they are lightweight attention mechanisms and are not suitable for our task. Acmix has the worst performance, mainly because it integrates convolution and self-attention, which makes the model pay more attention to global features. However, in the detection task under complex background, background content needs to be ignored as much as possible. Therefore, Acmix to global features leads to its worst effect in this study. It test results are both lower than that of CBAM.
4.3. Qualitative Analysis
From Table 4, it can be seen that the Veg-DenseCap model had higher mAP and Det_mAP than all the control models in terms of image captioning for vegetable leaf diseases. In this section, a qualitative analysis of the model was carried out by visualizing the results of Veg-DenseCap, FCLN, JIVC and the model in Literature [15] on the test set, and the results are shown in Figure 7.
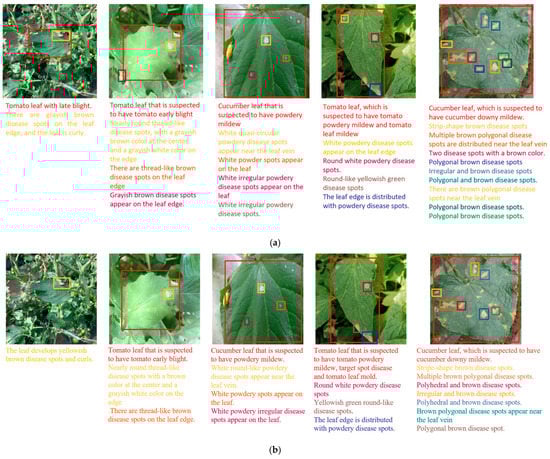
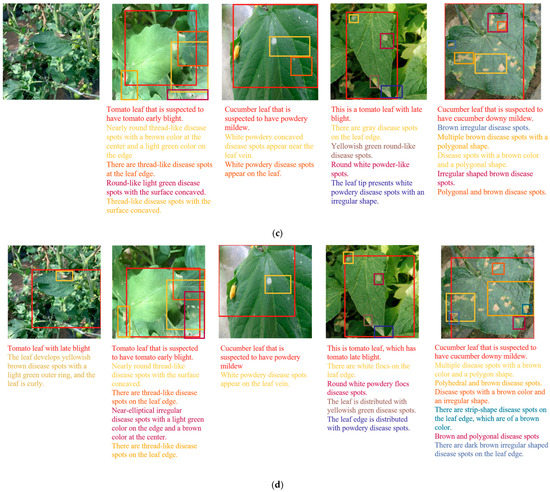
Figure 7.
Captioning results of different models. (a) Veg-DenseCap; (b) FCLN; (c) JIVC; (d) model in Literature [15].
The comparison between different image dense captioning algorithms shows that:
(1) Compared with the control models, Veg-DenseCap had the best positioning performance, while FCLN, JIVC, and the model in Literature [15] all encountered the problems of missed detection and oversized positioning area. The main reason leading to missed detection is the small target size, and the detector has a weak ability in extracting features of small targets, resulting in missed detection in the process of positioning. Missing detection will cause the text generator to fail to obtain relevant features for generating descriptive statements, which will have a large negative impact on the model. Further, the cause of oversized positioning area is that the disease spots are densely distributed, making the model unable to distinguish a single target. This will cause the users to be unable to identify which disease spot the text description is aimed at, and cannot help the planters to better identify the disease type.
(2) In terms of image captioning, Veg-DenseCap also delivered a good performance. In comparison, FCLN, JIVC, and the model in Literature [15] had the problem that the text information was not successively generated for some disease spots due to missed detection. The main reason is that, when there are complex backgrounds, these models cannot extract distinguishable disease features and leaf features for small targets, so that the language generator fails to generate the relevant text information. In order to further evaluate the quality of the generated text, we ignored the images for which the text could not be generated. From the test results as shown in Figure 7, it can be seen that the generated text could accurately describe the key features of disease spots and our model could properly classify the disease spots. By comparing the texts generated for different images, it is found that the texts had a high degree of diversity, which is closely related to the fact that the labeling of certain features was intentionally omitted.
(3) For the problem to be solved in this study, the dense caption generation model can visually reflect the basis for determining the disease type through positioning and description statements, which can better assist users in determining the disease type and increase the user’s trust in the model. The analysis of the test results in Figure 7 concludes that the Veg-DenseCap model is more accurate in locating disease spots and is clearer and more accurate in describing the features on which the disease type is based. The model can more accurately “tell” the relevant features of the disease in the image it sees, and thus build a bridge of trust between the user and the model.
5. Discussions
The datasets used in this study contained only the diseased leaf images with obvious features selected by manual screening, and 99.98% of the images involved only one disease category. In the field environment, the dense captioning for vegetable leaf disease images is still a tough task, mainly due to the following three reasons.
(1) Vegetable leaves may present different kinds of disease spots. Affected by the planting environment, one vegetable plant may be infected with multiple leaf diseases, and the leaf may show features of different diseases. When some diseases have similar features, especially when the disease spots are overlapped, it will affect the model in extracting visual features and generating text descriptions, thereby reducing the precision of positioning and image captioning. Therefore, it is necessary to enhance the learning ability of the model to the characteristics of mixed diseases by expanding the leaf data of mixed diseases, strengthen the ability of the model to extract different disease features and the detection ability of the edge pixels of disease spots, so as to improve the model’s ability to identify mixed diseases.
(2) The actual image backgrounds are highly complex. Although we reproduced the real backgrounds of the plants as far as possible in the process of image collection, in reality, the diseased leaf images may contain more interference factors, such as leaves of other plants, soil, stems, flowers, and interference from light intensity. These complex background conditions will seriously affect the positioning and captioning quality of the model. Therefore, it is necessary to adopt methods such as attention mechanism to eliminate the negative influence of the background on the extracted features and help the model to obtain more accurate lesion features.
(3) It is difficult to distinguish early features of diseases. The color, shape, and texture of disease spots are the key visual features for distinguishing different disease types. In the early stage, some similar disease spots may present similar features. For example, the color is often faded green or light yellow, the shape is often circular, and the texture is often unclear. With the development of diseases, the features of different disease spots will gradually become distinguishable. Therefore, the method proposed in this paper still has obvious limitations in image captioning for early diseases.
6. Conclusions
In order to build a trust relationship between users and the disease recognition model, a dense captioning model for vegetable leaf disease images, namely, Veg-DenseCap, was proposed in this paper. This model is able to generate natural language descriptions with semantic information for the relevant visual disease features in the image. These descriptions are to help users determine whether the output of the model is consistent with human judgement, so as to improve the credibility of the model without affecting its precision. The proposed model is composed of a disease detector and a language generator. The disease detector uses Faster R-CNN to extract and encode the features containing the visual disease information, and the language generator uses LSTM to decode the image features and generate semantic description statements. Targeting at the multi-scaling problem of disease spots, the difficulty in distinguishing features with complex backgrounds and the imbalance between positive and negative samples, we improved the disease detector Faster R-CNN from three perspective. Firstly, a large depth ResNet101 was selected as the backbone network and a feature pyramid FPN was added to improve the encoder’s ability to extract features and fuse multi-scale features. Secondly, a CBAM was embedded to enhance the ability of the disease detector to focus on key features. Finally, Focal Loss was used to alleviate the imbalance between positive and negative samples of the disease detector. The test results show that the mAP and Det_mAP of the Veg-DenseCap model, which is based on the optimized Faster R-CNN as the disease detector, reached 88.0% and 91.7%, respectively. Compared with the classical model FCLN, the mAP and Det_mAP was increased by 9.1% and 9.0%, respectively. By visualizing the test results, it is further found that the Veg-DenseCap model was able to precisely generate natural language descriptions for the visual features in disease images. The generated sentences were grammatically correct and had a high degree of diversity. Such semantic description of visual features can facilitate users to understand the basis of the model for decision-making, so as to build a trust relationship between users and the model.
Although Veg-DenseCap achieved excellent results in our task, in practice, it still has the following shortcomings. First, when one vegetable plant has multiple diseases and present different features simultaneously on one leaf, the generated description statements may not match with the actual features of disease spots. Second, when the images contain too many interference factors, the model is prone to false detection and missed detection. In response to the above limitations, future research can be conducted from the following aspects: Through technical means, more images of mixed diseases can be automatically obtained, and at the same time, the inter-class detection ability of the model can be improved to meet the practicability of the model when multiple diseases are mixed. Improve the model’s ability to detect fine-grained features of diseased leaves in complex backgrounds, and meet the practicability of the model in complex backgrounds.
Author Contributions
W.S.: Writing—Original draft preparation; C.W.: Methodology; J.G.: Software; X.S.: Writing—Reviewing and Editing; J.L.: Investigation; F.L.: Data curation. All authors have read and agreed to the published version of the manuscript.
Funding
This research was funded by National Science and Technology Innovation 2030—“New Generation Artificial Intelligence” Major Project under grant number 2021ZD0113604, and in part by the China Agriculture Research System of MOF and MARA under grant number CARS-23-D07, and in part by the National Natural Science Foundation of China under Grant 62106065, and in part by the Natural Science Foundation of Hebei province, grant number F2022204004.
Data Availability Statement
The data presented in this study are available on request from the corresponding author.
Acknowledgments
We are grateful to our colleagues at Hebei Key Laboratory of Agricultural Big Data for their help and input, without which this study would not have been possible.
Conflicts of Interest
The authors declare no conflict of interest.
References
- Dong, J.; Gruda, N.; Li, X.; Cai, Z.; Zhang, L.; Duan, Z. Global vegetable supply towards sustainable food production and a healthy diet. J. Clean. Prod. 2022, 369, 133212. [Google Scholar] [CrossRef]
- Głąbska, D.; Guzek, D.; Groele, B.; Gutkowska, K. Fruit and vegetable intake and mental health in adults: A systematic review. Nutrients 2020, 12, 115. [Google Scholar] [CrossRef] [PubMed]
- National Bureau of Statistics of China. 2021 China Statistical Yearbook; China Statistics Publishing Society: Beijing, China, 2021.
- Ma, J.; Pang, S.; Yang, B.; Zhu, J.; Li, Y. Spatial-content image search in complex scenes. In Proceedings of the IEEE/CVF Winter Conference on Applications of Computer Vision, Snowmass Village, CO, USA, 1–5 March 2020; pp. 2503–2511. [Google Scholar]
- Radenović, F.; Tolias, G.; Chum, O. Fine-tuning CNN image retrieval with no human annotation. IEEE Trans. Pattern Anal. Mach. Intell. 2018, 41, 1655–1668. [Google Scholar] [CrossRef] [PubMed]
- Wang, X.; Peng, Y.; Lu, L.; Lu, Z.; Summers, R.M. Tienet: Text-image embedding network for common thorax disease classification and reporting in chest x-rays. In Proceedings of the IEEE Conference on Computer Vision and Pattern Recognition, Salt Lake City, UT, USA, 18–22 June 2018; pp. 9049–9058. [Google Scholar]
- Liu, G.; Hsu, T.M.H.; McDermott, M.; Boag, W.; Weng, W.H.; Szolovits, P.; Ghassemi, M. Clinically accurate chest X-ray report generation. In Proceedings of the Machine Learning for Healthcare Conference, PMLR, Ann Arbor, MI, USA, 9–10 August 2019; pp. 249–269. [Google Scholar]
- Wang, Y.; Mei, T.; Gong, S.; Hua, X.S. Combining global, regional and contextual features for automatic image annotation. Pattern Recognit. 2009, 42, 259–266. [Google Scholar] [CrossRef]
- Burdescu, D.D.; Mihai, C.G.; Stanescu, L.; Brezovan, M. Automatic image annotation and semantic based image retrieval for medical domain. Neurocomputing 2013, 109, 33–48. [Google Scholar] [CrossRef]
- Gu, C.; Bu, J.; Zhou, X.; Yao, C.; Ma, D.; Yu, Z.; Yan, X. Cross-modal image retrieval with deep mutual information maximization. Neurocomputing 2022, 496, 166–177. [Google Scholar] [CrossRef]
- Zeng, X.; Wen, L.; Liu, B.; Qi, X. Deep learning for ultrasound image caption generation based on object detection. Neurocomputing 2020, 392, 132–141. [Google Scholar] [CrossRef]
- Liu, H.; Peng, L.; Xie, Y.; Li, X.; Bi, D.; Zou, Y.; Lin, Y.; Zhang, P.; Li, G. Describe like a pathologist: Glomerular immunofluorescence image caption based on hierarchical feature fusion attention network. Expert Syst. Appl. 2023, 213, 119168. [Google Scholar] [CrossRef]
- Yang, X.; Chen, R.; Zhang, F.; Zhang, L.; Fan, X.; Ye, Q.; Fu, L. Pixel-level automatic annotation for forest fire image. Eng. Appl. Artif. Intell. 2021, 104, 104353. [Google Scholar] [CrossRef]
- Mamat, N.; Othman, M.F.; Abdulghafor, R.; Alwan, A.A.; Gulzar, Y. Enhancing Image Annotation Technique of Fruit Classification Using a Deep Learning Approach. Sustainability 2023, 15, 901. [Google Scholar] [CrossRef]
- Fuentes, A.; Yoon, S.; Park, D.S. Deep learning-based phenotyping system with glocal description of plant anomalies and symptoms. Front. Plant Sci. 2019, 10, 1321. [Google Scholar] [CrossRef] [PubMed]
- Vinyals, O.; Toshev, A.; Bengio, S.; Erhan, D. Show and tell: A neural image caption generator. In Proceedings of the IEEE Conference on Computer Vision and Pattern Recognition, Boston, MA, USA, 7–12 June 2015; pp. 3156–3164. [Google Scholar]
- Szegedy, C.; Liu, W.; Jia, Y.; Sermanet, P.; Reed, S.; Anguelov, D.; Erhan, D.; Vanhoucke, V.; Rabinovich, A. Going deeper with convolutions. In Proceedings of the IEEE Conference on Computer Vision and Pattern Recognition, Boston, MA, USA, 7–12 June 2015; pp. 1–9. [Google Scholar]
- Xu, K.; Ba, J.; Kiros, R.; Cho, K.; Courville, A.; Salakhudinov, R.; Zemel, R.; Bengio, Y. Show, attend and tell: Neural image caption generation with visual attention. In Proceedings of the International Conference on Machine Learning, PMLR, Lile, France, 6–11 July 2015; pp. 2048–2057. [Google Scholar]
- Huang, L.; Wang, W.; Chen, J.; Wei, X.Y. Attention on attention for image captioning. In Proceedings of the IEEE/CVF International Conference on Computer Vision, Seoul, Republic of Korea, 27 October–2 November 2019; pp. 4634–4643. [Google Scholar]
- Cornia, M.; Stefanini, M.; Baraldi, L.; Cucchiara, R. Meshed-memory transformer for image captioning. In Proceedings of the IEEE/CVF Conference on Computer Vision and Pattern Recognition, Seattle, WA, USA, 14–19 June 2020; pp. 10578–10587. [Google Scholar]
- Johnson, J.; Karpathy, A.; Fei-Fei, L. Densecap: Fully convolutional localization networks for dense captioning. In Proceedings of the IEEE Conference on Computer Vision and Pattern Recognition, Las Vegas, NV, USA, 27–30 June 2016; pp. 4565–4574. [Google Scholar]
- Yang, L.; Tang, K.; Yang, J.; Li, L.J. Dense captioning with joint inference and visual context. In Proceedings of the IEEE Conference on Computer Vision and Pattern Recognition, Honolulu, HI, USA, 21–26 July 2017; pp. 2193–2202. [Google Scholar]
- Girshick, R.; Donahue, J.; Darrell, T.; Malik, J. Rich feature hierarchies for accurate object detection and semantic segmentation. In Proceedings of the IEEE Conference on Computer Vision and Pattern Recognition, Columbus, OH, USA, 23–28 June 2014; pp. 580–587. [Google Scholar]
- Uijlings, J.R.; Van De Sande, K.E.; Gevers, T.; Smeulders, A.W. Selective search for object recognition. Int. J. Comput. Vis. 2013, 104, 154–171. [Google Scholar] [CrossRef]
- Neubeck, A.; Van Gool, L. Efficient non-maximum suppression. In Proceedings of the 18th International Conference on Pattern Recognition (ICPR’06), Hong Kong, China, 20–24 August 2006; IEEE: Piscataway, NJ, USA, 2006; Volume 3, pp. 850–855. [Google Scholar]
- Girshick, R. Fast r-cnn. In Proceedings of the IEEE International Conference on Computer Vision, Santiago, Chile, 7–13 December 2015; pp. 1440–1448. [Google Scholar]
- Ren, S.; He, K.; Girshick, R.; Sun, J. Faster r-cnn: Towards real-time object detection with region proposal networks. Adv. Neural Inf. Process. Syst. 2015, 28. [Google Scholar] [CrossRef] [PubMed]
- Wang, C.Y.; Bochkovskiy, A.; Liao, H.Y.M. YOLOv7: Trainable bag-of-freebies sets new state-of-the-art for real-time object detectors. arXiv 2022, arXiv:2207.02696. [Google Scholar]
- Picon, A.; Seitz, M.; Alvarez-Gila, A.; Mohnke, P.; Ortiz-Barredo, A.; Echazarra, J. Crop conditional Convolutional Neural Networks for massive multi-crop plant disease classification over cell phone acquired images taken on real field conditions. Comput. Electron. Agric. 2019, 167, 105093. [Google Scholar] [CrossRef]
- Zhao, Y.; Sun, C.; Xu, X.; Chen, J. RIC-Net: A plant disease classification model based on the fusion of Inception and residual structure and embedded attention mechanism. Comput. Electron. Agric. 2022, 193, 106644. [Google Scholar] [CrossRef]
- Gulzar, Y. Fruit Image Classification Model Based on MobileNetV2 with Deep Transfer Learning Technique. Sustainability 2023, 15, 1906. [Google Scholar] [CrossRef]
- Zhang, K.; Wu, Q.; Chen, Y. Detecting soybean leaf disease from synthetic image using multi-feature fusion faster R-CNN. Comput. Electron. Agric. 2021, 183, 106064. [Google Scholar] [CrossRef]
- Li, J.; Qiao, Y.; Liu, S.; Zhang, J.; Yang, Z.; Wang, M. An improved YOLOv5-based vegetable disease detection method. Comput. Electron. Agric. 2022, 202, 107345. [Google Scholar] [CrossRef]
- Li, S.; Li, K.; Qiao, Y.; Zhang, L. A multi-scale cucumber disease detection method in natural scenes based on YOLOv5. Comput. Electron. Agric. 2022, 202, 107363. [Google Scholar] [CrossRef]
- Woo, S.; Park, J.; Lee, J.Y.; Kweon, I.S. Cbam: Convolutional block attention module. In Proceedings of the European Conference on Computer Vision (ECCV), Munich, Germany, 8–14 September 2018; pp. 3–19. [Google Scholar]


Disclaimer/Publisher’s Note: The statements, opinions and data contained in all publications are solely those of the individual author(s) and contributor(s) and not of MDPI and/or the editor(s). MDPI and/or the editor(s) disclaim responsibility for any injury to people or property resulting from any ideas, methods, instructions or products referred to in the content. |
© 2023 by the authors. Licensee MDPI, Basel, Switzerland. This article is an open access article distributed under the terms and conditions of the Creative Commons Attribution (CC BY) license (https://creativecommons.org/licenses/by/4.0/).