Article

Optimization of Manufacturing Parameters and Experimental Study of Rice Straw Fiber-Based Plant Fiber Seedling Pots

1
College of Engineering, Northeast Agricultural University, Harbin 150030, China
2
Heilongjiang Province Technology Innovation Center of Mechanization and Materialization of Major Crops Production, Harbin 150030, China
3
College of Mechanical and Electronic Engineering, East University of Heilongjiang, Harbin 150066, China
*
Authors to whom correspondence should be addressed.
These authors contributed equally to this work.
Agronomy 2023, 13(7), 1782; https://doi.org/10.3390/agronomy13071782
Submission received: 10 April 2023 / Revised: 10 May 2023 / Accepted: 24 May 2023 / Published: 30 June 2023

Abstract

:
In order to improve and alleviate environmental pollution caused by the disposal of seedling pots, a rice straw fiber-based headed vegetable seedling pot material, which is suitable for mechanical transplantation and biodegradable, was studied. Used rice straw as the main raw material, a five-factor and five-level (1/2 full implementation) quadratic regression orthogonal rotation central of rotation combination test method. The experimental factors included the beating degree of rice straw fiber, quantity, the proportion of rice fiber, neutral sizing agents, and wet strength agent mass fraction. The performance evaluation index included dry and wet tensile strength, burst strength, tear strength, air permeance, and degradation period. The results showed that when the parameter combination of the beating degree of rice straw fiber was 50 ± 1°SR, the quantity was 87.5 ± 4 g/m2, the proportion of fiber in rice was 70%, the neutral sizing agents mass fraction was 1 ± 0.25%, and the wet strength agent mass fraction was 1.5 ± 0.1%. The dry tensile strength was ≥ 1.8 kN·m−1, the wet tensile strength was ≥ 0.7 kN·m−1, the burst strength was ≥ 140 kPa, the tear strength was ≥ 350 m·N, the air permeance was ≤ 1.33 μm/Pa·s, and the degradation period was ≤ 80 d. The dry tensile strength reduction rate was 0.0274 kN/(m·d) and the wet tensile strength reduction rate was 0.0113 kN/(m·d), during the nursery period [30, 40], while the dry tensile strength was ≥ 1 kN·m−1 and the wet tensile strength was ≥ 0.4 kN·m−1 during the transplanting period.

1. Introduction

China is rich in agricultural crop straw resources and is the world’s leading producer of straw [1]. The comprehensive utilization of straw resources in all aspects is a primary goal for waste straw management, and converting straw from centralized incineration to clean application is the main way to address the waste of straw resources [2]. As one of the agricultural production waste products, crop straw is rich in cellulose and hemicellulose. As a natural fiber resource, its biodegradability and renewability make it a viable material for use as a clean material raw material and as a substitute for synthetic fibers [3,4]. Natural fiber/polymer composites are formed by combining one or more natural fibers that have undergone physical or chemical treatment with one or more polymer matrices [5,6,7]. The industrialization of the extraction process of natural cellulose has promoted the development and application of environmentally friendly materials in various fields, with agriculture, textiles, automobiles, construction, and electrical equipment being particularly prominent [8,9,10].
Currently, seedling cultivation in pots is still the key method for vegetable industry mechanized transplantation, whereby it is used in approximately 60% of vegetable varieties worldwide. However, the integration of the requirements for machine-transplanted seedlings and the pot-based seedling cultivation processes is not yet perfect. The speed of mechanical transplantation is limited by the speed of the pot seedling supply and the complexity of the existing mechanical transplantation methods. The currently used mechanical transplantation machines mostly adopt pot-based transplantation after the seedlings have been taken from the pot [11,12]. As one of the essential materials for greenhouse vegetable cultivation, seed pots play a crucial role in the development of high-quality and high-yield greenhouse vegetables and the continuous supply of vegetables in the region. However, the current situation of one seedling per pot in addition to most seed pots not being reused, has led to increased seedling cultivation costs. The currently used mechanical transplantation seedling pots are mostly made from nondegradable petroleum products, such as polystyrene, polyethylene, and polypropylene [13]. This type of seedling pot has strong mechanical properties and low costs. From the 1970s to the 1980s, plastic seedling pots replaced other types of seedling pots in various agricultural activities [14]. However, the environmental impact of this type of seedling pot is severe, as the lack of a well-established recycling and reuse mechanism has led to it being disposed of in landfills and incinerators along with other waste, meaning the harmful substances it produces enter the atmosphere and soil, causing increased environmental pressure, and soil degradation in agriculture [15,16,17].
In response to this situation, the main raw materials of degradable seedling pots include crop straw [18], animal excrement, wastepaper, etc. The form of a seedling pot includes a single seedling pot and seedling tray [19], and the environmental impact is mainly reflected in the impact on microorganisms in the soil [20]. William Sinclair Horticulture Ltd. (Penicuik, UK), Enviroarc, Fertil SA, and Jiffy Products International AS have designed and manufactured biodegradable seedling pots, whose main components are plant fibers, starch, and clean materials, such as grass, and whose lifespan can reach up to 2 years. Although these seedling pots are biodegradable, they require harsh conditions for biodegradation and usually need to be decomposed in a separate composting plant [3]. These seedling pots have not yet been widely commercially applied, and their large size leads to high transportation costs and inconvenience in seedling transplantation. Based on these seedling pots, Pratibha et al., in 2022, developed a biodegradable biocomposite material by treating rice straw with 20% NaOH solution and high-pressure kettle treatment, and mixing it with corn starch, glycerin, and other materials [21]. Rocío A. Fuentes et al., in 2021, used gelatin, corn and wheat flour, sunflower seed shells and rice husks (agricultural and industrial waste), maté waste (solid waste commonly used in South American subtropical regions), and cellulose paper as raw materials to prepare different formulas, which were mixed and composited to obtain biocomposite materials for the production of the seedling pots [22]. Ying Zhang et al., in 2021, explored the optimal manufacturing process parameters for straw fiber-based materials by using wheat straw materials and wood pulp fibers in a layered state for lamination mixing [23]. So far, there has been no research on the relevant performance index of rice straw fibers applied to the mechanical transplantation of seedling pot materials, and the degradation property of materials throughout the seedling period.
In this study, rice straw was used as the main raw material, while the influence law for each factor on the performance evaluation index and the optimization of the material manufacturing process parameters were combination-test studied. According to the obtained influence law, the ratio of process parameters for straw fiber-based headed vegetable seedling pot materials was optimized with reference to the technical requirements for mechanical transplanting and related agronomic requirements, to provide the optimal combination of process parameters for seedling pot materials.

2. Materials and Methods

2.1. Experimental Materials and Equipment

2.1.1. Experimental Materials

The materials used in optimizing the manufacturing process parameters of the straw fiber-based plant fiber seedling pot were rice straw fibers (harvested in 2022 from Suigeng-18 rice straw and processed by a self-made D200 straw fiber extruder using extrusion and blasting methods after cleaning and soaking. The composition of the raw material is shown in Table 1) [24], kraft pulp fibers, neutral sizing agents (solid content 15~16%), wet strength agents (solid content 15 ± 0.5%), etc.

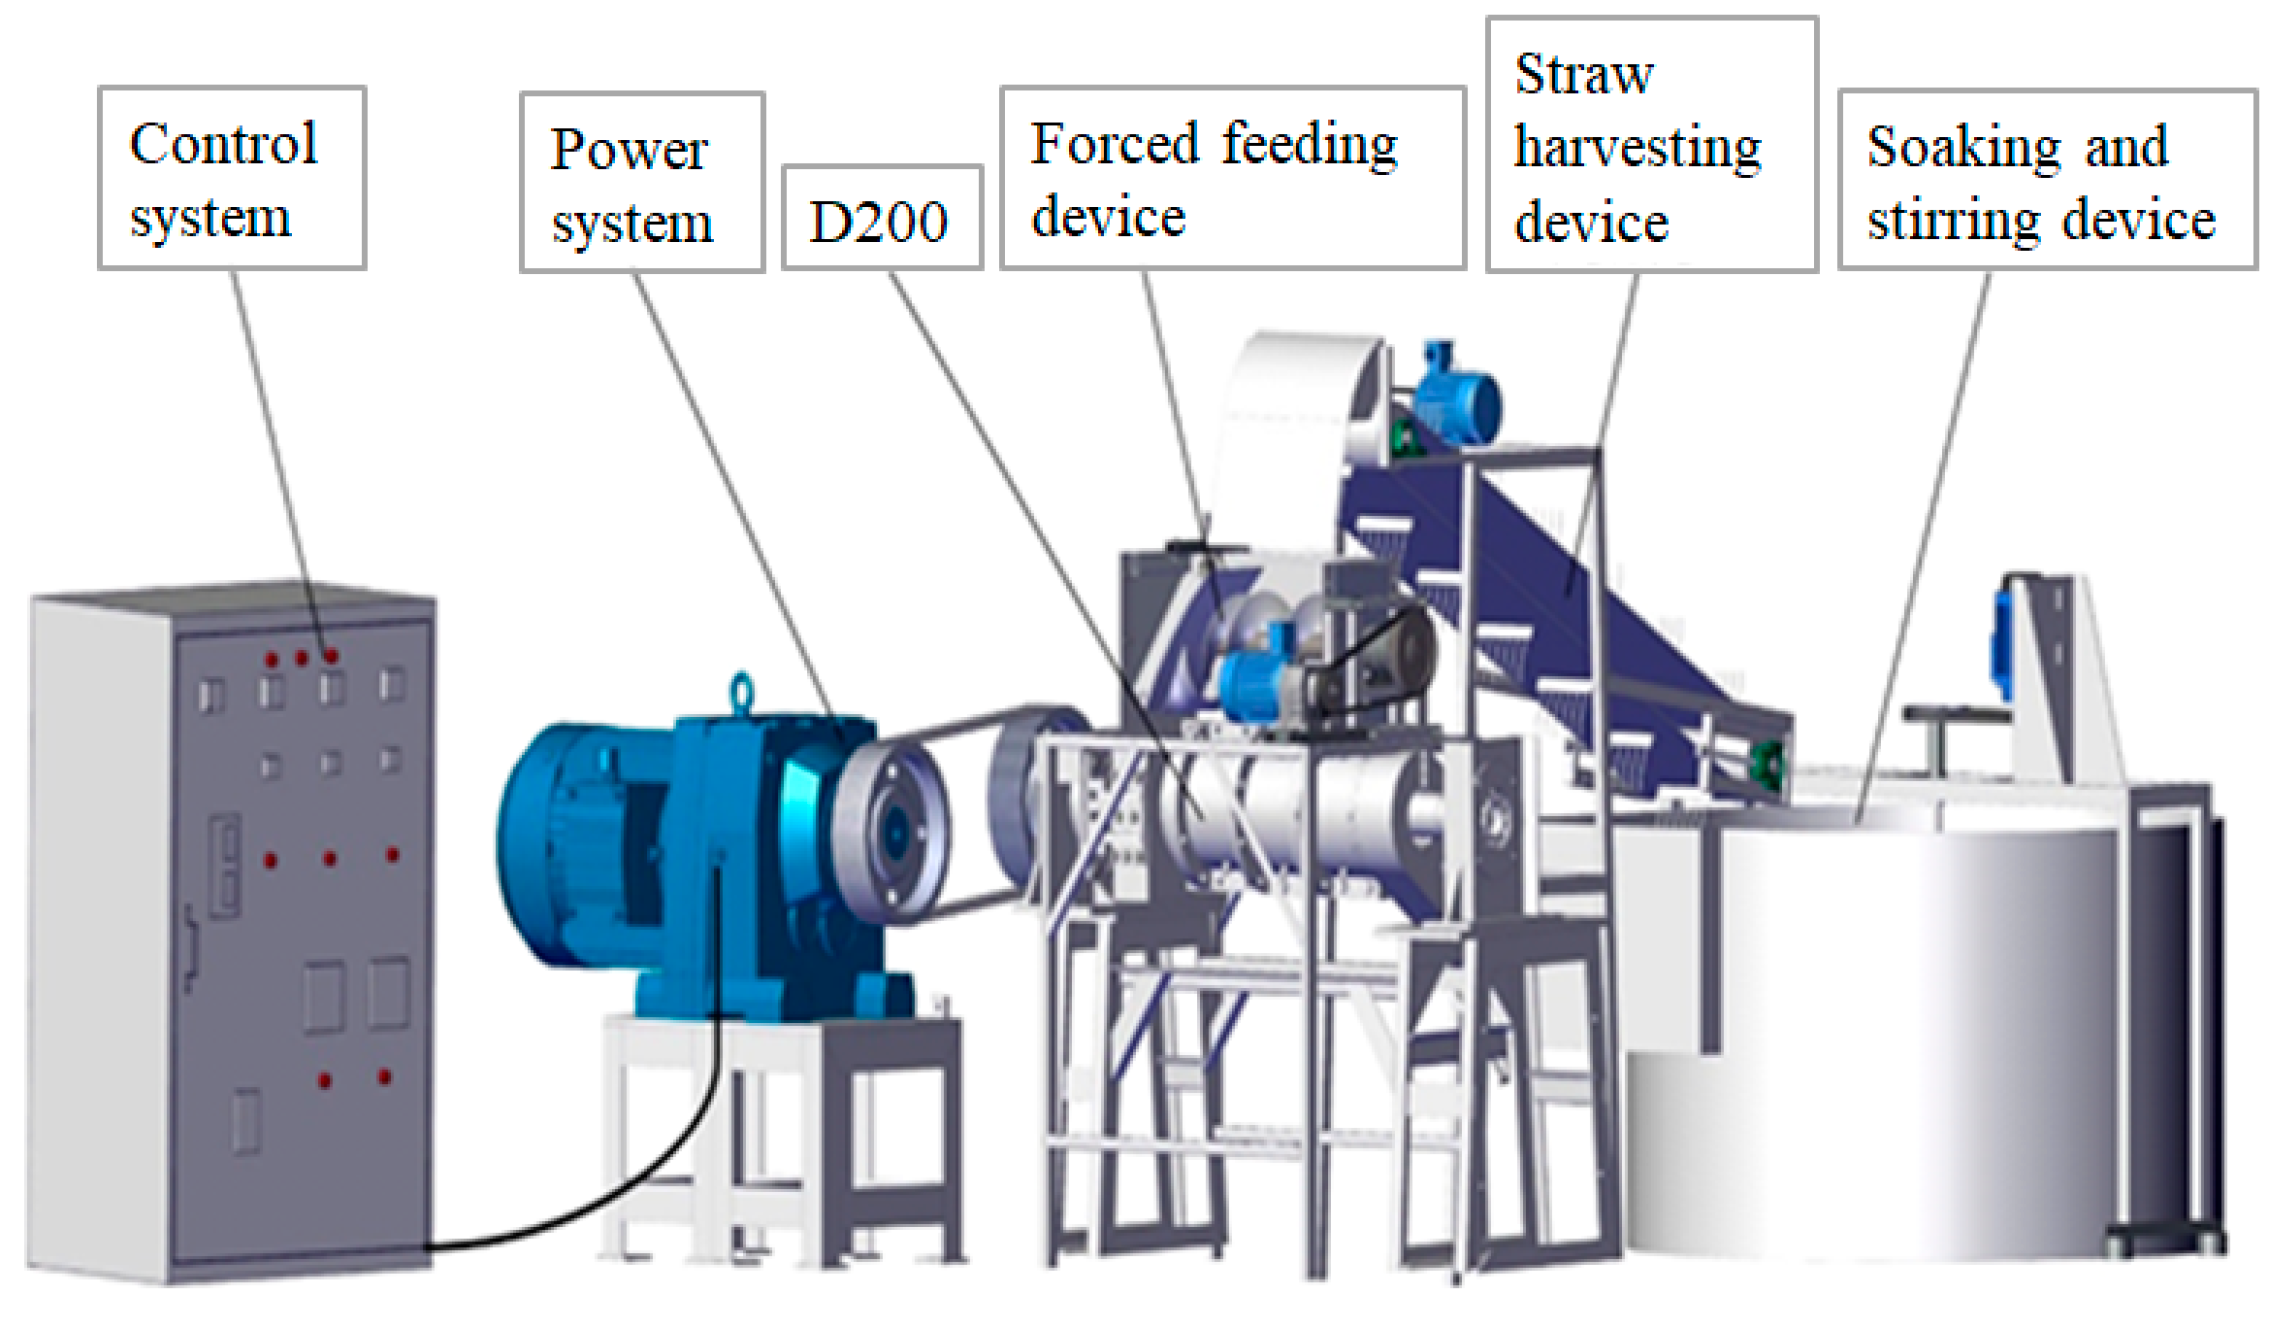
2.1.2. Instrumentation and Equipment

Instruments and equipment for optimizing process parameters of straw fiber-based plant fiber seedling pot materials: D200 Straw Fiber Extraction Machine (self-made by the dry crop main crop mechanization, materialization technology, and equipment discipline team at Northeast Agricultural University, as shown in Figure 1); ZT4-00 Vali Beater (Zhongtong Testing Equipment Co., Ltd., Xingping, China); ZJG-100 Xiao Bo Shi Beating Degree Tester (Changchun Yueming Testing Device Co., Ltd., Changchun, China); ZCX-A Paper Sheet Former (Changchun Yueming Small-Scale Testing Machine Co., Ltd., Changchun, China);ZL-3006 Pendulum-type Paper Tensile Strength Measuring Instrument (Jinan Redck Instrument Co., Ltd., Jinan, China); HK-TQD01 Xiao Bo Er-type Air permeance Tester (Jinan Derek Instrument Co., Ltd., Jinan, China); DCP-SLY1000 Computer Control Paper Tear Strength Tester (Sichuan Changjiang Paper Instrument Co., Ltd., Luzhou, China); DGG-9070AD Electric Constant Temperature Blast Drying Oven (Shanghai Senxin Experimental Instrument Co., Ltd., Shanghai, China); FQA360 High-Precision Fiber Quality Analyzer (Optest Canada); JA5003N Electronic Balance (Accuracy 0.001 g, Shanghai Jinghai Instrument Co., Ltd., Shanghai, China).

2.2. Experimental Design

2.2.1. Experimental Method

Using the five-factor and five-level (1/2 fully implemented) quadratic regression orthogonal rotation center combination design test method, the influencing factors were quantity, the proportion of fiber in rice (dry matter of rice straw fibers as a percentage to total dry matter of pulp), neutral sizing agent (percentage of dry matter of neutral sizing agent to total dry matter of pulp), and wet strength agent (percentage of dry matter of wet strength agent to total dry matter of pulp). The performance indices were dry tensile strength, wet tensile strength, air permeance, tear strength, burst strength, and degradation on period. The factor level coding table is shown in Table 2.

2.2.2. Test Factors and Performance Evaluation Indexes

  • Experimental Factors
Beating degree of rice straw fibers: The beating degree reflects the effect on the fibers in the pulp after cutting, splitting, and moistening the swell in the beater machine. The strength properties of the materials made from the fibers with different beating degrees vary greatly; thus, the beating degree was selected as the test influencing factor.
Quantity: Quantity is the mass per unit area of the material, which essentially reflects the number of material fibers. When the material quantity is within a certain range, the strength performance of the straw fiber material is greatly affected by the quantity, meaning the quantity was selected as the test influencing factor.
The proportion of fibers in rice: Rice is the main crop in Heilongjiang Province. The annual output of rice straw is abundant, yet a large proportion of the rice straw has not been utilized as a resource. According to the existing research, rice straw fiber has high strength in many crop straw fibers and can be used to make seedling pot materials. Different proportions of rice straw fiber have different effects on materials, so the proportion of rice straw fiber was selected as the experimental influencing factor.
Neutral sizing agent and wet strength agent: The range of their values was based on the experimental scheme of rice straw fiber base film manufacturing. On this basis, the mass fraction of neutral sizing agent and wet strength agent suitable for rice straw fiber-based seedling pot materials were tested and studied. Therefore, the mass fraction of the neutral sizing agent and wet strength agent was selected as the test influencing factor.
2.
Performance Evaluation Index
Dry tensile strength: Since the strength of the seedling pot material needs to meet the requirements of the agronomic and mechanical transplanting technology in the seedling stage, the dry tensile strength was selected as the performance evaluation index. The dry tensile strength was measured according to the method of GB/T 12914-2008 ‘Determination of tensile strength of paper and paperboard’ and the dry tensile strength was calculated.
Wet tensile strength: Since the soil had a certain humidity during the use of the seedling pot, it was necessary to ensure that the material strength met the agronomic and mechanical transplanting technical requirements during the seedling stage under this condition, and the wet tensile strength was selected as the performance evaluation index. The wet tensile strength was measured according to the GB/T 12914-2008 “Determination of tensile strength of paper and paperboard” method, and the wet tensile strength was calculated.
Burst strength: Due to the mutual extrusion between the soil swelling effect and the seedling pot during the seedling period, it was necessary to ensure that the material was not damaged under these external forces, and the bursting resistance was selected as the performance evaluation index; determination of burst strength refers to the GB/T 454-2020 ‘Determination of burst resistance of paper’ method, test sample burst resistance.
Tearing degree: Since the seedling needed to be separated one by one when the seedlings were transplanted, the tearing degree must not be too high, and the tearing degree was selected as the performance evaluation index; the tearing degree was determined with reference to the GB/T 455-2002 “Determination of Tearing Degree of Paper and Cardboard” method, and the test sample tearing degree.
Gas permeability: Owing to the oxygen requirement for plant root growth and development, and the selected air permeability as a performance evaluation index; determining the air permeability was conducted with reference to the GB/T 458-2008 ‘Determination of air permeability of paper and cardboard’ method, test sample air permeability.
Degradation period: Considering the growth characteristics of the headed vegetables and the technical requirements of mechanical transplanting on the strength of the seedling pot. The degradation time was measured by referring to the residual stress change method in the team’s previous paper, and the specimens were placed in nylon nets and buried vertically in the soil to simulate the seedling environment and maintain air circulation, then, samples were taken at intervals of 5 days for each measurement [25].
Each performance evaluation index was measured, and the average value was recorded for 10 parallel tests. Design-Expert 8.0.6 (Stat-Ease, Inc., Minneapolis, MN, USA) software was applied to design the experimental protocol and analyze the results, and the experimental protocol is shown in Table 2.

3. Results

3.1. Test Results

The results of the optimization test of the manufacturing process parameters for the rice straw fibers are shown in Table 3.

3.2. Regression Model

Data analysis of the objective function test results showed that the quadratic model was significant (p < 0.0001). After performing an F-test at a confidence level of α = 0.05, the insignificant interaction terms (p > 0.05) were eliminated, and the regression models for each objective function were obtained, as shown in Equations (1)–(6).
y 1 = 1.26 + 0.13 X 1 + 0.16 X 2 0.2 X 3 + 0.058 X 4 + 0.066 X 5 0.048 X 1 X 4 0.086 X 2 X 3 + 0.056 X 1 2 + ( 8.75 × 10 - 3 ) X 2 2 + 0.11 X 3 2 + 0.057 X 4 2 + 0.08 X 5 2
y 2 = 0.52 + 0.055 X 1 + 0.037 X 2 0.11 X 3 + 0.018 X 4 + 0.022 X 5 + 0.027 X 1 X 2 0.041 X 2 X 3 + 0.015 X 1 2 + ( 8.646 × 10 3 ) X 2 2 + 0.036 X 3 2 ( 1.354 × 10 3 ) X 4 2 + 0.014 X 5 2
y 3 = 96.73 + 8.07 X 1 + 11.7 X 2 26.07 X 3 + 4.03 X 4 + 2.68 X 5 7.83 X 2 X 3 + 3.16 X 1 2 0.39 X 2 2 + 5.02 X 3 2 2.1 X 4 2 0.55 X 5 2
y 4 = 271.16 + 6.07 X 1 + 48.37 X 2 73.73 X 3 3.81 X 4 + 2.94 X 5 + 7.79 X 1 X 5 14.15 X 2 X 3 5.77 X 2 X 4 + 3.34 X 1 2 + 5.22 X 2 2 1.04 X 3 2 5.56 X 4 2 2.88 X 5 2
y 5 = 1.51 0.72 X 1 0.33 X 2 + 0.25 X 3 0.049 X 4 0.051 X 5 + 0.2 X 1 X 2 0.21 X 1 X 3 + 0.062 X 1 2 + 0.023 X 2 2 + ( 7.66 × 10 3 ) X 3 2 + ( 6.076 × 10 3 ) X 4 2 0.048 X 5 2
y 6 = 57.17 + 6.04 X 1 + 5.96 X 2 7.04 X 3 + 2.46 X 4 + 1.62 X 5 1.69 X 2 X 3 + 2.06 X 3 X 4 + 2.19 X 4 X 5 + 1.49 X 1 2 0.01 X 2 2 + 2.24 X 3 2 + 0.99 X 4 2 + 1.61 X 5 2
where X1 represents quantity in g/m2, X2 represents the proportion of wheat fiber in percentage, X3 represents the proportion of rice fiber in percentage, X4 represents the proportion of neutral sizing agent in percentage, and X5 represents the proportion of wet strength agent in percentage.

3.3. Analysis of Regression Model Variance

The results of the variance analysis for the regression models in Equations (1) to (6) are shown in Table 4. In the variance analysis of the regression model, the regression term of each evaluation index in the regression model had a p value of less than 0.05, indicating that the regression equation of the evaluation index is highly significant. The fitting term of each performance evaluation index regression equation had a p value greater than 0.05, meaning the performance evaluation index regression model misfit was not significant.

3.4. Contribution of Each Factor to the Performance Evaluation Index

The contribution of each factor to the performance evaluation index is shown in Table 5. The contribution rate of factors influencing dry tensile strength is X3 > X1 > X5 > X4 > X2 in descending order. The contribution rate of factors influencing wet tensile strength is X1 > X3 > X5 > X2 > X4 in descending order. The contribution rate of factors influencing burst strength is X1 > X3 > X4 > X2 > X5 in descending order. The contribution rate of factors influencing tear strength is X2 > X1 > X4 > X5 > X3 in descending order. The contribution rate of factors influencing air permeance is X1 > X5 > X2 > X3 > X4 in descending order. The contribution rate of factors influencing the degradation period is X3 > X4 > X1 > X5 > X2 in descending order.

3.5. Influence Law of Each Factor on the Performance Evaluation Index

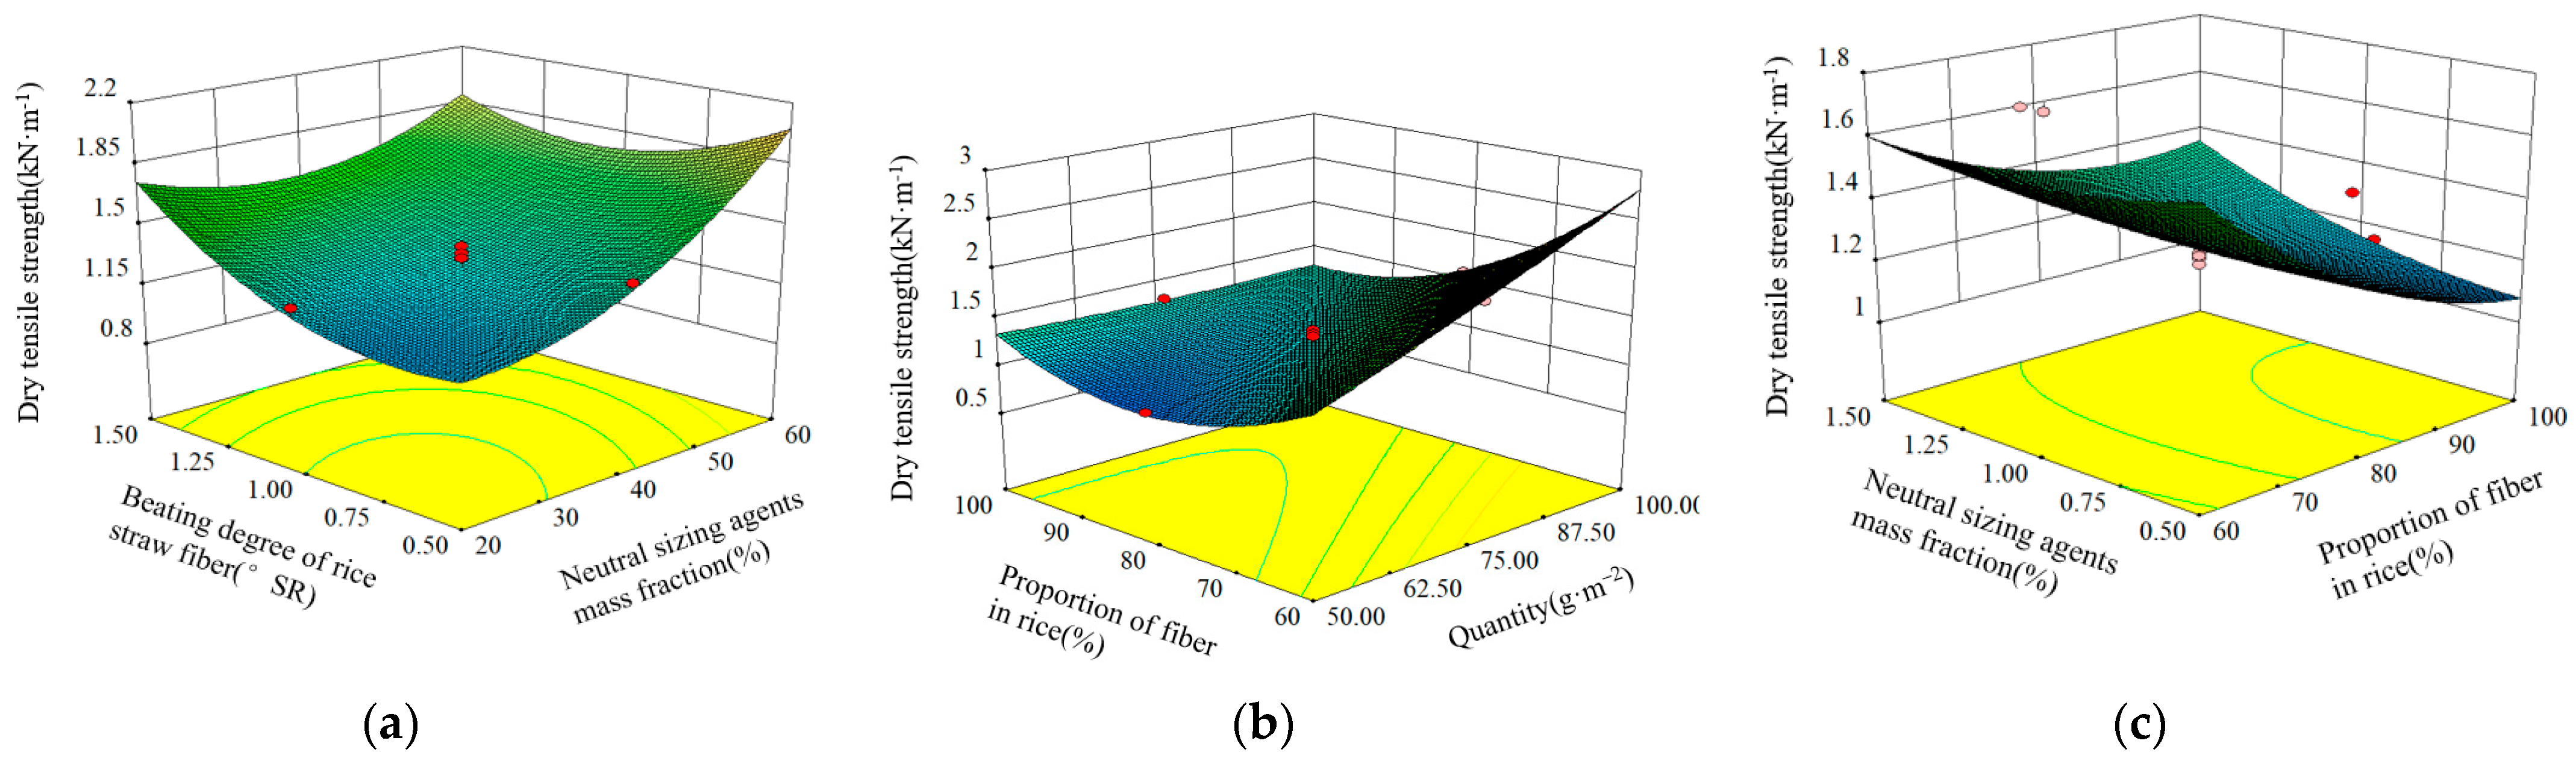
3.5.1. Dry Tensile Strength

  • The impact of beating degree of rice straw fiber and neutral sizing agents mass fraction on dry tensile strength.
When the quantity was 75 g/m2, the proportion of fiber in rice was 80%, and the wet strength agent mass fraction was 1.4%, the effects of the proportion of fiber in rice and neutral sizing agents mass fraction on dry tensile strength of the straw fiber-based plant fiber seedling pot material are shown in Figure 2a. The mass fraction and beating degree of the neutral sizing agents of the rice straw fiber were positively correlated with the dry tensile strength. As can be seen from Figure 2a, the effect of the beating degree of rice straw fiber on dry tensile strength was greater than the mass fraction of the neutral sizing agents. As the beating degree of the rice straw fiber and mass fraction of the neutral sizing agents vary, the dry tensile strength ranged from 1.1 to 1.5 kN·m−1. The maximum value of the rice straw fiber beating degree occurred at 60°SR and at 0.5% for the mass fraction of the neutral sizing agent.
2.
The impact of quantity and proportion of fiber in rice on dry tensile strength.
As shown in Figure 2b, the effect of quantity and proportion of fiber in rice on burst strength of straw fiber-based plant fiber seedling pot materials was evaluated at a beating degree of rice straw fiber of 40°SR, a neutral sizing agents mass fraction of 1.0%, and a wet strength agent mass fraction of 1.4%. The dry tensile strength shows a positive correlation with quantity. Dry tensile strength decreases with an increase in the proportion of fiber in rice within the 60–80% level range and increased with an increase in the proportion of fiber in rice within the 80–100% level range. As can be seen from Figure 2b, the effect of quantity on dry tensile strength is greater than the proportion of fiber in rice. The range of dry tensile strength variation with changes in quantity and proportion of fiber in rice was 0.93 to 2.82 kN·m−1. The maximum value for quantification was 100 g/m2 and 60% for rice straw fiber proportion.
3.
The impact of the proportion of fiber in rice and neutral sizing agents mass fraction on dry tensile strength.
As shown in Figure 2c, the effect of the proportion of fiber in rice and neutral sizing agents mass fraction on dry tensile strength of straw fiber-based plant fiber seedling pot materials was evaluated at a quantity of 75 g/m2, a beating degree of rice straw fiber of 40°SR, and a wet strength agent mass fraction of 1.4%. Both the proportion of fiber in rice and dry tensile strength showed negative correlations. Dry tensile strength decreased with an increase in the proportion of fiber in rice and the mass fraction of the neutral sizing agents. When the proportion of fiber in rice was within the range of 60–70%, the dry tensile strength showed a negative correlation with the neutral sizing agents mass fraction. When the proportion of fiber in rice was within the range of 70–100%, dry tensile strength showed a positive correlation with the mass fraction of the neutral sizing agents. As can be seen from Figure 2c, the influence of rice straw fiber proportion on dry tensile strength was greater than the neutral sizing agent mass. Within the range of experimental factors, the range of dry tensile strength variation with changes in the proportion of fiber in rice and neutral sizing agents mass fraction was 1.05 to 2.55 kN·m−1. The maximum value occurred at the rice straw fiber proportion was 60% and the neutral sizing agent mass fraction was 0.5%.

3.5.2. Wet Tensile Strength

  • Effects of beating degree of rice straw fiber and quantity on wet tensile strength.
Figure 3a illustrates the effects of beating degree of rice straw fiber and quantity on wet tensile strength of straw fiber-based plant fiber seedling pot materials, with the proportion of fiber in rice at 80%, the neutral sizing agents mass fraction at 1.0%, and the wet strength agent mass fraction at 1.4%. The beating degree of rice straw fiber and quantity showed a positive correlation with the wet tensile strength. As can be seen from Figure 3a, the impact of quantity on the wet tensile strength is greater than the beating degree of rice straw fiber. The range of wet tensile strength varies from 0.48 to 0.67 kN·m−1 with the change of the beating degree of rice straw fiber and quantity. The maximum value that occurred at the beating degree of rice straw fiber was 60°SR and the quantity was 100 g/m2.
2.
Effects of quantity and proportion of fiber in rice on wet tensile strength.
Figure 3b shows the effects of the quantity and proportion of fiber in rice on the wet tensile strength of the straw fiber-based plant fiber seedling pot materials, with a beating degree of rice straw fiber at 40°SR, a neutral sizing agents mass fraction at 1.0%, and a wet strength agent mass fraction at 1.4%. Quantity showed a positive correlation with the wet tensile strength, while the proportion of fiber in rice had a negative correlation with the wet tensile strength at the level of 60–80% and a positive correlation at the level of 80–100%. As can be seen from Figure 3b, the impact of quantity on wet tensile strength was greater than the proportion of fiber in rice. At the test factor level, the range of wet tensile strength varied from 0.45 to 0.76 kN·m−1 with the change of quantity and proportion of fiber in rice. The maximum value for quantification was 100 g/m2 and 60% for the rice straw fiber proportion.

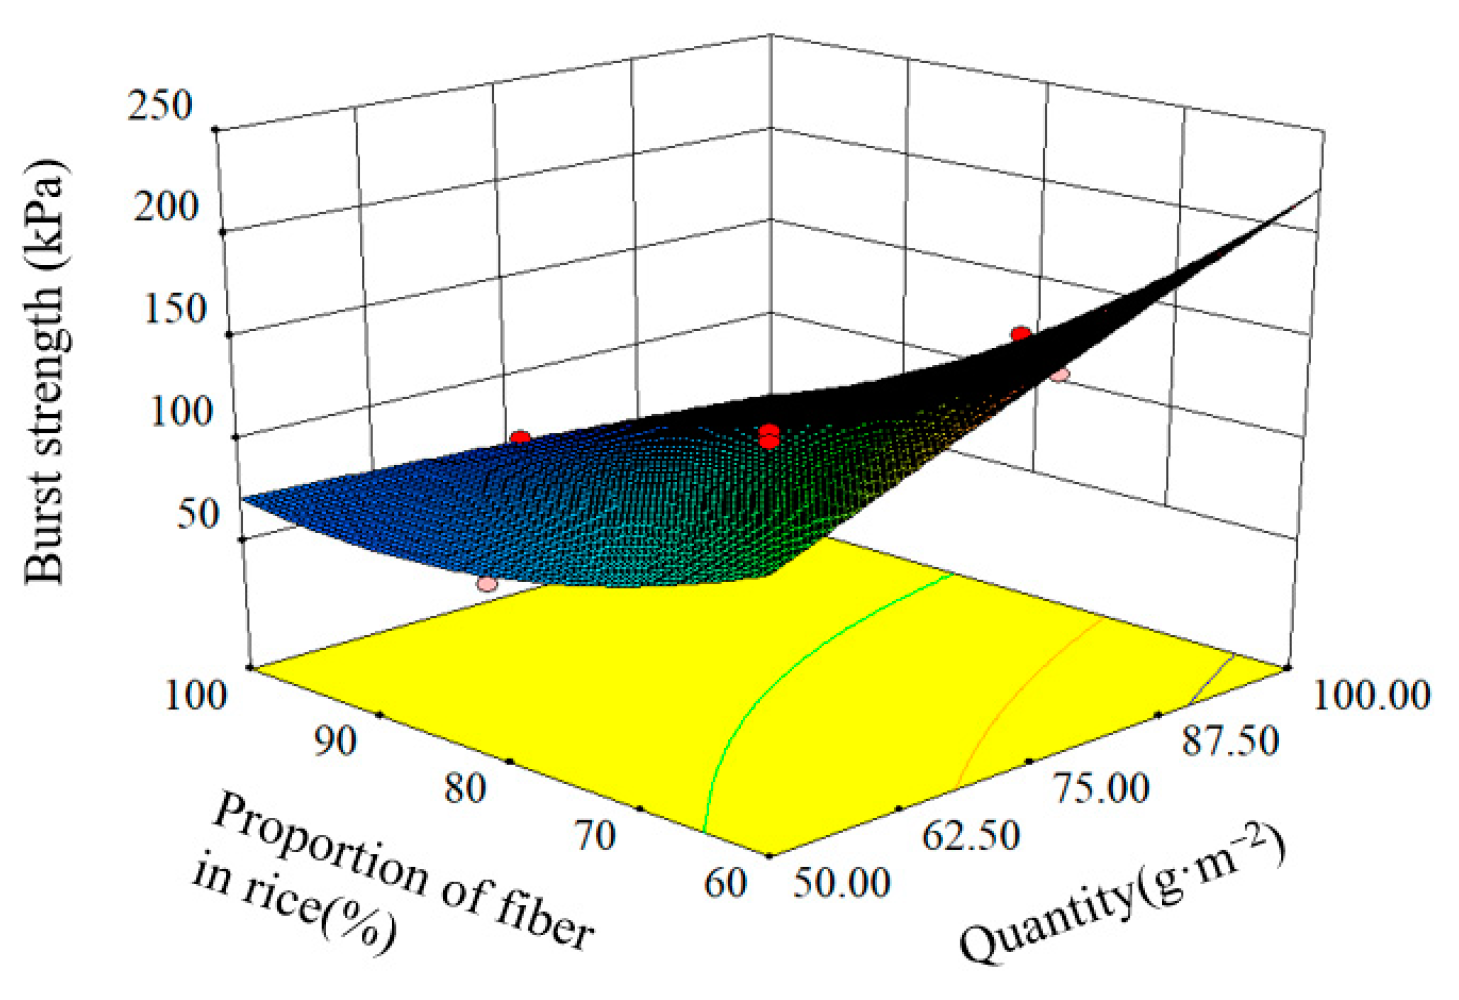
3.5.3. Burst Strength

  • Effects of quantity and proportion of fiber in rice on burst strength.
The effects of quantity and rice straw fiber proportion on burst strength of straw fiber-based plant fiber seedling pot materials are shown in Figure 4, whereby the beating degree of rice straw fiber was 40°SR, the mass fraction of neutral sizing agents was 1.0%, and the mass fraction of wet strength agent was 1.4%. Quantity was positively correlated with burst strength, while the proportion of fiber in rice was negatively correlated with burst strength. The burst strength of the material increased with the increase in quantity, yet the increase in burst strength was greater when the proportion of fiber in rice was below 80%, rather than when it was above 80%. As can be seen from Figure 4, the influence of quantity on burst strength was greater than the proportion of fiber in rice. At the test factor level, the range in burst strength variation was 54–224 kPa with the change of quantity and proportion of fiber in rice. The maximum value occurred at a quantity of 100 g/m2 and the rice straw fiber proportion was 60%.

3.5.4. Tear Strength

  • Effects of beating degree of rice straw fiber and wet strength agent mass fraction on tear strength.
Figure 5a illustrates the effects of the beating degree of rice straw fiber and the proportion of fiber in rice on the tear strength of the straw fiber-based plant fiber seedling pots when the quantity was 75 g/m2, the mass fraction of neutral sizing agents was 1.0%, and the mass fraction of wet strength agent was 1.4%. The wet strength agent mass fraction was 1%, while the beating degree of rice straw fiber was at 20–50°SR, the beating degree of the rice straw fiber was negatively correlated with tear strength. When the beating degree of the rice straw fiber was at 50~60°SR, it was positively correlated with tear strength, although the increase was only 3.57 m·N. When the rice straw fiber beating degree was less than 30°SR, the wet strength agent mass fraction was negatively correlated with tear strength. When the kinking degree of the rice straw fiber was greater than 30°SR and less than 60°SR, the wet strength agent mass fraction was positively correlated with tear strength. As can be seen from Figure 5a, the influence of the rice straw fiber beating degree on the tearing degree was greater than the wet strength agent mass fraction. In the test factor level range, with the beating degree of rice straw fiber and the wet strength agent mass fraction changes, the tear strength varied in a range between 235 and 323 m·N. The maximum value achieved in the rice straw fiber beating degree was 60°SR and the wet strength agent mass fraction was 1.8%.
2.
Effects of quantity and proportion of fiber in rice on tear strength.
When the beating degree of the rice straw fiber was 40°SR, the neutral sizing agents mass fraction was 1.0%, and the wet strength agent mass fraction was 1.4%, the effects of quantity and proportion of fiber in the rice on the tear strength of the straw fiber-based plant fiber seedling pot material are shown in Figure 5b. Quantity showed a positive correlation with tear strength, while the proportion of rice straw fiber showed a negative correlation. As can be seen from Figure 5b, the effect of quantity was greater than the proportion of fiber in rice. In the test factor level range, the range of tear strength variation was 101 to 591 m·N as the quantity and proportion of the fiber in rice changed. The maximum value occurred at a quantity of 100 g/m2 and the rice straw fiber proportion was 60%.
3.
Effects of quantity and neutral sizing agents mass fraction on tear strength.
When the beating degree of the rice straw fiber was 40°SR, the proportion of the fiber in rice was 80%, and the wet strength agent mass fraction was 1.4%, the effects of quantity and neutral sizing agents mass fraction on tear strength of the straw fiber-based plant fiber seedling pot material are shown in Figure 5c. The mass fractions in both the quantity and neutral sizing agents showed a positive correlation with tear strength. As can be seen from Figure 5c, the effect of the quantity was greater than the proportion of the rice straw fiber. In the test factor level range, the range of tear strength variation was 88 to 415 m·N as the quantity and proportion of the fiber in rice changed. The maximum value achieved for quantity was 100 g/m2 and the neutral sizing agent mass fraction was 0.5%.

3.5.5. Air Permeance

  • Effects of beating degree of rice straw fiber and quantity on air permeance.
As shown in Figure 6a, when the quantity was 75 g/m2, the neutral sizing agents mass fraction was 1.0%, and the wet strength agent mass fraction was 1.4%, the effects of beating degree of rice straw fiber and quantity on air permeance of the straw fiber-based plant fiber seedling pot material were studied. The beating degree of rice straw fiber and quantity were negatively correlated with air permeance. As can be seen from Figure 6a, the effect of the beating degree of the rice straw fiber on wet tensile strength was greater than the quantity. In the test factor level range, the range of air permeance varied from 0.73 to 2.87 μm/Pa·s with the change in beating degree of the rice straw fiber and quantity. The maximum value achieved for the beating degree of rice straw fiber was 20°SR and the quantity was 50 g/m2.
2.
Effects of beating degree of rice straw fiber and proportion of rice straw fiber on air permeance.
When the quantity was 75 g/m2, the mass fraction of neutral sizing agents was 1%, and the mass fraction of wet strength agent was 1.4%, the effects of the beating degree of rice straw fiber and proportion of fiber in rice on air permeance of the straw fiber-based plant fiber seedling pot materials are shown in Figure 6b. The beating degree of the rice straw fiber was negatively correlated with air permeance, while the proportion of the fiber in rice was positively correlated with air permeance. As can be seen from Figure 6a, the effect of the beating degree of the rice straw fiber on air permeance was greater than the proportion of fiber in rice. In the test factor level range, as the beating degree of the rice straw fiber and the proportion of fiber in rice change, the range of air permeance variation was 0–4.6 μm/Pa·s. The maximum value achieved for the beating degree of rice straw fiber was 20°SR and the rice straw fiber proportion was 100%.

3.5.6. Degradation Period

  • Effect of quantity and rice straw fiber proportion on degradation period
The effect of quantification and rice straw fiber percentage on the degradation period when the rice straw fiber kinking degree was 40°SR, the mass fraction of the neutral sizing agent of 1.0% and the mass fraction of the wet strength agent of 1.4%, as shown in Figure 7a. Quantity was positively correlated with the degradation cycle, and rice straw fiber proportion was negatively correlated with the degradation cycle. As can be seen from Figure 7a, the degree of quantitative influence was greater than the rice straw fiber proportion. In the test factor level range, the degradation period varied from 48 to 74 d with the change of quantification and rice straw fiber percentage. The maximum value that occurred for quantity was 100 g/m2 and for the rice straw fiber proportion was 60%.
2.
Effect of rice straw fiber proportion and neutral sizing agent mass fraction on degradation period
The effect of the rice straw fiber percentage and neutral sizing agent mass fraction on the degradation cycle is shown in Figure 7b, here, when the quantification was 75 g/m2, the rice straw fiber kinking degree was 40°SR, and the wet strength agent mass fraction was 1.4%. The proportion of rice straw fiber was negatively correlated with the degradation period. When the proportion of rice straw fiber was 60–70%, the degradation period was negatively correlated with the mass fraction of the neutral sizing agent, and when the proportion of rice straw fiber was 70–100%, the degradation period was positively correlated with the mass fraction of the neutral sizing agent. In the test factor level range, the degradation cycle varied from 48–68 d with changes in the quantitative and rice straw fiber percentage. The maximum value that occurred in the rice straw fiber proportion was 60% and in the neutral sizing agent mass fraction was 0.5%.
3.
Effect of neutral sizing agent mass fraction and wet strength agent mass fraction on degradation period
The effect of neutral sizing agent mass fraction and wet strength agent mass fraction on the degradation period is shown in Figure 7c, here, when the rice straw fiber beating degree was 40°SR, the quantitative amount was 75 g/m2, and the rice straw fiber proportion was 80%. When the mass fraction of the neutral sizing agent was 0.5–1%, the mass fraction of the neutral sizing agent was negatively correlated with the degradation period; when the mass fraction of the neutral sizing agent was 1–1.5%, the mass fraction of the neutral sizing agent was positively correlated with the degradation period. When the wet strength agent mass fraction was in the range of 1–1.4%, the wet strength agent mass fraction was negatively correlated with the degradation period, and the degradation period shortened with the increase in the proportion of the rice straw fiber; when the wet strength agent mass fraction was in the range of 1.4–1.8%, the wet strength agent mass fraction was positively correlated with the degradation period. In the test factor level range, the degradation period varied from 55 to 67 d with the change in the quantitative and rice straw fiber proportion. The maximum value achieved for the neutral sizing agent mass fraction was 1.5% and for the wet strength agent mass fraction was 1.8%.

3.6. Degradation Characteristics of Seedling Pot during Nursery Period

The changes in dry and wet tensile strength of the rice straw fiber-based headed vegetable seedling pot materials during the degradation period from 0–40 d are shown in Figure 8. Both the dry and wet tensile strengths of the materials decreased significantly, and the rate of decrease gradually decreased. In the 40-day seedling period, the dry tensile strength decreased from 2.24 to 1.08 kN·m−1, which is a reduction of 51.79%. The wet tensile strength decreased from 0.88 to 0.4 kN·m−1, which is a reduction of 54.55%. Through the fitting analysis of the data, the reduction rate of the dry tensile strength of the material was 0.0274 kN/(m·d), while the wet tensile strength reduction rate was 0.0113 kN/(m·d). This material’s dry and wet tensile strength change pattern matches the seedling transplanting process, meeting the agronomic and potting mechanical elicitation strength requirements; namely, a dry tensile strength of ≥ 1 kN·m−1 and a wet tensile strength of ≥ 0.4 kN·m−1 during the transplanting period.

3.7. Optimization Analysis

Optimization analysis was performed to meet the technical requirements of agronomic and mechanical transplanting, i.e., a dry tensile strength ≥ 1.8 kN·m−1, wet tensile strength ≥ 0.7 kN·m−1, burst strength ≥ 140 kPa, tear strength ≥ 350 m·N, air permeance ≤ 1.33 μm/Pa·s, and degradation period ≥ 60 d [26]. During the transplanting period, a material dry tensile strength ≥ 1 kN·m−1 and a wet tensile strength of ≥ 0.4 kN·m−1 were required while reducing the material manufacturing costs and reducing the energy consumption; furthermore, the constraints were set as follows: beating degree of rice straw fiber 20–60°SR, quantity 50–100 g/m2, proportion of fiber in rice 60–100%, neutral sizing agents mass fraction 0.5–1.5%, and a wet strength agent mass fraction 1.0–1.8%. The optimization analysis results are shown in Figure 9.
As can be seen in Figure 8, the optimal combination of process parameters was a beating degree of rice straw fiber of 50 ± 1°SR, a quantity of 87.5 ± 4 g/m2, a proportion of fiber in rice straw of 70%, a neutral sizing agents mass fraction of 1 ± 0.25%, and a wet strength agent mass fraction of 1.5 ± 0.1%.

3.8. Experimental Validation

According to the results of the optimization process, the rice straw fiber beating degree was 50°SR, the quantity was 87.5 g/m2, the proportion of rice straw fiber was 70%, the mass fraction of neutral sizing agents was 0.75%, the mass fraction of wet strength agent was 1.6%, and the performance evaluation indexes were measured, while the average value was taken from 10 parallel tests. During the transplanting period, a dry tensile strength of 1.34–1.58 kN·m−1 and a wet tensile strength of 0.4–0.45 kN·m−1 was achieved within the 95% confidence interval of the predicted values in the model, which meant that the optimization results were correct and reliable. The composition of the seedling pot is shown in Table 6.

4. Discussion

There is an interaction between the rice straw fiber beating degree and quantity on the wet tensile strength and air permeance. When the quantity of the rice straw fibers per unit area of the material is increased, the number of chemical bonds between the fibers increases, and the wet tensile strength increases. With an increase in the beating degree of rice straw fiber and quantity, the degree of fibrillation of individual rice straw fibers increases, and the absorption of the neutral sizing agents and wet strength agents increases. After high-temperature drying, the number of neutral sizing agents and wet strength agent particles melting in the unit area of the material increases. The neutral sizing agent is adsorbed on the hydrophobic alkyl chains and arranged outward, resulting in an increase in water resistance and a decrease in porosity, which leads to an increase in wet tensile strength and a decrease in air permeance [25].
Interactions exist between the beating degree of rice straw fiber and the mass fraction of the neutral sizing agents, in terms of dry tensile strength and tear strength. As the beating degree of the rice straw fiber increases, the degree of fibrillation and the specific surface area of the individual fiber increase. Due to the adsorption effect of the rice straw fibers, the higher the degree of fibrillation, the stronger the ability to adsorb the pulp additives. After drying, the neutral sizing agent particles adsorbed in the surface of the rice straw fibers melt and enhance the dry tensile strength of the material. As the wet strength agent mass fraction increases, the hydroxyl groups at the end of the rice straw fibers increase, and the wet strength agent reacts with the hydroxyl groups to enhance the strength of the chemical bonds between fibers, resulting in an increase in tear strength [25].
The beating degree of the rice straw fiber and the proportion of fiber in rice exhibit an interaction effect on air permeance. This interaction effect is reflected by changes in the porosity of the material. The material is composed of rice straw fibers and kraft pulp fibers. When the beating degree of the rice straw fiber increases, the length of the rice straw fibers decreases, and the number of the rice straw fibers per unit area increases, resulting in a decrease in the material porosity and air permeance. The smaller the beating degree of the rice straw fiber, the longer the length of the rice fiber, and the greater the porosity and air permeance of the material. When the beating degree of the rice straw fiber reaches a certain level, the material porosity reaches its extremum, and the air permeance remains unchanged.
There was an interaction between the quantity and rice straw fiber proportion for the dry and wet tensile strength, burst strength, tear strength, and degradation period. Under the premise of the same proportion of fiber in rice, the strength of the material mainly comes from the chemical bonding force between the fiber ends. The fiber strength of kraft pulp fibers is greater than that of rice straw fibers. With an increase in quantity, the number of fibers per unit area increases, resulting in closer bonding between the fibers. Therefore, under the same quantity conditions, the higher the proportion of fiber in rice, the smaller the fiber strength per unit area. The dry and wet tensile strength of the material decreases [26]. However, when the proportion of fiber in rice reaches above 0, the proportion of kraft pulp fibers per unit area decreases, and the kraft pulp fibers cannot directly connect with each other. Large areas are overlapped by rice straw fibers and kraft pulp fibers, and the chemical bonding strength between the two types of fibers is lower. Therefore, when the proportion of fiber in the rice increases above 0, the chemical bonding force between rice straw fibers increases, and the dry tensile strength, burst strength, and tear strength increase with an increase in quantity. Kraft pulp fibers exhibit stronger hydrophilic properties than rice straw fibers, and their fiber strength decreases when the fiber water content is high. Therefore, when the quantity is small, there is an increase in wet tensile strength with an increase in the proportion of fiber in rice, although this phenomenon disappears with an increase in quantity.
There is an interaction between the quantity and the mass fraction of the neutral sizing agents in the tear strength. The mechanism of neutral sizing agents is to melt the particles on the surface of the rice straw fibers, thereby enhancing the strength of the material [26]. Furthermore, the more rice straw fibers there are, the more neutral sizing agent particles are absorbed. Therefore, between 0.5 and 1.5% of the neutral sizing agents, meaning the tear strength increases alongside an increase in quantity.
The proportion of fiber in rice and the mass fraction of neutral sizing agents have an interaction effect on dry tensile strength. When the mass fraction of the neutral sizing agents exceeds the number of neutral sizing agents required by the fibers, the number of free neutral sizing agent ions increases. This affects the chemical bond connections between the fibers, causing a decrease in chemical bond strength, which results in a decrease in dry tensile strength. When the proportion of fiber in rice is at its lowest level, the number of rice straw fibers in the material per unit area is the smallest. As a result, there is an increase in the free neutral sizing agent ions in the pulp, leading to a decrease in dry tensile strength. As the proportion of the fiber in the rice increases, the number of rice straw fibers utilizing neutral sizing agents increases, which enhances the chemical bond strength between the rice straw fibers and reduces the number of free neutral sizing agent ions in the pulp, leading to an increase in dry tensile strength.
The strength of the rice straw fiber-based seedling pot material decreased as the nursery time increased, while the influencing factors were the initial strength of the material, microbial activity in the soil, soil temperature, soil pH, and soil moisture; however, the initial strength of the material and soil microbial activity were the main influencing factors because the degradation environment was the same [27]. In this study, under the same environmental conditions, the dry and wet tensile strength of the material at the end of the nursery period was related to the tissue structure composition of the specimens and the strength of the material, which was reduced by the degradation of the material by soil microorganisms. The quantification increased, the time of the microbial degradation to reduce the material grew, and the degradation cycle grew. The higher the proportion of rice straw fiber, the lower the strength of the material. The mass fraction of the neutral sizing agent and wet strength agent had little effect on the strength of the material during the seedling period. However, because the strength of the material increased as the mass fraction of the neutral sizing agent and wet strength agent increased, the strength of the material increased to a certain extent at the end of the seedling period. Due to the addition of the neutral sizing agent and wet strength agent, a layer of neutral sizing agent and wet strength agent particles were attached to the surface of the material. Due to the presence of these particles, the microorganisms in the soil need to decompose the neutral sizing agent and wet strength agent on the surface, when the material is degraded. Therefore, within the scope of this study, the higher the mass fraction of the neutral sizing agent and wet strength agent, the higher the strength of the material at the end of the seedling period.

5. Conclusions

  • In descending order, the contribution rate of factors influencing the dry tensile strength is the proportion of fibers in rice > beating degree of rice straw fiber > wet strength agent mass fraction > neutral sizing agents mass fraction > quantity. The contribution rate of the factors influencing the wet tensile strength is beating the beating degree of rice straw fiber > proportion of fiber in rice > wet strength agent mass fraction > quantity > X4, in descending order. The contribution rate of factors influencing burst strength is the beating degree of rice straw fiber > proportion of fiber in rice > neutral sizing agents mass fraction > quantity > wet strength agent mass fraction, in descending order. The contribution rate of factors influencing tear strength is quantity > the beating degree of rice straw fiber > neutral sizing agents mass fraction > wet strength agent mass fraction > proportion of fiber in rice, in descending order. The contribution rate of factors influencing air permeance is the beating degree of rice straw fiber > wet strength agent mass fraction > quantity > proportion of fiber in rice > neutral sizing agents mass fraction, in descending order. The contribution rate of factors influencing the degradation period is the proportion of fiber in rice > neutral sizing agents mass fraction > the beating degree of rice straw fiber > wet strength agent mass fraction > quantity, in descending order.
  • The optimized combination of process parameters was a beating degree of rice straw fiber of 50 ± 1°SR, a quantity of 87.5 ± 4 g/m2, a proportion of fiber in rice of 70%, a neutral sizing agents mass fraction of 1 ± 0.25%, and a wet strength agent mass fraction of 1.5 ± 0.1%. At this time, the dry tensile strength was ≥ 1.8 kN·m−1, the wet tensile strength was ≥ 0.7 kN·m−1, the burst strength was ≥ 140 kPa, the tear strength was ≥ 350 m·N, the air permeance was ≤ 1.33 μm/Pa·s, and the degradation period was ≤ 80 d. During the transplanting period, the dry tensile strength was ≥ 1 kN·m−1 and the wet tensile strength was ≥ 0.4 kN·m−1. The performance of the developed rice straw fiber-based seedling pot material met the technical requirements for the agronomic and mechanical transplanting of headed vegetable seedling pots, and the research results provide a theoretical reference for the development of rice straw fiber-based headed vegetable seedling pots material and their transplanting machines.
  • A rice straw fiber-based seedling pot material was developed to meet the agronomic and mechanical transplanting technology requirements of nodulated vegetables, and the manufacturing process parameters were determined after the parameter optimization of the material, while the strength change pattern of the seedling pot material during the application was also explored. The research results provide a theoretical reference for the development of rice straw fiber-based headed vegetable seedling pot material and their transplanting machines.

Author Contributions

Conceptualization, Q.Z. and X.W.; methodology, Q.Z. and X.W.; software, X.X. and S.G.; writing-original draft preparation, Q.Z. and X.W.; writing-review and editing, Q.Z., X.W. and S.L.; project administration, Y.Z. and H.C. All authors have read and agreed to the published version of the manuscript.

Funding

This research was funded by the Key Research and Development Projects in Heilongjiang Province in 2021, grant number GA21B003.

Data Availability Statement

Not applicable.

Conflicts of Interest

The authors declare no conflict of interest.

References

  1. Huo, L.L.; Zhao, L.X.; Meng, H.B.; Yao, Z.L. Study on straw multi-use potential in China. Trans. Chin. Soc. Agric. Eng. 2019, 35, 218–224. [Google Scholar] [CrossRef]
  2. Cong, H.B.; Meng, H.B.; Yu, J.D.; Ye, B.N.; Yao, Z.L.; Feng, J.; Yu, B.C.; Qin, C.; Huo, L.L.; Yuan, Y.W.; et al. Analysis of longterm mechanism for development of straw industry in northeast China under guidance of “Green-concept”. Trans. Chin. Soc. Agric. Eng. 2021, 37, 314–321. [Google Scholar]
  3. Youbi, S.B.T.; Tagne, N.R.S.; Harzallah, O.; Huisken, P.W.M.; Stanislas, T.T.; Njeugna, E.; Drean, J.Y.; Bistac-Brogly, S. Effect of Alkali and Silane Treatments on the Surface Energy and Mechanical Performances of Raphia Vinifera Fibres. Ind Crops Prod 2022, 190, 115854. [Google Scholar] [CrossRef]
  4. Jeyapragash, R.; Srinivasan, V.; Sathiyamurthy, S. Mechanical Properties of Natural Fiber/Particulate Reinforced Epoxy Composites—A Review of the Literature. Mater Today Proc 2020, 22, 1223–1227. [Google Scholar] [CrossRef]
  5. Gupta, M.K.; Ramesh, M.; Thomas, S. Effect of Hybridization on Properties of Natural and Synthetic Fiber-Reinforced Polymer Composites (2001–2020): A Review. Polym. Compos. 2021, 42, 4981–5010. [Google Scholar] [CrossRef]
  6. Singh, M.K.; Tewari, R.; Zafar, S.; Rangappa, S.M.; Siengchin, S. A Comprehensive Review of Various Factors for Application Feasibility of Natural Fiber-Reinforced Polymer Composites. Results Mater. 2023, 17, 100355. [Google Scholar] [CrossRef]
  7. Zou, Y.; Zhao, J.; Zhu, J.; Guo, X.; Chen, P.; Duan, G.; Liu, X.; Li, Y. A Mussel-Inspired Polydopamine-Filled Cellulose Aerogel for Solar-Enabled Water Remediation. ACS Appl. Mater Interfaces 2021, 13, 7617–7624. [Google Scholar] [CrossRef]
  8. Sathishkumar, G.K.; Ibrahim, M.; Mohamed Akheel, M.; Rajkumar, G.; Gopinath, B.; Karpagam, R.; Karthik, P.; Martin Charles, M.; Gautham, G.; Gowri Shankar, G. Synthesis and Mechanical Properties of Natural Fiber Reinforced Epoxy/Polyester/Polypropylene Composites: A Review. J. Nat. Fibers 2022, 19, 3718–3741. [Google Scholar] [CrossRef]
  9. Karimah, A.; Ridho, M.R.; Munawar, S.S.; Adi, D.S.; Ismadi; Damayanti, R.; Subiyanto, B.; Fatriasari, W.; Fudholi, A. A Review on Natural Fibers for Development of Eco-Friendly Bio-Composite: Characteristics, and Utilizations. J. Mater. Res. Technol. 2021, 13, 2442–2458. [Google Scholar] [CrossRef]
  10. Li, J.; Yang, L.; He, L.; Guo, R.; Li, X.; Chen, Y.; Muhammad, Y.; Liu, Y. Research Progresses of Fibers in Asphalt and Cement Materials: A Review. J. Road Eng. 2023, 3, 35–70. [Google Scholar] [CrossRef]
  11. Hu, J.P.; Liu, Y.T.; Liu, W.; Zhang, S.W.; Han, L.H.; Zeng, T.Y. Experiment on Combined Seedling Picking Device with Top Clamping and Pulling. Trans. Chin. Soc. Agric. Mach. 2022, 53 (Suppl. S1), 110–117. [Google Scholar]
  12. Tian, Z.W.; Ma, W.; Yang, Q.C.; Yao, S.; Zhang, M.; Duan, F.M.; Xu, H.D. Research status and problem analysis of plug seedling transplanter in greenhouse. J. China Agric. Univ. 2022, 27, 22–38. [Google Scholar]
  13. Schettini, E.; Santagata, G.; Malinconico, M.; Immirzi, B.; Scarascia Mugnozza, G.; Vox, G. Recycled Wastes of Tomato and Hemp Fibres for Biodegradable Pots: Physico-Chemical Characterization and Field Performance. Resour. Conserv. Recycl. 2013, 70, 9–19. [Google Scholar] [CrossRef]
  14. Orzolek, M. (Ed.) A Guide to the Manufacture, Performance, and Potential of Plastics in Agriculture; Elsevier Ltd.: Amsterdam, The Netherlands, 2017. [Google Scholar]
  15. Evans, M.R.; Hensley, D.L. Plant Growth in Plastic, Peat, and Processed Poultry Feather Fiber Growing Containers. HortScience 2004, 39, 1012–1014. [Google Scholar] [CrossRef]
  16. Horinouchi, H.; Katsuyama, N.; Taguchi, Y.; Hyakumachi, M. Control of Fusarium Crown and Root Rot of Tomato in a Soil System by Combination of a Plant Growth-Promoting Fungus, Fusarium Equiseti, and Biodegradable Pots. Crop Prot. 2008, 27, 859–864. [Google Scholar] [CrossRef]
  17. Yamauchi, M.; Masuda, S.; Kihara, M. Recycled Pots Using Sweet Potato Distillation Lees. Resour Conserv. Recycl. 2006, 47, 183–194. [Google Scholar] [CrossRef]
  18. Li, L.H.; Wang, C.; Zhang, X.Y.; Li, G.Y. Improvement and Optimization of Preparation Process of Seedling-Growing Bowl Tray Made of Paddy Straw. Int. J. Agric. Biol. Eng. 2014, 7, 13–22. [Google Scholar] [CrossRef]
  19. Qi, L.; Zhang, B.; Ma, Y.; Zhang, W. Forming and Degradation Mechanism of Bowl Seedling Tray Based on Straw Lignin Conversion. Agronomy 2023, 13, 453. [Google Scholar] [CrossRef]
  20. Meng, K.; Ren, W.; Teng, Y.; Wang, B.; Han, Y.; Christie, P.; Luo, Y. Application of Biodegradable Seedling Trays in Paddy Fields: Impacts on the Microbial Community. Sci. Total Environ. 2019, 656, 750–759. [Google Scholar] [CrossRef]
  21. Pratibha; Saha, S.; Hariprasad, P. Paddy Straw-Based Biodegradable Horticultural Pots: An Integrated Greener Approach to Reduce Plastic Waste, Valorize Paddy Straw and Improve Plant Health. J. Clean Prod. 2022, 337, 130588. [Google Scholar] [CrossRef]
  22. Fuentes, R.A.; Berthe, J.A.; Barbosa, S.E.; Castillo, L.A. Development of Biodegradable Pots from Different Agroindustrial Wastes and Byproducts. Sustain. Mater. Technol. 2021, 30, e00338. [Google Scholar] [CrossRef]
  23. Zhang, Y.; Zhu, Q.J.; Gao, S.; Liu, S.; Li, L.H.; Chen, H.T. Optimization of Technological Parameters of Straw Fiber-Based Plant Fiber Seedling Pot Raw Materials. Appl. Sci. 2021, 11, 7152. [Google Scholar] [CrossRef]
  24. Wang, X.; Zhao, C.S.; Ji, Z.C.; Ju, D.M.; Gao, C.; Chen, H.T.; Li, L.H. The Sliding Frictional Properties of Untreated and Extrusion-Exploded Wheat and Rice Straw. Agriculture 2022, 12, 1911. [Google Scholar] [CrossRef]
  25. Chen, H.T.; Chen, S.C.; Liu, S. Optimization of manufacturing parameters for sterilizing functional straw fiber mulch. Trans. Chin. Soc. Agric. Eng. 2019, 35, 306–314. [Google Scholar]
  26. Cui, Z.C.; Guan, C.S.; Xu, T.; Fu, J.J.; Chen, Y.S.; Yang, Y.T.; Gao, Q.S. Design and experiment of transplanting machine for cabbage substrate block seedlings. Inmateh-Agric. Eng. 2021, 64, 375–384. [Google Scholar] [CrossRef]
  27. Zhang, X.; Wang, C.; Chen, Y. Properties of Selected Biodegradable Seedling Plug-Pots. Sci. Hortic. 2019, 249, 177–184. [Google Scholar] [CrossRef]
Figure 1. D200 single screw straw-based fiber extruder.
Agronomy 13 01782 g001
Figure 2. Response surface plot of factors affecting dry tensile strength index: (a) Influence of rice straw fiber and neutral sizing agents mass fraction on dry tensile strength index; (b) influence of quantity and proportion of fiber in rice on the dry tensile index. (c) Influence of fiber in rice and neutral sizing agents mass fraction on dry tensile strength index. In the figure, red is the high value area, blue is the low value area, and green is the centered value area.
Agronomy 13 01782 g002
Figure 3. Figure 3. Response surface plot of factors affecting wet tensile strength index: (a) Influence of rice straw fiber and quantity on wet tensile strength index; (b) influence of quantity and proportion of fiber in rice on wet tensile strength index. In the figure, red is the high value area, blue is the low value area, and green is the centered value area.
Agronomy 13 01782 g003
Figure 4. Influence of quantity and proportion of fiber in rice on burst strength index. In the figure, red is the high value area, blue is the low value area, and green is the centered value area.
Agronomy 13 01782 g004
Figure 5. Response surface plot of factors affecting tear strength index: (a) Influence of rice straw fiber and wet strength agent mass fraction on tear strength index; (b) influence of quantity and proportion of fiber on tear strength index. (c) Influence of quantity and neutral sizing agents mass fraction on tear strength index. In the figure, red is the high value area, blue is the low value area, and green is the centered value area.
Agronomy 13 01782 g005
Figure 6. Response surface plot of factors affecting air permeance index: (a) Influence of beating degree of rice straw fiber and quantity on air permeance index; (b) influence of beating degree of rice straw fiber and proportion of fiber in rice on air permeance index. In the figure, red is the high value area, blue is the low value area, and green is the centered value area.
Agronomy 13 01782 g006
Figure 7. Effects of factors on degradation period. Response surface plot of factors affecting degradation period index: (a) Influence of quantity and rice straw fiber proportion on degradation period index; (b) influence of rice straw fiber proportion and neutral sizing agent mass fraction on degradation period index. (c) Influence of neutral sizing agent mass fraction and wet strength agent mass fraction on degradation period index. In the figure, red is the high value area, blue is the low value area, and green is the centered value area.
Agronomy 13 01782 g007
Figure 8. Variation of dry and wet tensile strength of seedling pot with the growing-seedling period.
Agronomy 13 01782 g008
Figure 9. Optimized result of technology parameters.
Agronomy 13 01782 g009
Table 1. Composition of the raw material.
CompositionRice Straw FibersKraft Pulp Fibers
Cellulose mass fraction48.271.8
Hemicellulose mass fraction19.111.2
Lignin mass fraction17.616.4
Pectin mass fraction0.6-
Ash mass fraction0.4-
Water mass fraction12.39.6
Table 2. Factor level coding table.
LevelBeating Degree of Rice Straw Fiber
X1/°SR
Quantity
X2/g·m−2
Proportion of Fiber in Rice
X3/%
Neutral Sizing Agents Mass Fraction
X4/%
Wet Strength Agent Mass Fraction
X5/%
+2601001001.51.8
+15087.5901.251.6
04075801.01.4
−13062.5700.751.2
−22050600.51.0
Table 3. Experimental plan and results.
No.FactorsResponse
X1
/°SR
X2
/g·m−2
X3
/%
X4
/%
X5
/%
Dry Tensile Strength
y1/KN·m−1
Wet Tensile Strength
y2/KN·m−1
Burst Strength
y3/kPa
Tear Strength
y4/m·N
Air Permeance
y5/μm·Pa−1·s
Degradation Period
y6/d
1−1−1−1−111.480.63106.32270.972.2460
21−1−1−1−11.590.61107.88278.750.9867
3−11−1−1−11.790.66131.74425.861.4872
411−1−112.300.87148.25432.680.682
5−1−11−1−10.860.4460.16169.623.2645
61−11−111.380.5370.13170.291.1053
7−111−111.100.3968.04229.902.0748
8111−1−11.510.5785.62243.290.7664
9−1−1−11−11.300.59100.55272.712.3052
101−1−1111.710.69125.88313.110.8574
11−11−1111.990.77148.7382.541.0778
1211−11−12.030.84161.97403.620.6280
13−1−11111.400.4867.48152.553.2353
141−111−11.480.5893.48158.240.8561
15−1111−11.450.4072.35221.602.2058
16111111.710.6490.00238.620.7174
17−200001.270.4791.84271.873.3249
18200001.700.65124.73288.340.3577
190−20000.990.4667.60196.702.3543
20020001.600.61120.57381.191.0170
2100−2002.090.90166.14405.971.1481
22002001.300.3965.34119.222.1050
23000−201.410.4683.60247.771.7456
24000201.570.5390.85241.251.4865
250000−21.450.5080.13241.861.5659
26000021.710.61106.73268.631.2367
27000001.250.4896.30265.641.3659
28000001.370.4995.36270.261.5360
29000001.340.5398.80265.981.4456
30000001.210.5095.88287.291.5858
31000001.190.54101.36269.581.4461
32000001.220.5191.28273.211.5854
33000001.230.6092.78267.911.5255
34000001.230.5593.62271.591.6657
35000001.310.56104.78282.391.4658
36000001.220.5199.28266.591.3754
Table 4. Variance analysis of regression model.
ResponseSource of VariationSum of SquaresDFMean SquareF Valuep Value
Dry tensile strengthregression3.32200.1753.25<0.0001
residual0.047153.12 × 10−3
lack of fit0.01363.232 × 10−30.60.7243
pure error0.03393.712 × 10−3
sum total3.3735
Wet tensile strengthregression0.51200.02630.00<0.0001
residual0.013158.512 × 10−3
lack of fit4.328 × 10−367.213 × 10−30.770.6128
pure error8.44 × 10−399.378 × 10⁻³
sum total0.5235
Burst strengthregression24,349.53201217.4862.25<0.0001
residual293.351519.56
lack of fit202.13633.693.320.052
pure error91.22910.14
sum total24,642.8835
Tear strengthregression1.959 × 105209797.14129.20<0.0001
residual1137.461575.83
lack of fit662.546110.422.090.1536
pure error474.92952.77
sum total1.971 × 10535
Air permeanceregression18.38200.9273.05<0.0001
residual0.19150.013
lack of fit0.1160.0182.010.1671
pure error0.08198.972 × 10−3
sum total18.5735
Degradation periodregression3707.4320185.3727.50<0.0001
residual81.54155.44
lack of fit39.0266.500.940.5104
pure error62.1096.90
sum total3808.5635
Table 5. Contribution rate of effect factors to performance indicators.
IndexFactor
X1X2X3X4X5
y12.4141.8322.8591.9271.952
y22.4741.4202.1630.7901.591
y32.5541.4752.3281.7060.823
y42.5732.9241.0001.8971.348
y53.1381.5061.2610.7811.632
y61.8971.4182.7812.1941.813
Table 6. Composition of the seedling pot.
CompositionSeedling Pot
Cellulose mass fraction66.9
Hemicellulose mass fraction12.1
Lignin mass fraction16.5
Pectin mass fraction0.6
Ash mass fraction0.4
Water mass fraction8.3
Disclaimer/Publisher’s Note: The statements, opinions and data contained in all publications are solely those of the individual author(s) and contributor(s) and not of MDPI and/or the editor(s). MDPI and/or the editor(s) disclaim responsibility for any injury to people or property resulting from any ideas, methods, instructions or products referred to in the content.

