Article

Optimization of an Ultrasound-Assisted Extraction Method for the Extraction of Gingerols and Shogaols from Ginger (Zingiber officinale)

by
Monserrat Gonzalez-Gonzalez
1,2,
Beatriz Juliana Yerena-Prieto
2,
Ceferino Carrera
1,
Mercedes Vázquez-Espinosa
1,
Ana Velasco González-de-Peredo
1,
Miguel Ángel García-Alvarado
2,
Miguel Palma
1,
Guadalupe del Carmen Rodríguez-Jimenes
2,* and
Gerardo Fernández Barbero
1,*
1
Department of Analytical Chemistry, Faculty of Sciences, Agrifood Campus of International Excellence (ceiA3), Wine and Agrifood Research Institute (IVAGRO), University of Cadiz, 11510 Puerto Real, Spain
2
Tecnológico Nacional de México/I.T. Veracruz, (UNIDA), Miguel Angel de Quevedo 2779, Colonia Formando Hogar, Veracruz 91860, Mexico
*
Authors to whom correspondence should be addressed.
Agronomy 2023, 13(7), 1787; https://doi.org/10.3390/agronomy13071787
Submission received: 12 June 2023 / Revised: 29 June 2023 / Accepted: 1 July 2023 / Published: 2 July 2023
(This article belongs to the Special Issue Extraction and Analysis of Bioactive Compounds in Crops—2nd Edition)

Abstract

:
The goal of this study is to optimize a UAE method for the extraction of the main bioactive compounds present in the ginger rhizome (gingerols and shogaols). Ginger rhizome (Zingiber officinale) has a considerable content of bioactive compounds, in particular gingerols and shogaols, with interesting pharmacological activities such as anti-inflammatory, antioxidant, anti-cancer, and antimicrobial properties, among others. The isolation of these compounds requires an efficient extraction process with short extraction times and the employment of specific non-toxic solvents for humans. In this work, the optimization of an ultrasound-assisted extraction (UAE) method for the extraction of the main pungent compounds in the ginger rhizome, i.e., gingerols and shogaols, has been carried out. For this purpose, a Box–Behnken design (BBD) has been used to optimize the experimental design through a response surface methodology (RSM). The percentage of ethanol in the extraction solvent, the temperature, the amplitude, and the cycle of the ultrasounds, as well as the sample-to-solvent ratio, were the variables to be studied. Thus, the percentage of ethanol in the extraction solvent was identified as the most influential factor. Once the compounds were extracted, the identification of gingerols and shogaols was performed by ultra-high-performance liquid chromatography (UHPLC) coupled to a quadrupole-time-of-flight mass spectrometer (Q-ToF-MS), and the quantification by UHPLC coupled to a diode array detector (DAD) detector. Finally, the optimized UAE method required only 10 min of extraction time, presenting good repeatability and intermediate precision levels (<5%). The method was applied to extract gingerols and shogaols from diverse sources, thereby demonstrating its applicability and highlighting the potential variations in compound concentrations across different samples based on factors such as origin, and growing conditions, among others.

1. Introduction

Research studies conducted on diverse plant matrices in recent years have yielded compelling evidence linking their consumption to advantageous effects on human health [1,2]. For this reason, the main objective of this work is to develop an efficient extraction method to evaluate the content of bioactive compounds in ginger, an increasingly common food in our diet. The ginger rhizome (Zingiber officinale), an indigenous species from Asia, holds a prominent status as both a spice and a key component in traditional medicine [3,4]. It has been utilized for centuries to alleviate a multitude of health conditions, including headaches, arthritis, nausea, colds, rheumatism, muscle discomfort, and inflammation [4,5,6]. For example, Giacosa et al. [5] have shown that ginger extracts accelerate the gastric emptying process and promote gastric antrum contractions. Other authors, such as Zhang et al. [7], have shown that ginger and its active components possess anti-inflammatory activity, which could protect against inflammation-related diseases such as colitis. This extensive therapeutic application can be attributed to its rich composition of numerous bioactive compounds with notable pharmacological properties.
Gingerols are homologous series of constituents present in fresh ginger rhizomes. Among them, 6-gingerol is the most abundant compound in ginger rhizomes, and it exhibits quite interesting pharmacological activities such as anti-pyretic, cardiotonic, anti-inflammatory, analgesic, cytotoxic, anticarcinogenic, and antioxidant [8,9,10]. In addition to 6-gingerol, ginger rhizome also contains other gingerols, among which 8-gingerol and 10-gingerol stand out. When dried at high temperatures or subjected to prolonged extraction methods, these gingerols may be converted into their corresponding shogaols in the presence of the β-hydroxy keto group, which can be easily dehydrated [11]. Thus, gingerols derive into their relative side-chain alkene (the shogaols) through the dehydration reaction that causes them to lose their hydroxyl group and a hydrogen atom to the adjacent carbon atoms in the side-chain of the alkyl group [10,12,13]. The conversion of gingerols into their corresponding shogaols is illustrated in Figure 1.
The pungency of ginger after undergoing a heat treatment is mainly attributed to shogaols [14,15,16], with these compounds also exhibiting important anti-inflammatory, antioxidant, and antihepatotoxic properties. It has been reported that their activity improves as their side chain length increases [17]. Numerous studies have demonstrated that the temperature and duration of heat exposure significantly influence the conversion of gingerols to shogaols in ginger [18,19,20]. Higher temperatures resulted in a decrease in gingerol concentration while concurrently increasing the concentration of shogaols, which are formed through gingerol dehydration. Nevertheless, researchers have noted that the polymerization of shogaols limits the efficacy of this heat treatment. Jung et al. and Ho et al. [18,19] found that the maximum conversion occurred at temperatures of 125 °C and 130 °C, respectively, with an 80-min processing time. However, when the heating time was extended at the same temperatures, the ginger samples exhibited reduced levels of shogaols, indicating the degradation of these compounds.
Given the significance of the bioactive compounds, the selection of an appropriate extraction method becomes crucial in achieving a quantitative extraction of these valuable constituents. The ideal extraction method should be uncomplicated, economical, efficient, and performed in a short time [14,21]. Ultrasound-assisted extraction (UAE) has proven to be a simple and efficient method to extract compounds from different plant matrices in a shorter time than other extraction practices [22,23]. Ultrasounds trigger several physical episodes, such as turbulence and/or cell rupture due to cavitation. Cavitation causes pressure variations that generate bubbles that develop, collide, and implode both within the sonicated liquid and in the compounds to be extracted [24,25]. To determine the ideal solvent to be used for the extraction, not only the polarity between the solvent and the solute must be considered, but also the physical properties of the solvent itself, as this may have a significant influence on the intensity of cavitation effect to be expected when ultrasounds are applied [26]. Furthermore, the solvent to be used must be safe, non-flammable, and free from toxicity hazards for operators and/or consumers. Finally, the solvent should also be readily available in substantial quantities and at a low cost as well as suitable for environmentally safe disposal [27]. In any case, UAE is expected to be highly effective in the extraction of gingerols and shogaols due to its ability to penetrate the intricate plant matrix with ultrasonic waves, thus effectively breaking down the cell walls and releasing the desired compounds [28]. In addition, the cavitation process enhances mass transfer, resulting in a higher yield of gingerols and shogaols, thus ensuring that the extraction process is efficient and successful. Specifically, in a review by Garza-Cadena et al. [29], the UAE method has shown remarkable selectivity in the extraction of specific target molecules. For example, it has exhibited exceptional recovery rates (greater than 90%) for 6-gingerol, 8-gingerol, and 10-gingerol, indicating its high efficiency in capturing these compounds. In addition, almost complete recovery (approximately 97.36%) of 6-shogaol has been observed, further highlighting the efficacy of the optimized UAE method in extracting this molecule.
The response surface methodology (RSM) was chosen for this research to determine the optimal settings of the control variables that result in a maximum or minimum response within the desired ranges [30]. To achieve this, the Box–Behnken design (BBD) was employed, a widely used method for the development and optimization of extraction methods. BBD allows for the analysis of the effects of different factors and their interactions while reducing the number of experiments required compared to other statistical designs. This ensures cost-effective data collection relevant to the system’s response. The BBD design involves measuring three levels per factor, represented graphically as a cube with a central point and additional points at the midpoints of the cube edges. Each axis represents a factor, while the corners represent their maximum and minimum values. By excluding extreme combinations, BBD eliminates the need to conduct experiments under unfavorable conditions that could yield poor results [31,32,33]. By integrating RSM and BBD, this study aims to systematically explore the parameter space, analyze the effects of different factors and their interactions, and ultimately determine the optimal extraction conditions for maximizing the desired response. This approach enables efficient optimization while minimizing the cost and time required for experimentation, providing valuable insights for the extraction of bioactive compounds from ginger rhizomes.
In addition to employing an efficient and innovative extraction technique such as UAE and conducting method optimization to determine the most suitable combinations for our target compounds, it is vital to utilize reliable and efficient analytical methodologies for precise identification and quantification. In this study, ultra-high-performance liquid chromatography (UHPLC) was chosen as the analytical technique due to its ability to provide fast and high-resolution analysis. Specifically, UHPLC was coupled with a quadrupole-time-of-flight mass spectrometer for pre-identification of the compounds, and later, UHPLC was coupled to a diode array detector (DAD) for accurate quantification.
So, the purpose of this research is to optimize a UAE method for the extraction of the main bioactive compounds present in ginger rhizomes (gingerols and shogaols). For this purpose, BBD, in combination with RSM, has been used to determine the optimal values of specific variables such as the percentage of ethanol in the extraction solvent (water), the temperature, the amplitude and cycle of ultrasound, and the sample-to-solvent ratio for optimal extractions to be obtained. The final optimized method has been then used to determine the gingerols and shogaols contents in ginger rhizomes from a variety of sources.

2. Materials and Methods

2.1. Reagents

The Milli-Q water for the experiments was obtained from a Millipore water purification system (Bedford, MA, USA). The HPLC-grade methanol (99.9%) and acetonitrile (99.9%) used for the chromatographic separation were purchased from Panreac Química S.L.U. (Castellar del Vallés, Spain). The glacial acetic acid (99%), also HPLC grade, was obtained from Merck (Darmstadt, Germany). The ethanol (99.9%) for the extraction was purchased from Panreac Química, S.A.U. (Castellar del Vallés, Barcelona, Spain). The 6-gingerol (5-hydroxy-1-(4-hydroxy-3-methoxyphenyl)-3-decanone) and 6-shogaol (1-(4-hydroxy-3-methoxyphenyl)-4-decen-3-one) used as standards were obtained from (Sigma-Aldrich Chemical Co., St. Louis, MO, USA) for UHPLC quantification.

2.2. The Plant Matrix

The ginger rhizomes used for the development of the extraction method were obtained from a local market in Veracruz, Veracruz, Mexico (19°12′14.1″ N 96°09′41.3″ W). They were washed to remove any remaining dirt, drained to remove the excess water, and then dried using tissue paper towels. The ginger rhizomes were then peeled and cut into 3 mm thick slices and dried in an Apex A39854-14 forced convection oven (Chennai, Tamil Nadu, India). A total of 300 g of fresh rhizome slices were placed on trays at a temperature of 60 °C, and an airflow of 1 m s−1 was applied for 140 min. Finally, the dried ginger slices were ground using a conventional electric blade mill (Mandine MCG2013B-16, Madrid, Spain) into a fine powder (<200 mesh). The powder obtained was stored in vacuum-laminated polyethylene bags at −20 °C until further analysis.

2.3. Ultrasound-Assisted Extraction

The ultrasound-assisted extractions were performed using a Sonopuls Ultrasonic Homogenizer HD4100 (Bandelin, Berlin, Germany). This equipment features controls for both the amplitude (100 W nominal ultrasonic power and 20 kHz frequency) and the cycle of the ultrasounds. For temperature control, a thermostatic bath (FRIGITERM-10, J.P. Selecta S.A., Abrera, Spain) was used. The temperature range studied was selected according to the experimental design to be carried out. The extractions were performed by placing the corresponding amount of ginger powder in “Falcon” tubes together with 20 mL of an ethanol:water solution at different proportions. These tubes were placed inside a double-walled vessel, which was then attached to the water recirculation system to keep them at the temperature set for the thermostatic bath. For the development of the experimental design, the different independent variables (percentage of ethanol in water, extraction temperature, ultrasound amplitude and cycle, and sample-to-solvent ratio) were varied, as described in Section 3.2. The ranges of all study independent variables were selected based on the experience of our research group with similar matrices [34,35,36,37]. Concerning the percentage of ethanol in water and the extraction temperature, both factors were studied independently to choose the correct ranges of study. The extraction time was set at 10 min for all the experiments in the design. After the extractions were completed, the extracts were centrifuged at 1702× g for 5 min, and the supernatant was separated and adjusted to 25 mL so that all the extractions had the same volume. Finally, it was filtered through nylon syringe filters (0.22 µm) for their subsequent analysis by ultra-high-performance liquid chromatography coupled to a quadrupole-time of flight mass spectrometer (UHPLC-QToF-MS) and quantification by a UHPLC–diode array detector (DAD).

2.4. Identification of Gingerols and Shogaols by UHPLC-QToF-MS

The gingerols and their analogs present in the ginger rhizomes (Zingiber officinale) were identified by means of an ultra-high-performance liquid chromatography (UHPLC) system coupled to a quadrupole-time-of flight mass spectrometer (Q-ToF-MS). The method used was the one described by Stipcovich et al. [38], and full positive scanning mode (m/z = 100–800) was applied. The following compounds were individually identified based on their elution order and [M + Na]+ molecular weight by forming adducts with Na: 6-gingerol (6-G), (m/z: 317.4); 6-shogaol (6-S), (m/z: 299.4); 8-gingerol (8-G), (m/z: 345.4); 8-shogaol (8-S), (m/z: 327.4); 10-gingerol (10-G), (m/z: 373.5); 10-shogaol (10-S), (m/z: 355.5); with retention times of 1.90, 3.70, 3.80, 4.78, 4.80, and 5.52 min, respectively. The UHPLC-QToF-MS chromatograms (Figure S1) of the six identified compounds and the corresponding MS spectra (Figures S2–S7) are collected in the Supplementary Material.

2.5. Analysis of the Gingerols and Their Analogues by UHPLC-DAD

The ginger extracts were analyzed by UHPLC using a chromatographic system (Waters Corp., ACQUITYTM, UHPLCTM H-Class; Milford, MA, USA) for the quantification and separation of the main bioactive compounds. The UHPLC system was equipped with a quaternary pump, an automatic sampler, an oven column set at 65 °C for chromatographic separation, and a DAD (Waters Corp., PDA100; Milford, MA, USA). The software application Empower3™ (Waters Corp.; Milford, MA, USA) was used for equipment control and data acquisition. A Waters ACQUITY UPLC BEH C18 (50 mm length, 2.1 mm internal diameter, 1.7 μm particle size) was used as the analytical column. The DAD detector was set to a 200–400 nm wavelength range for 3D scanning. For the peak integrations and quantification of the compounds, the DAD detector was set to 280 nm. The chromatographic method previously described by Vázquez-Espinosa et al. with modifications [39] was used. Acidified water (0.1% acetic acid, solvent A) and acidified acetonitrile (0.1% acetic acid, solvent B) were used as the mobile phase, and a solvent flow rate of 0.5 mL min−1 and a column temperature of 65 °C were used. The gradient used for the chromatographic separations was as follows (time, % solvent B): 0 min, 0%; 0.1 min, 45%; 0.4 min, 45%; 0.9 min, 55%; 1.3 min, 75%; 1.8 min, 75%; 2.4 min, 100%; 4.4 min, 100%; and 4.6 min, 0%; followed by a 5 min column wash using 100% B. The extracts obtained were filtered through 0.2 μm nylon filters (Membrane Solutions; Dallas, USA). Each sample injected had a 3 μL volume.
The individual bioactive compounds were quantified based on the area of each of the chromatographic peaks corresponding to the gingerols and shogaols. The individual bioactive compounds identified and quantified in ginger were, from least to longest retention time, the following: 6-gingerol (6-G); 6- shogaol (6-S); 8-gingerol (8-G); 8-shogaol (8-S); 10-gingerol (10-G); 10-shogaol (10-S). Compounds 6-G and 6-S were quantified based on the calibration curve corresponding to the standards at a concentration range of 0.1–100 mg L−1 for both compounds. The calibration curve for 6-G was y = 3335.6x − 2574.5 (R2: 0.9996), while for 6-S it was y = 1839x − 2241.5 (R2: 0.9995). The 8-G and 10-G gingerols were quantified based on the 6-G calibration curve, while the 8-S and 10-S shogaols were quantified based on the 6-S calibration curve, given that it can be assumed that they have similar structures and similar absorbance levels to those of their analogs. The molecular weight of each compound was also considered for this calculation.

2.6. Experimental Design

The BBD was used to determine the optimal extraction conditions. For this purpose, 5 factors were considered, representing the independent variables at 3 different levels: −1 (low), 0 (medium), and 1 (high). The independent variables were % ethanol in water (X1), extraction temperature (X2), ultrasound amplitude (% of maximum amplitude) (X3), extraction cycle (X4), and sample-to-solvent ratio (X5). The response variables were total gingerol and shogaol compounds (TGSCs: 6-G, 6-S, 8-G, 10-G, 8-S, and 10-S), which represent the sum of the concentrations of the majority compounds in the ginger rhizome samples quantified by (UHPLC-DAD). The BBD consisted of 46 experiments, including 6 replicates at the center point (0, 0, 0, 0, 0, 0, 0, 0, 0). A second-order polynomial equation (Equation (1)) was generated to predict the optimal conditions and determine the correlation between the independent variables and the response.
y = β 0 + i = 1 k β i X i + i = 1 k β i i X i 2 + i < j k β i j X i X j + r
where y is the predicted response (TGSC); β0 is the model constant; Xi and Xj are the independent variables; βi are the linear coefficients; βij are the coefficients corresponding to the interactions; βii are the quadratic coefficients; and r is the sum of the mean squares of the error.

2.7. Statistical Analysis

The data from the analyses, which were performed in triplicate, were expressed as the mean ± the standard deviation (SD). To begin with, these data were subjected to a Shapiro–Wilk test to confirm the normality and homogeneity of data variances. Subsequently, they were subjected to an Analysis of Variance (ANOVA), together with a Tukey’s test, to determine if the different gingerols and shogaols contents exhibited any statistically significant differences at a 95% significance level. Consequently, the results with a p-value lower than 0.05 were considered statistically different. The statistical analyses, as well as the graphical representations of the data, were processed using the statistical package Statgraphics Centurion Version XVIII (Statgraphics Technologies, Inc., The Plains, VA, USA).

3. Results and Discussion

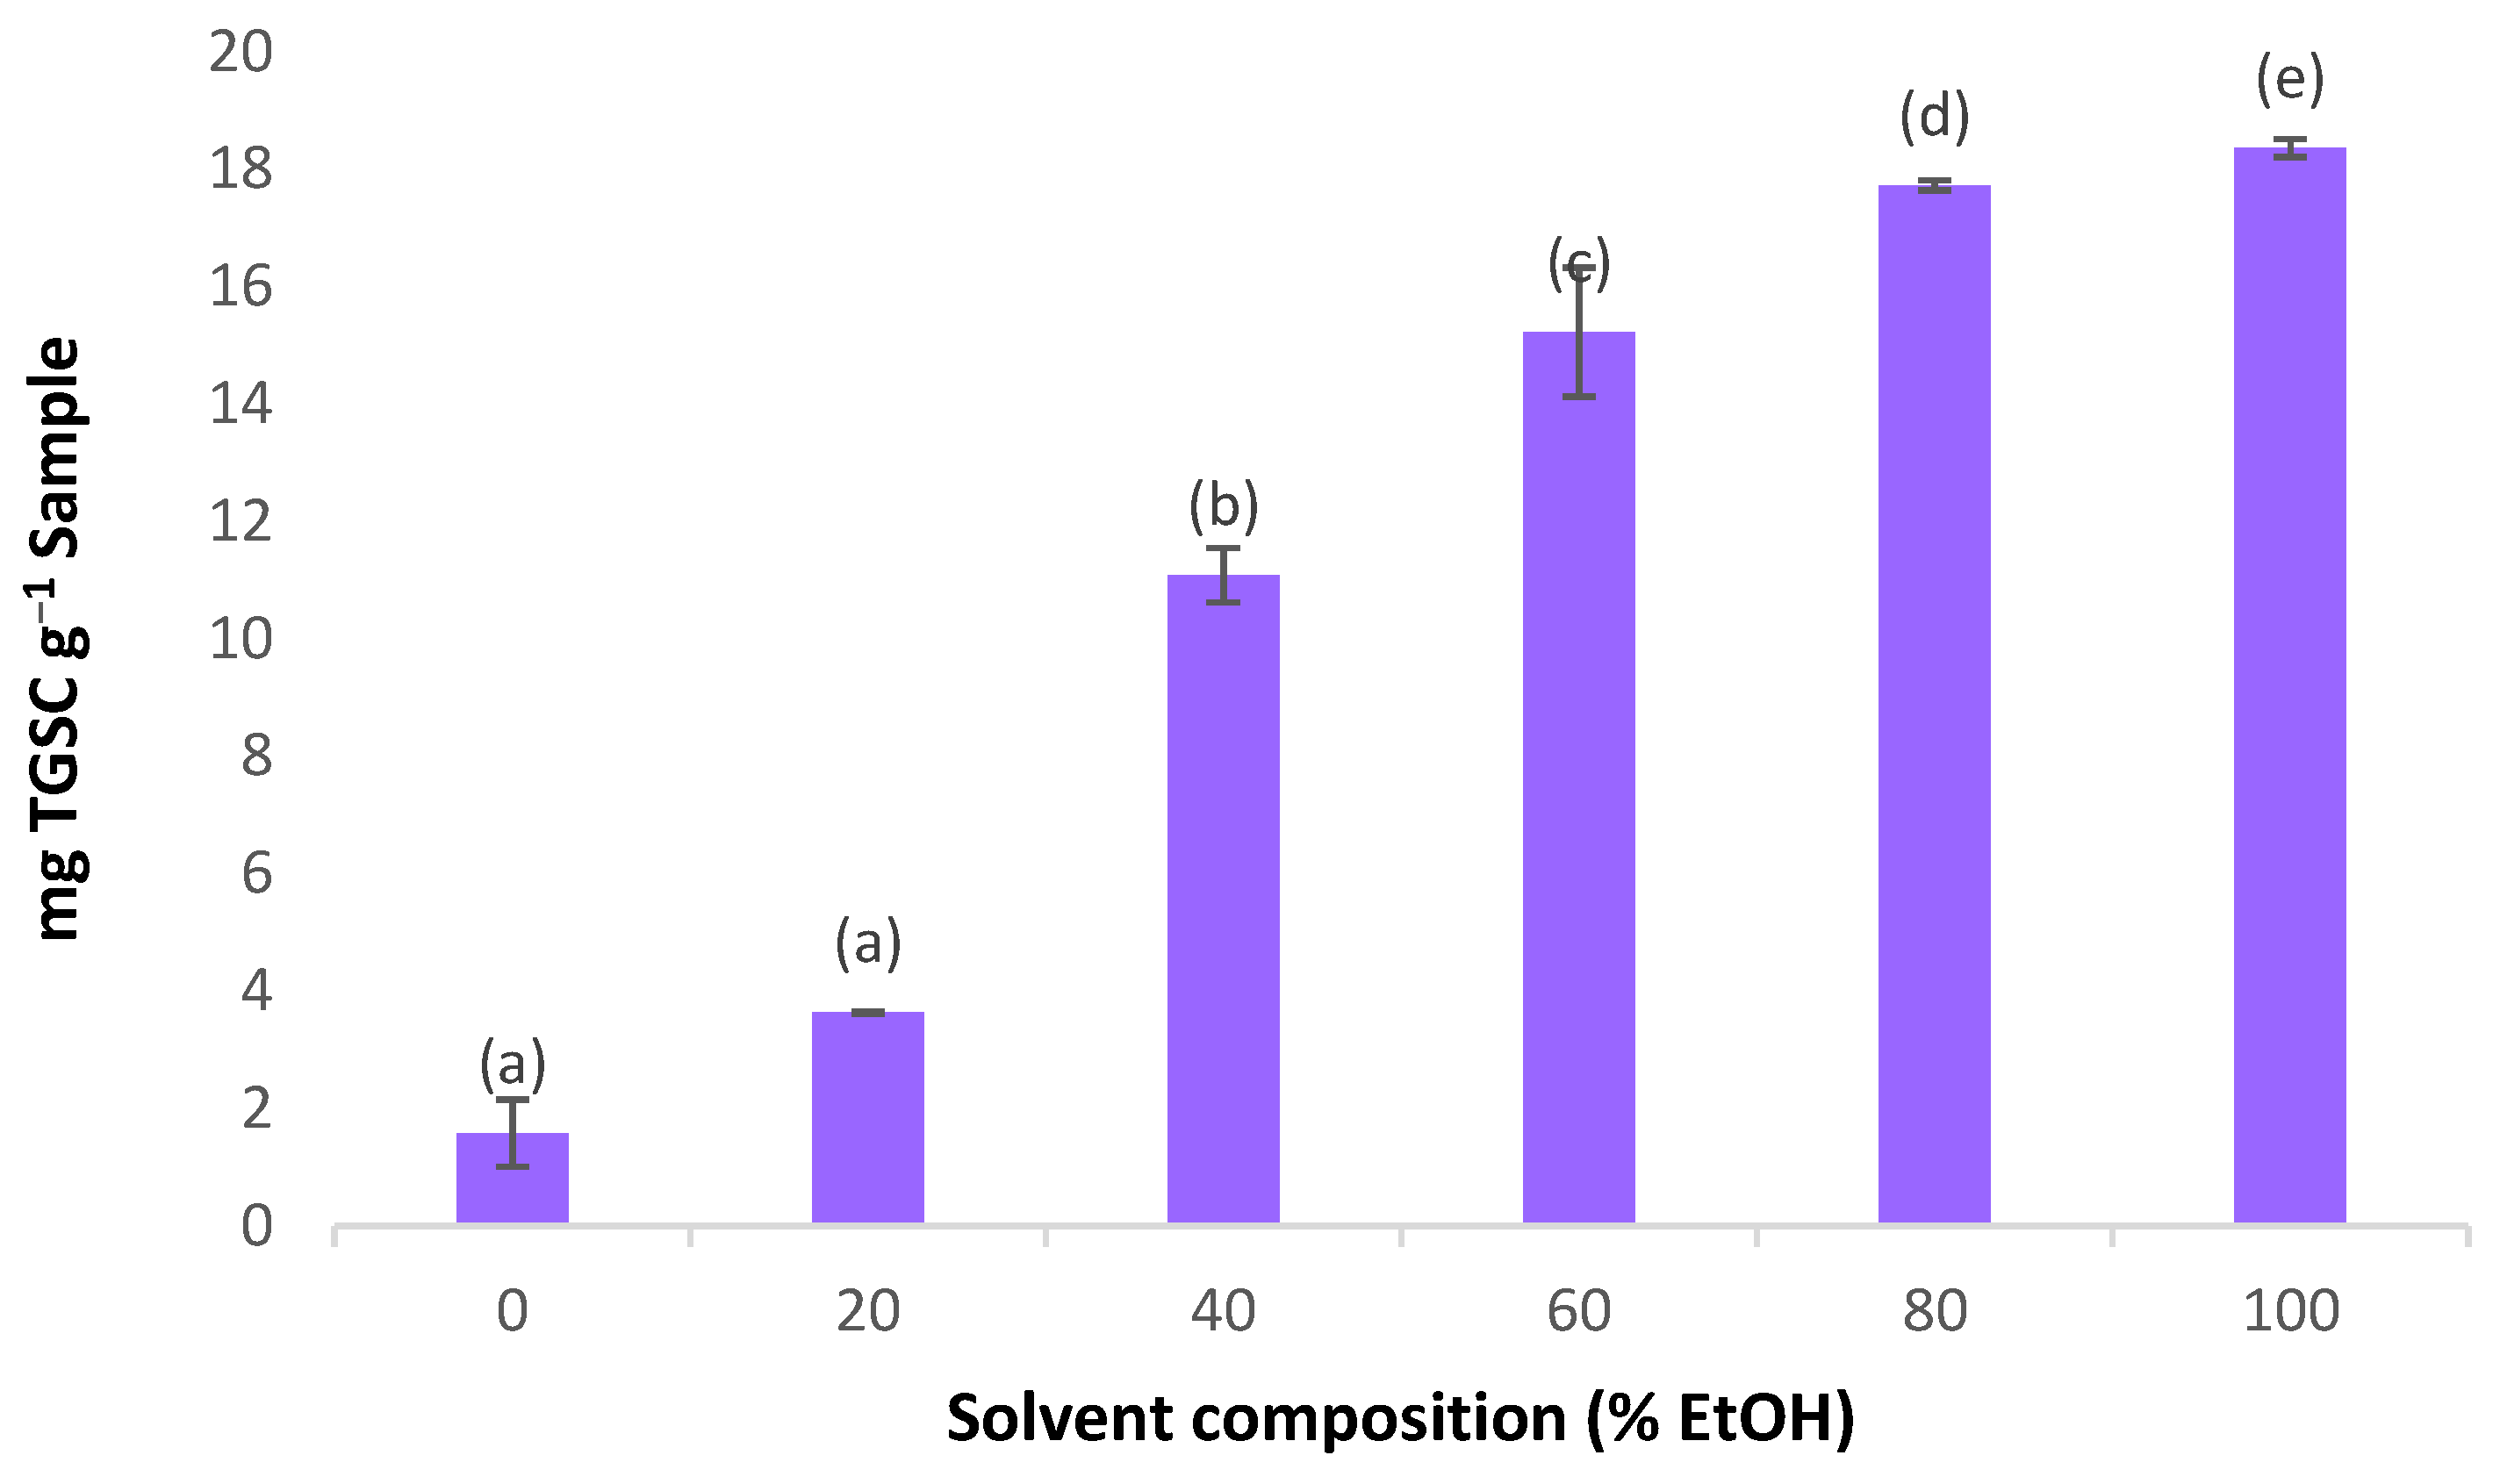
3.1. Determining the Extraction Solvent Optimum Range

Depending on the polarity of the extraction solvent, different compounds are transferred in different proportions from the solid matrix to the liquid phase. For this reason, it is imperative to perform a univariate study using different percentages of ethanol in water (0–20–40–60–80–100% ethanol–water) to determine the optimal percentages to be later considered as the operating range for the BBD. The extractions were performed in triplicate, using a time of 10 min and under the intermediate conditions of the UAE experimental design (sample-to-solvent ratio: 0.5 g:20 mL; 40% amplitude; 0.5 s−1 cycle, 25 °C temperature). The results are presented in Figure 2, demonstrating a clear relationship between the percentage of ethanol and the extraction of gingerols and shogaols. As the percentage of ethanol increased, the extraction of these compounds also increased, which suggests a correlation between the polarity of the compounds and their interactions with the solvent [31]. When selecting a solvent, it is generally important to ensure a high affinity between the solvent and the solute of interest for effective extraction. This affinity enhances the molecular forces, thereby increasing the solubility of the target compounds. Based on our findings, it can be concluded that the bioactive compounds in ginger exhibit a stronger affinity for solvents with a higher ethanol percentage compared to water. This preference aligns with the polarity of these compounds, which is better suited to this ethanol–water mixture. This conclusion is consistent with the findings of other authors, such as Lu et al., who reported that the extraction of gingerols followed the order of 95% ethanol > 50% ethanol > water, further supporting our results [40].

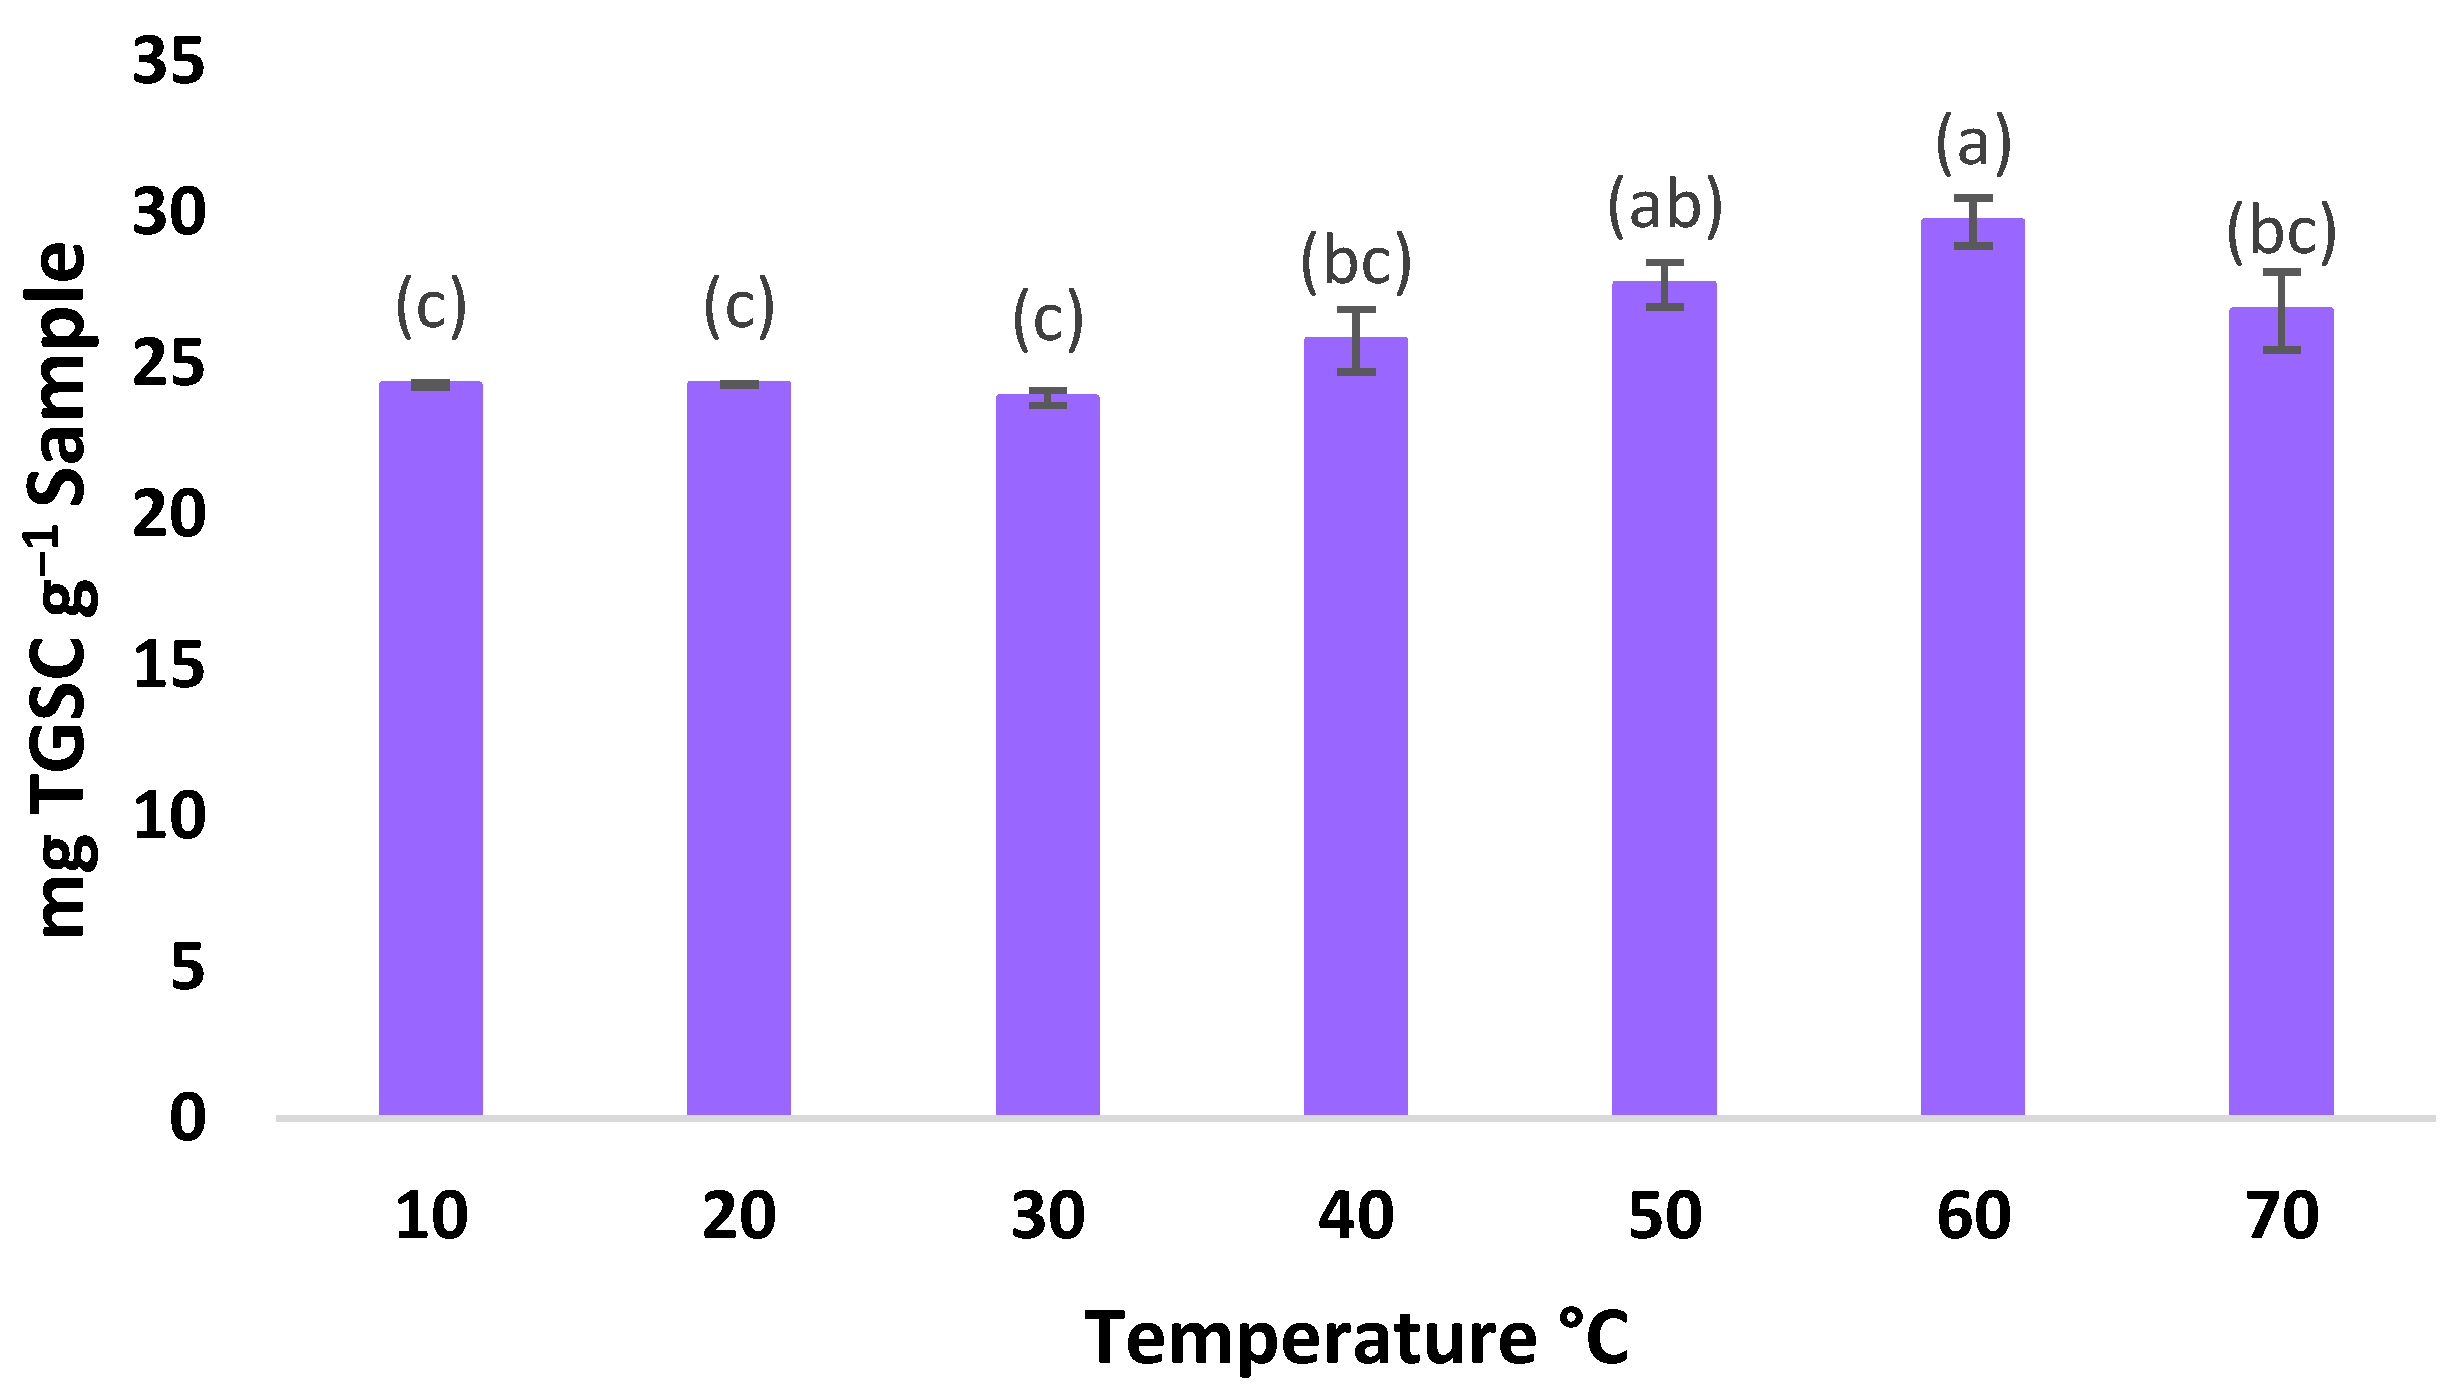
3.2. Determining the Extraction Temperature Range

It is important to evaluate the stability at different temperatures of the bioactive compounds present in the ginger rhizome extracts. Increasing the extraction temperature has been shown to enhance the efficiency of extraction by improving the solubility of the target analytes in the solvent, as well as facilitating the diffusion and mass transfer of the extracted molecules [41]. However, it is important to note that high temperatures can adversely affect the recovery of thermally sensitive compounds, leading to higher degradation rates [42]. The temperatures evaluated were 10–20–30–40–50–60–70 °C for an extraction time of 10 min, and the following UAE conditions: 100% of ethanol; 0.5 g:20 mL of sample-to-solvent ratio; 40% amplitude; 0.5 s−1 cycle. The temperature range studied has been selected based on the research group’s previous experience with a similar plant matrix, namely capsaicinoids [43]. Temperatures above 70 °C have not been evaluated due to the near boiling point of EtOH. The extractions were performed in triplicate.
The results obtained have been displayed in Figure 3, where it can be observed that as the temperature increases up to 60 °C, the extraction yields of the bioactive compounds also increase. However, when the extraction took place at a temperature of 70 °C, a smaller amount of bioactive compounds was obtained, which could be due to the degradation of these compounds as a consequence of the high temperature. This fact was also observed by other authors, who mentioned that high temperatures favored the degradation of gingerols and shogaols above 60 °C, while other products were formed at lower proportions [10,44,45,46].

3.3. Optimization of the Conditions for Ultrasound-Assisted Extraction

After determining the range of percentages for the ethanol in water as well as the temperature range to be included in this study, a BBD was used to optimize the UAE method for the extraction of gingerols and shogaols. The BBD allowed us to evaluate the correlation of the independent variables (i.e., extraction solvent composition, extraction temperature, amplitude, extraction cycle, and sample-to-solvent ratio) as well as their interactions with the response variables (total gingerols and shogaols). Table 1 presents each variable and the range considered for the optimization. The values chosen for the rest of the factors analyzed were selected based on the experience of our research group with similar studies, specifically those performed on peppers [34,35,36,37], since gingerols and shogaols belong to the same vanilloid family [47,48].
Table 2 shows the resulting experimental design and the values corresponding to the sum of the bioactive compounds obtained by the UAEs as well as those predicted by the model. As can be seen, the compounds of interest were in the range of 15.303–27.530 mg of TGSCs g−1 per sample.
The ANOVA was applied to the set of results to evaluate the effect of each factor on the response, identify any possible interactions between them and determine the statistical significance of the model. The results can be seen in Table 3. The factors and/or interactions that presented a p-value lower than 0.05 were factors that significantly influenced the response at a 95% significance level. This analysis also provided information on the mathematical model that had been generated based on the experimental results. A polynomial equation (Equation (2)) was generated to calculate the total content of bioactive compounds, which was derived from the coefficients corresponding to the effects of each variable and their interactions.
TGSC = 23.1314 + 3.80007·X1 + 0.811111·X2 + 0.363806·X3 − 0.00397382·X4
1.28358·X5 − 1.88867·X12 + 0.634846·X1·X2 + 0.200774·X1·X3 + 0.467455·X1·X4
0.751269·X1·X5 − 0.865545·X22 + 0.139133·X2·X3 − 0.360238·X2·X4
0.908232·X2·X5 − 0.401138·X32 + 0.24099·X3·X4 + 0.134113·X3·X5
0.0374793·X42 + 0.463491·X4·X5 − 0.0317111·X52
This information was complemented by a Pareto chart (Figure 4) generated from the design of the experiments. This chart portrays each of the effects and their combination by means of bars arranged in decreasing order of importance. This allows us to visually identify how each variable influences the extraction of TGSCs, as well as which variables have the greatest influence on the extraction process.
According to the information provided by the Pareto chart and the ANOVA, the factors and/or interactions that had some influence on the extractions were % EtOH in water, both individually and as a quadratic effect, and the sample-to-solvent ratio. According to the linear terms, the percentage of ethanol in water was the most significant factor, having a direct correlation with the extraction yields. Thus, the higher the percentage of ethanol, the more efficient the extraction for the range considered. This is due to the polarity of the extraction solvent with respect to that of the compounds of interest. In a previous study by our research group, different percentages of methanol in water were used for the extraction of capsaicinoids. It was then observed that the addition of greater amounts of MeOH to the solvent improved the extraction of capsaicinoids; on the contrary, the recoveries decreased as the percentage of water increased [43]. In the specific case of gingerols and shogaols, several authors have shown that the content of these compounds increases with increasing ethanol concentration in the range studied, obtaining optimum values between 70 and 100% ethanol in water [49].
By contrast, it was observed that the ratio had a negative effect on the extractions, which meant that the lower the ratio, the greater the extraction of the bioactive compounds. This was explained by the fact that, for a reduced amount of sample, while the volume remained constant, the higher concentration gradient between the solid and the liquid led to a greater driving force to diffuse the compounds into the solvent, favored by the mass transfer [43]. Lower ratios were not studied as this would involve concentrations of the compounds of interest below the method quantification limits. Authors such as Jing-Buo et al. agree with these results, presenting optimal ratio values in the low 0.1:10 g/mL range [50].

3.4. Optimal Extraction Conditions

Table 4 presents the values that represent the optimal conditions, determined with the help of the BBD, for the experiment design to achieve the greatest concentrations of bioactive compounds in the ethanolic extract obtained from ginger rhizomes.
The results presented here match those from other studies that reported a higher extraction of gingerols and shogaols at higher concentrations of ethanol in water because of the polarity of gingerols and shogaols with respect to that of ethanol [12,51]. The influence of temperature on the extraction of gingerols and shogaols agrees with that reported by our own research group regarding the extraction of capsaicinoids from pepper at an optimum temperature of 30 and 60 °C. Gingerols, shogaols, capsaicinoids, piperine, and vanillin are all members of a class of compounds known as “vanilloids”. These compounds share structural similarities and common characteristics, particularly in their ability to activate the vanilloid receptors in the body [47,48,52]. Structurally, vanilloids contain a vanillyl group, which consists of a phenolic ring attached to an alkyl chain. Structurally, they all possess a phenolic nucleus, which consists of an aromatic ring to which a specific functional group is attached. This functional group is the one that gives the typical properties to these families of “vanilloid” compounds. For this reason, their extraction processes present certain similarities. In general, increments of temperature reduce the solvent viscosity, which in turn facilitates its penetration into the plant matrix. As the temperature rises, the viscosity of the solvent decreases due to the increased kinetic energy of its molecules. This reduced viscosity enables the solvent to penetrate the plant matrix more readily, reaching the cellular structures where the bioactive compounds are located. Additionally, elevated temperature facilitates mass transfer and diffusion processes, which are critical for the extraction of target compounds. As temperature increases, the molecular movement of both solvent and solute accelerates, promoting faster mass transfer rates. This enhanced mass transfer allows for more efficient extraction of bioactive compounds from the plant material. Finally, temperature influences the solubility of the target compounds in the solvent. In general, as the temperature rises, the solubility of most compounds increases. This increased solubility enables a more extensive extraction of bioactive compounds, resulting in higher yields [41,53,54]. No degradation of gingerols and shogaols could be observed under the experimental extraction conditions used [10]. Likewise, the optimum amplitude and cycle values used agreed with those reported by other studies where these variables were not found to have any relevant influence [55]. In the present study, greater TGSC extractions were achieved when a sample-to-solvent ratio of 0.302 g in 20 mL was used, which is near the minimum value in the range studied. The extraction yield is influenced by the sample/solvent ratio, where a lower ratio (larger volume of solvent for a fixed amount of sample) leads to a more pronounced concentration gradient and, consequently, a higher extraction yield.

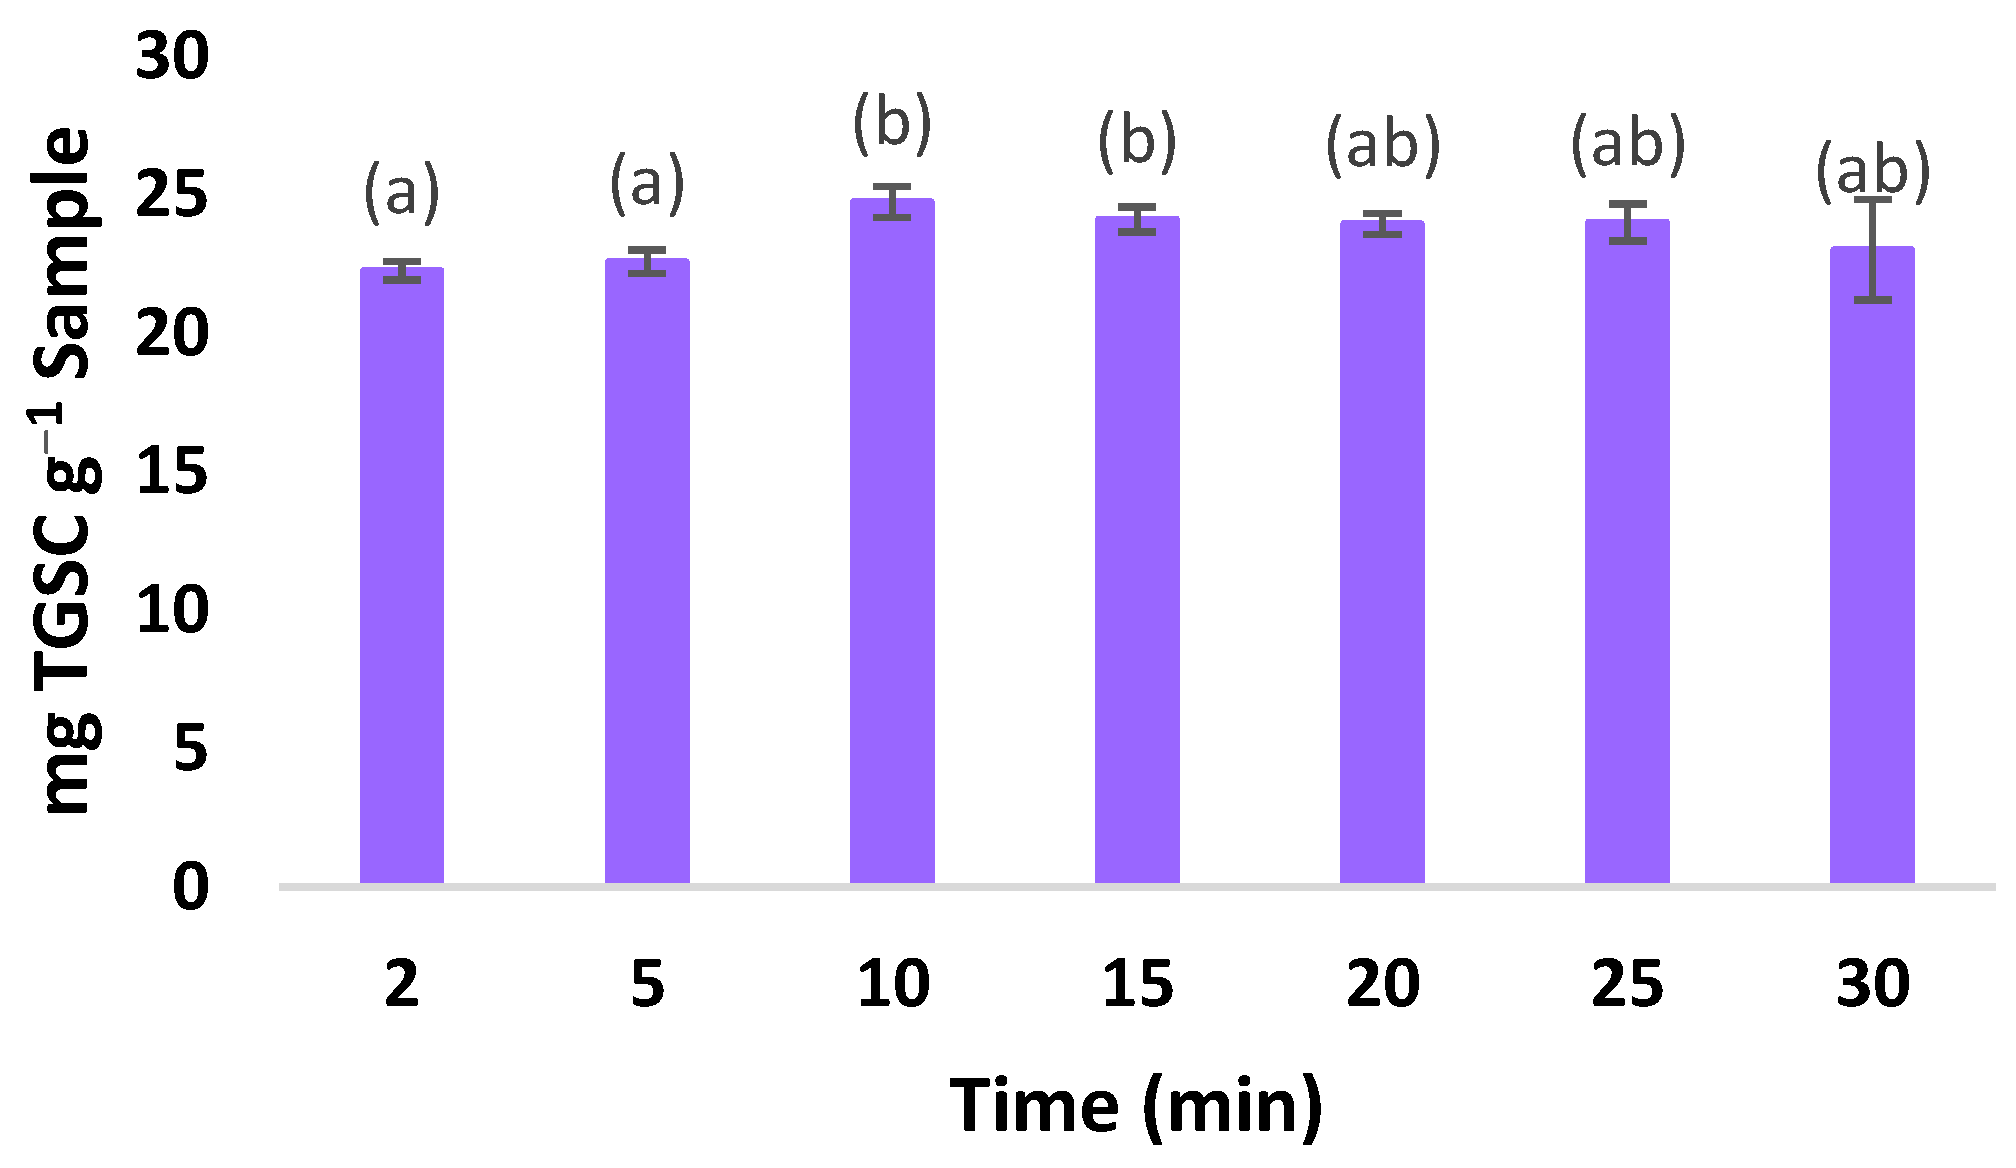
3.5. Determining the Optimal Extraction Time

Once the optimal extraction conditions had been determined, it was necessary to establish the minimum optimal operation that would result in greater concentrations of gingerols and shogaols from the ginger rhizome samples. It is important to note that prolonged extraction times may result in higher recoveries but may also lead to degradation of the compounds of interest. The goal will always be to find the optimal balance between extraction time and stability of the compounds to achieve the highest overall extraction yield. The extractions were performed in triplicate (n = 3) using times that ranged from 2 up to 30 min. Figure 5 shows the results obtained according to the different extraction times. It can be observed that the number of compounds of interest obtained went up as the extraction time was increased up to 10 min. In contrast, longer extraction times did not produce significantly better results. Therefore, based on the lack of significant differences, 10 min was selected as the optimal extraction time. This selection ensures the attainment of superior outcomes within a shorter extraction period, leading to cost savings.

3.6. Repeatability and Intermediate Precision of the Method

The repeatability and intermediate precision of the method that had been developed had to be evaluated. For the repeatability evaluation, nine extractions were performed on the same day (n = 9), while for the intermediate precision, nine extractions were completed on three consecutive days (n = 9 + 9 + 9 + 9). These extractions were performed using the optimal values that had been determined during the development of the UAE method. Thus, a coefficient of variation of 2.87% was determined for its repeatability, while 3.42% was the intermediate precision measured. These data are within the limits of acceptance as established by the Association of Official Agricultural Chemists (AOAC), and therefore, the method that had been developed was considered satisfactory in terms of precision and repeatability.

3.7. Implementation of the Optimized Extraction Method to Real Samples

The optimized extraction method that had been developed was applied to eight commercial ginger samples. The extractions were carried out in triplicate. The data registered from these extractions have been displayed in Table 5.
It can be observed that the TGSC values are between 18.24 and 8.42 mg TGSCs g−1, which agrees with those reported in similar studies by the authors [56]. On the other hand, it could also be observed that, as pointed out by other investigations, 6-gingerol was the major compound. The original content of these compounds in the plant matrix may vary depending on the growing conditions, i.e., the climate, harvest time, or geographical area where the plants are cultivated [14,57]. Numerous studies can be found in the literature that highlight the pharmacological properties of these compounds and their analogs and the beneficial effect that their consumption has on human health [16,58]. According to some of those studies, they effectively prevent nausea [5,59], while some evidence suggests their potential capacity to fight the infections caused by SARS-CoV-2 [60,61,62]. Furthermore, these compounds exhibit antioxidant, antimicrobial, antidiabetic, anti-inflammatory, and analgesic activities [49,63,64].

4. Conclusions

In this work, a UAE method has been developed and optimized by means of the BBD in combination with the RSM to recover the bioactive compounds found in ginger rhizomes (gingerols and shogaols). The following optimal extraction conditions were determined: 100% ethanol at 60 °C for 10 min of extraction, with an ultrasound power of 51.8%, a cycle of 0.458 s−1, and a sample-to-solvent ratio of 0.302 g:20 mL sample. The optimized method has been successfully validated for repeatability and intermediate precision. Finally, the method was applied to several real samples, and the extractions were quantified for gingerols and shogaols. 6-gingerol was confirmed as the major compound in most cases. These results demonstrate that the method that has been developed in this study for the extraction of gingerols and shogaols from ginger rhizomes is reliable, practical, efficient, and demands short extraction times. In conclusion, the optimized UAE method allows researchers to extract a greater amount of bioactive compounds from ginger samples, leading to a more comprehensive understanding of the chemical composition and functional properties of different ginger varieties. The developed method allows the quantitative extraction of gingerols and shogaols in a very short time (10 min), which will have an impact on the optimization of the quality control of ginger and products made from ginger. This knowledge also paves the way for the development of ginger products that boast improved bifunctional characteristics and potential health benefits.

Supplementary Materials

The following supporting information can be downloaded at https://www.mdpi.com/article/10.3390/agronomy13071787/s1, Figure S1: UHPLC-QToF-MS chromatograms of the six identified compounds. A: 6-gingerol; B: 6-shogaol; C: 8-gingerol; D: 8-shogaol; E: 10-gingerol; F: 10-shogaol; Figure S2: Mass spectrum obtained for 6-gingerol by UHPLC-Q-ToF-MS; Figure S3: Mass spectrum obtained for 6-shogaol by UHPLC-Q-ToF-MS; Figure S4: Mass spectrum obtained for 8-gingerol by UHPLC-Q-ToF-MS; Figure S5: Mass spectrum obtained for 8-shogaol by UHPLC-Q-ToF-MS; Figure S6: Mass spectrum obtained for 10-gingerol by UHPLC-Q-ToF-MS; Figure S7: Mass spectrum obtained for 10-shogaol by UHPLC-Q-ToF-MS.

Author Contributions

Conceptualization, M.Á.G.-A., G.F.B. and M.P.; methodology, M.G.-G., M.V.-E. and A.V.G.-d.-P.; software, G.d.C.R.-J. and G.F.B.; validation, C.C., G.F.B. and M.Á.G.-A.; formal analysis, M.G.-G., B.J.Y.-P., M.V.-E. and A.V.G.-d.-P.; investigation, G.d.C.R.-J., C.C. and G.F.B.; resources, G.d.C.R.-J. and G.F.B.; data curation, M.G.-G., M.P. and G.F.B.; writing—original draft preparation, M.G.-G., M.V.-E. and A.V.G.-d.-P.; writing—review and editing, G.F.B.; visualization, G.F.B.; supervision, M.P., M.Á.G.-A., G.d.C.R.-J. and G.F.B.; project administration, G.F.B. and G.d.C.R.-J.; funding acquisition, G.F.B. and G.d.C.R.-J. All authors have read and agreed to the published version of the manuscript.

Funding

This work has been supported by the project “EQC2018-005135-P” (Equipment for liquid chromatography using mass spectrometry and ion chromatography) of the State Subprogram of Research Infrastructures and Technical Scientific Equipment. The authors express their gratitude to the Consejo Nacional de Ciencia y Tecnologia (CONACyT) and the Tecnológico Nacional de México.

Data Availability Statement

The data presented in this study are contained within the article.

Acknowledgments

The authors are grateful to the “Instituto de Investigación Vitivinícola y Agroalimentaria” (IVAGRO) for providing the necessary facilities to carry out the research. A special acknowledgment is extended to the Mass Spectrometry Division from the Central Research Services for Science and Technology (SC-ICYT) of the University of Cadiz for the collaboration throughout the analysis of the samples. The authors thank the Consejo Nacional de Ciencia y Tecnología (CONACyT), “Apoyos complementarios para Mujeres Indígenas Becarias CONACYT” and Telmex-Excelencia for the resources provided.

Conflicts of Interest

The authors declare no conflict of interest.

References

  1. Karna, P.; Chagani, S.; Gundala, S.R.; Rida, P.C.G.; Asif, G.; Sharma, V.; Gupta, M.V.; Aneja, R. Benefits of Whole Ginger Extract in Prostate Cancer. Br. J. Nutr. 2012, 107, 473–484. [Google Scholar] [CrossRef] [Green Version]
  2. Singletary, K. Ginger: An Overview of Health Benefits. Nutr. Today 2010, 45, 171. [Google Scholar] [CrossRef]
  3. Semwal, R.B.; Semwal, D.K.; Combrinck, S.; Viljoen, A.M. Gingerols and Shogaols: Important Nutraceutical Principles from Ginger. Phytochemistry 2015, 117, 554–568. [Google Scholar] [CrossRef] [PubMed]
  4. Dugasani, S.; Pichika, M.R.; Nadarajah, V.D.; Balijepalli, M.K.; Tandra, S.; Korlakunta, J.N. Comparative Antioxidant and Anti-Inflammatory Effects of [6]-Gingerol, [8]-Gingerol, [10]-Gingerol and [6]-Shogaol. J. Ethnopharmacol. 2010, 127, 515–520. [Google Scholar] [CrossRef]
  5. Giacosa, A.; Morazzoni, P.; Bombardelli, E.; Riva, A.; Bianchi Porro, G.; Rondanelli, M. Can Nausea and Vomiting Be Treated with Ginger Extract? Eur. Rev. Med. Pharmacol. Sci. 2015, 19, 1291–1296. [Google Scholar]
  6. de Lima, R.M.T.; Dos Reis, A.C.; de Menezes, A.-A.P.M.; de Oliveira Santos, J.V.; de Oliveira Filho, J.W.G.; de Oliveira Ferreira, J.R.; de Alencar, M.V.O.B.; da Mata, A.M.O.F.; Khan, I.N.; Islam, A.; et al. Protective and Therapeutic Potential of Ginger (Zingiber officinale) Extract and [6]-Gingerol in Cancer: A Comprehensive Review. Phytother. Res. 2018, 32, 1885–1907. [Google Scholar] [CrossRef]
  7. Zhang, G.; Nitteranon, V.; Chan, L.Y.; Parkin, K.L. Glutathione conjugation attenuates biological activities of 6-dehydroshogaol from ginger. Food Chem. 2013, 140, 1–8. [Google Scholar] [CrossRef] [PubMed]
  8. Rai, S.; Mukherjee, K.; Mal, M.; Wahile, A.; Saha, B.P.; Mukherjee, P.K. Determination of 6-Gingerol in Ginger (Zingiber officinale) Using High-Performance Thin-Layer Chromatography. J. Sep. Sci. 2006, 29, 2292–2295. [Google Scholar] [CrossRef]
  9. Zick, S.M.; Djuric, Z.; Ruffin, M.T.; Litzinger, A.J.; Normolle, D.P.; Alrawi, S.; Feng, M.R.; Brenner, D.E. Pharmacokinetics of 6-Gingerol, 8-Gingerol, 10-Gingerol, and 6-Shogaol and Conjugate Metabolites in Healthy Human Subjects. Cancer Epidemiol. Biomarkers Prev. 2008, 17, 1930–1936. [Google Scholar] [CrossRef] [Green Version]
  10. Bhattarai, S.; Tran, V.H.; Duke, C.C. The Stability of Gingerol and Shogaol in Aqueous Solutions. J. Pharm. Sci. 2001, 90, 1658–1664. [Google Scholar] [CrossRef]
  11. Anisa, N.I.; Azian, N.; Sharizan, M.; Iwai, Y. Temperature Effects on Diffusion Coefficient for 6-Gingerol and 6-Shogaol in Subcritical Water Extraction. J. Phys. Conf. Ser. 2014, 495, 012009. [Google Scholar] [CrossRef]
  12. Phoungchandang, S.; Nongsang, S.; Sanchai, P. The Development of Ginger Drying Using Tray Drying, Heat Pump–Dehumidified Drying, and Mixed-Mode Solar Drying. Dry. Technol. 2009, 27, 1123–1131. [Google Scholar] [CrossRef]
  13. Johnson, J.B.; Mani, J.S.; White, S.; Brown, P.; Naiker, M. Quantitative Profiling of Gingerol and Its Derivatives in Australian Ginger. J. Food Compos. Anal. 2021, 104, 104190. [Google Scholar] [CrossRef]
  14. Ghasemzadeh, A.; Jaafar, H.Z.E.; Rahmat, A. Optimization Protocol for the Extraction of 6-Gingerol and 6-Shogaol from Zingiber officinale Var. Rubrum Theilade and Improving Antioxidant and Anticancer Activity Using Response Surface Methodology. BMC Complement. Altern. Med. 2015, 15, 258. [Google Scholar] [CrossRef] [Green Version]
  15. Baliga, M.S.; Haniadka, R.; Pereira, M.M.; D’Souza, J.J.; Pallaty, P.L.; Bhat, H.P.; Popuri, S. Update on the Chemopreventive Effects of Ginger and Its Phytochemicals. Crit. Rev. Food Sci. Nutr. 2011, 51, 499–523. [Google Scholar] [CrossRef]
  16. Ali, B.H.; Blunden, G.; Tanira, M.O.; Nemmar, A. Some Phytochemical, Pharmacological and Toxicological Properties of Ginger (Zingiber officinale Roscoe): A Review of Recent Research. Food Chem. Toxicol. 2008, 46, 409–420. [Google Scholar] [CrossRef] [PubMed]
  17. Kim, D.S.H.L.; Kim, J.Y. Side-Chain Length Is Important for Shogaols in Protecting Neuronal Cells from β-Amyloid Insult. Bioorg. Med. Chem. Lett. 2004, 14, 1287–1289. [Google Scholar] [CrossRef]
  18. Jung, M.Y.; Lee, M.K.; Park, H.J.; Oh, E.B.; Shin, J.Y.; Park, J.S.; Jung, S.Y.; Oh, J.H.; Choi, D.S. Heat-induced conversion of gingerols to shogaols in ginger as affected by heat type (dry or moist heat), sample type (fresh or dried), temperature and time. Food Sci. Biotechnol. 2017, 27, 687–693. [Google Scholar] [CrossRef]
  19. Ho, S.; Su, M. Optimized heat treatment enhances the anti-inflammatory capacity of ginger. Int. J. Food Prop. 2016, 19, 1884–1898. [Google Scholar] [CrossRef]
  20. Cheng, X.; Liu, Q.; Peng, Y.; Qi, L.; Li, P. Steamed ginger (Zingiber officinale): Changed chemical profile and increased anticancer potential. Food Chem. 2011, 129, 1785–1792. [Google Scholar] [CrossRef]
  21. Kalantari, K.; Moniri, M.; Boroumand Moghaddam, A.; Abdul Rahim, R.; Bin Ariff, A.; Izadiyan, Z.; Mohamad, R. A Review of the Biomedical Applications of Zerumbone and the Techniques for Its Extraction from Ginger Rhizomes. Molecules 2017, 22, 1645. [Google Scholar] [CrossRef] [PubMed] [Green Version]
  22. Sasikala, P.; Chandralekha, A.; Chaurasiya, R.S.; Chandrasekhar, J.; Raghavarao, K.S.M.S. Ultrasound-Assisted Extraction and Adsorption of Polyphenols from Ginger Rhizome (Zingiber officinale). Sep. Sci. Technol. 2018, 53, 439–448. [Google Scholar] [CrossRef]
  23. Tzani, A.; Kalafateli, S.; Tatsis, G.; Bairaktari, M.; Kostopoulou, I.; Pontillo, A.R.N.; Detsi, A. Natural Deep Eutectic Solvents (NaDESs) as Alternative Green Extraction Media for Ginger (Zingiber officinale Roscoe). Sustain. Chem. 2021, 2, 576–598. [Google Scholar] [CrossRef]
  24. Leighton, T.G. The Acoustic Bubble; Academic Press: Cambridge, MA, USA, 1997; ISBN 978-0-12-441921-6. [Google Scholar]
  25. Balachandran, S.; Kentish, S.E.; Mawson, R.; Ashokkumar, M. Ultrasonic Enhancement of the Supercritical Extraction from Ginger. Ultrason. Sonochem. 2006, 13, 471–479. [Google Scholar] [CrossRef] [PubMed]
  26. Vilkhu, K.; Mawson, R.; Simons, L.; Bates, D. Applications and Opportunities for Ultrasound Assisted Extraction in the Food Industry—A Review. Innov. Food Sci. Emerg. Technol. 2008, 9, 161–169. [Google Scholar] [CrossRef]
  27. Albu, S.; Joyce, E.; Paniwnyk, L.; Lorimer, J.P.; Mason, T.J. Potential for the Use of Ultrasound in the Extraction of Antioxidants from Rosmarinus officinalis for the Food and Pharmaceutical Industry. Ultrason. Sonochem. 2004, 11, 261–265. [Google Scholar] [CrossRef]
  28. Lakshmipathy, K.; Thirunavookarasu, N.; Kalathil, N.; Chidanand, D.V.; Rawson, A.; Sunil, C.K. Effect of different thermal and non-thermal pre-treatments on bioactive compounds of aqueous ginger extract obtained using vacuum-assisted conductive drying system. J. Food Process Eng. 2023, 46, e14223. [Google Scholar] [CrossRef]
  29. Garza-Cadena, C.; Ortega-Rivera, D.M.; Machorro-García, G.; Gonzalez-Zermeño, E.M.; Homma-Dueñas, D.; Plata-Gryl, M.; Castro-Muñoz, R. A comprehensive review on Ginger (Zingiber officinale) as a potential source of nutraceuticals for food formulations: Towards the polishing of gingerol and other present biomolecules. Food Chem. 2023, 413, 135629. [Google Scholar] [CrossRef]
  30. Khuri, A.I.; Mukhopadhyay, S. Response Surface Methodology. Wiley Interdiscip. Rev. Comput. Stat. 2010, 2, 128–149. [Google Scholar] [CrossRef]
  31. Yerena-Prieto, B.J.; Gonzalez-Gonzalez, M.; Vázquez-Espinosa, M.; González-de-Peredo, A.V.; García-Alvarado, M.Á.; Palma, M.; Rodríguez-Jimenes, G.d.C.; Barbero, G.F. Optimization of an Ultrasound-Assisted Extraction Method Applied to the Extraction of Flavonoids from Moringa Leaves (Moringa oleífera Lam.). Agronomy 2022, 12, 261. [Google Scholar] [CrossRef]
  32. Watson, M.; Long, H.; Lu, B. Investigation of Wrinkling Failure Mechanics in Metal Spinning by Box-Behnken Design of Experiments Using Finite Element Method. Int. J. Adv. Manuf. Technol. 2015, 78, 981–995. [Google Scholar] [CrossRef] [Green Version]
  33. Ferreira, S.L.C.; Bruns, R.E.; Ferreira, H.S.; Matos, G.D.; David, J.M.; Brandão, G.C.; da Silva, E.G.P.; Portugal, L.A.; dos Reis, P.S.; Souza, A.S.; et al. Box-Behnken Design: An Alternative for the Optimization of Analytical Methods. Anal. Chim. Acta 2007, 597, 179–186. [Google Scholar] [CrossRef] [PubMed]
  34. Vázquez Espinosa, M.; Álvarez-Romero, M.; Velasco González de Peredo, A.; Ruiz Rodríguez, A.; Ferreiro-González, M.; Barbero, G.; Palma, M. Capsaicinoid Content in the Pericarp and Placenta of Bolilla Peppers (Capsicum annuum L.) throughout the Ripening of the Fruit at Two Different Stages of Plant Maturation. Agronomy 2023, 13, 435. [Google Scholar] [CrossRef]
  35. Vázquez Espinosa, M.; Fayos, O.; Velasco González de Peredo, A.; Espada-Bellido, E.; Ferreiro-González, M.; Palma, M.; Garcés-Claver, A.; Barbero, G. Changes in Capsiate Content in Four Chili Pepper Genotypes (Capsicum Spp.) at Different Ripening Stages. Agronomy 2020, 10, 1337. [Google Scholar] [CrossRef]
  36. Vázquez Espinosa, M.; Fayos, O.; Velasco González de Peredo, A.; Espada-Bellido, E.; Ferreiro-González, M.; Palma, M.; Garcés-Claver, A.; Barbero, G. Content of Capsaicinoids and Capsiate in “Filius” Pepper Varieties as Affected by Ripening. Plants 2020, 9, 1222. [Google Scholar] [CrossRef] [PubMed]
  37. Olguín-Rojas, J.; Fayos, O.; Vázquez León, L.A.; Ferreiro-González, M.; Rodriguez-Jimenes, G.; Palma, M.; Garcés-Claver, A.; Barbero, G. Progression of the Total and Individual Capsaicinoids Content in the Fruits of Three Different Cultivars of Capsicum chinense Jacq. Agronomy 2019, 9, 141. [Google Scholar] [CrossRef] [Green Version]
  38. Stipcovich, T.; Barbero, G.F.; Ferreiro-González, M.; Palma, M.; Barroso, C.G. Fast analysis of capsaicinoids in Naga Jolokia extracts (Capsicum chinense) by high-performance liquid chromatography using fused core columns. Food Chem. 2018, 239, 217–224. [Google Scholar] [CrossRef]
  39. Vázquez Espinosa, M.; Velasco González de Peredo, A.; Espada-Bellido, E.; Ferreiro-González, M.; Barbero, G.; Palma, M. Simultaneous Determination by UHPLC-PDA of Major Capsaicinoids and Capsinoids Contents in Peppers. Food Chem. 2021, 356, 129688. [Google Scholar] [CrossRef]
  40. Lu, M.; Xia, X.; Chou, G.; Liu, D.; Zuberi, A.; Ye, J.; Liu, Z. Variations in the Contents of Gingerols and Chromatographic Fin-gerprints of Ginger Root Extracts Prepared by Different Preparation Methods. J. AOAC Int. 2001, 97, 50–57. [Google Scholar] [CrossRef]
  41. Wijngaard, H.; Hossain, M.B.; Rai, D.K.; Brunton, N. Techniques to Extract Bioactive Compounds from Food By-Products of Plant Origin. Food Res. Int. 2012, 46, 505–513. [Google Scholar] [CrossRef]
  42. Pereira, D.T.V.; Tarone, A.G.; Cazarin, C.B.B.; Barbero, G.F.; Martínez, J. Pressurized Liquid Extraction of Bioactive Compounds from Grape Marc. J. Food Eng. 2019, 240, 105–113. [Google Scholar] [CrossRef]
  43. Barbero, G.F.; Liazid, A.; Palma, M.; Barroso, C.G. Ultrasound-Assisted Extraction of Capsaicinoids from Peppers. Talanta 2008, 75, 1332–1337. [Google Scholar] [CrossRef] [PubMed]
  44. Gopi, S.; Ac, K.; Jude, S. Study on Temperature Dependent Conversion of Active Components of Ginger. Int. J. Pharma. Sci. 2016, 6, 1344–1347. [Google Scholar]
  45. Varakumar, S.; Umesh, K.V.; Singhal, R.S. Enhanced extraction of oleoresin from ginger (Zingiber officinale) rhizome powder using enzyme-assisted three phase partitioning. Food Chem. 2017, 216, 27–36. [Google Scholar] [CrossRef]
  46. George, J.M.; Sowbhagya, H.B.; Rastogi, N.K. Effect of high pressure pretreatment on drying kinetics and oleoresin extraction from ginger. Dry. Technol. 2018, 36, 1107–1116. [Google Scholar] [CrossRef]
  47. Sánchez, M.G.; Sánchez, A.M.; Collado, B.; Malagarie-Cazenave, S.; Olea, N.; Carmena, M.J.; Prieto, J.C.; Díaz-Laviada, I. Expression of the Transient Receptor Potential Vanilloid 1 (TRPV1) in LNCaP and PC-3 Prostate Cancer Cells and in Human Prostate Tissue. Eur. J. Pharmacol. 2005, 515, 20–27. [Google Scholar] [CrossRef] [PubMed]
  48. Flynn, D.L.; Rafferty, M.F.; Boctor, A.M. Inhibition of Human Neutrophil 5-Lipoxygenase Activity by Gingerdione, Shogaol, Capsaicin and Related Pungent Compounds. Prostaglandins Leukot. Med. 1986, 24, 195–198. [Google Scholar] [CrossRef]
  49. Kamaruddin, M.S.H.; Chong, G.H.; Mohd Daud, N.; Putra, N.R.; Md Salleh, L.; Suleiman, N. Bioactivities and green advanced extraction technologies of ginger oleoresin extracts: A review. Food Res. Int. 2023, 164, 112283. [Google Scholar] [CrossRef]
  50. Guo, J.-B.; Fan, Y.; Zhang, W.-J.; Wu, H.; Du, L.-M.; Chang, Y.-X. Extraction of gingerols and shogaols from ginger (Zingi-ber officinale Roscoe) through microwave technique using ionic liquids. J. Food Compos. Anal. 2017, 62, 35–42. [Google Scholar] [CrossRef]
  51. Liu, W.; Zhou, C.-L.; Zhao, J.; Chen, D.; Li, Q.-H. Optimized Microwave-Assisted Extraction of 6-Gingerol from Zingiber officinale Roscoe and Evaluation of Antioxidant Activity in Vitro. Acta Sci. Pol. Technol. Aliment. 2014, 13, 155–168. [Google Scholar] [CrossRef] [Green Version]
  52. Lee, E.; Surh, Y.J. Induction of Apoptosis in HL-60 Cells by Pungent Vanilloids, [6]-Gingerol and [6]-Paradol. Cancer Lett. 1998, 134, 163–168. [Google Scholar] [CrossRef]
  53. Mustafa, A.; Turner, C. Pressurized Liquid Extraction as a Green Approach in Food and Herbal Plants Extraction: A Review. Anal. Chim. Acta 2011, 703, 8–18. [Google Scholar] [CrossRef] [PubMed]
  54. Patras, A.; Brunton, N.P.; O’Donnell, C.; Tiwari, B.K. Effect of Thermal Processing on Anthocyanin Stability in Foods; Mechanisms and Kinetics of Degradation. Trends Food Sci. Technol. 2010, 21, 3–11. [Google Scholar] [CrossRef]
  55. Aliaño-González, M.J.; Ferreiro-González, M.; Espada-Bellido, E.; Carrera, C.; Palma, M.; Álvarez, J.A.; Ayuso, J.; Barbero, G.F. Extraction of Anthocyanins and Total Phenolic Compounds from Açai (Euterpe oleracea Mart.) Using an Experimental Design Methodology. Part 1: Pressurized Liquid Extraction. Agronomy 2020, 10, 183. [Google Scholar] [CrossRef] [Green Version]
  56. Park, S.Y.; Jung, M.Y. UHPLC-ESI-MS/MS for the Quantification of Eight Major Gingerols and Shogaols in Ginger Products: Effects of Ionization Polarity and Mobile Phase Modifier on the Sensitivity. J. Food Sci. 2016, 81, C2457–C2465. [Google Scholar] [CrossRef] [PubMed]
  57. Vedashree, M.V.; Naidu, M. Optimization of 6-Gingerol Extraction Assisted by Microwave From Fresh Ginger Using Response Surface Methodology. J. Adv. Chem. 2018, 15, 6173–6185. [Google Scholar] [CrossRef]
  58. Daharia, A.; Jaiswal, V.; Royal, K.; Sharma, H.; Joginath, A.; Kumar, R.; Saha, P. A Comparative Review on Ginger and Garlic with Their Pharmacological Action. Asian J. Pharm. Res. Dev. 2022, 10, 65–69. [Google Scholar] [CrossRef]
  59. Lindblad, A.J.; Koppula, S. Ginger for nausea and vomiting of pregnancy. Can. Fam. Physician 2016, 62, 145. [Google Scholar]
  60. Jafarzadeh, A.; Jafarzadeh, S.; Nemati, M. Therapeutic Potential of Ginger against COVID-19: Is There Enough Evidence? J. Tradit. Chin. Med. Sci. 2021, 8, 267–279. [Google Scholar] [CrossRef]
  61. Safa, O.; Hassaniazad, M.; Farashahinejad, M.; Davoodian, P.; Dadvand, H.; Hassanipour, S.; Fathalipour, M. Effects of Ginger on Clinical Manifestations and Paraclinical Features of Patients with Severe Acute Respiratory Syndrome Due to COVID-19: A Structured Summary of a Study Protocol for a Randomized Controlled Trial. Trials 2020, 21, 841. [Google Scholar] [CrossRef]
  62. Rabie, A.M. New Potential Inhibitors of Coronaviral Main Protease (CoV-Mpro): Strychnine Bush, Pineapple, and Ginger Could Be Natural Enemies of COVID-19. Int. J. New Chem. 2022, 9, 433–445. [Google Scholar] [CrossRef]
  63. Gao, Y.; Lu, Y.; Zhang, N.; Udenigwe, C.C.; Zhang, Y.; Fu, Y. Preparation, Pungency and Bioactivity of Gingerols from Ginger (Zingiber officinale Roscoe): A Review. Crit. Rev. Food Sci. Nutr. 2022, 1–26. [Google Scholar] [CrossRef] [PubMed]
  64. Rasool, N.; Saeed, Z.; Pervaiz, M.; Ali, F.; Younas, U.; Bashir, R.; Bukhari, S.M.; Mahmood khan, R.R.; Jelani, S.; Sikandar, R. Evaluation of Essential Oil Extracted from Ginger, Cinnamon and Lemon for Therapeutic and Biological Activities. Biocatal. Agric. Biotechnol. 2022, 44, 102470. [Google Scholar] [CrossRef]
Figure 1. Conversion of gingerols into shogaols.
Agronomy 13 01787 g001
Figure 2. Extraction of total gingerol and shogaol compounds (TGSCs) using different ethanol-to-water ratios (0–100) (n = 3). Distinct letters (a, b, c, d, e) denote statistically significant differences as determined by Tukey’s test at a significance level of 95%.
Agronomy 13 01787 g002
Figure 3. Stability of total gingerol and shogaol compounds (TGSCs) at different temperatures (10–70 °C) (n = 3). Distinct letters (a, b, c) denote statistically significant differences as determined by Tukey’s test at a significance level of 95%.
Agronomy 13 01787 g003
Figure 4. Pareto chart of the standardized effects of the variables and their interactions on the extraction of TGSCs from ginger.
Agronomy 13 01787 g004
Figure 5. Total gingerol and shogaol compounds (TGSCs) obtained using different times and the previously determined optimal conditions (n = 3). Distinct letters (a, b) denote statistically significant differences as determined by Tukey’s test at a significance level of 95%.
Agronomy 13 01787 g005
Table 1. Range of values used for the BBD.
Factor−10+1Unit
X1: Ethanol in water5075100%
X2: Temperature204060°C
X3: Amplitude204060% Maximum amplitude
X4: Cycle0.20.61s−1
X5: Sample-to-solvent ratio0.30.50.7g:20 mL
Table 2. Box–Behnken experimental design conditions for the five variables considered, including experimental and predicted results.
RunFactorsResponses
Total Gingerol and Shogaol Compounds (mg g−1)
X1X2X3X4X5ExperimentalPredicted
10011023.57023.296
20−100−123.53221.798
30001122.57922.238
4000−1−124.77924.813
50−100120.04321.047
600−10−121.99723.752
7−1000117.29616.878
81010027.36625.206
901−10022.73322.172
101000−125.85027.045
11−1−100017.47116.400
121001025.14025.468
130−110020.52321.278
140010122.84721.912
151000121.33822.976
160100−127.53025.237
17010−1023.74523.403
18−10−10017.10316.878
19−1010016.93017.204
2000−10121.75820.917
21100−1026.27224.541
220−101022.21921.773
231−100022.29522.731
240010−122.55024.211
2510−10026.73624.077
26000−1121.86821.319
27001−1022.81322.819
280101025.00022.675
290001−123.63623.878
30−100−1018.47917.876
31−1001015.47816.933
320110022.50323.178
33−1000−118.80317.943
3400−11020.71922.084
350−1−10021.31020.828
361100022.66925.623
3700−1−1020.92622.573
38−1100015.30616.753
390−10−1019.52421.061
400100120.40920.853
410000019.11223.131
420000024.42023.131
430000022.86223.131
440000024.49223.131
450000023.81923.131
460000024.08023.131
Table 3. ANOVA of the quadratic model fitted to the TGSC extraction yields.
SourceSum of
Squares
Degrees of
Freedom
CoefficientsMean SquareF-Valuep-Value
X1: %EtOH231.048123.131231.04866.080.000
X2: Temperature10.52613.80010.5263.010.095
X3: Amplitude2.11710.8112.1170.610.443
X4: Cycle0.00010.3630.0000.000.993
X5: Ratio26.3611−0.00326.3617.540.011
X1X131.1301−1.28331.1308.900.006
X1X21.6121−1.8881.6120.460.503
X1X30.16110.6340.1610.050.831
X1X40.87410.2000.8740.250.621
X1X52.25710.4672.2570.650.429
X2X26.5381−0.7516.5381.870.183
X2X30.0771−0.8650.0770.020.882
X2X40.51910.1390.5190.150.703
X2X53.2991−0.3603.2990.940.340
X3X31.4041−0.9081.4040.400.532
X3X40.2321−0.4010.2320.070.798
X3X50.07110.2400.0710.020.887
X4X40.01210.1340.0120.000.953
X4X50.8591−0.0370.8590.250.624
X5X50.00810.4630.0080.000.960
Error total87.41825−0.0313.496
Total (corr.)404.91845
Table 4. Optimum extraction conditions for the extraction of TGSCs.
FactorOptimum Extraction Conditions
X1: Ethanol in water (%)100
X2: Temperature (°C)60
X3: Amplitude (%)51.8
X4: Cycle (s−1)0.458
X5: Sample-to-solvent ratio (g:20 mL)0.302
Table 5. Total gingerol and shogaol compounds (mg g−1) extracted from eight commercially available ginger samples (n = 3).
Ginger6-G6-S8-G8-S10-G10-STotal
Sample 15.63 ± 0.071.84 ± 0.002.09 ± 0.011.24 ± 0.080.56 ± 0.090.73 ± 0.0112.11 ± 0.00
Sample 2 3.38 ± 0.011.20 ± 0.053.59 ± 0.030.74 ± 0.010.22 ± 0.100.21 ± 0.019.34 ± 0.04
Sample 36.18 ± 0.061.97 ± 0.003.12 ± 0.001.53 ± 0.090.46 ± 0.064.16 ± 0.0417.44 ± 0.03
Sample 45.49 ± 0.132.15 ± 0.021.57 ± 0.041.33 ± 0.220.96 ± 0.262.09 ± 0.0413.61 ± 0.36
Sample 57.17 ± 0.172.26 ± 0.042.53 ± 0.071.56 ± 0.260.63 ± 0.203.99 ± 0.0918.15 ± 0.65
Sample 67.25 ± 0.302.42 ± 0.011.64 ± 0.001.54 ± 0.141.07 ± 0.114.32 ± 0.2018.24 ± 0.65
Sample 73.76 ± 0.144.15 ± 0.380.91 ± 0.000.90 ± 0.030.30 ± 0.090.28 ± 0.0010.32 ± 0.28
Sample 84.25 ± 0.021.40 ± 0.031.27 ± 0.020.71 ± 0.040.50 ± 0.050.26 ± 0.018.42 ± 0.05
Disclaimer/Publisher’s Note: The statements, opinions and data contained in all publications are solely those of the individual author(s) and contributor(s) and not of MDPI and/or the editor(s). MDPI and/or the editor(s) disclaim responsibility for any injury to people or property resulting from any ideas, methods, instructions or products referred to in the content.

