Review

Remote Sensing Monitoring of Rice Diseases and Pests from Different Data Sources: A Review

1
Engineering Laboratory of Spatial Information Technology of Highway Geological Disaster Early Warning in Hunan Province, Changsha University of Science & Technology, Changsha 410114, China
2
Department of Geomatics Engineering, School of Traffic & Transportation Engineering, Changsha University of Science & Technology, Changsha 410114, China
3
Key Laboratory of Digital Earth Science, Aerospace Information Research Institute, Chinese Academy of Sciences, Beijing 100094, China
4
Department of Geo Key Lab of Guangdong for Utilization of Remote Sensing and Geographical Information System, Guangdong Open Laboratory of Geospatial Information Technology and Application, Research Center of Guangdong Province for Engineering Technology Application of Remote Sensing Big Data, Guangzhou Institute of Geography, Guangdong Academy of Sciences, Guangzhou 510070, China
5
Academy of Agricultural Planning and Engineering, MARA, Beijing 100125, China
*
Author to whom correspondence should be addressed.
Agronomy 2023, 13(7), 1851; https://doi.org/10.3390/agronomy13071851
Submission received: 19 June 2023 / Revised: 11 July 2023 / Accepted: 11 July 2023 / Published: 13 July 2023
(This article belongs to the Special Issue Application of Remote Sensing and GIS Technology in Agriculture)

Abstract

:
Rice is an important food crop in China, and diseases and pests are the main factors threatening its safety, ecology, and efficient production. The development of remote sensing technology provides an important means for non-destructive and rapid monitoring of diseases and pests that threaten rice crops. This paper aims to provide insights into current and future trends in remote sensing for rice crop monitoring. First, we expound the mechanism of remote sensing monitoring of rice diseases and pests and introduce the applications of different commonly data sources (hyperspectral data, multispectral data, thermal infrared data, fluorescence, and multi-source data fusion) in remote sensing monitoring of rice diseases and pests. Secondly, we summarize current methods for monitoring rice diseases and pests, including statistical discriminant type, machine learning, and deep learning algorithm. Finally, we provide a general framework to facilitate the monitoring of rice diseases or pests, which provides ideas and technical guidance for remote sensing monitoring of unknown diseases and pests, and we point out the challenges and future development directions of rice disease and pest remote sensing monitoring. This work provides new ideas and references for the subsequent monitoring of rice diseases and pests using remote sensing.

1. Introduction

Crop diseases and insect pests have always been significant obstacles in agricultural production, restricting agricultural efficiency and quality while threatening ecology [1]. According to the Food and Agriculture Organization of the United Nations (FAO), the global annual loss of grain output caused by pests and diseases accounts for 30% of global food production [2]. In the context of global climate change, the frequent occurrence of various disasters and abnormal weather conditions has aggravated the occurrence of agricultural diseases [3]. Climate change has had a significant impact on the global economy, food security, and agricultural production, thus making disease and pest monitoring and prevention increasingly arduous [4].
Rice is one of the three major cereal crops in the world and also one of the three main staple foods in China. The planting area accounts for about a quarter of the country’s arable land, and more than 65% of the country’s population eats rice every day in China [5,6]. According to statistics, there are currently more than 600 types of diseases and pests that harm rice [7]. In China, the primary rice diseases are rice blast (Magnaporthe oryzae), sheath blight (Rhizoctonia solani Kühn), and rice false smut (Rice tungro bacilliform virus), while the main rice pests are rice planthopper (Sogatella furcifera), rice leaf borer (Cnaphalocrocis medinalis), and stem borers (Chilo suppressalis) [8,9]. In recent years, changes in weather, planting patterns, and the ecological environment have resulted in approximately 5–6 million tons of rice loss, seriously endangering China’s food security [10]. The images of common rice pests and diseases are shown in Figure 1. Food security is a major issue related to national economic development, social stability, and national self-reliance and is a major foundation for national security [11]. The global population is expected to reach about 9.8 billion by 2050 [12]. There is an exponential growth of food production to meet the needs of the growing population. However, the limited land and water resources, climate change, and an increase in extreme events likely to pose a significant threat for achieving the sustainable agriculture goal. Given these challenges, food security is included in the United Nations’ Sustainable Development Goals (SDGs) [13,14]. Therefore, the effective prevention and monitoring of rice diseases and pests is important not only to guarantee the high quality and yield of rice, but also to ensure the security of over a billion people.
Traditionally, the monitoring of rice diseases and pests have mainly relied on field investigations and estimations conducted by professional plant protection personnel. Although this method has been used for many years, its scope of investigation is small, and the results are time consuming, laborious, and subjective [15]. It is difficult to deal with increasingly complex situations of disease or pest prevention using such traditional methods; problems such as disease leakage and disaster are hard to prevent. Such field investigations cannot meet the real-time and dynamic demands required to monitor rice diseases and pests on a large scale. Remote sensing is the only technical method that can quickly obtain spatially continuous surface information in a large region and has, therefore, been widely used in crop disease and pest monitoring [16]. The Digital Agriculture Rural Development Plan (2019–2025) issued by the Ministry of Agriculture and Rural Affairs of China also clearly pointed out that the use of remote sensing to dynamically monitor pests and diseases of important crops and issue early warning information is an important means to achieve pest control. In recent years, with the rapid development of space technology, remote sensing data sources have become increasingly diversified. Various types of on-board and airborne data sources are increasing, such as China’s high-resolution Earth observation GF series satellites, the new Sentinel-1 and Sentinel-2 series satellites launched by ESA (European Space Agency), and unmanned aerial vehicles which provide hyperspectral and multispectral remote sensing data. Each of these data sources provide remote sensing information with multiple temporal, spatial, and spectral resolutions for crop disease and pest monitoring.
This paper summarizes research on remote sensing technology in rice diseases and pests in recent years, aiming to: (1) describe the mechanism and characteristics of remote sensing monitoring of rice diseases and insect pests, (2) compare remote sensing monitoring of rice diseases and insect pests from different data sources, (3) develop remote sensing monitoring methods for rice diseases and insect pests, and (4) summarize the existing problems of remote sensing technology in the field of rice disease and insect pest monitoring, and discuss the current research status and future development trend.

2. Remote Sensing Monitoring Mechanism of Rice Pests and Diseases

Vegetation stress caused by pests and diseases mainly manifests as morphological changes outside the plant and physiological changes inside the plant. The main symptoms of external morphological changes include discoloration, necrosis, wilting, decay, distortion, and wormholes [17,18]. Internal physiological changes are mainly caused by the destruction of chlorophyll tissue and the decline of water and nutrient absorption, transportation, and conversion functions, which reduce respiration and photosynthesis [17,19]. A statistical analysis of the symptoms and damage caused by rice pests and diseases showed that rice is under stress mainly in the following aspects:
(1)
Destruction of plant pigment systems (chlorophylls, carotenoids, anthocyanins, etc.). This can be caused by rice blight and stripe blight.
(2)
Changes in biomass and leaf area index. This can be caused by rice leaf blight, rice leaf roller, and rice planthopper.
(3)
Water loss. This can be caused by diseases like rice bacterial leaf blight.
When crops are stressed by pests and diseases, their physiological and biochemical parameters, such as pigment content, water content, protein content, structure, morphology, and apparent shape, are changed (i.e., by blotches, shriveling, decay, etc.) [20]. These symptoms are clearly reflected in the crop’s spectral reflectance. The corresponding changes in optics are the basis of remote sensing monitoring of vegetation diseases [21]. The principle of remote sensing monitoring of rice pests is that pests and diseases cause changes in the crop’s cellular structure, pigments, water and nitrogen content, and leaf shape, which in turn causes changes in the crop reflectance spectra [22]. For example, Figure 2 shows disease-induced changes in the reflectance in the near-infrared, red-edge, and green-edge regions of the spectrum and also shows a green-edge red-shift and red-edge blue-shift [23]. The spectral reflectance shows a decreasing trend in the green region, an increasing trend in the red region, and a decreasing trend in the near-infrared region. The near-infrared reflectance of the diseased crop is significantly lower than that of the healthy crop, especially in the near-infrared platform. This may be due to biomass reduction caused by leaf curling and dropping. In this way, capturing changes in physicochemical parameters caused by pests and diseases using remote sensing technology can be an important method for detecting and identifying plant diseases [24].

3. Remote Sensing Monitoring of Rice Diseases and Pest from Different Data Sources

Different data sources can provide rich remote sensing information at different spatial and temporal scales and resolutions, providing more accurate and faster data support for the monitoring of pests and diseases. Table 1 summarizes the data sources commonly used for crop pest and disease monitoring and the scales at which each data set is usually implemented.

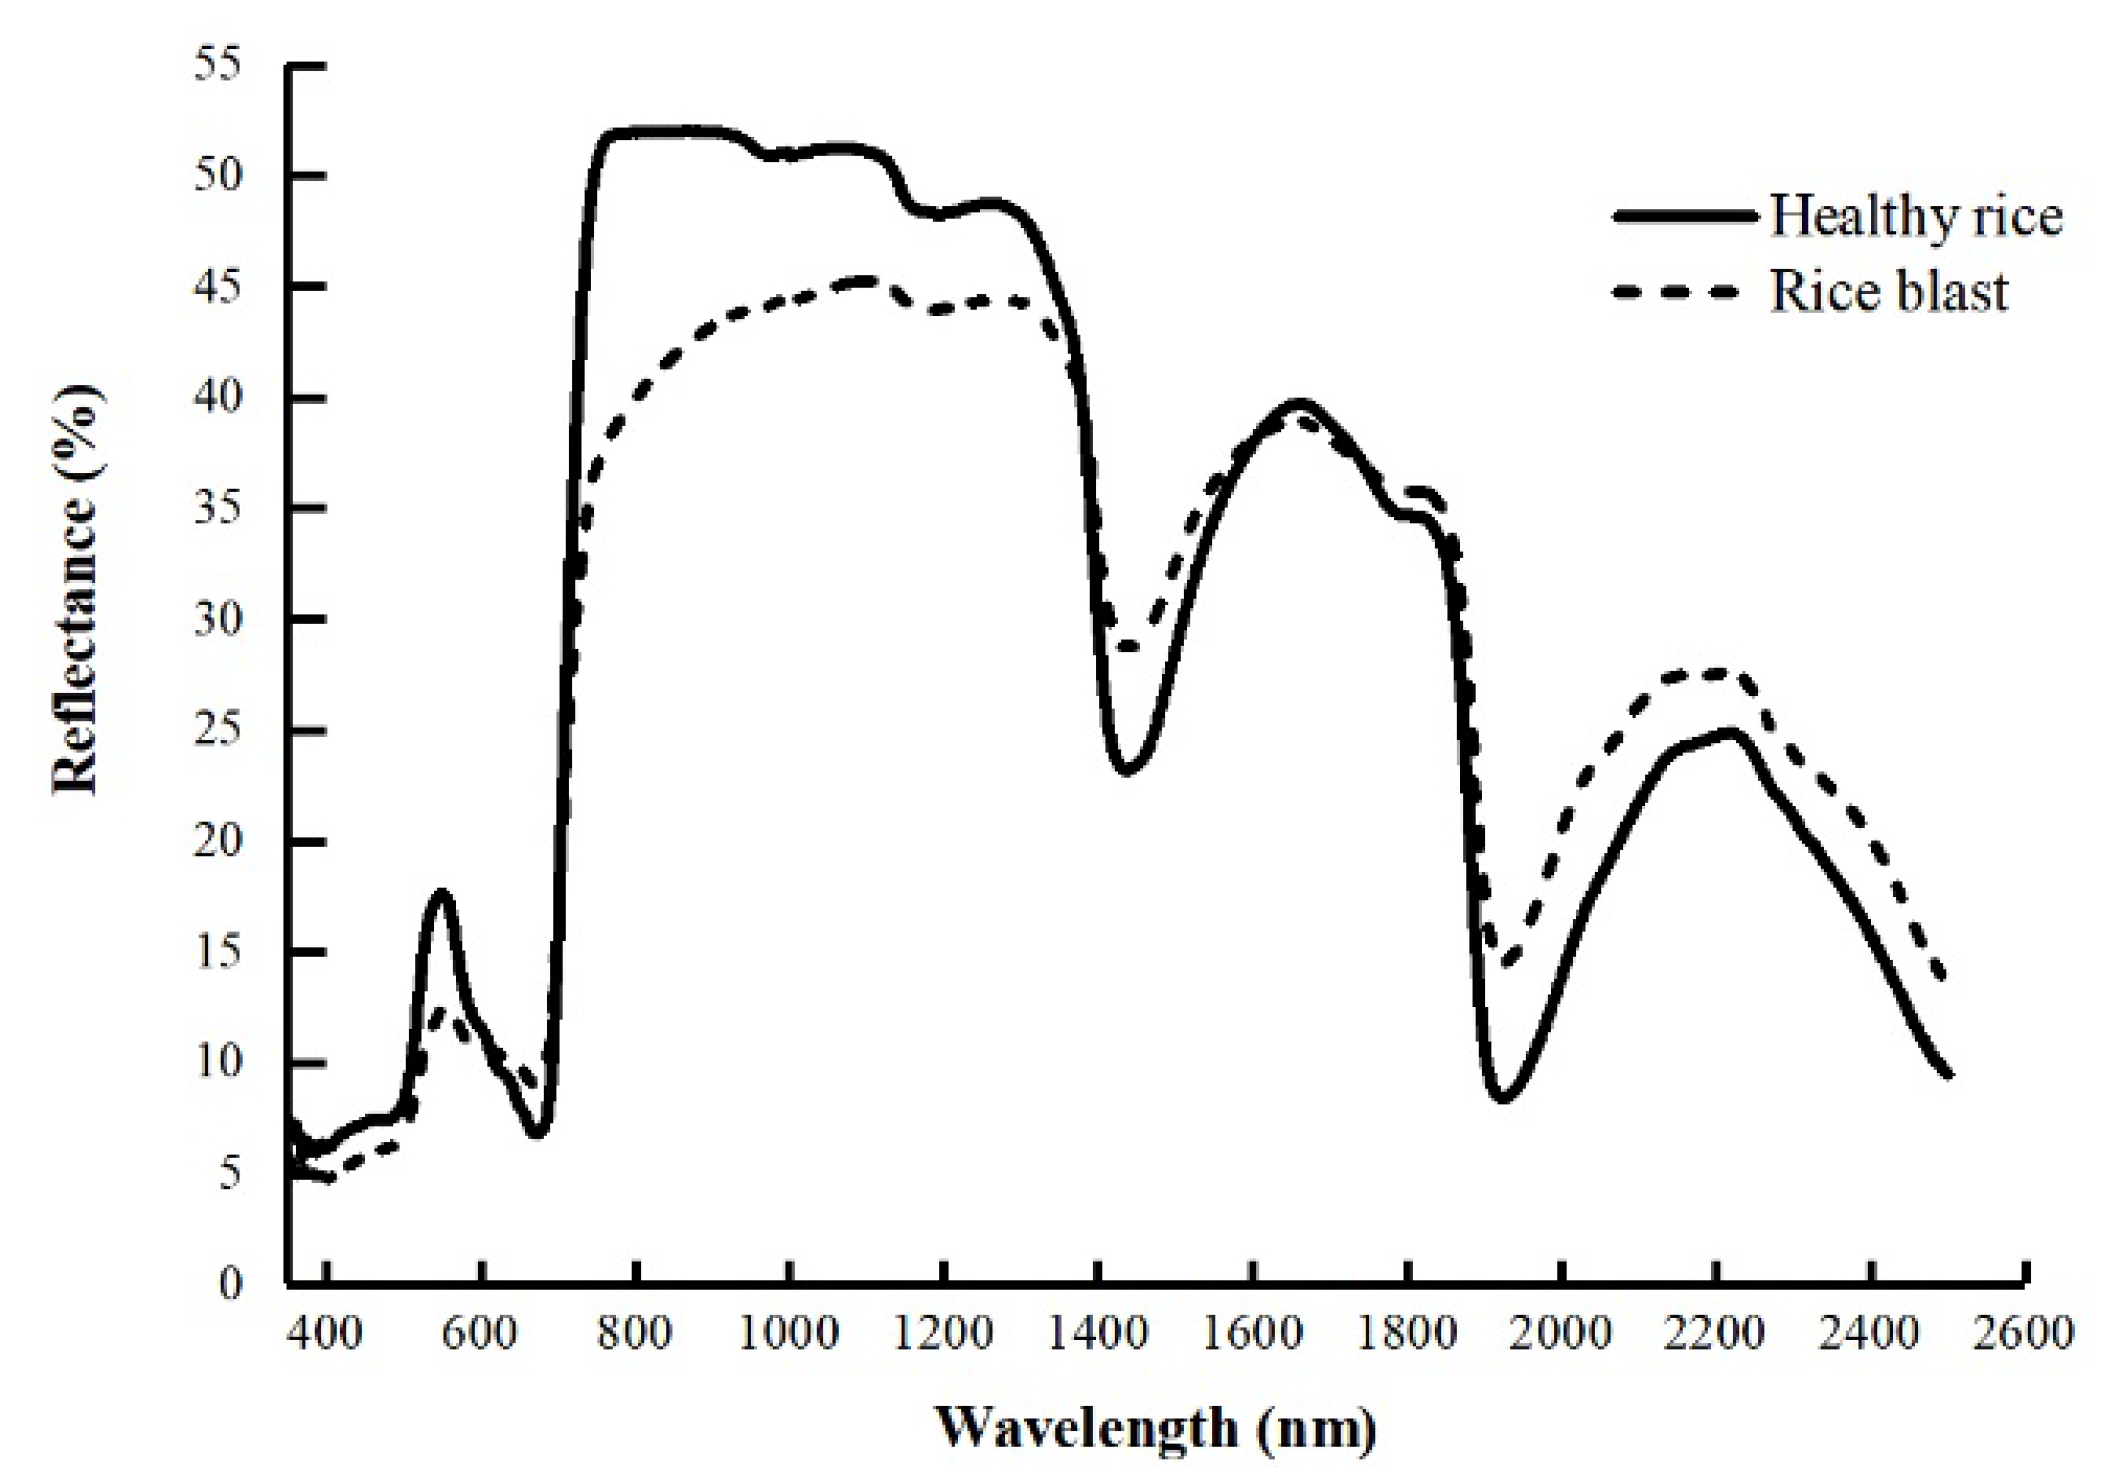
3.1. Hyperspectral Technology

Hyperspectral remote sensing data have been widely used in the remote sensing monitoring of crop pests and diseases because of their rich wavelength information and high spectral resolution [24]. Changes in the physiological and biochemical parameters of vegetation (e.g., structure, morphology, pigment, and water content) result in significant changes to spectral reflectance. Capturing spectral changes of crops stressed by pests and diseases has, therefore, become an important tool for remote sensing monitoring of rice pests and diseases. Existing studies have focused on the occurrence characteristics, pathogenicity, and biological control of rice diseases [25]. Ashourlo and Chemura et al. indicated that the red-edge region can be used to assess plant stress [26,27]. The spectral reflectance of rice subjected to rice leaf roller stress showed a decreasing trend in the green and near-infrared regions and an increasing trend in the blue and red regions, where the sensitive spectral region for remote sensing identification of the rice leaf roller was 747–754 nm [28]. In the identification and monitoring of rice pests and diseases, Liu et al. have shown that the spectral bands near 410, 470, 490, 570, 625, 665, and 720 nm are sensitive regions for detecting leaf folder, which is consistent with Huang et al.’s study that the 747–754 nm band are sensitive region for identifying leaf folder by using rice canopy spectra [25,28]. For the identification of different pests and diseases, the stress of rice leaf roller and brown planthopper can be distinguished by the canopy reflectance at 426 nm [29]. The spectral reflectance of 540 nm, 680 nm, 760 nm, and 990 nm is used to identify and distinguish rice bacterial blight [30]. For different growth stages, the spectral changes of the brown planthopper after disease and pest stress are also different. The reflectance in the near-infrared region of rice during the milky grain stage (750–1000 nm) and the reflectance in the mature stage at 400–531 nm and 567–705 nm was closely related to the density of brown planthoppers. The density of the brown planthopper is related to the reflectance in the near-infrared region (750–1000 nm) during the milky grain stage of rice and is closely related to the reflectance at 400–531 nm and 567–705 nm during the mature stage [31].
Spectral information is the basis for remote sensing monitoring of crop diseases and pests. Hyperspectral data has been widely used in the precise monitoring of rice diseases and pests due to its rich spectral information. Increasingly, scholars have also recognized the mechanism of using hyperspectral information for remote sensing monitoring of crop diseases and pests, providing a theoretical basis for remote sensing monitoring of crop pests and diseases at the regional canopy scale. Although hyperspectral remote sensing technology has higher spectral resolution, it entails higher complexity in data processing and analysis, requiring more sophisticated technical approaches and relatively higher costs.

3.2. Multispectral Technology

In optical remote sensing, both multispectral and hyperspectral techniques are already available as important information sources for the monitoring of crop pests and diseases [32]. In practical applications, the crop pests and diseases information using spectral indices exhibited are more comprehensive and richer than that of raw bands alone. There have been an increasing number of studies on the construction of sensitive vegetation indices for crop pest and disease detection and identification. These studies often use pest- and disease-sensitive bands in combination with a mathematical function like a difference, ratio, normalization, or differentiation. For example, Yang et al. used the soil-adjusted vegetation index (SAVI) and green normalized difference vegetation index (GNDVI) to monitor rice leaf rollers and brown flies [29]. At the waxing stage of rice, the incidence of rice spike neck blight and the R570/R675, R470/R570, and R520/R675 ratios showed a decreasing trend. During the yellowing stage of rice, the R725/R900 and R550/R970 ratios also changed with the incidence of rice blast [15]. Qin et al. have shown that spectral indices RVI14, SDI14, and SDI24 exhibit better correlation in identifying rice sheath blight, which can be used for monitoring rice sheath blight [33]. Ghobadifar et al. also used those vegetation indices to detect BPH (brown planthopper) sheath blight in rice based on visible and infrared images [34]. Das et al. pointed out that spectral indices of normalized difference vegetation index (NDVI), enhanced vegetation index (EVI), normalized difference moisture index (NDMI), and SAVI can be used to predict the severity of rice leaf blast in large areas based on MODIS remote sensing images [35]. Mandal et al. developed two hyperspectral indices of RBI (R1148, R1301) and NDBI (R1148, R1301) for identification of rice blast, with R2 of 0.85 and 0.86, respectively [36]. Using hyperspectral data from UAVs, Qin et al., of the Chinese Academy of Agricultural Sciences, showed that visible and near-infrared spectra could be used for monitoring rice blight and proposed a series of spectral indices for predicting the extent of rice pest development [37].
Multi-spectral remote sensing technology obtains vegetation features by capturing spectral information from different wavelength ranges. It has good real-time and large-scale monitoring capabilities in disease and pest monitoring and forecasting, meeting the requirements of low cost and rapid response. However, due to its lower spectral resolution, multi-spectral remote sensing technology may not meet certain specific needs. For instance, rice diseases exhibit weak or delayed spectral responses during early stress in complex field environments. Therefore, accurately identifying early rice diseases is difficult for disease and pest monitoring [37]. The sensitive spectral bands and spectral indices commonly used for monitoring major rice pests and diseases are shown in Table 2.

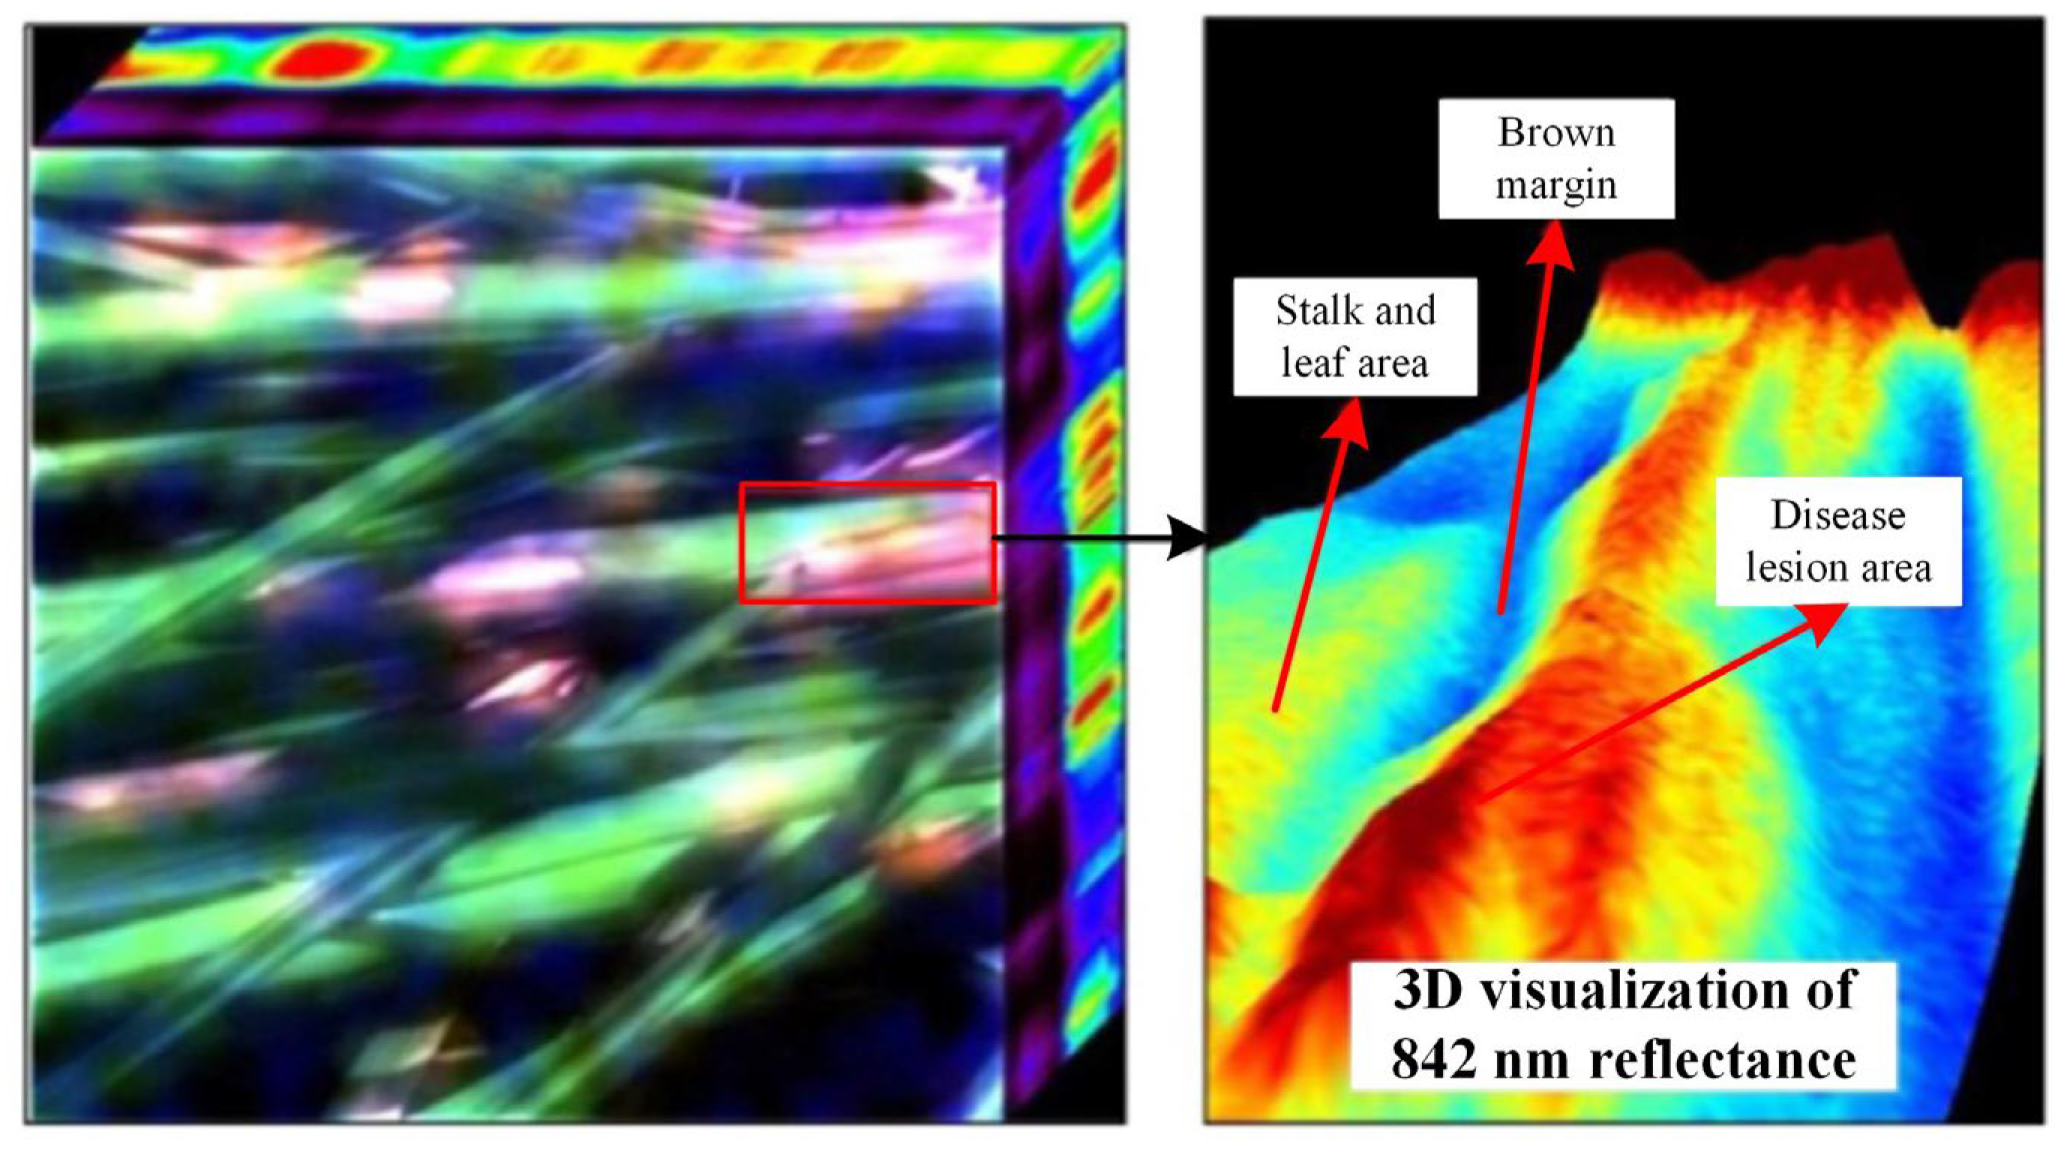
3.3. Image Information

In addition to rich spectral information, image information provides rich information for crop pest and disease monitoring [44]. Image classification is a method of identifying healthy and diseased leaves based on their shape, texture, color, pattern, and other morphological features [45,46]. For example, Anthonys et al. extracted color, texture, and shape features for rice blast, stripe blight, and hoary blotch leaves and achieved effective differentiation of diseases using image information [47]. Prajapati et al. used image analysis for the identification of three diseases: rice bacterial leaf blight, brown spot, and leaf black spike disease [48]. Anitha et al. utilized the leaves of rice leaf smut, bacterial blight, and brown spot diseases to extract first order textural features such as kurtosis, skewness, mean and variance as well as second procedure textural features such as smoothness, energy, correlation, homogeneity, contrast, and entropy [49]. They constructed a rice disease classification model using the texture features of the image, with an accuracy of 96.1%. Singh et al. collected images of various diseases (for apple, corn, potato, tomato, and rice plants) and extracted their texture and color features of dataset images through the histogram of oriented gradients (HoG), GLCM, and color moments, and finally, combined color, texture, and depth features to form a mixed feature for disease recognition [50]. Sethy et al. used 5932 field images of four types of rice diseases, namely, rice bacterial blight, rice blast, brown spot, and rice blast, to accurately identify different rice diseases through image feature analysis [51]. Yang et al. used image enhancement and feature fusion methods to recognize and classify 18,391 images of rice pests and diseases, with a classification accuracy of 97.72% [52]. Zhang et al. extracted information about the rice sheath blight disease on stalks by analyzing images and developed a pipeline-like protocol for detecting rice sheath blight disease by combining spectroscopy and imaging techniques [38], as shown in Figure 3.
In addition, different diseases have different characteristics, such as color and shape, and obtaining the image features of lesions can be used to identify different rice diseases [53,54,55]. This shows that image information has great potential for accurately monitoring and identifying rice pests and diseases. However, image technology is sensitive to lighting and weather conditions. Insufficient light or adverse weather can lead to a decrease in image quality, which can also affect the accurate monitoring of crop diseases and pests.

3.4. Fluorescence Technology

Chlorophyll fluorescence is closely related to plant photosynthetic physiology, and changes in fluorescence occur earlier than changes in chlorophyll content when plants are subjected to stress [56,57,58]. Therefore, chlorophyll fluorescence can provide information for the early detection of disease-related stress [59] and is considered a promising indicator of vegetation light energy utilization [60]. Jing et al. used solar-induced chlorophyll fluorescence together with green reflectance spectra to detect wheat yellow rust and estimate disease severity [61]. Raji et al. extracted red, near-infrared, and chlorophyll fluorescence using the fisher linear discriminant (FLD) method and showed that the early onset of cassava mosaic disease can be detected using the ratio of these fluorescence [62]. Thus, chlorophyll fluorescence can be used for crop pest and disease detection and has good application potential, especially in detecting early signs of stress.
The above studies confirm the effectiveness and feasibility of chlorophyll fluorescence for crop disease monitoring; however, there are currently few research results on fluorescence technology for rice disease monitoring, and there are some limitations to the use of fluorescence systems for monitoring plant pests and diseases. For example, the measurement of some important fluorescence parameters (e.g., maximum photochemical efficiency of photosystem II (Fv/Fm), non-photochemical quenching (NPQ), and efficiencies of photosystem II photochemistry (ΦPSII)) requires the dark adaptation of the plant, thus limiting the efficiency and feasibility of this technique for large-scale applications [24]. In addition, most fluorimeters are currently designed for leaf or canopy level monitoring due to the relatively weak fluorescence signals that can easily be confused with natural light. This also limits their application on large scales. However, fluorescence has a direct link with photosynthesis and is sensitive to changes in vegetation photosynthesis and physiological state [63,64]. Therefore, fluorescence can be effectively used in plant pest and disease monitoring in combination with other remote sensing tools.

3.5. Thermal Infrared Imaging Technology

Temperature is a fundamental environmental variable and plays an important role in plant physiological processes, such as transpiration, leaf water potential and photosynthesis. Thermal infrared remote sensing detects energy emitted in the thermal infrared band (8–14 μm) that is reflected or radiated by vegetation and other features at long distances [65]; it can be used to detect changes in plant transpiration and water content caused by disease and identify changes in plant surface temperature resulting from stress-related changes to physiological parameters [66]. It has been applied in yield estimation, plant phenotype [67], plant water stress detection [68], and plant disease detection [69]. For example, some studies have reported local temperature changes caused by plant pathogens or defense mechanisms, allowing monitoring of diseases such as tobacco mosaic virus, sugar beet brown spot disease, cucumber downy mildew, and tea disease [65,70,71]. For rice pests and diseases, Liu et al. used thermal infrared imaging and meteorological factors to assess a brown planthopper invasion [72]. In addition, studies have shown that thermal sensors are more effective in detecting changes in plant respiration, water status, and leaf temperature caused by early disease stress compared to optical sensors [73,74].
The practical application of thermal imaging for precise disease control is limited by the high sensitivity of thermal imaging to environmental conditions during measurements. In addition, the thermal response of plants lacks diagnostic potential for identifying plant diseases [74]. More complex sensor systems must be developed which combine information from various sensor systems (or which implement sensor fusion) to improve crop pest and disease-monitoring capabilities.

3.6. Multi-Source Data Fusion

Crop diseases and pests have always been a major challenge in agriculture. Traditional monitoring methods are time consuming and ineffective. With the development of remote sensing, meteorology, and plant growth monitoring technologies, the use of multi-source data to monitor crop diseases and pests has become a new trend and a breakthrough point in agricultural development [75,76]. The occurrence of crop diseases and pests, such as the reproduction, transmission, and infection of bacterial spores, as well as the emergence of insect eggs, is also a long-term process that requires appropriate landscape patterns and habitat conditions [24]. Therefore, combining multi-source temporal remote sensing data with habitat data can achieve monitoring and early warning of rice diseases and pests.
The outbreak and prevalence of major crop pests and diseases are closely related to meteorological conditions [77,78]. With the continuous development and maturation of multi-source information fusion algorithms, multi-faceted meteorological parameter products, which combine meteorological station data with other remotely sensed data, serve as rich sources of information for disease prevention and control [48]. In the process of disease monitoring, many scholars have incorporated meteorological factors of disease occurrence into monitoring models. For example, Zheng et al. used meteorological data (average sunshine hours, average relative humidity, and average precipitation) and two temporal remote sensing images to construct a remote sensing monitoring model for wheat stripe rust, with a disease monitoring accuracy of 84.2% [79]. Marques et al. generate the most commonly used parameter in pest modeling and monitoring: “thermal integral over air temperature (accumulated degree-days” by using ground temperature, or land surface temperature (LST) surface temperature data obtained from the second generation meteorological satellite system (MSG), and produce an agricultural pest risk estimation map [80]. Yones et al. linked sensor data based on thermal satellites to agricultural pest monitoring and control and found that there was a 59.2 degree-days difference between satellite image values and thermal imaging methods in the monitoring process of specific geographical locations and pests (grassland armyworm) [81]. They also concluded that thermal satellite sensor images may be a valuable tool for integrated pest management.
At present, constantly updated and encrypted meteorological stations provide a rich source of information for pest and disease control, including data on temperature, humidity, average daily precipitation, sunshine hours, and other meteorological information that is closely related to the occurrence and prevalence of rice pests and diseases [82]. Using remote sensing data as the basis of analysis and adding multi-source data such as habitat information and agronomic context is therefore a useful method for the comprehensive and objective monitoring of rice pests and diseases. Based on a combination of remote sensing data, meteorology, and pest and disease mechanism models, the large-area monitoring of rice pests and diseases can be monitored non-destructively and rapidly. In particular, the integration of fluorescence, SAR, thermal infrared, and Lidar data, along with multi-angle observation methods, offers the potential for early monitoring of rice diseases and pests. This approach helps to reduce yield losses, the accumulation of pests and diseases, and the impact of pesticide application on agricultural products and the environment, which is of great significance for preventing the spread of the disease and ensuring the ecological environment and food safety. At the same time, the results of large-area monitoring of rice pests and diseases help the agricultural sector to assess yield losses, support government decision-making, and provide technical support to ensure food security.

4. Methods for Monitoring Rice Diseases and Pests Using Remote Sensing

4.1. Feature Selection and Extraction

The key to the application of remote sensing technology in plant pest and disease monitoring is the identification of effective and unique remote sensing features. To date, a variety of remote sensing features have been proposed or identified for monitoring plant symptoms caused by pests and diseases or for depicting their habitats. The main remote sensing features involved in rice pest monitoring include spectral, fluorescent, thermal, landscape, image, and habitat features [24].
Feature extraction, a critical stage on rice diseases and pests remote sensing monitoring system, allow the extraction and input of a set of features to distinguish crop diseases and pests from water and fertilizer stress [83]. Introducing features with reliable discrimination ability can help improve the classification accuracy of specific pests and diseases. The feature selection and extraction methods currently used for rice pest and disease monitoring include typical correlation analysis, independent sample t-tests, random forest importance ranking, and principal component analysis. For example, Tian et al. has developed a machine learning-based feature selection algorithm (ML-SFFS) to achieve early detection of rice leaf blast based on reflectance spectroscopy [1]. Das et al. used the transfer learning algorithm to extract and recognize the features of rice leaf blast and used the max-pooling layers to reduce the dimension of extracted features [35]. Lin et al. extracted spectral features sensitive to rice sheath leaf disease using the Relief-F algorithm, and their research showed that the ratio of green peak amplitude (the maximum reflectance in the 510–560 nm green band) and red valley amplitude (the minimum reflectance in the 640–680 nm red band) is the feature indicator with the highest weight [42]. Feng et al. combined deep learning and visualization techniques to establish a wavelength selection method for spectral features of rice blast [84].
Currently, there are several studies that aim to identify the optimal combination of different features for accurately detecting and distinguishing various pests and diseases. However, the lack of systematic research on the extraction and combination of different feature sets, including spectra, images, meteorology, habitat, and other features, often results in arbitrary selection of monitoring feature inputs for many pests and diseases, which can lead to reduced classification accuracy.

4.2. The Methods for Rice Diseases and Pests Monitoring

At present, rice disease-related research is mainly focused either on disease severity estimation and evaluation after disease manifestation or on the identification of different disease types and spot classification [77,85,86]. The methods of crop disease identification and severity estimation by scholars have evolved from statistical methods, such as discriminant and regression analyses for crop disease monitoring with simple forms and clear mechanisms, to more extensive crop disease studies incorporating computers, mathematical models, image enhancement, and deep-learning models [23,35,48,87,88].
For example, Muhammad et al. [89] used linear regression analysis and soil plant analysis development (SPAD) value models to predict the areas and degrees of pest and disease harm in rice fields. Singh et al. employed the support vector machine (SVM) classifier to recognize healthy and diseased rice plants, and achieved an accuracy of 82% [90]. Kahar et al. used an artificial neural network (ANN) to detect three varieties of rice plant diseases, including leaf blight, leaf blast, and sheath blight, and their classifier achieved an accuracy of 74.21% [91]. Liu and Ahmadi et al. used an ANN approach to classify and identify rice glume blight and root rot of oil palm [92,93]. Mandal et al. tested and validated the classification of rice blast severity using support vector machine regression (SVM), partial least squares (PLS), random forest (RF), and multivariate adaptive regression spline (MARS) methods; the results indicate that the RF model is optimal in both calibration and validation processes, with accuracies of 0.995 and 0.606, respectively [36]. Ma et al. obtained canopy images of rice blast using drones and constructed neural networks (CNN), random forest (RF), and support vector regression (SVR) inversion algorithms based on spectra and vegetation indices. Research has shown that the adaptive enhancement algorithm based on ensemble learning has higher inversion accuracy, with a correlation coefficient (R2) of 0.94 [94]. Liu et al. used vector-quantized neural networks to monitor and classify different damaged rice spikes [95]. In addition, some scholars use a variety of algorithms, such as transfer learning methods and depth features plus support vector machines, to identify different rice bacterial blight, rice blast, brown spot and rice blast diseases [51]. Currently, an increasing number of methods have been used for crop disease identification and monitoring, and the selection of monitoring methods is dependent on the sample size, target needs, and accuracy requirements [96]. The commonly used methods for remote sensing monitoring of rice pests and diseases are listed in Table 3.

4.3. Remote Sensing Monitoring of Rice Pests and Diseases at Different Scales

This paper summarizes the development of remote sensing monitoring of rice diseases and pests under different data sources. Based on the monitoring scale, the data sources can be categorized into leaf scale, canopy scale, field scale, and satellite scale [23,101]. The spatial resolution of the data varies at different scales, leading to different monitoring focuses on rice pests and diseases and variations in monitoring accuracy.
At the leaf and canopy scale, many studies have shown that by acquiring high spatial resolution imagery and hyperspectral data, it is possible to accurately capture disease and pest damage characteristics on rice leaves [28]. Examples include leaf spots, leaf discoloration, and injury marks. These studies have successfully identified and clarified the spectral response characteristics and image features associated with pest stress. As a result, they have elaborated on the remote sensing monitoring mechanisms applicable to pest stress, enabling precise monitoring and classification of pests and diseases with high levels of accuracy [1]. Consequently, remote sensing monitoring of pests and diseases at the leaf and canopy scale on the ground forms the foundational basis for subsequent research conducted at the field and regional scales [23].
At the field scale, remote sensing monitoring of pests and diseases mainly relies on manned or unmanned aerial systems, such as unmanned-owned systems, or high-resolution satellite remote sensing systems to acquire field-scale remote sensing images. Although these images may not provide detailed monitoring of pests and diseases, they allow for rapid identification of infected areas and their extent. Currently, field-scale remote sensing monitoring of pests and diseases has achieved satisfactory accuracy, as reported by Huang et al. [102], Yang et al. [85], and Dash et al. [103]. This accurate monitoring can contribute to the precise application of fungicides or pesticides in the field to mitigate the impact of pests and diseases.
At the regional scale, remote sensing relies primarily on remote sensing satellites to obtain large-scale images. By fusing remote sensing data with fluorescence, thermal infrared, and other multi-source data, it becomes possible to more accurately describe the spatial distribution of crop growth and habitat characteristics [104]. This information forms the basis for regional-scale pest monitoring and differentiation.
In general, disease differentiation at the canopy and regional scale is more complex compared to leaf-scale analysis. Factors such as leaf angle, soil composition, underlying surface water content, and the presence of other plant organs can alter the relative spectral differences [105]. Due to the complexity of the landscape, monitoring accuracy at this scale is generally lower (e.g., 78% in Zhang et al. [106]; 70% in Qin et al. [33]). Given the complexity of the landscape, mapping accuracy at this level is generally low but is valuable for effective monitoring of large areas [24]. Therefore, in practical applications, it is crucial to consider multiple factors, including the scale of the pest targets, disease distribution characteristics, and available data resources. This consideration ensures the selection of an appropriate spatial resolution that strikes a balance between monitoring accuracy and practical feasibility.

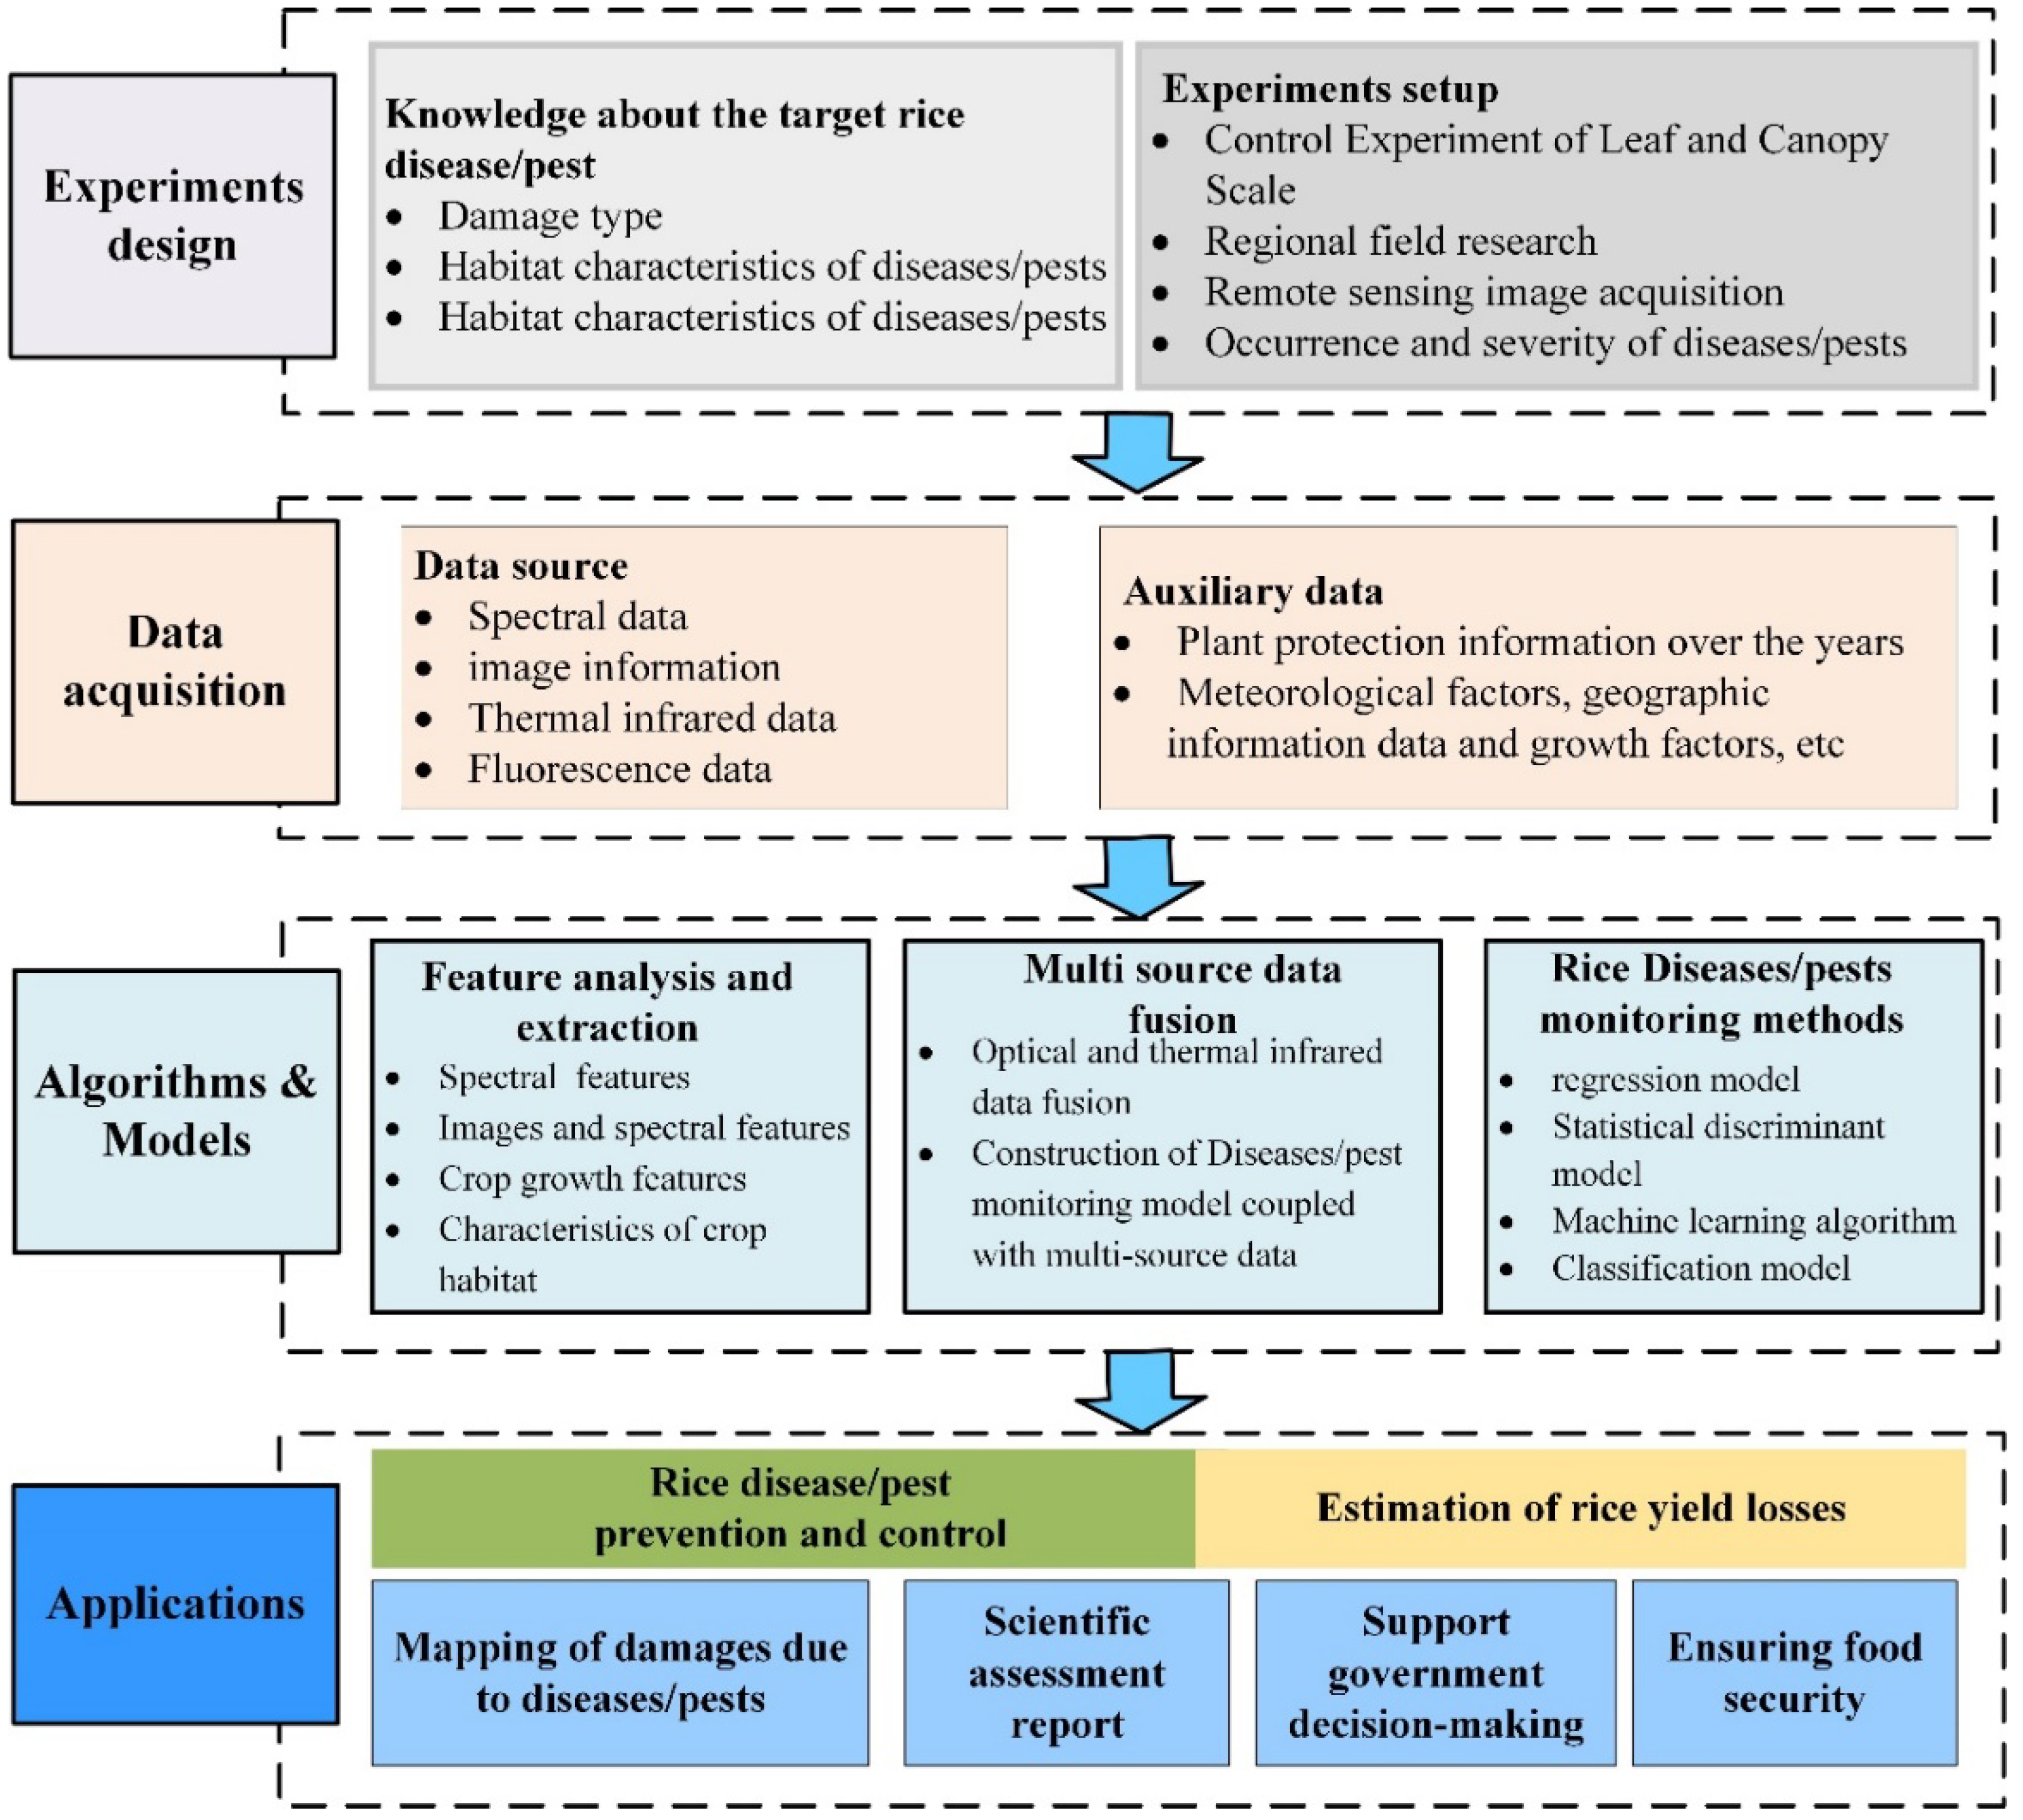
4.4. General Framework for Monitoring Rice Pests and Diseases

Different pests and diseases vary significantly in their representation, occurrence process, and habitat environment, and therefore, different feature extraction methods and model constructions must be used to monitor them. However, strategies and methods for monitoring plant pests and diseases show a certain degree of common features. Based on the summary and review of the mechanisms, data sources, feature selection methods, and model constructions used in recent studies, a general process framework for remote sensing monitoring of major rice pests and diseases can be developed (refer to Figure 4) to provide a reference for future studies.
The first step of the framework is to gain an understanding of the target pests and diseases, such as development status, epidemic spread mode, and favorable habitat environment. Based on this knowledge, suitable remote sensing data sources can be selected according to monitoring needs and scale (refer to Table 1). Field experiments can be conducted to obtain model training data for remote sensing feature selection and modeling (refer to Table 2). At this stage, corresponding experiments should be conducted at the leaf or canopy scale to aid in the understanding of the particular pest or disease. Regional surveys can also be synchronized with other collected data to monitor rice pests and diseases at different spatial and temporal resolutions. Finally, the model and method of monitoring should be determined (refer to Table 3), and a remote sensing monitoring model should be constructed.

5. Challenges and Prospects in the Monitoring of Rice Diseases and Pests

Research on remote sensing monitoring of crop pests and diseases at home and abroad is increasing. This field of research is gradually changing from the qualitative stage to the positioning stage of quantitative model construction and from single data sources to multiple data sources. At present, with the enrichment of data information and the improvement of methods, researchers have made certain advancements in the monitoring of crop diseases and pests. However, owing to the diversity of rice pests and diseases, there are still many urgent problems to be solved. The main problems and development trends in remote sensing monitoring research on rice pests and diseases are summarized as follows:
(1)
The mechanism of remote sensing for monitoring pests and diseases in rice is unclear. Converse to other crops, such as wheat and corn, the spectral acquisition in rice is susceptible to the influence of underlying water bodies during the planting process, making it difficult to obtain weak information related to pests and diseases. Therefore, the mechanism of remote sensing monitoring in rice is unclear. One of the challenges in rice remote sensing monitoring is to eliminate the impact of water bodies on disease information, especially before the jointing stage. Furthermore, it is necessary to elucidate the mechanism of rice remote sensing monitoring by considering the underlying physiological and biochemical changes in rice under stress.
(2)
Insufficient research on different stages of rice pest and disease infestation. Rice has different pest and disease patterns and damage symptoms at different growth stages. For example, rice blast is divided into seedling blast, leaf blast, spike, and neck blast at different growth stages of rice. Considering pathogenesis as a whole or focusing on a certain stage of pest and disease infestation is not sufficient for comprehensively and objectively monitoring rice under pest and disease stress. Therefore, precise monitoring needs to be conducted at different infestation stages of major rice pests and diseases. Early monitoring, in particular, needs to be strengthened, as it is an important period for precise pest and disease control.
(3)
Insufficient research on the differentiation of various pests and diseases in rice. There are many kinds of rice pests and diseases, and different pests, diseases, and non-pest (e.g., water and fertilizer) stresses may all show similar symptoms; therefore, their spectral representations will be similar. It is impossible to establish a library of exclusive features for specific diseases, as the differences in the characteristics of different pests and diseases are not sufficiently recognized. There is a need to establish exclusive features of different rice pests and diseases and to construct an accurate remote sensing monitoring model for rice pests and diseases in complex environments.
(4)
Insufficient integration of multi-source data. At present, remote sensing monitoring of rice pests and diseases is mainly based on optical remote sensing information. In southern China, however, cloudy and rainy weather makes data acquisition difficult. The incorporation of thermal imaging, fluorescence, satellite data, and habitat information related to the occurrence of pests and diseases is also limited. The fusion of different platforms and data sources is necessary to enrich data information and to improve the monitoring and early detection of rice pests and diseases.
(5)
Lack of data and information sharing. Adequate survey data are key to rice pest and disease modeling. The occurrence and prevalence of rice pests and diseases are diffuse in nature, and the sharing of crop pest and disease information from different provinces, cities, and countries will help data mining and model training and promote the research and application of crop pest and disease monitoring. For example, the smartphone-based mobilization of farmers and frontline workers in the field can provide timely information such as the occurrence level of diseases and pests in agricultural fields. This mobilization has the potential to establish corresponding observation networks for sharing field survey data, experimental data, and modeling methods on a continental or global scale.

6. Conclusions

With the continuous development of remote sensing technology, it has become an important tool for providing strong support for crop production and food security. This review introduced remote sensing monitoring of common rice pests and diseases and commonly used data sources. Current research on remote sensing technology was summarized, and the development and shortcomings of current remote sensing methods were presented and analyzed. Finally, directions for future research on the monitoring of rice pests and diseases were proposed. Currently, addressing the complex nature of farmland, making full use of existing crop pest monitoring technology, mining multi-source data, and model coupling of agronomy, plant protection, habitat, and remote sensing are the main directions of rice pest and disease monitoring. In addition, building a platform to realize the monitoring and early detection of rice pest dynamics is an important trend for future development.

Author Contributions

Q.Z. conceived the structure of the research and wrote the manuscript. W.H. designed the structure of original draft. Q.X., H.J. and Y.D. provided a comprehensive editing and review on the various paper sections. H.Y., S.C. and S.H. conducted the references retrieval and collection. All authors contributed to the review of the manuscript and the sections of discussion and conclusion. All authors have read and agreed to the published version of the manuscript.

Funding

The project was supported by Open Fund of Engineering Laboratory of Spatial Information Technology of Highway Geological Disaster Early Warning in Hunan Province (Changsha University of Science & Technology) (kfj210601), the Open Project Program of Key Laboratory of Smart Agricultural Technology in Tropical South China, Ministry of Agriculture and Rural Affairs, P.R.China (HNZHNY-KFKT-202201), National Natural Science Foundation of China (42071417, 42001384), Hunan Provincial Natural Science Foundation of China (2023JJ40025).

Data Availability Statement

No applicate.

Conflicts of Interest

The authors declare no conflict of interest.

Appendix A

Table A1. Types of parameters.
VariablesDefinition and AlgorithmReferences
RBI (ratio blast index)R1148/R1301[36]
NDBI (normalized difference blast index)(R1148 − R1301)/(R1148 + R1301)[36]
RVI14 (modest vegetation index)Rgreen/Rmid-infrared[34]
SDI14 (standard
difference index)
(Rgreen − Rmid-infrared)/(Rgreen + Rmid-infrared)[34]
green peak amplitude (Rg)Maximum reflectance in the 510–560 nm green band[42]
red valley amplitude (Ro)Minimum reflectance in the 640–680 nm red band[42]
SDySum of the first order derivative values within the yellow edge[106]
SDbSum of the first order derivative values within the blue edge[106]

References

  1. Tian, L.; Xue, B.; Wang, Z.; Li, D.; Cheng, T. Spectroscopic detection of rice leaf blast infection from asymptomatic to mild stages with integrated machine learning and feature selection. Remote Sens. Environ. 2021, 257, 112350. [Google Scholar] [CrossRef]
  2. Becker-Ritt, A.B.; Carlini, C.R. Fungitoxic and insecticidal plant polypeptides. Pept. Sci. 2012, 98, 367–384. [Google Scholar]
  3. Mondal, K.; Mani, V. Emergence of bacterial panicle blight caused by Burkholderia glumae in North India. Plant Dis. 2015, 15, 150311115126000. [Google Scholar] [CrossRef]
  4. Karthikeyan, I. A review of remote sensing applications in agriculture for food security: Crop growth and yield, irrigation, and crop losses. J. Hydrol. 2020, 586, 124905. [Google Scholar] [CrossRef]
  5. Jiang, F.; Lu, Y.; Chen, Y.; Cai, D.; Li, G. Image recognition of four rice leaf diseases based on deep learning and support vector machine. Comput. Electron. Agric. 2020, 179, 105824. [Google Scholar] [CrossRef]
  6. Wang, L.; Ge, S.L.; Zhao, K.H.; Huang, S.W. First Report of Fusarium incarnatum Causing Spikelet Rot on Rice in China. Plant Dis. 2021, 105, 3306. [Google Scholar] [CrossRef]
  7. Huang, S.; Wang, L.; Liu, L.; Fu, Q.; Zhu, D. Nonchemical pest control in China rice: A review. Agron. Sustain. Dev. 2014, 34, 275–291. [Google Scholar] [CrossRef] [Green Version]
  8. Huang, W.; Guan, Q.; Luo, J.; Zhang, J.; Zhao, J.; Liang, D.; Huang, L.; Zhang, D. New optimized spectral indices for identifying and monitoring winter wheat diseases. IEEE J. Sel. Top. Appl. Earth Obs. Remote Sens. 2014, 7, 2516–2524. [Google Scholar] [CrossRef]
  9. Kim, Y.; Roh, J.-H.; Kim, H.Y. Early Forecasting of Rice Blast Disease Using Long Short-Term Memory Recurrent Neural Networks. Sustainability 2018, 10, 34. [Google Scholar] [CrossRef] [Green Version]
  10. Carvajal-Yepes, M.; Cardwell, K.; Nelson, A.; Garrett, K.A.; Giovani, B.; Saunders, D.G.O.; Kamoun, S.; Legg, J.P.; Verdier, V.; Lessel, J.; et al. A global surveillance system for crop diseases. Science 2019, 364, 1237–1239. [Google Scholar] [CrossRef] [Green Version]
  11. Nicholson, C.F.; Stephens, E.C.; Kopainsky, B.; Jones, A.D.; Parsons, D.; Garrett, J. Food security outcomes in agricultural systems models: Current status and recommended improvements. Agric. Syst. 2021, 188, 103028. [Google Scholar] [CrossRef]
  12. Lutz, W.; Kc, S. Global Human Capital: Integrating Education and Population. Science 2011, 333, 587–592. [Google Scholar] [CrossRef] [PubMed] [Green Version]
  13. Pérez Escamilla, R. Food Security and the 2015–2030 Sustainable Development Goals: From Human to Planetary Health: Perspectives and Opinions. Curr. Dev. Nutr. 2017, 1, e000513. [Google Scholar] [CrossRef] [PubMed] [Green Version]
  14. Suryono, H.; Kuswanto, H.; Iriawan, N. Two-Phase Stratified Random Forest for Paddy Growth Phase Classification: A Case of Imbalanced Data. Sustainability 2022, 14, 15252. [Google Scholar] [CrossRef]
  15. Kobayashi, T.; Kanda, E.; Kitada, K.; Ishiguro, K.; Torigoe, Y. Detection of rice panicle blast with multispectral radiometer and the potential of using airborne multispectral scanners. Phytopathology 2001, 91, 316–323. [Google Scholar] [CrossRef] [Green Version]
  16. Xu, T.; Wang, F.; Yi, Q.; Xie, L.; Yao, X. A Bibliometric and Visualized Analysis of Research Progress and Trends in Rice Remote Sensing over the Past 42 Years (1980–2021). Remote Sens. 2022, 14, 3607. [Google Scholar] [CrossRef]
  17. Choi, J.G. Unmanned Aerial Vehicles (UAV) in Precision Agriculture: Applications and Challenges. Energies 2021, 15, 217. [Google Scholar]
  18. Lin, Y.; Pu, R.; Zhang, J.; Wang, J.; Hao, Y. Using high spatial resolution satellite imagery for mapping powdery mildew at a regional scale. Precis. Agric. 2016, 17, 332–348. [Google Scholar]
  19. Delalieux, S.; Somers, B.; Verstraeten, W.W.; Aardt, J.A.N.V.; Keulemans, W.; Coppin, P. Hyperspectral indices to diagnose leaf biotic stress of apple plants, considering leaf phenology. Int. J. Remote Sens. 2009, 30, 1887–1912. [Google Scholar] [CrossRef]
  20. Shi, Y.; Huang, W.; González-Moreno, P.; Luke, B.; Dong, Y.; Zheng, Q.; Ma, H.; Liu, L. Wavelet-Based Rust Spectral Feature Set (WRSFs): A Novel Spectral Feature Set Based on Continuous Wavelet Transformation for Tracking Progressive Host–Pathogen Interaction of Yellow Rust on Wheat. Remote Sens. 2018, 10, 525. [Google Scholar] [CrossRef] [Green Version]
  21. Zheng, Q.; Huang, W.; Cui, X.; Shi, Y.; Liu, L. New spectral index for detecting wheat yellow rust using Sentinel-2 multispectral imagery. Sensors 2018, 18, 868. [Google Scholar] [CrossRef] [PubMed] [Green Version]
  22. Cao, Y.F.; Xu, H.; Song, J.; Yang, Y.; Hu, X.; Wiyao, K.T.; Zhai, Z. Applying spectral fractal dimension index to predict the SPAD value of rice leaves under bacterial blight disease stress. Plant Methods 2022, 18, 67. [Google Scholar] [CrossRef]
  23. Tian, L.; Wang, Z.; Xue, B.; Li, D.; Zheng, H.; Yao, X.; Zhu, Y.; Cao, W.; Cheng, T. A disease-specific spectral index tracks Magnaporthe oryzae infection in paddy rice from ground to space. Remote Sens. Environ. 2023, 285, 113384. [Google Scholar] [CrossRef]
  24. Zhang, J.C.; Huang, Y.B.; Pu, R.L.; Gonzalez-Moreno, P.; Yuan, L.; Wu, K.H.; Huang, W.J. Monitoring plant diseases and pests through remote sensing technology: A review. Comput. Electron. Agric. 2019, 165, 104943. [Google Scholar] [CrossRef]
  25. Liu, T.; Shi, T.; Zhang, H.; Wu, C. Detection of Rise Damage by Leaf Folder (Cnaphalocrocis medinalis) Using Unmanned Aerial Vehicle Based Hyperspectral Data. Sustainability 2020, 12, 9343. [Google Scholar] [CrossRef]
  26. Ashourloo, D.; Mobasheri, M.; Huete, A. Developing two spectral disease indices for detection of wheat leaf rust (Pucciniatriticina). Remote Sens. 2014, 6, 4723–4740. [Google Scholar] [CrossRef] [Green Version]
  27. Chemura, A.; Mutanga, O.; Dube, T. Separability of coffee leaf rust infection levels with machine learning methods at Sentinel-2 MSI spectral resolutions. Precis. Agric. 2017, 18, 859–881. [Google Scholar] [CrossRef]
  28. Huang, J.; Liao, H.; Zhu, Y.; Sun, J.; Sun, Q.; Liu, X. Hyperspectral detection of rice damaged by rice leaf folder (Cnaphalocrocis medinalis). Comput. Electron. Agric. 2012, 82, 100–107. [Google Scholar] [CrossRef]
  29. Yang, C.M.; Cheng, C.H.; Chen, R.K. Changes in spectral characteristics of rice canopy infested with brown planthopper and leaffolder. Crop Sci. 2007, 47, 329–335. [Google Scholar] [CrossRef]
  30. Das, P.K.; Laxman, B.; Rao, S.V.C.K.; Seshasai, M.V.R.; Dadhwal, V.K. Monitoring of bacterial leaf blight in rice using ground-based hyperspectral and LISS IV satellite data in Kurnool, Andhra Pradesh, India. Pans Pest Artic. News Summ. 2015, 61, 359–368. [Google Scholar] [CrossRef]
  31. Liu, Q.H. Early assessment of the yield loss in rice due to the brown planthopper using a hyperspectral remote sensing method. Int. J. Pest Manag. 2016, 62, 205–213. [Google Scholar] [CrossRef]
  32. Zhang, X.; Han, L.X.; Dong, Y.Y.; Shi, Y.; Huang, W.J.; Han, L.H.; Gonzalez-Moreno, P.; Ma, H.Q.; Ye, H.C.; Sobeih, T. A Deep Learning-Based Approach for Automated Yellow Rust Disease Detection from High-Resolution Hyperspectral UAV Images. Remote Sens. 2019, 11, 16. [Google Scholar] [CrossRef] [Green Version]
  33. Qin, Z.; Zhang, M. Detection of rice sheath blight for in-season disease management using multispectral remote sensing. Int. J. Appl. Earth Obs. Geoinf. 2005, 7, 115–128. [Google Scholar] [CrossRef]
  34. Ghobadifar, F.; Wayayok, A.; Mansor, S.; Shafri, H.Z. Detection of BPH (brown planthopper) sheath blight in rice farming using multispectral remote sensing. Geomat. Nat. Hazards Risk 2016, 7, 237–247. [Google Scholar] [CrossRef] [Green Version]
  35. Das, S.; Biswas, A.; VimalKumar, C.; Sinha, P. Deep Learning Analysis of Rice Blast Disease Using Remote Sensing Images. IEEE Geosci. Remote Sens. Lett. 2023, 20, 1–5. [Google Scholar] [CrossRef]
  36. Mandal, N.; Adak, S.; Das, D.K.; Sahoo, R.N.; Mukherjee, J.; Kumar, A.; Chinnusamy, V.; Das, B.; Mukhopadhyay, A.; Rajashekara, H.; et al. Spectral characterization and severity assessment of rice blast disease using univariate and multivariate models. Front. Plant Sci. 2023, 14, 1067189. [Google Scholar] [CrossRef]
  37. Qin, Z.; Zhang, M.; Christensen, T.; Li, W.; Tang, H. Remote sensing analysis of rice disease stresses for farm pest management using wide-band airborne data. In Proceedings of the IEEE International Geoscience & Remote Sensing Symposium, Toulouse, France, 21–25 July 2003. [Google Scholar]
  38. Zhang, J.; Tian, Y.; Yan, L.; Wang, B.; Wang, L.; Xu, J.; Wu, K. Diagnosing the symptoms of sheath blight disease on rice stalk with an in-situ hyperspectral imaging technique. Biosyst. Eng. 2021, 209, 94–105. [Google Scholar] [CrossRef]
  39. Yan, Y.; Chai, R.; He, Y. Early detection of rice blast (Pyricularia) at seedling stage in Nipponbare rice variety using near-infrared hyper-spectral image. Afr. J. Biotechnol. 2012, 11, 6809–6817. [Google Scholar] [CrossRef] [Green Version]
  40. Liu, Z.Y.; Qi, J.G.; Wang, N.N.; Zhu, Z.R.; Luo, J.; Liu, L.J.; Tang, J.; Cheng, J.A. Hyperspectral discrimination of foliar biotic damages in rice using principal component analysis and probabilistic neural network. Precis. Agric. 2018, 19, 973–991. [Google Scholar] [CrossRef]
  41. Yang, C.M.; Cheng, C.H. Spectral characteristics of rice plants infested by brown planthopper. Proc. Natl. Sci. Counc. Repub. China Part B Life Sci. 2001, 25, 180–186. [Google Scholar]
  42. Lin, F.; Guo, S.; Tan, C.; Zhou, X.; Zhang, D. Identification of Rice Sheath Blight through Spectral Responses Using Hyperspectral Images. Sensors 2020, 20, 6243. [Google Scholar] [CrossRef] [PubMed]
  43. Mandal, N.; Adak, S.; Das, D.; Sahoo, R.; Kumar, A.; Viswanathan, C.; Mukherjee, J.; Gakhar, S. Characterization of Rice Blast Disease Using Greenness Index, Canopy Temperature and Vegetation Indices. Int. J. Agric. Environ. Biotechnol. 2022, 15, 81–89. [Google Scholar] [CrossRef]
  44. Kurmi, Y.; Gangwar, S.; Agrawal, D.; Kumar, S.; Srivastava, H.S. Leaf image analysis-based crop diseases classification. Signal Image Video Process. 2021, 15, 589–597. [Google Scholar] [CrossRef]
  45. Bhagat, M.; Kumar, D. A comprehensive survey on leaf disease identification & classification. Multimed. Tools Appl. 2022, 81, 33897–33925. [Google Scholar] [CrossRef]
  46. Trkolu, M.; Hanbay, D. Plant disease and pest detection using deep learning-based features. Turk. J. Electr. Eng. Comput. Sci. 2019, 27, 1636–1651. [Google Scholar] [CrossRef]
  47. Anthonys, G.; Wickramarachchi, N. An image recognition system for crop disease id. In Proceedings of the IEEE 2009 International Conference on Industrial and Information Systems (ICIIS), Peradeniya, Sri Lanka, 28–31 December 2009; pp. 403–407. [Google Scholar]
  48. Prajapati, H.B.; Shah, J.P.; Dabhi, V.K. Detection and classification of rice plant diseases. Intell. Decis. Technol. 2017, 11, 357–373. [Google Scholar] [CrossRef]
  49. Anitha, K.; Srinivasan, S. Feature Extraction and Classification of Plant Leaf Diseases Using Deep Learning Techniques. Comput. Mater. Contin. 2022, 73, 233–247. [Google Scholar] [CrossRef]
  50. Singh, A.K.; Sreenivasu, S.V.N.; Mahalaxmi, U.S.B.K.; Sharma, H.; Patil, D.D.; Asenso, E. Hybrid Feature-Based Disease Detection in Plant Leaf Using Convolutional Neural Network, Bayesian Optimized SVM, and Random Forest Classifier. J. Food Qual. 2022, 2022, 2845320. [Google Scholar] [CrossRef]
  51. Sethy, P.K.; Barpanda, N.K.; Rath, A.K.; Behera, S.K. Deep feature based rice leaf disease identification using support vector machine. Comput. Electron. Agric. 2020, 175, 105527. [Google Scholar] [CrossRef]
  52. Yang, G.; Chen, G.; Li, C.; Fu, J.; Liang, H. Convolutional Rebalancing Network for the Classification of Large Imbalanced Rice Pest and Disease Datasets in the Field. Front. Plant Sci. 2021, 12, 671134. [Google Scholar] [CrossRef]
  53. Ma, J.; Du, K.; Zhang, L.; Zheng, F.; Chu, J.; Sun, Z. A segmentation method for greenhouse vegetable foliar disease spots images using color information and region growing. Comput. Electron. Agric. 2017, 142, 110–117. [Google Scholar] [CrossRef]
  54. Hua, S.; Xu, M.; Xu, Z.; Ye, H.; Zhou, C. Multi-feature decision fusion algorithm for disease detection on crop surface based on machine vision. Neural Comput. Appl. 2022, 34, 9471–9484. [Google Scholar] [CrossRef]
  55. Dwi Pupitasari, T.; Basori, A.; Yufit Riskiawan, H.; Sarwo Setyohadia, D.P.S.; Agus Kurniasari, A.; Firgiyanto, R.; Firdausiah Mansur, A.B.; Yunianta, A. Intelligent Detection of Rice Leaf Diseases Based on Histogram Color and Closing Morphological. Emir. J. Food Agric. 2022, 34, 2858. [Google Scholar] [CrossRef]
  56. Kimm, H.; Guan, K.; Burroughs, C.H.; Peng, B.; Wu, G. Quantifying high-temperature stress on soybean canopy photosynthesis: The unique role of sun-induced chlorophyll fluorescence. Glob. Change Biol. 2021, 27, 2403–2415. [Google Scholar] [CrossRef] [PubMed]
  57. Zarco-Tejada, P.J.; Miller, J.R.; Mohammed, G.H.; Noland, T.L.; Sampson, P.H. Chlorophyll Fluorescence Effects on Vegetation Apparent Reflectance. Remote Sens. Environ. 2000, 74, 596–608. [Google Scholar] [CrossRef]
  58. Tischler, Y.K.; Thiessen, E.; Hartung, E. Early optical detection of infection with brown rust in winter wheat by chlorophyll fluorescence excitation spectra. Comput. Electron. Agric. 2018, 146, 77–85. [Google Scholar] [CrossRef]
  59. Liu, L.; Zhao, J.; Guan, L. Tracking photosynthetic injury of Paraquat-treated crop using chlorophyll fluorescence from hyperspectral data. Eur. J. Remote Sens. 2013, 46, 459–473. [Google Scholar] [CrossRef] [Green Version]
  60. Liu, L.; Yang, X.; Zhou, H.; Liu, S.; Zhou, L.; Li, X.; Yang, J.; Han, X.; Wu, J. Evaluating the utility of solar-induced chlorophyll fluorescence for drought monitoring by comparison with NDVI derived from wheat canopy. Sci. Total Environ. 2018, 625, 1208–1217. [Google Scholar] [CrossRef]
  61. Jing, X.; Zou, Q.; Yan, J.; Dong, Y.; Li, B. Remote Sensing Monitoring of Winter Wheat Stripe Rust Based on mRMR-XGBoost Algorithm. Remote Sens. 2022, 14, 756. [Google Scholar] [CrossRef]
  62. Raji, S.N.; Subhash, N.; Ravi, V.; Saravanan, R.; Mohanan, C.N.; Nita, S.; Kumar, T.M. Detection of mosaic virus disease in cassava plants by sunlight-induced fluorescence imaging: A pilot study for proximal sensing. Int. J. Remote Sens. 2015, 36, 2880–2897. [Google Scholar] [CrossRef]
  63. Zarco-Tejada, P.J.; Catalina, A.; González, M.R.; Martín, P. Relationships between net photosynthesis and steady-state chlorophyll fluorescence retrieved from airborne hyperspectral imagery. Remote Sens. Environ. 2013, 136, 247–258. [Google Scholar] [CrossRef] [Green Version]
  64. Porcar-Castell, A.; Tyystjärvi, E.; Atherton, J.; Van der Tol, C.; Flexas, J.; Pfündel, E.E.; Moreno, J.; Frankenberg, C.; Berry, J.A. Linking chlorophyll a fluorescence to photosynthesis for remote sensing applications: Mechanisms and challenges. J. Exp. Bot. 2014, 65, 4065–4095. [Google Scholar] [CrossRef] [Green Version]
  65. Neinavaz, E.; Schlerf, M.; Darvishzadeh, R.; Gerhards, M.; Skidmore, A.K. Thermal infrared remote sensing of vegetation: Current status and perspectives. Int. J. Appl. Earth Obs. Geoinf. 2021, 102, 102415. [Google Scholar] [CrossRef]
  66. Jones, H.G.; Serraj, R.; Loveys, B.R.; Xiong, L.; Wheaton, A.; Price, A.H. Thermal infrared imaging of crop canopies for the remote diagnosis and quantification of plant responses to water stress in the field. Funct. Plant Biol. 2009, 36, 978–989. [Google Scholar] [CrossRef] [PubMed] [Green Version]
  67. Ludovisi, R.; Tauro, F.; Salvati, R.; Khoury, S.; Harfouche, A. UAV-Based Thermal Imaging for High-Throughput Field Phenotyping of Black Poplar Response to Drought. Front. Plant Sci. 2017, 8, 1681. [Google Scholar] [CrossRef]
  68. Radoglou-Grammatikis, P.; Sarigiannidis, P.; Lagkas, T.; Moscholios, I. A Compilation of UAV Applications for Precision Agriculture. Comput. Netw. 2020, 172, 107148. [Google Scholar] [CrossRef]
  69. Calderón, R.; Navas-Cortés, J.A.; Lucena, C.; Zarco-Tejada, P.J. High-resolution airborne hyperspectral and thermal imagery for early detection of Verticillium wilt of olive using fluorescence, temperature and narrow-band spectral indices. Remote Sens. Environ. 2013, 139, 231–245. [Google Scholar] [CrossRef]
  70. Yang, N.; Yuan, M.; Wang, P.; Zhang, R.; Sun, J.; Mao, H. Tea diseases detection based on fast infrared thermal image processing technology. J. Sci. Food Agric. 2019, 99, 3459–3466. [Google Scholar] [CrossRef] [PubMed]
  71. Messina, G.; Modica, G. Applications of UAV Thermal Imagery in Precision Agriculture: State of the Art and Future Research Outlook. Remote Sens. 2020, 12, 1491. [Google Scholar] [CrossRef]
  72. Liu, Z.Y.; Huang, J.F.; Shi, J.J.; Tao, R.X.; Zhou, W.; Zhang, L.L. Characterizing and estimating rice brown spot disease severity using stepwise regression, principal component regression and partial least-square regression. J. Zhejiang Univ. 2007, 8, 738–744. [Google Scholar] [CrossRef] [Green Version]
  73. Khanal, S.; Fulton, J.; Shearer, S. An overview of current and potential applications of thermal remote sensing in precision agriculture. Comput. Electron. Agric. 2017, 139, 22–32. [Google Scholar] [CrossRef]
  74. Mahlein, A.-K.; Oerke, E.-C.; Steiner, U.; Dehne, H.-W. Recent advances in sensing plant diseases for precision crop protection. Eur. J. Plant Pathol. 2012, 133, 197–209. [Google Scholar] [CrossRef]
  75. Zhu, X.; Cai, F.; Tian, J.; Williams, T. Spatiotemporal Fusion of Multisource Remote Sensing Data: Literature Survey, Taxonomy, Principles, Applications, and Future Directions. Remote Sens. 2018, 10, 527. [Google Scholar] [CrossRef] [Green Version]
  76. Feng, Z.; Song, L.; Duan, J.; Zhang, Y.; Wei, Y.; Feng, W. Monitoring wheat powdery mildew based on hyperspectra, thermal infrared, and RGB image data fusion. Sensors 2021, 22, 31. [Google Scholar] [CrossRef] [PubMed]
  77. Feng, L.; Wu, B.; Zhu, S.; Wang, J.; Zhang, C. Investigation on Data Fusion of Multisource Spectral Data for Rice Leaf Diseases Identification Using Machine Learning Methods. Front. Plant Sci. 2020, 11, 577063. [Google Scholar] [CrossRef]
  78. Yuan, L.; Bao, Z.; Zhang, H.; Zhang, Y.; Liang, X. Habitat monitoring to evaluate crop disease and pest distributions based on multi-source satellite remote sensing imagery. Opt. Int. J. Light Electron Opt. 2017, 145, 66–73. [Google Scholar] [CrossRef]
  79. Zheng, Q.; Ye, H.; Huang, W.; Dong, Y.; Jiang, H.; Wang, C.; Li, D.; Wang, L.; Chen, S. Integrating Spectral Information and Meteorological Data to Monitor Wheat Yellow Rust at a Regional Scale: A Case Study. Remote Sens. 2021, 13, 278. [Google Scholar] [CrossRef]
  80. Marques da Silva, J.R.; Damásio, C.V.; Sousa, A.M.O.; Bugalho, L.; Pessanha, L.; Quaresma, P. Agriculture pest and disease risk maps considering MSG satellite data and land surface temperature. Int. J. Appl. Earth Obs. Geoinf. 2015, 38, 40–50. [Google Scholar] [CrossRef] [Green Version]
  81. Yones, M.S.; Arafat, S.; Abou, H.A.F.; Abd Elrahman, H.A.; Dah, H.F. Determination of the best timing for control application against cotton leaf worm using remote sensing and geographical information techniques. Egypt. J. Remote Sens. Space Sci. 2012, 15, 151–160. [Google Scholar] [CrossRef] [Green Version]
  82. Zhang, J.; Pu, R.; Yuan, L.; Huang, W.; Nie, C.; Yang, G. Integrating Remotely Sensed and Meteorological Observations to Forecast Wheat Powdery Mildew at a Regional Scale. IEEE J. Sel. Top. Appl. Earth Obs. Remote Sens. 2017, 7, 4328–4339. [Google Scholar] [CrossRef]
  83. Al-Ruzouq, R.; Gibril, M.B.A.; Shanableh, A.; Kais, A.; Hamed, O.; Al-Mansoori, S.; Khalil, M.A. Sensors, Features, and Machine Learning for Oil Spill Detection and Monitoring: A Review. Remote Sens. 2020, 12, 3338. [Google Scholar] [CrossRef]
  84. Feng, S.; Zhao, D.; Guan, Q.; Li, J.; Liu, Z.; Jin, Z.; Li, G.; Xu, T. A deep convolutional neural network-based wavelength selection method for spectral characteristics of rice blast disease. Comput. Electron. Agric. 2022, 199, 107199. [Google Scholar] [CrossRef]
  85. Yang, C.M. Assessment of the severity of bacterial leaf blight in rice using canopy hyperspectral reflectance. Precis. Agric. 2010, 11, 61–81. [Google Scholar] [CrossRef]
  86. Luo, Y.H.; Jiang, P.; Xie, K.; Wang, F.J. Research on optimal predicting model for the grading detection of rice blast. Opt. Rev. 2019, 26, 118–123. [Google Scholar] [CrossRef]
  87. Saleem, M.H.; Potgieter, J.; Arif, K.M. Plant Disease Detection and Classification by Deep Learning. Plants 2019, 8, 22. [Google Scholar] [CrossRef] [PubMed] [Green Version]
  88. Thaiyalnayaki, K.; Joseph, C. Classification of plant disease using SVM and deep learning. Mater. Today Proc. 2021, 47, 468–470. [Google Scholar] [CrossRef]
  89. Kharim, M.N.A.; Wayayok, A.; Abdullah, A.F.; Shariff, A.R.M.; Husin, E.M.; Mahadi, M.R. Predictive zoning of pest and disease infestations in rice field based on UAV aerial imagery. Egypt. J. Remote Sens. Space Sci. 2022, 25, 831–840. [Google Scholar]
  90. Singh, A.K.; Rubiya, A.; Raja, B.S. Classification of rice disease using digital image processing and svm classifier. Int. J. Electr. Electron. Eng. 2015, 7, 294–299. [Google Scholar]
  91. Kahar, M.; Mutalib, S.; Abdul-Rahman, S. Early Detection and Classification of Paddy Diseases with Neural Networks and Fuzzy Logic. In Proceedings of the 17th International Conference on Mathematical and Computational Methods in Science and Engineering, MACMESE, Kuala Lumpur, Malaysia, 23–25 April 2015; pp. 248–257. [Google Scholar]
  92. Liu, Z.Y.; Wu, H.F.; Huang, J.F. Application of neural networks to discriminate fungal infection levels in rice panicles using hyperspectral reflectance and principal components analysis. Comput. Electron. Agric. 2010, 72, 99–106. [Google Scholar] [CrossRef]
  93. Ahmadi, P.; Muharam, F.M.; Ahmad, K.; Mansor, S.; Seman, I.A. Early detection of ganoderma basal stem rot of oil palms using artificial neural network spectral analysis. Plant Dis. 2017, 101, 1009–1016. [Google Scholar] [CrossRef] [Green Version]
  94. Ma, B.; Cao, G.; Hu, C.; Chen, C. Monitoring the Rice Panicle Blast Control Period Based on UAV Multispectral Remote Sensing and Machine Learning. Land 2023, 12, 469. [Google Scholar] [CrossRef]
  95. Liu, Z.; Shi, J.; Zhang, L.; Huang, J. Discrimination of rice panicles by hyperspectral reflectance data based on principal component analysis and support vector classification. J. Zhejiang Univ. Sci. B 2010, 11, 71–78. [Google Scholar] [CrossRef] [PubMed] [Green Version]
  96. Saleem, M.H.; Potgieter, J.; Arif, K.M. Automation in Agriculture by Machine and Deep Learning Techniques: A Review of Recent Developments. Precis. Agric. 2021, 22, 2053–2091. [Google Scholar] [CrossRef]
  97. Hao, Z.; Hao, H.; Zhang, X.B.; Zhu, L.F.; Zheng, K.F.; Jin, Q.Y.; Zeng, F.P. Estimation of rice neck blasts severity using spectral reflectance based on BP-neural network. Acta Physiol. Plant. 2011, 33, 2461–2466. [Google Scholar]
  98. Narmadha, R.-P.; Sengottaiyan, N.; Kavitha, R.-J. Deep Transfer Learning Based Rice Plant Disease Detection Model. Intell. Autom. Soft Comput. 2022, 31, 1257–1271. [Google Scholar] [CrossRef]
  99. Gautam, V.; Trivedi, N.K.; Singh, A.; Mohamed, H.G.; Noya, I.D.; Kaur, P.; Goyal, N. A Transfer Learning-Based Artificial Intelligence Model for Leaf Disease Assessment. Sustainability 2022, 14, 13610. [Google Scholar] [CrossRef]
  100. Ganesan, G.; Chinnappan, J. Hybridization of ResNet with YOLO classifier for automated paddy leaf disease recognition: An optimized model. J. Field Robot. 2022, 39, 1087–1111. [Google Scholar] [CrossRef]
  101. Zhang, D.; Xingen, Z.; Jian, Z.; Yubin, L.; Chao, X.; Dong, L.; Zonghua, W. Detection of rice sheath blight using an unmanned aerial system with high-resolution color and multispectral imaging. PLoS ONE 2018, 13, e0187470. [Google Scholar] [CrossRef] [Green Version]
  102. Huang, W.; Davidw, L.; Zheng, N.; Zhang, Y.; Liu, L.; Wang, J. Identification of yellow rust in wheat using in-situ spectral reflectance measurements and airborne hyperspectral imaging. Precis. Agric. 2007, 8, 187–197. [Google Scholar] [CrossRef]
  103. Dash, J.P.; Watt, M.S.; Pearse, G.D.; Heaphy, M.; Dungey, H.S. Assessing very high resolution UAV imagery for monitoring forest health during a simulated disease outbreak. Int. J. Photogramm. Remote Sens. 2017, 131, 1–14. [Google Scholar] [CrossRef]
  104. Bachik, N.A.; Hashim, N.; Wayayok, A.; Man, H.C.; Ali, M.M. Optical imaging techniques for rice diseases detection: A review. J. Agric. Food Eng. 2020, 1, 11. [Google Scholar]
  105. Campos-Taberner, M.; García-Haro, F.J.; Camps-Valls, G.; Grau-Muedra, G.; Nutini, F.; Crema, A.; Boschetti, M. Multitemporal and multiresolution leaf area index retrieval for operational local rice crop monitoring. Remote Sens. Environ. Interdiscip. J. 2016, 187, 102–118. [Google Scholar] [CrossRef]
  106. Gong, P.; Pu, R.; Heald, R.C. Analysis of in situ hyperspectral data for nutrient estimation of giant sequoia. Int. J. Remote Sens. 2002, 23, 1827–1850. [Google Scholar] [CrossRef]
Figure 1. Pictures of typical rice diseases and pests.
Agronomy 13 01851 g001
Figure 2. Spectral response characteristics of healthy and diseased rice.
Agronomy 13 01851 g002
Figure 3. 3D visualization of a classic rice sheath blight disease lesion area in a hyperspectral image (Reprinted with premission from ref. [38]. Copyright Year: 2021. Copyright Owner’s Name: Zhang JC).
Agronomy 13 01851 g003
Figure 4. Flow chart of the proposed framework for remote sensing monitoring of rice diseases and pests.
Agronomy 13 01851 g004
Table 1. Data characteristics and scales of different data sources used for remote sensing monitoring of rice diseases and pests.
Data SourceData CharacteristicsData Acquisition EquipmentMonitoring Scale
Non-imaging hyperspectralHigh spectral resolution and rich bandsASD (Analytical Spectral Devices) FieldSpec spectrometerLeaf scale, canopy scale, field scale
Image hyperspectralHigh spectral resolution, rich bands and image informationScanning imaging spectrometer
Airborne hyperspectral imager
Leaf scale, canopy scale, field scale, regional scale
MultispectralLarge monitoring range, low costMultispectral imaging camera (MS-4100)
Satellite imagery (Landsat, TM, Sentinel-2A/B, Quickbird, WorldView-2, HJ-CCD, IKONOS)
UAV (unmanned aerial vehicle) multispectral image
Field scale, regional scale, global scale
ImagingRich disease and pest symptom informationCamera
Imaging spectrometer (Headwall)
UAV hyperspectral/multispectral sensor
Leaf scale, canopy scale, field scale
FluorescenceSensitive pointers for photosynthetic functionsFluorescence spectrum (PAM-2100)
IMAGING-PAM
Leaf scale, canopy scale
Thermal infraredQuick collection, non-destructiveThermal infrared imager (FLIR)
Thermal infrared satellite image (TM, ASTER, HJ-IRS)
Field scale, regional scale
Table 2. Sensitive spectral bands and indices used for identifying rice diseases and pests.
Bands/IndicesRice Diseases or PestsSensitive FeaturesReferences
Spectral bandSheath blightR494, R666[38]
Rice blastR1188, R1339, R1377, R1432, R1614[39]
Rice panicle blast430–530, 580–680, 1480–2000 nm, R459, R546, R569, R590, R775, R981[1,15]
Rice glume blightR450–R850[40]
Brown planthopperR737–R925, R426[29,41]
R750–R1000, R400–R531, R567–R705[31]
Leaf folderR757[29]
R410, R470, R490, R570, R625, R665, and R720[25]
Spectral indicesRice planthopperSAVI[29]
Sheath blight(Rg − Ro)/(Rg + Ro), (SDy − SDb)/(SDy + SDb), nitrogen reflectance index (NRI)[42]
Rice blast diseaseGNDVI, EVI, NDMI, SAVI[35,43]
RBI and NDBI[36]
BPH (brown planthopper) sheath
blight
RVI14, SDI14 and SDI24[33,34]
Rice leaf folderGNDVI[29]
(R490–R470), (R400–R470)/(R400–R490)[25]
R is the abbreviation for reflectance, and R1148 represents the spectral reflectance of vegetation at 1148 nm. The detailed definitions and algorithm for Rg, Ro, SDy, SDb, RBI, NDBI, RVI14, SDI14 and SDI24 are provided in Appendix A.
Table 3. Summary of methods for remote sensing monitoring of rice diseases and pests.
CategoryMethodsCategories of Rice Diseases and PestsReferences
Statistical discriminant analysisDiscriminant analysisrice blast[15]
Linear regression analysisrice panicle blast[97]
Bacterial leaf blight (BLB), bacterial panicle blight (BPB), and stem borer(SB)[89]
Partial least squares regressionbrown planthopper, rice blast[29,41]
Machine learning algorithmsSupport vector machinesrice panicle blast, leaffolder, sheath blight[90]
Random forest (RF)rice blast[84]
Artificial neural networks (ANN)leaf blight, leaf blast, and sheath blight[91]
BP Neural Artificial Networkrice panicle blast[97]
Probabilistic neural networkPyricularia grisea Sacc, Bipolaris oryzae Shoem, Aphelenchoides besseyi Christie and Cnaphalocrocis medinalis Guen[40]
Learning Vector Quantization (LVQ) Neural Networkrice panicle blast[92]
Deep learning algorithomA neural network-based deep learning modelRice Blast Disease[35,84]
DenseNet169-MLPLeaf blight, Brown spot, Leaf smut[98]
Convolutional Neural Networks-
based Deep Learning (CNN-based DL)
Blight, blast, brown spot[99]
ResNet with YOLO classifierpaddy leaf disease[100]
Disclaimer/Publisher’s Note: The statements, opinions and data contained in all publications are solely those of the individual author(s) and contributor(s) and not of MDPI and/or the editor(s). MDPI and/or the editor(s) disclaim responsibility for any injury to people or property resulting from any ideas, methods, instructions or products referred to in the content.

