Article

Effect of Different Ratios of Red and Blue Light on Maximum Stomatal Conductance and Response Rate of Cucumber Seedling Leaves

1
College of Horticulture, Northwest A & F University, Xianyang 712100, China
2
Key Laboratory of Protected Horticultural Engineering in Northwestern China, Ministry of Agriculture and Rural Affairs, Northwest A & F University, Xianyang 712100, China
3
College of Life Sciences, Northwest A & F University, Xianyang 712100, China
*
Author to whom correspondence should be addressed.
Agronomy 2023, 13(7), 1941; https://doi.org/10.3390/agronomy13071941
Submission received: 2 June 2023 / Revised: 11 July 2023 / Accepted: 20 July 2023 / Published: 22 July 2023
(This article belongs to the Section Horticultural and Floricultural Crops)

Abstract

:
Light can regulate leaf stomatal development and movement, but the effects of different red-to-blue light mass ratios on leaf stomatal morphology and openness are not fully understood. In this trial, five different red-to-blue light (R:B) ratio treatments were used to study the changes in morphology, photosynthesis, and stomatal-related indexes of cucumber seedlings under fixed light intensity (200 μmol·m−2·s−1). The results showed that the thickness of spongy tissue and stomatal size (SZ) of cucumber seedling leaves decreased, and the photosynthetic potential, stomatal density (SD), maximum stomatal conductance and stomatal responsiveness increased with decreasing R:B content. The experimental results showed that when R:B = is 1:9, cucumber seedlings had the greatest stomatal density and the fastest response rate, and the stomatal opening rate was accelerated with the increase in the proportion of blue light; when R:B = is 3:7, the stomatal conductance was the greatest and the net photosynthetic rate was the highest. This trial provides some implications for changing plant light quality and thus affecting stomatal development and movement.

1. Preface

A stomatal pore is a microscopic structure consisting of a pair of guard cells surrounding a central pore. Plants actively regulate the stomatal aperture by sensing environmental changes and adjusting the expansion pressure of the guard cells, thereby regulating the rate of gas exchange between the interior and exterior of the leaf [1,2]. High stomatal conductance promotes net photosynthetic rate, but at the cost of greater water dissipation, making plants more susceptible to drought stress [3,4,5]; low stomatal conductance, while helping plants to better adapt to adversity, will limit CO2 diffusion and photosynthesis under well-watered conditions, thus negatively affecting biomass accumulation [4,6,7,8]. By controlling the expansion of guard cells, plants can precisely balance the relationship between carbon dioxide and water loss [9,10,11], allowing them to minimize water loss while maximizing CO2 supply [6]. However, in the face of environmental changes, stomatal responses (closure or opening) are often an order of magnitude slower than photosynthetic responses, which leads to a mismatch between stomatal conductance (gs) and carbon assimilation (A) [12], a lag effect that can lead to restricted carbon assimilation or increased unnecessary water dissipation [13]. Therefore, it has been suggested that enhancing the speed of stomatal response to environmental changes could significantly enhance plant carbon assimilation and water use efficiency [14].
The rate at which stomata respond to environmental changes depends on their own characteristics in addition to the environmental changes themselves, with the size and density of the stomata influencing the rate of stomatal response and maximum stomatal conductance. It has been shown that smaller stomata respond faster than larger stomata, due to their larger defense cell membrane area to volume ratio and the faster rate of solute change within them [15,16]. Changes in stomatal density have been one of the important strategies used by plants to respond to changes in environmental signals [17], and it has been shown through genetic modification (GM) that reducing stomatal density through manipulation can improve water use efficiency without affecting plant yield [18,19] and can reduce the entry of bacteria and other pathogens [20]. On the other hand, increasing stomatal density by GM can promote CO2 diffusion and improve photosynthetic efficiency, although this comes at the expense of water use efficiency [21].
Light is not only a source of energy for photosynthesis, but also a key signal regulating the growth and development of multifaceted plants [22]. Moreover, the development and the opening or closing of stomata are influenced by the environment in which the plant is exposed [21]. Under light conditions, the red and far-red photoreceptors (phyB and phyA) and the blue photoreceptors (CRY1/2) act synergistically to inhibit the constitutive photomorphogenic1 (COP1) activity as well as that of PIF4 (one of phytochrome-interacting factors) and associated downstream networks, thereby promoting stomatal development [23]. The response of stomatal movement to light depends mainly on two signaling mechanisms, namely the red and blue light response [24,25,26,27]. Red light acts as both a signal and an energy source as it induces the opening of stomata in chloroplasts of leaf pulp and guard cells through photosynthesis, reducing the intercellular carbon dioxide concentration (Ci) [24]. The red light-driven response of stomata is similar to the carbon assimilation response to increased light intensity [28], and the red light response of stomata is mediated by a part of the low CO2 regulatory network [29]. Further related studies have shown that the red light response is associated with anion transport [30,31,32], sucrose metabolism [33,34,35] and guard cell photosynthesis [36,37,38,39,40]. Blue light-induced stomatal opening differs from the red light response in that it does not require the involvement of a chloroplastic signal [41], and on a quantum basis, the stomatal blue light response drives stomatal opening 20 times more efficiently than red light [26,42]. Moreover, even when photosynthesis saturates under red light, the addition of blue light still increases stomatal opening [26]. The blue light response of stomata is important for morning stomatal opening for carbon assimilation [1]. It has been demonstrated that the sensitivity of the stomatal response to blue light depends on the background red light intensity [43], with gs increasing when blue light is applied to red light compared to for red light alone; on the other hand, little stomatal response is observed to weak blue light when red light is not present [26].
Therefore, we measured leaf characteristics such as stomatal traits, gas exchange capacity and photosynthetic capacity of cucumber seedlings treated with different ratios of red and blue light. The aim of this study is to address the response of leaf characteristics and stomatal traits to different ratios of red and blue light, and to provide some reference value for studies that can influence relevant physiological properties of plants by altering their light environment.

2. Materials and Methods

2.1. Test Materials

This trial was conducted in October 2022–December 2022 at the Laboratory of Biological and Environmental Engineering for Facility Agriculture, College of Horticulture, Northwest Agriculture and Forestry University of Science and Technology. The test material was cucumber ‘Xinjin You No. 1’ (Cucumis sativus L.) and seeds were purchased from Shandong Taian Huayi Seed Co. (Taian, China). The light source was LED light board and LED control system V1.0 produced by Xi’an InChange Photoelectric Technology Co. (Xi’an, China).
Cucumber seeds were sown in 10 cm × 10 cm seedling pots in substrate culture. The seeds were sown at a depth of 1.5 cm in a nursery substrate, and covered with a thin layer of vermiculite about 1 cm thick. They were grown in an artificial climate chamber with a light intensity of 150 μmol·m−2·s−1, day and night temperatures of 25 °C and 20 °C, respectively, a photoperiod of 12 h/12 h, relative humidity of 60% and the substrate was kept moderately hydrated by rehydrating once a day in the morning and once at night. Once their cotyledons had fully expanded, after around 3 d of growth, they were transplanted into a cultivator equipped with an LED light source and watered with 1/4 Hoagland Cucumber nutrient solution (pH 6.5 ± 0.1, EC 2.2–2.5 ms/cm); here, day and night temperatures of 28 °C and 25 °C, respectively, and relative humidity of 40–50% were maintained for 25 d by when about 4 leaves and 1 heart would have grown.

2.2. Experimental Design

The total light intensity of the test was set at 200 μmol·m−2·s−1, the photoperiod 12 h/12 h, the light intensity settings for each treatment were as shown in Table 1, and the spectra of each treatment were plotted as shown in Figure 1.

2.3. Item Determination

2.3.1. Morphological Indicators

Six cucumber seedlings were randomly selected when their growth had reached 4 leaves and 1 heart. Their above-ground height was determined using a ruler; stem thickness was determined using a vernier caliper; leaf area was determined using a leaf area meter (AM350 portable leaf area meter, ADC Bioscientific, Hoddesdon, UK); and weight was determined using an electronic balance.

2.3.2. Determination of Blade Structure Parameters

For each treatment, three cucumber seedlings were randomly selected, the third true leaf was taken and a 10 mm × 10 mm large leaf was taken at the same leaf position avoiding the main leaf veins, placed in FAA fixative (100 mL of which contained: 50 mL 95% ethanol, 5 mL acetic acid, 10 mL 37% formaldehyde, 35 mL distilled water), then dehydrated in ethanol, rendered transparent in xylene, stained in pink-solid green and embedded in paraffin to make the final paraffin sections. These were placed under a microscope (Olympus BX63, Olympus LS, Tokyo, Japan) for observation: 10 were selected for each mount leaf thickness, upper and lower epidermal thickness, fenestrated tissue thickness and spongy tissue thickness and were all measured by ImageJ V1.8 software.

2.3.3. Measurement of Photosynthetic Properties

Three cucumber seedlings were randomly selected from each treatment, their second true leaves were taken and their transpiration rate, net photosynthetic rate, intercellular CO2 concentration and stomatal conductance were measured using a plant photosynthesis meter 6800 (LI-6800, LI-COR Biosciences, Lincoln, NE, USA). The leaf chamber temperature was set at 24 °C, the CO2 level at 400 µmol/mol, the relative humidity at 60%, and the light source set at R90B10 with a light intensity of 1000 µmol·m−2·s−1.

2.3.4. Stomatal Characteristics

Three cucumber seedlings were randomly selected for each treatment, and the same leaf position of the third leaf was taken to make a clinical slide. The leaf was placed on transparent tape, lightly pressed to make a tight bond and then lightly scraped with a razor blade to remove the leaf flesh tissue. the mount was attached to a slide, and the section was observed under a microscope. Stomatal density was measured at 20× and stomatal size was measured at 40×. For each mount, ten fields of view were selected and 20 stomata were selected for each field of view. Stomatal length, stomatal width, pore length and pore width were measured by ImageJ software.

2.3.5. Stomatal Movement Measurements

Cucumber seedlings were randomly selected from each treatment, their 3rd true leaf was taken and their stomatal conductance was measured using a plant photosynthesis meter 6800 (LI-6800, USA). The leaf chamber temperature was set at 24 °C, the CO2 level at 400 µmol/mol and the relative humidity at 60%. Before the plants were exposed to light, the leaves were acclimatized by clamping them in the LI-6800, and after the data had stabilized, the stomatal conductance, net photosynthetic rate and intercellular CO2 concentration were recorded under dark conditions, once every 60 s. After 20 min of recording, the light intensity and light quality of the built-in light source in the leaf chamber were made consistent with the ambient light, and the stomatal-related data of seedlings in each treatment group under ambient light were recorded, once every 60 s. After 60 min, the light was switched off and stomatal data were recorded for each treatment group in the dark, once every 60 s. The measurements were completed before 12 noon to ensure that the stomatal opening and closing rhythm was maintained.

2.3.6. RNA Extraction and RT-PCR for Gene Expression Analysis

After 2 h of light treatment, 2 g of young apical tissue was taken, placed in 1.5 mL centrifuge tubes and rapidly frozen in liquid nitrogen, followed by high-frequency shaking using a high-throughput grinder. Stomatal development-related genes from the cucumber genome database (http://cucurbitgenomics.org/v2/, accessed on 23 December 2022) and SLAC1 [44] (a key gene for stomatal movement) were selected, and primers were designed by Primer Premier 5.0—the primer sequences are shown in Table 2. The extracted RNA was reverse transcribed into cDNA using the Reverse Transcription Kit (Cofitt, Chengdu, China) according to the standard reagent procedure. A volume of 2 × qPCR SmArt Mix (SYBR Green) kit (Dr. Di, China) was used for the RT-PCR reaction, using the −ΔΔCt analysis method.

2.4. Stomatal Movement Rate Analysis

The stomatal movement response curve was fitted using Matlab R2019b and its equation obtained. Curvature was calculated and plotted for each point on the equation to reflect the stomatal response rate for each treatment.
Stomatal opening rates were calculated with reference and minor modifications to the method of Lorna McAusland et al. [13].
Taking Gsmax as the stomatal conductance to reach steady state in ambient light, Gsmin as the stomatal conductance to reach steady state in darkness, ki as the time constant for gs to increase to Gsmax in ambient light, Slmax as the maximum rate of opening of gs to increase photosynthetic photon flux density(PPFD) from 0 to 200 μmol·m−2·s−1, and r0 as the minimum gs for the s-type response of gs to an increase in PPFD, then:
S l max = k i ( G r 0 ) e

2.5. Statistical Analysis

All statistical analyses were performed using SPSS 25.0 (IBM Corp., Armonk, NY, USA). The significance of differences between mean values was assessed by one-way analysis of variance (ANOVA) according to Tukey’s test (p < 0.05).

3. Results

3.1. Effect on Morphological Indicators of Cucumber Seedlings

As shown in Table 3, within a certain range, cucumber seedling height, fresh weight, total leaf area and dry weight increased with increasing the red to blue light ratio, but the growth promotion effect on the cucumber seedlings was reduced once the R:B ratio was too high. Comparing the fresh weight of R:B = 3:7 with R:B = 1:9, R:B = 3:7 and R:B = 1:1 groups, the former increased over the latter in the order of 32.55%, 24.27% and 19.97%, but the fresh weight of R:B = 9:1 treatment decreased by 14.05% compared to R:B = 7:3.

3.2. Effect of Different Red and Blue Light Ratios on Leaf Structure

As shown in Table 4, the inferior epidermis, palisade tissue and blade thickness of cucumber seedlings showed a significant decrease with increasing red light ratio under each treatment; the thickness of palisade tissue decreased by 44.43% in the R:B = 9:1 treatment compared to the R:B = 1:9 treatment, and blade thickness decreased by 28.01% in the R:B = 9:1 treatment compared to the R:B = 1:9 treatment. Both their upper epidermal and spongy tissues decreased to some extent with increasing red light ratio.

3.3. Effect on Photosynthetic Properties

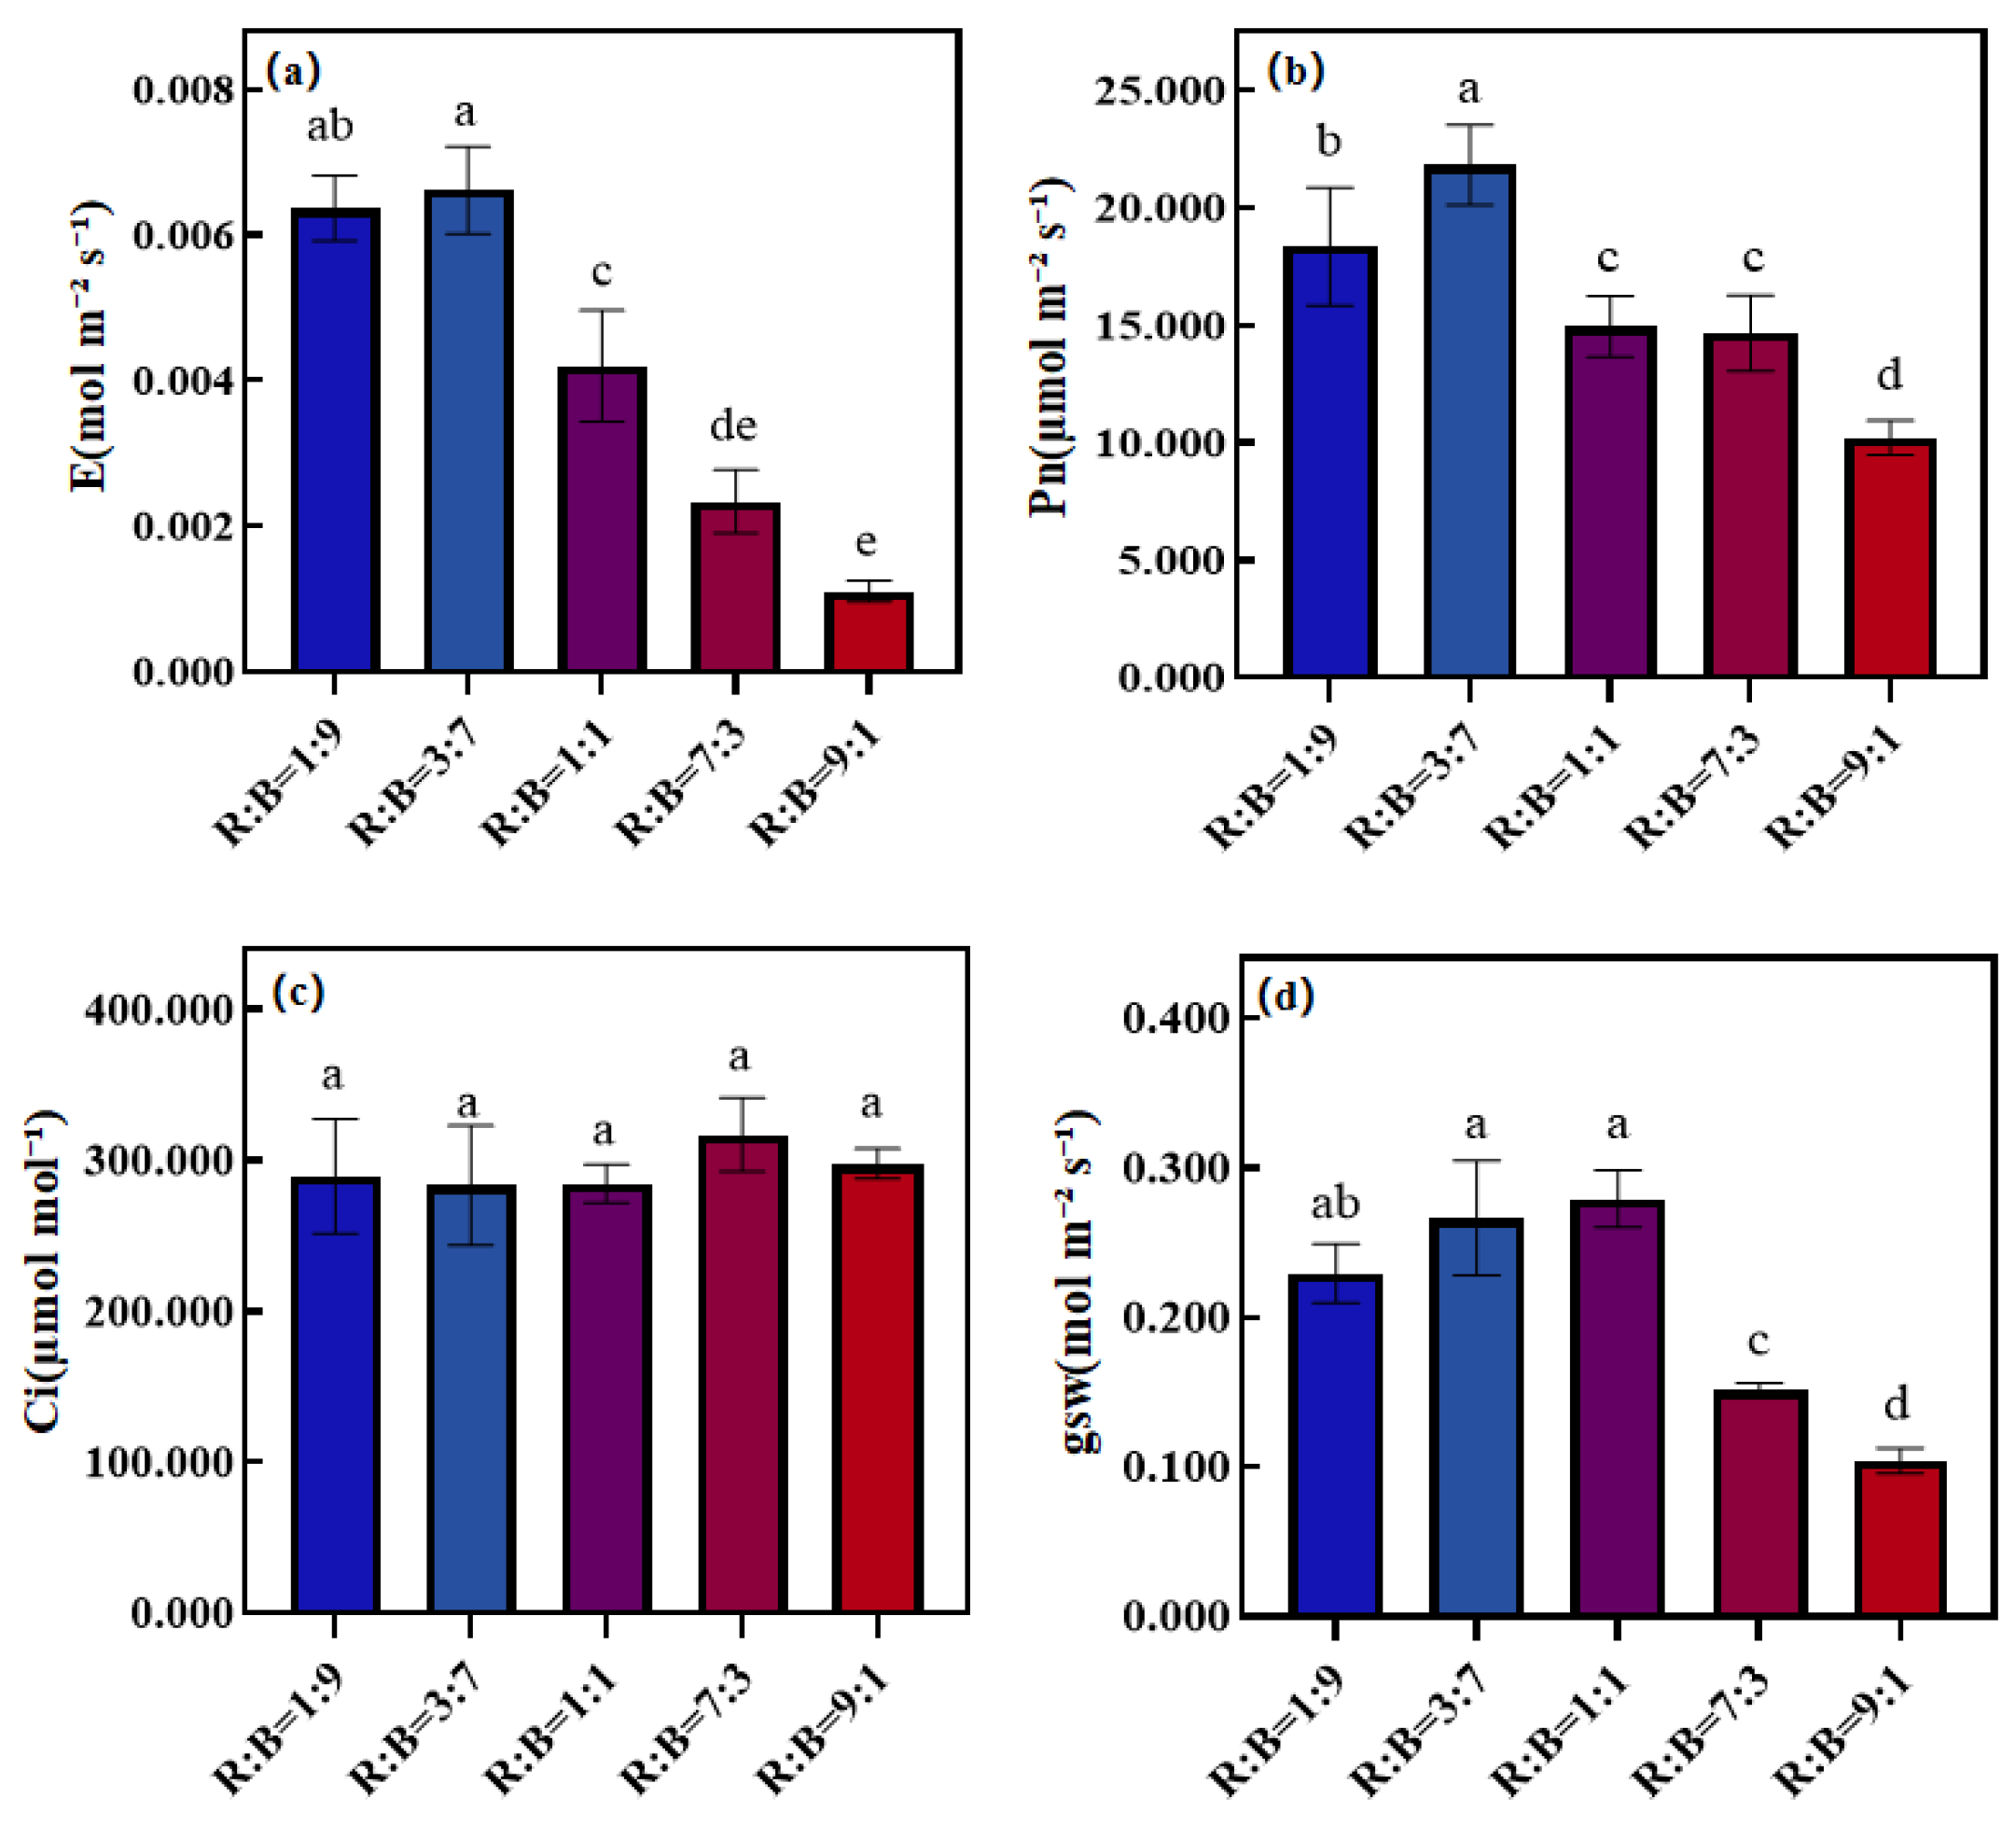
As shown in Figure 2, the transpiration rate E were significantly lower in the high R:B treatment than in the low R:B treatment under the same light quality and saturated light intensity conditions. With Pn increasing by 70.49% in the R:B = 1:9 treatment compared to R:B = 9:1. Therefore, cucumber seedlings grown under low R:B had greater photosynthetic potential.

3.4. Effect on Stomatal Characteristics

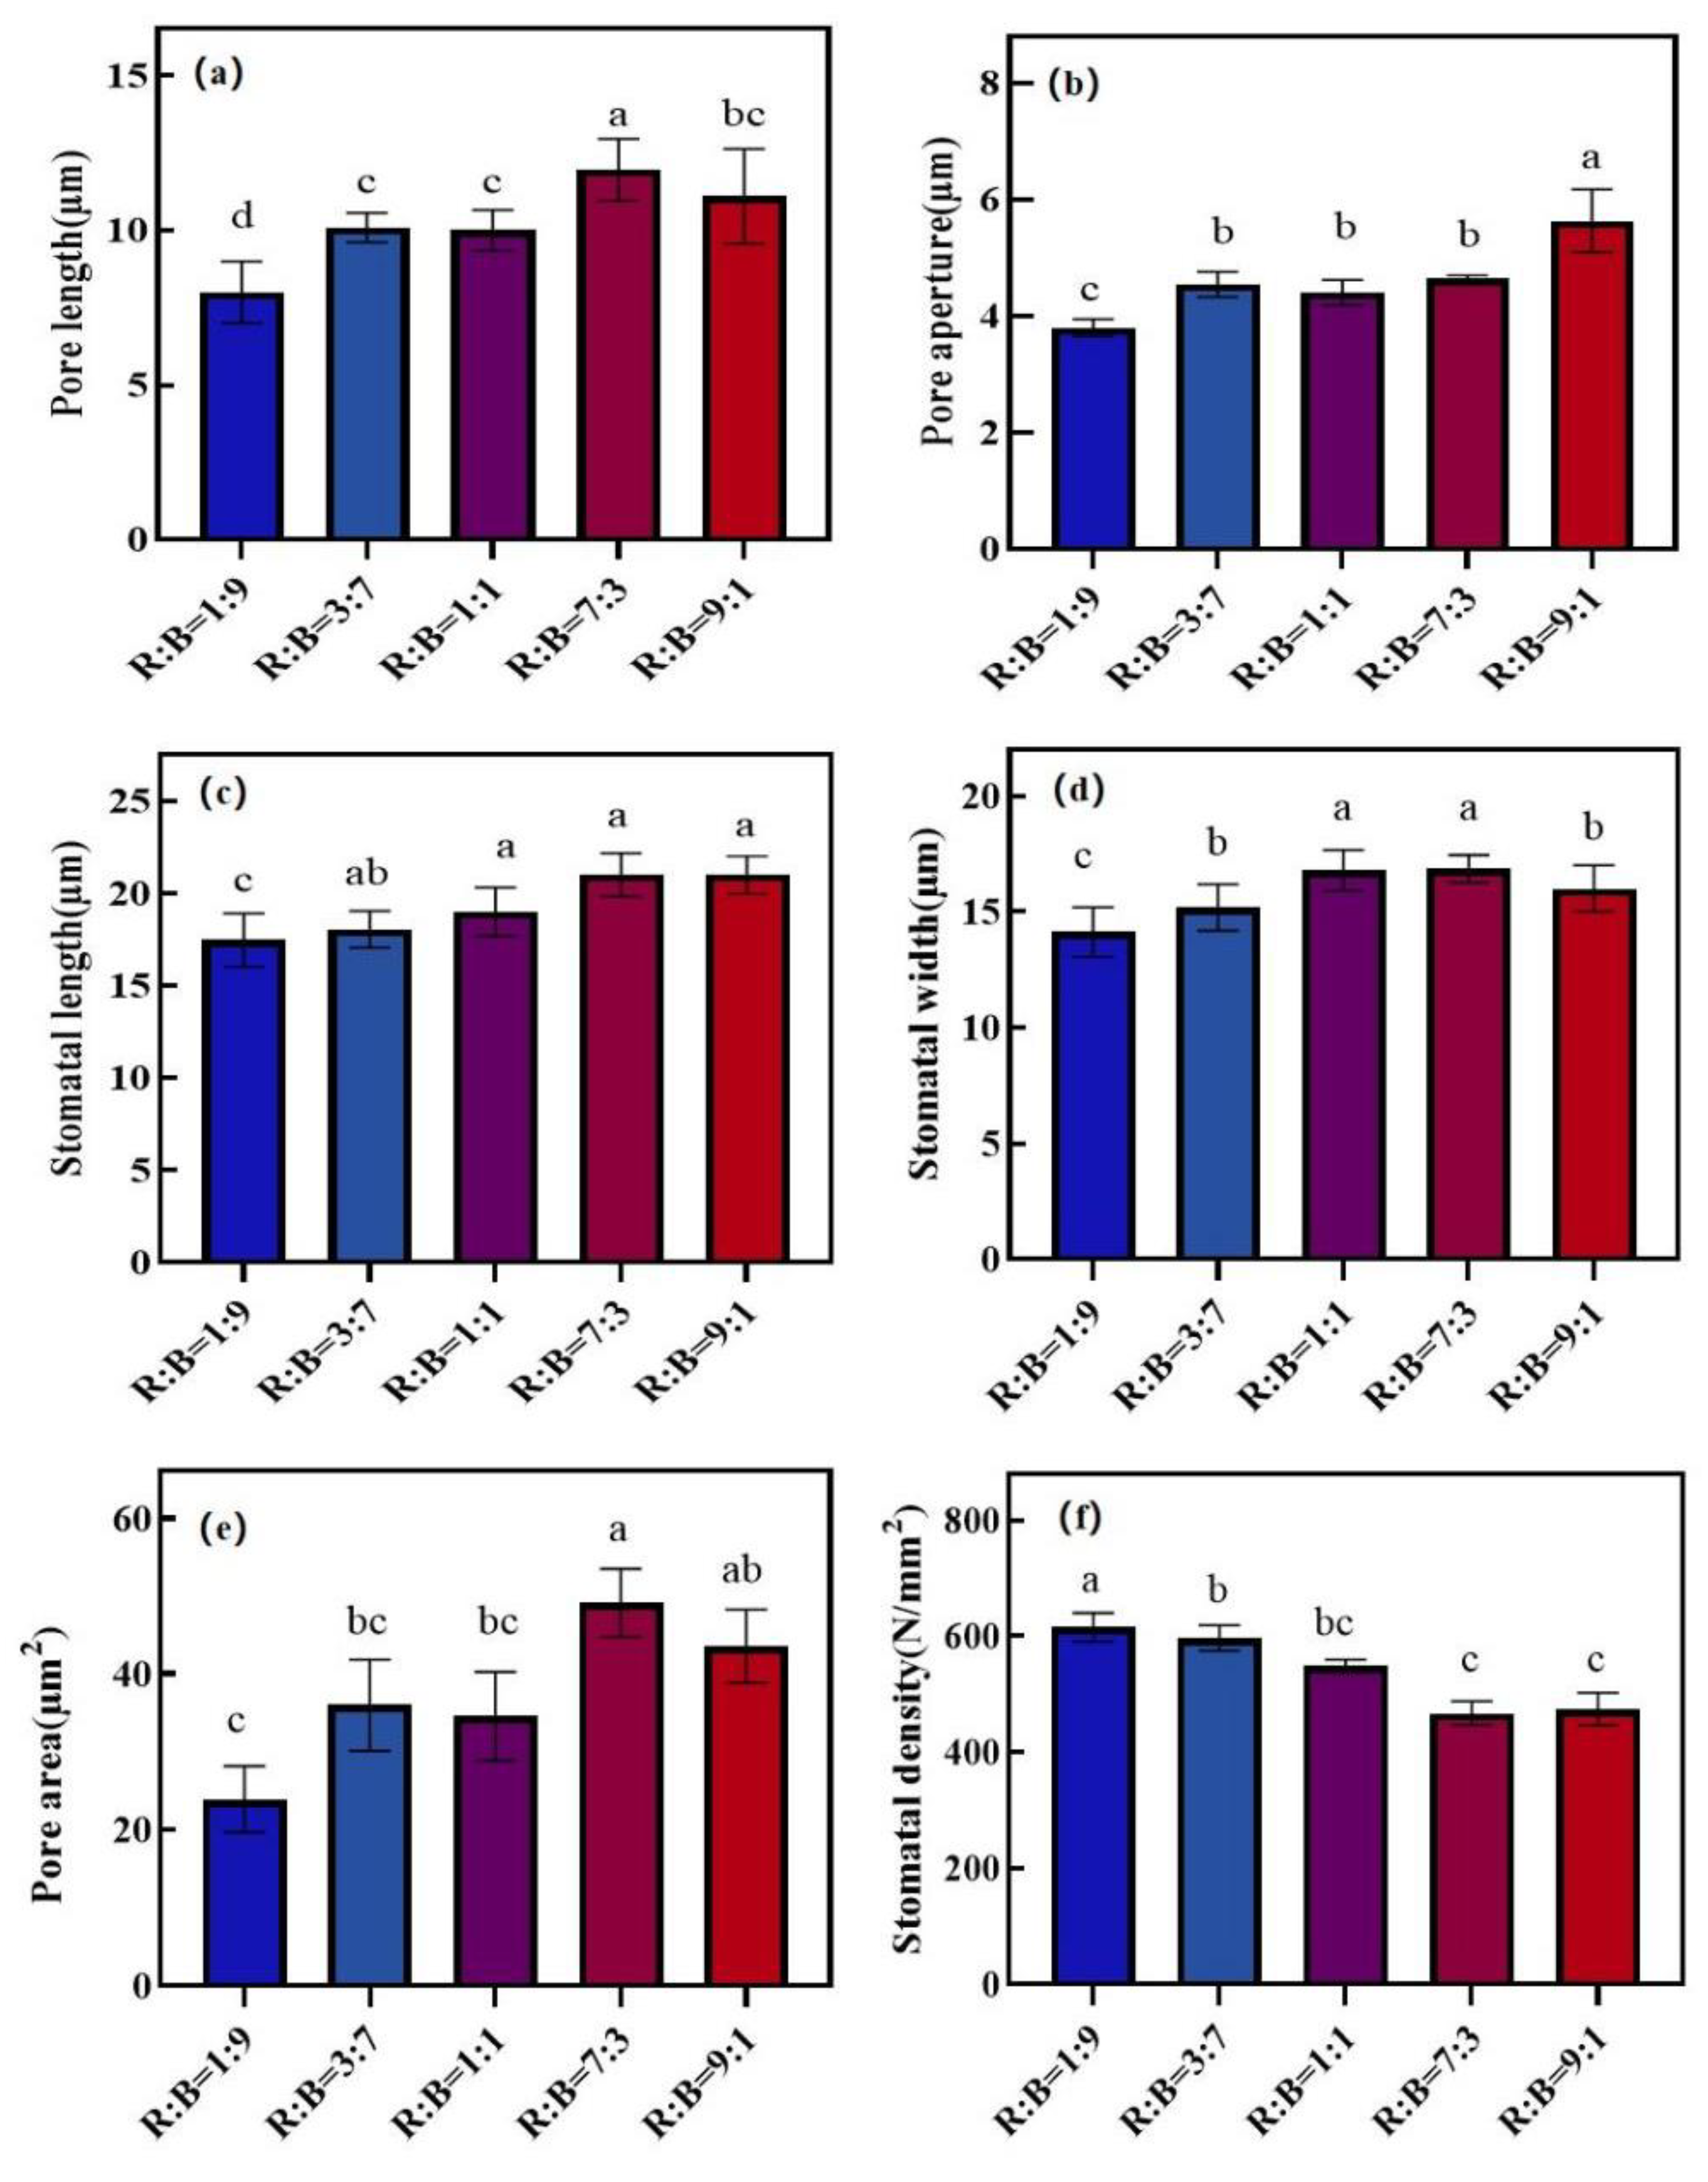
As shown in Figure 3a–d, the stomatal length, stomatal width, pore length and pore width of leaf stomata of cucumber seedlings grown under low R:B were lower than those of high R:B. Therefore, their stomatal pore area was also significantly lower than that of the high R:B treatment, where the stomatal area of the R:B = 1:9 treatment was significantly lower than that of the R:B = 7:3 treatment by 38.43%, with smaller stomatal size and pore openings (e.g., Figure 3e). However, as the red light ratio increased, their leaf stomatal density showed a significant decrease, with the R:B = 9:1 treatment showing a significant 45.75% decrease in stomatal density compared to the R:B = 1:9 treatment, as shown in Figure 3f.

3.5. Effect on Stomatal Dynamics

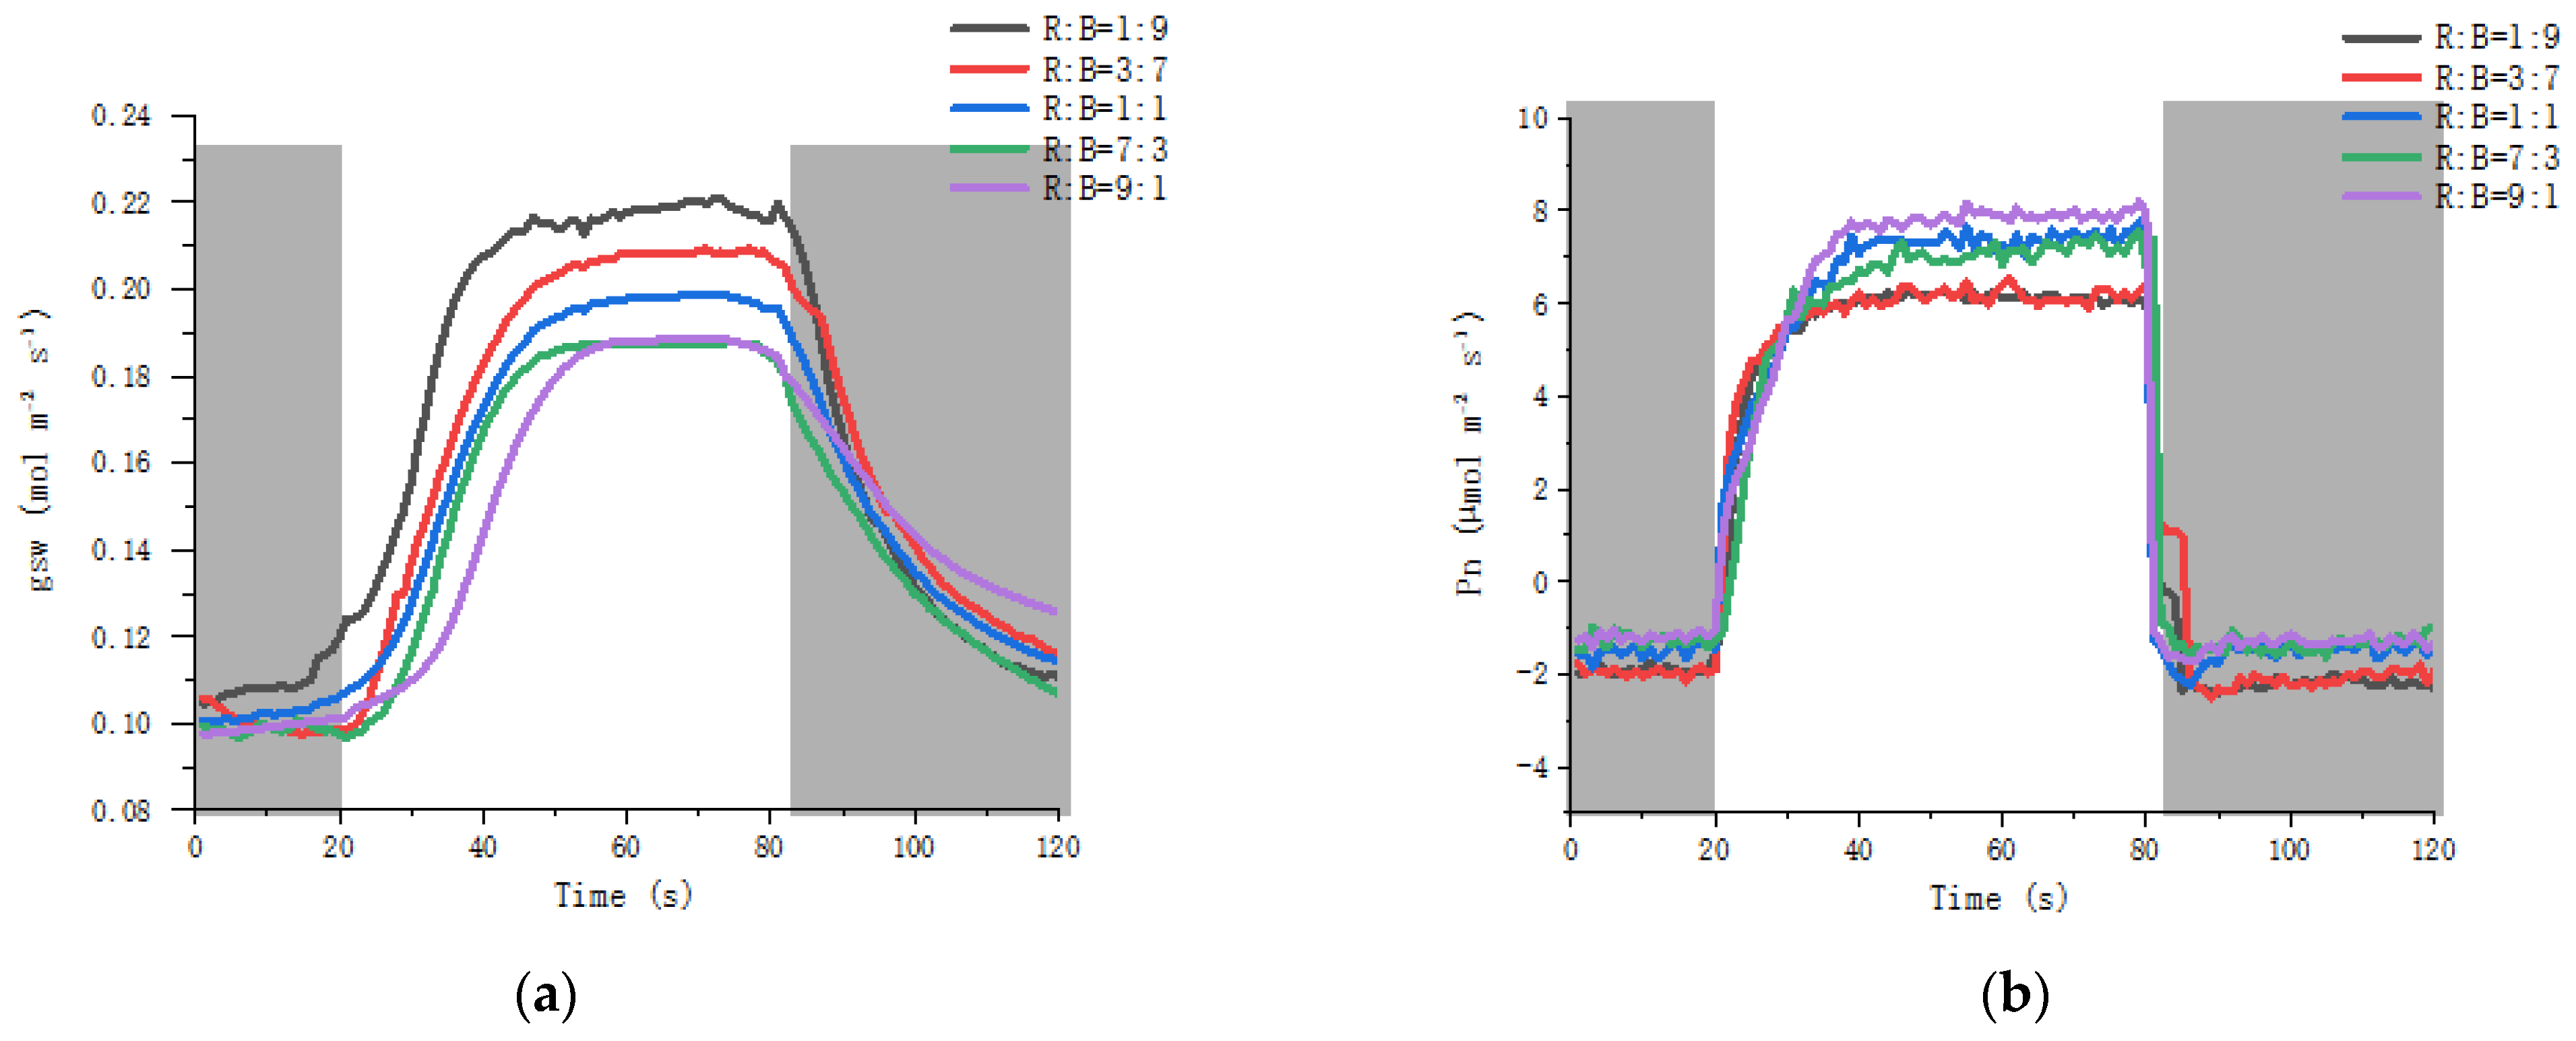
As shown in Figure 4, cucumber seedlings under the low R:B treatment had greater stomatal conductance and were more sensitive to ambient light than the high R:B treatment, entering a steady state of stomatal conductance more quickly, with the maximum stomatal conductance of the R:B = 1:9 treatment being 17.01% higher than that of the R:B = 9:1 treatment, but the net photosynthetic rate of the R:B = 1:9 treatment was lower than that of the R:B = 9:1 treatment.
For the stomatal response curve, the stomatal opening section was curve fitted to obtain the values shown in Figure 5a, and the curvature was calculated for each point on it to obtain the values shown in Figure 5b. The response rate for the low R/B treatment reached the maximum faster and gradually leveled off in the region, while the response rate for the high R/B treatment lagged behind the low R/B treatment, with the R:B = 9:1 treatment opening the slowest and reaching the maximum curvature the latest.
Calculations for the open portion of the stomatal response curve in Figure 6a yielded Table 5. The stomatal opening rate at the low R/B ratio shown in Table 5 is faster, with smaller ki values; the response rate is faster, with smaller Slmax; and the maximum stomatal conductance is greater, with larger Gsmax at steady state.

3.6. Effect on Stomatal Development and Motility Genes

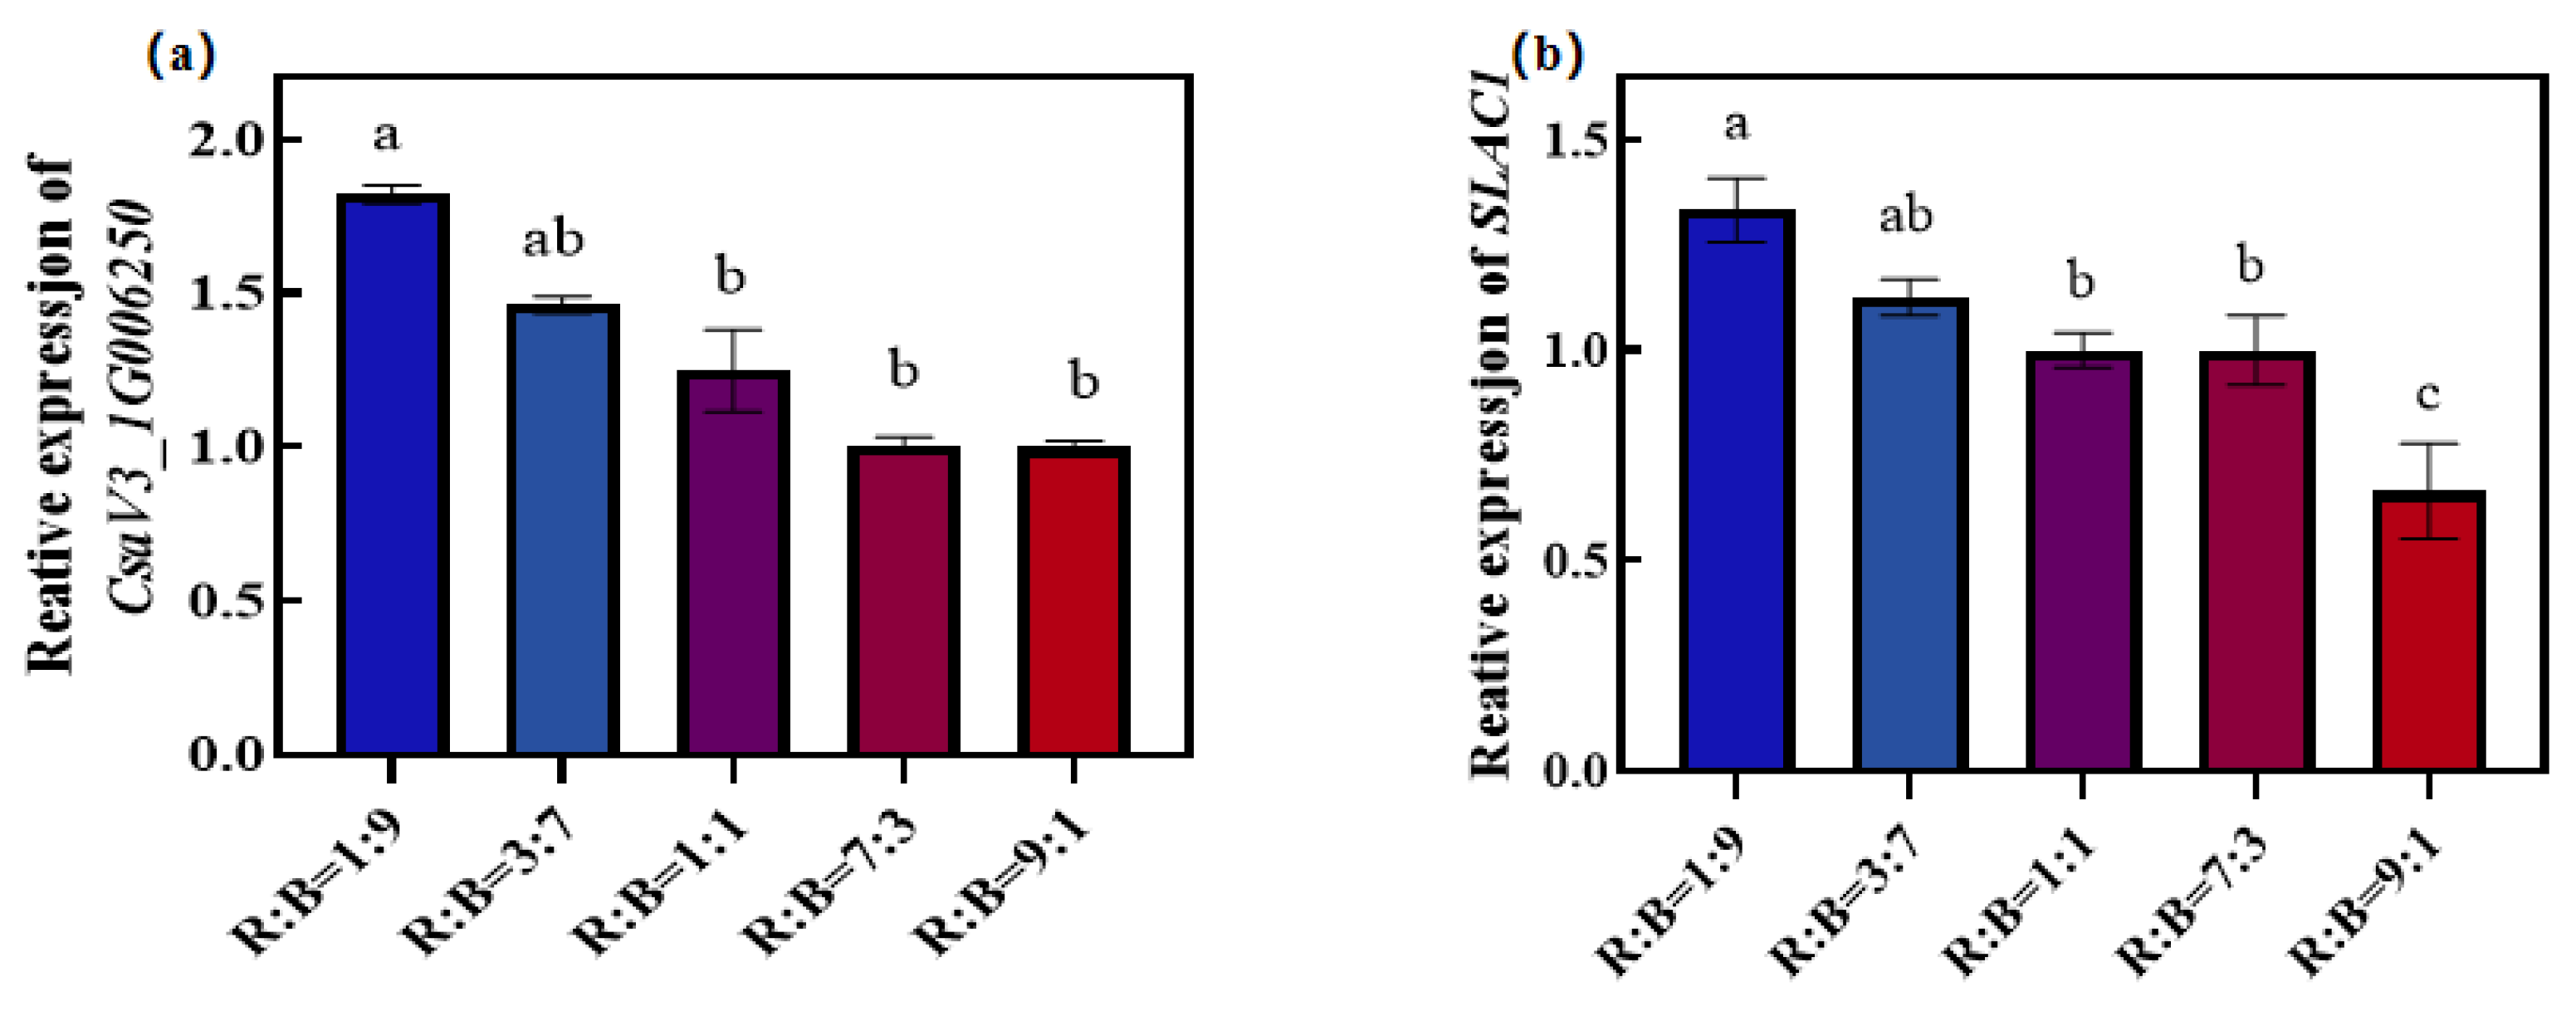
The expression of stomatal development-related genes was significantly higher in the R:B = 1:9 treatment than in the R:B = 1:1, R:B = 7:3 and R:B = 9:1 treatments. Moreover, there was a trend that the relative expression of CsaV3_1G006250 decreased with increasing red light ratios.
The key gene for stomatal movement, SLAC1, was also closely related to its stomatal number, with the R:B = 1:9 treatment significantly higher than the R:B = 1:1, R:B = 7:3 and R:B = 9:1 treatments. Indeed, the relative expression of SLAC1 was significantly increased by 100.75% under the R:B = 1:9 treatment compared to the R:B = 9:1 treatment.

4. Discussion

LEDs offer a variety of spectral possibilities for plant growth, with red and blue light often used in combination for plant supplementation, and it has been shown that plant growth under single red or blue light were worse than under mixed red and blue light [45]. However, the optimal R/B ratio for plants depends on plant species differences or genotypic differences between plant species. In lettuce, for example, leaf photosynthetic capacity and photosynthetic rate increase as the R/B ratio decreases, which correlates with changes in its stomatal conductance gs [46]. It has also been shown that lettuce growth rate decreases with increasing blue light intensity [47]. The results of this experiment showed that the height, fresh weight, total leaf area and dry weight of cucumber seedlings increased with increasing red light ratios, with optimum performance in the R:B = 7:3 treatment (Table 3). This is consistent with the results of Di Q et al. in aubergine seedlings, where photosynthetic efficiency was highest when PSI and PSII efficiencies were in equilibrium [48]. Wollaeger and Runkle [49] suggested that light quality is an important factor affecting photosynthetic pigments, with red light having a greater influence than other light qualities [50].
Prolonged exposure to a specific light environment alters plant leaf anatomy and thus affects plant photosynthesis [51,52], with increased leaf thickness and fenestra tissue cell length under blue light treatment compared to plants grown under red or green light [22,53]. Our experimental results showed that leaf fenestra tissue thickness and leaf upper epidermal thickness were significantly higher after low R/B treatment than high R/B, and that R:B = 9:1 treatment reduced fenestra tissue thickness by 44.43% compared to R:B = 1:9 treatment (Table 4). Jiao et al. suggested that red light could stimulate the conversion of photosensitive pigments to the Pfr form and was associated with phytochrome interacting factor 3 (PIF3) [22]. Excess PIF3 stimulates the expression of skotomorphogenesis genes, which act as negative regulators of photomorphogenesis and affect leaf development [54,55]. Therefore, as the R/B ratio decreases, the leaf thickness of cucumber seedlings shows a decreasing trend.
When performing plant photosynthetic measurements, a higher R/B ratio will result in a greater net photosynthetic rate when the trials light source is consistent with the ambient light source, as the quantum yield of red light is higher than that of blue light [56,57]. However, when the light source measured was either saturated or was of high light intensity and the light quality was consistent, the results would be different, with blue light stimulating the photoprotective ability of the plant. McCree [56] and Inada [57] showed that plants grown under monochromatic blue light compared to white light treatments had higher instantaneous photosynthetic rates when using mixed red and blue light sources as the measured light. The significant effect of blue and red light on leaf morphological anatomy and single leaf gas exchange may be due to differences in chloroplast structure and chloroplast accumulation within the cell chloroplasts [58]. Our results showed an increase in instantaneous photosynthetic efficiency under low R/B treatments, with a 70.49% increase in Pn for the R:B = 1:9 treatment compared to R:B = 9:1.
Light is not only a source of energy for photosynthesis but is also a key signal regulating the growth and development of multifaceted plants [59], and the development and opening and closing of stomata are influenced by the environment to which the plant is exposed [60]. The extent to which light quality affects stomatal development varies across species. Gitz et al. found that soybean leaves had a reduced number of stomata after UV-B irradiation, which was thought to improve drought tolerance and photosynthetic performance [59]. Barillot et al. found that blue light irradiation increased the stomatal density of tall fescue leaves and greatly increased their stomatal conductance [60]. Sander W. et al. showed that as the proportion of blue light increased, gsw increased with it, and that the larger gsw was due to more proximal stomata [61]. The results showed that leaf stomatal density was significantly reduced with an increasing percentage of red light, and it was significantly reduced by 45.75% in R:B = 9:1 treatment compared to that in the R:B = 1:9 treatment. This was also confirmed by RT-PCR validation of key genes for stomatal development. Plants with lower stomatal densities have larger leaf stomatal sizes; they also have lower transpiration, faster growth rates and higher biomass [19]. Our results are consistent with this trend, with greater cucumber biomass at high R/B and lower stomatal length and stomatal width at low R/B (Figure 3c,d). In contrast, plants with higher stomatal densities had no increase in biomass, but if these plants were in a state of rapidly changing environmental conditions, such as increased light, increased CO2 supply, and fluctuations in light, they would perform better [19]. Therefore, increasing the proportion of blue light added at the right time (e.g., in the morning) will result in greater photosynthetic products from cucumber seedlings.
The response of stomatal movement to light depends mainly on two signaling mechanisms, namely the red and blue light responses [24,25,26,27]. The red light-driven response of stomata is similar to the carbon assimilation response to increasing light intensity [28]. On the other hand, blue light-induced stomatal opening differs from the red light response in that it does not require the involvement of a chloroplast signal [41], and on a quantitative basis, the stomatal blue light response drives stomatal opening 20 times more efficiently than does red light [26,42]. We observed that the low R/B treatment had greater gsw under the same measured light as the ambient light and that it reached stability before the high R/B treatment.

5. Conclusions

In this work, it is the first time which is shown the rate of stomatal movement under mixed red and blue light. The effect of light quality on stomatal development was significant. Cucumber seedlings under low R/B had lower biomass than those treated with high R/B, but they had higher stomatal density, smaller stomatal size and responded faster than under high R/B. When R:B = 1:9, cucumber seedlings had the highest stomatal density and the fastest response rate. This will provide some reference for changing the light environment of plant seedlings to improve plant adaptability and photosynthetic potential.

Author Contributions

Conceptualization, X.L. and Z.Y.; methodology, X.L.; software, X.L.; validation, X.L., S.Z. and Y.Y.; formal analysis, G.Z.; investigation, X.L.; data curation, X.L.; writing—original draft preparation, X.L.; writing—review and editing, Y.W.; visualization, P.X. and A.L.; supervision, Z.Y.; project administration, Z.Y.; funding acquisition, Z.Y. All authors have read and agreed to the published version of the manuscript.

Funding

Shaanxi Provincial Technological Innovation Guiding Special Project (2021QFY08-02); Shaanxi Province 100 Billion Facility Agriculture Special Project in 2021; Key Technological Innovation and Integration of Facility Vegetables in the Tibetan Plateau (XZ202202YD0002C); Introduction of Famous Varieties of Facility Vegetables, Melons and Fruits and Construction of Standardised Demonstration Bases (QYXTZX-AL2023-07).

Conflicts of Interest

The authors declare no conflict of interest.

References

  1. Zeiger, E.; Farquhar, G.D.; Cowan, I.R. Stomatal Function; Stanford University Press: Redwood City, CA, 1987. [Google Scholar]
  2. Kollist, H.; Nuhkat, M.; Roelfsema, M.R. Closing gaps: Linking elements that control stomatal movement. New Phytol. 2014, 203, 44–62. [Google Scholar] [CrossRef] [PubMed]
  3. Naumburg, E.; Ellsworth, D.S. Photosynthetic sunfleck utilization potential of understory saplings growing under elevated CO2 in face. Oecologia 2000, 122, 163–174. [Google Scholar] [CrossRef]
  4. Lawson, T.; von Caemmerer, S.; Baroli, I. Photosynthesis and stomatal behaviour. Prog. Bot. 2010, 72, 265–304. [Google Scholar] [CrossRef]
  5. Matthews, J.S.A.; Vialet-Chabrand, S.R.M.; Lawson, T. Diurnal variation in gas exchange: The balance between Carbon Fixation and water loss. Plant Physiol. 2017, 174, 614–623. [Google Scholar] [CrossRef] [PubMed] [Green Version]
  6. Farquhar, G.D.; Sharkey, T.D. Stomatal conductance and photosynthesis. Annu. Rev. Plant Physiol. 1982, 33, 317–345. [Google Scholar] [CrossRef]
  7. Barradas, V.L.; Jones, H.G.; Clark, J.A. Stomatal responses to changing irradiance in Phaseolus vulgaris L. J. Exp. Bot. 1994, 45, 931–936. [Google Scholar] [CrossRef]
  8. Fischer, R.A.; Rees, D.; Sayre, K.D.; Lu, Z.-M.; Condon, A.G.; Saavedra, A.L. Wheat yield progress associated with higher stomatal conductance and photosynthetic rate, and cooler canopies. Crop Sci. 1998, 38, 1467–1475. [Google Scholar] [CrossRef]
  9. Wong, S.C.; Cowan, I.R.; Farquhar, G.D. Stomatal conductance correlates with photosynthetic capacity. Nature 1979, 282, 424–426. [Google Scholar] [CrossRef]
  10. Haworth, M.; Killi, D.; Materassi, A.; Raschi, A.; Centritto, M. Impaired stomatal control is associated with reduced photosynthetic physiology in crop species grown at elevated [CO2]. Front. Plant Sci. 2016, 7, 1568. [Google Scholar] [CrossRef] [Green Version]
  11. Sorrentino, G.; Haworth, M.; Wahbi, S.; Mahmood, T.; Zuomin, S.; Centritto, M. Abscisic acid induces rapid reductions in mesophyll conductance to carbon dioxide. PLoS ONE 2016, 11, e0148554. [Google Scholar] [CrossRef] [Green Version]
  12. Pillitteri, L.J.; Torii, K.U. Mechanisms of stomatal development. Annu. Rev. Plant Biol. 2012, 63, 591–614. [Google Scholar] [CrossRef] [PubMed] [Green Version]
  13. McAusland, L.; Vialet-Chabrand, S.; Davey, P.; Baker, N.R.; Brendel, O.; Lawson, T. Effects of kinetics of light-induced stomatal responses on photosynthesis and water-use efficiency. New Phytol. 2016, 211, 1209–1220. [Google Scholar] [CrossRef] [PubMed]
  14. Vialet-Chabrand, S.; Lawson, T. Dynamic Leaf Energy Balance: Deriving stomatal conductance from thermal imaging in a dynamic environment. J. Exp. Bot. 2019, 70, 2839–2855. [Google Scholar] [CrossRef] [Green Version]
  15. Raven, J.A. Speedy small stomata? J. Exp. Bot. 2014, 65, 1415–1424. [Google Scholar] [CrossRef] [PubMed] [Green Version]
  16. Drake, P.L.; Froend, R.H.; Franks, P.J. Smaller, faster stomata: Scaling of stomatal size, rate of response, and stomatal conductance. J. Exp. Bot. 2013, 64, 495–505. [Google Scholar] [CrossRef] [Green Version]
  17. Franks, P.J.; Farquhar, G.D. The mechanical diversity of stomata and its significance in gas-exchange control. Plant Physiol. 2006, 143, 78–87. [Google Scholar] [CrossRef] [Green Version]
  18. Caine, R.S.; Yin, X.; Sloan, J.; Harrison, E.L.; Mohammed, U.; Fulton, T.; Biswal, A.K.; Dionora, J.; Chater, C.C.; Coe, R.A.; et al. Rice with reduced stomatal density conserves water and has improved drought tolerance under future climate conditions. New Phytol. 2018, 221, 371–384. [Google Scholar] [CrossRef]
  19. Doheny-Adams, T.; Hunt, L.; Franks, P.J.; Beerling, D.J.; Gray, J.E. Genetic manipulation of stomatal density influences stomatal size, plant growth and tolerance to restricted water supply across a growth carbon dioxide gradient. Philos. Trans. R. Soc. B Biol. Sci. 2012, 367, 547–555. [Google Scholar] [CrossRef]
  20. Dutton, C.; Hõrak, H.; Hepworth, C.; Mitchell, A.; Ton, J.; Hunt, L.; Gray, J.E. Bacterial infection systemically suppresses stomatal density. Plant Cell Environ. 2019, 42, 2411–2421. [Google Scholar] [CrossRef] [Green Version]
  21. Tanaka, Y.; Sugano, S.S.; Shimada, T.; Hara-Nishimura, I. Enhancement of leaf photosynthetic capacity through increased stomatal density in Arabidopsis. New Phytol. 2013, 198, 757–764. [Google Scholar] [CrossRef]
  22. Jiao, Y.; Lau, O.S.; Deng, X.W. Light-regulated transcriptional networks in higher plants. Nat. Rev. Genet. 2007, 8, 217–230. [Google Scholar] [CrossRef] [PubMed]
  23. Wei, H.; Kong, D.; Yang, J.; Wang, H. Light regulation of stomatal development and patterning: Shifting the paradigm from Arabidopsis to grasses. Plant Commun. 2020, 1, 100030. [Google Scholar] [CrossRef]
  24. Assmann, S.M.; Shimazaki, K. The multisensory guard cell. stomatal responses to blue light and Abscisic Acid1. Plant Physiol. 1999, 119, 809–816. [Google Scholar] [CrossRef] [PubMed] [Green Version]
  25. Roelfsema, M.R.; Hedrich, R. In the light of stomatal opening: New insights into ‘The watergate’. New Phytol. 2005, 167, 665–691. [Google Scholar] [CrossRef]
  26. Shimazaki, K.; Doi, M.; Assmann, S.M.; Kinoshita, T. Light regulation of stomatal movement. Annu. Rev. Plant Biol. 2007, 58, 219–247. [Google Scholar] [CrossRef] [PubMed] [Green Version]
  27. Zeiger, E. The biology of stomatal guard cells. Annu. Rev. Plant Physiol. 1983, 34, 441–474. [Google Scholar] [CrossRef]
  28. Sharkey, T.D.; Raschke, K. Separation and measurement of direct and indirect effects of light on Stomata. Plant Physiol. 1981, 68, 33–40. [Google Scholar] [CrossRef] [Green Version]
  29. Hetherington, A. Faculty opinions recommendation of Arabidopsis HT1 kinase controls stomatal movements in response to CO2. Nat. Cell Biol. 2006, 8, 391–397. [Google Scholar] [CrossRef]
  30. Mott, K.A.; Sibbernsen, E.D.; Shope, J.C. The role of the mesophyll in stomatal responses to light and CO2. Plant Cell Environ. 2008, 31, 1299–1306. [Google Scholar] [CrossRef]
  31. Sibbernsen, E.; Mott, K.A. Stomatal responses to flooding of the intercellular air spaces suggest a vapor-phase signal between the mesophyll and the guard cells. Plant Physiol. 2010, 153, 1435–1442. [Google Scholar] [CrossRef] [Green Version]
  32. Mott, K.A.; Peak, D. Testing a vapour-phase model of stomatal responses to humidity. Plant Cell Environ. 2012, 36, 936–944. [Google Scholar] [CrossRef]
  33. Lu, P.; Outlaw, W.H., Jr.; Smith, B.G.; Freed, G.A. Plant, Cell, and Molecular Mechanisms of Abscisic-Acid Regulation of Stomatal Apertures. A New Mechanism for the Regulation of Stomatal-Aperture Size in Intact Leaves: Accumulation of Mesophyll-Derived Sucrose in the Guard-Cell Wall of Vicia Faba L; USDOE Office of Energy Research: Washington, DC, USA, 1996. [Google Scholar] [CrossRef] [Green Version]
  34. Outlaw, W.H., Jr. Integration of cellular and physiological functions of guard cells. Crit. Rev. Plant Sci. 2003, 22, 503–529. [Google Scholar] [CrossRef]
  35. Kang, Y.; Outlaw, W.H.; Andersen, P.C.; Fiore, G.B. Guard-cell apoplastic sucrose concentration ? A link between leaf photosynthesis and stomatal aperture size in the apoplastic phloem loader vicia faba L. Plant Cell Environ. 2007, 30, 551–558. [Google Scholar] [CrossRef]
  36. Lawson, T. The responses of guard and mesophyll cell photosynthesis to CO2, O2, light, and water stress in a range of species are similar. J. Exp. Bot. 2003, 54, 1743–1752. [Google Scholar] [CrossRef] [PubMed] [Green Version]
  37. Lawson, T.; Blatt, M.R. Stomatal size, speed, and responsiveness impact on photosynthesis and water use efficiency. Plant Physiol. 2014, 164, 1556–1570. [Google Scholar] [CrossRef]
  38. Lawson, T.; Simkin, A.J.; Kelly, G.; Granot, D. Mesophyll photosynthesis and guard cell metabolism impacts on stomatal behaviour. New Phytol. 2014, 203, 1064–1081. [Google Scholar] [CrossRef] [Green Version]
  39. Lawson, T.; Terashima, I.; Fujita, T.; Wang, Y. Coordination between photosynthesis and stomatal behavior. In The Leaf: A Platform for Performing Photosynthesis; Springer: Cham, Switzerland, 2018; pp. 141–161. [Google Scholar]
  40. Lawson, T. Guard cell photosynthesis and stomatal function. New Phytol. 2008, 181, 13–34. [Google Scholar] [CrossRef] [PubMed]
  41. Ando, E.; Kinoshita, T. Red light-induced phosphorylation of plasma membrane H+-atpase in stomatal guard cells. Plant Physiol. 2018, 178, 838–849. [Google Scholar] [CrossRef] [PubMed] [Green Version]
  42. Tominaga, M.; Kinoshita, T.; Shimazaki, K. Guard-cell chloroplasts provide ATP required for H+ pumping in the plasma membrane and stomatal opening. Plant Cell Physiol. 2001, 42, 795–802. [Google Scholar] [CrossRef] [PubMed] [Green Version]
  43. Karlsson, P.E. Blue Light Regulation of stomata in wheat seedlings. i. influence of red background illumination and initial conductance level. Physiol. Plant. 1986, 66, 202–206. [Google Scholar] [CrossRef]
  44. Chen, Y.H.; Hu, L.; Punta, M.; Bruni, R.; Hillerich, B. Homologue structure of the SLAC1 anion channel for closing stomata in leaves. Nature 2010, 467, 1074. [Google Scholar] [CrossRef] [PubMed] [Green Version]
  45. Yoshida, H.; Hikosaka, S.; Goto, E.; Takasuna, H.; Kudou, T. Effects of light quality and light period on flowering of everbearing strawberry in a closed plant production system. Acta Hortic. 2012, 956, 107–112. [Google Scholar] [CrossRef]
  46. Wang, J.; Lu, W.; Tong, Y.; Yang, Q. Leaf morphology, photosynthetic performance, chlorophyll fluorescence, stomatal development of lettuce (Lactuca sativa L.) exposed to different ratios of red light to Blue Light. Front. Plant Sci. 2016, 7, 250. [Google Scholar] [CrossRef] [PubMed] [Green Version]
  47. Son, K.-H.; Oh, M.-M. Leaf shape, growth, and antioxidant phenolic compounds of two lettuce cultivars grown under various combinations of blue and red light-emitting diodes. HortScience 2013, 48, 988–995. [Google Scholar] [CrossRef]
  48. Di, Q.; Li, J.; Du, Y.; Wei, M.; Shi, Q.; Li, Y.; Yang, F. Combination of red and blue lights improved the growth and development of eggplant (Solanum melongena L.) seedlings by regulating photosynthesis. J. Plant Growth Regul. 2020, 40, 1477–1492. [Google Scholar] [CrossRef]
  49. Wollaeger, H.M.; Runkle, E.S. Growth and acclimation of impatiens, salvia, petunia, and tomato seedlings to blue and red light. HortScience 2015, 50, 522–529. [Google Scholar] [CrossRef] [Green Version]
  50. Zheng, L.; Van Labeke, M.-C. Long-term effects of red- and blue-light emitting diodes on leaf anatomy and photosynthetic efficiency of three ornamental pot plants. Front. Plant Sci. 2017, 8, 917. [Google Scholar] [CrossRef] [Green Version]
  51. Boardman, N.K. Comparative photosynthesis of sun and shade plants. Annu. Rev. Plant Physiol. 1977, 28, 355–377. [Google Scholar] [CrossRef]
  52. Shengxin, C.; Chunxia, L.; Xuyang, Y.; Song, C.; Xuelei, J.; Xiaoying, L.; Zhigang, X.; Rongzhan, G. Morphological, photosynthetic, and physiological responses of rapeseed leaf to different combinations of red and blue lights at the Rosette Stage. Front. Plant Sci. 2016, 7, 1144. [Google Scholar] [CrossRef] [Green Version]
  53. Wang, X.Y.; Xu, X.M.; Cui, J. The importance of blue light for leaf area expansion, development of photosynthetic apparatus, and chloroplast ultrastructure of Cucumis sativus grown under weak light. Photosynthetica 2015, 53, 213–222. [Google Scholar] [CrossRef]
  54. Miao, Y.; Wang, X.; Gao, L.; Chen, Q.; Qu, M. Blue Light is more essential than red light for maintaining the activities of Photosystem II and I and photosynthetic electron transport capacity in cucumber leaves. J. Integr. Agric. 2016, 15, 87–100. [Google Scholar] [CrossRef] [Green Version]
  55. Monte, E.; Tepperman, J.M.; Al-Sady, B.; Kaczorowski, K.A.; Alonso, J.M.; Ecker, J.R.; Li, X.; Zhang, Y.; Quail, P.H. The phytochrome-interacting transcription factor, PIF3, acts early, selectively, and positively in light-induced chloroplast development. Proc. Natl. Acad. Sci. USA 2004, 101, 16091–16098. [Google Scholar] [CrossRef] [PubMed]
  56. McCree, K.J. The action spectrum, absorptance and quantum yield of photosynthesis in crop plants. Agric. Meteorol. 1971, 9, 191–216. [Google Scholar] [CrossRef]
  57. Inada, K. Action spectra for photosynthesis in higher plants. Plant Cell Physiol. 1976, 17, 355–365. [Google Scholar] [CrossRef]
  58. Izzo, L.G.; Mickens, M.A.; Aronne, G.; Gómez, C. Spectral effects of blue and red light on growth, anatomy, and physiology of lettuce. Physiol. Plant. 2021, 172, 2191–2202. [Google Scholar] [CrossRef]
  59. Gitziii, D.; Liugitz, L.; Britz, S.; Sullivan, J. Ultraviolet-B effects on stomatal density, water-use efficiency, and stable carbon isotope discrimination in four glasshouse-grown soybean cultivars. Environ. Exp. Bot. 2005, 53, 343–355. [Google Scholar] [CrossRef]
  60. Barillot, R.; Frak, E.; Combes, D.; Durand, J.-L.; Escobar-Gutiérrez, A.J. What determines the complex kinetics of stomatal conductance under blueless par in Festuca arundinacea? subsequent effects on leaf transpiration. J. Exp. Bot. 2010, 61, 2795–2806. [Google Scholar] [CrossRef] [Green Version]
  61. Hogewoning, S.W.; Trouwborst, G.; Maljaars, H.; Poorter, H.; van Ieperen, W.; Harbinson, J. Blue light dose-responses of leaf photosynthesis, morphology, and chemical composition of Cucumis sativus grown under different combinations of red and blue light. J. Exp. Bot. 2010, 61, 3107–3117. [Google Scholar] [CrossRef]
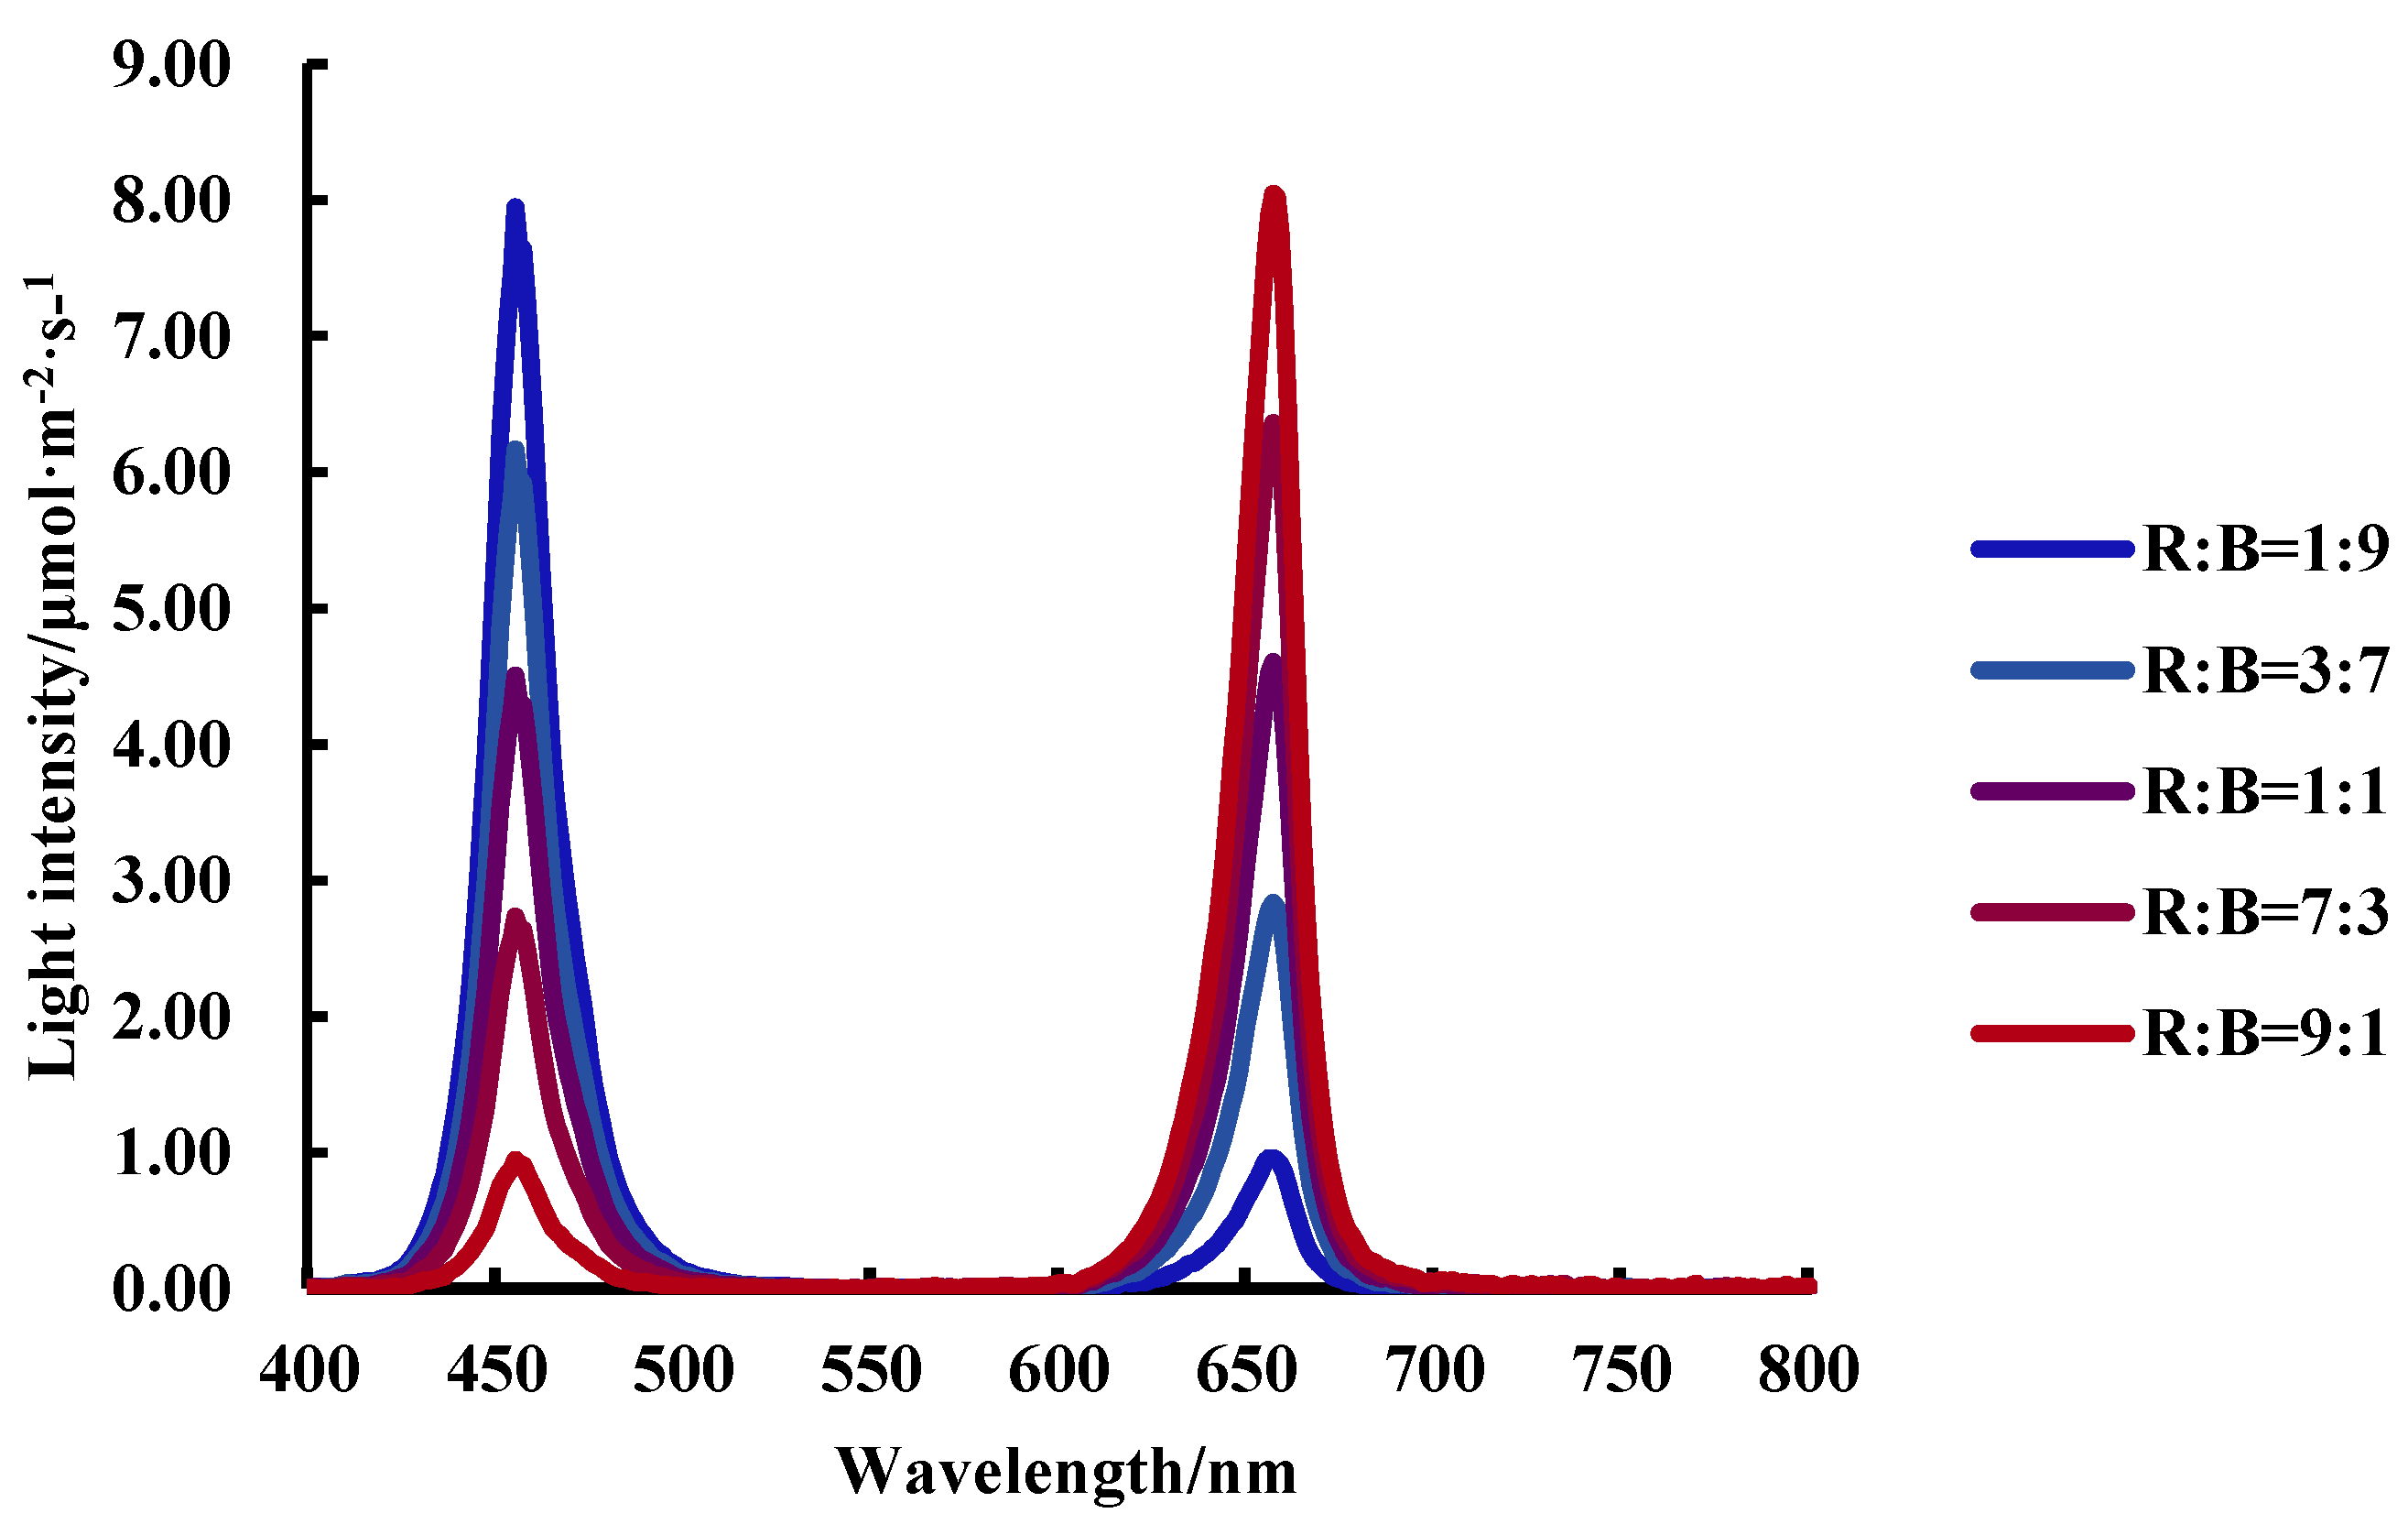
Figure 1. Spectrograms of different scales of processing.
Agronomy 13 01941 g001
Figure 2. Effect on photosynthetic properties: (a) effect of transpiration rate (E) between treatments; (b) effect of net photosynthetic rate (Pn) between treatments; (c) effect of intercellular CO2 (Ci) between treatments; (d) effect of stomatal conductance (gsw) between treatments. Note: In the same figure, different letters represent significant differences (p < 0.05) and the same letters represent insignificant differences (p > 0.05).
Agronomy 13 01941 g002
Figure 3. Effect on stomatal characteristics: (a) effect of different treatments on stomatal pore length; (b) effect of different treatments on stomatal pore width; (c) effect of different treatments on stomatal pore length; (d) effect of different treatments on stomatal pore width; (e) effect of different treatments on stomatal pore area; (f) effect of different treatments on stomatal pore density. Note: In the same figure, different letters represent significant differences (p < 0.05) and the same letters represent insignificant differences (p > 0.05).
Agronomy 13 01941 g003
Figure 4. Effect on stomatal dynamics: (a) effect of different treatments on stomatal conductance; (b) effect of different treatments on net photosynthetic rate (each curve is the mean of the curves for 5−7 plants). Note: grey boxes represent plants in darkness, white boxes represent light conditions.
Agronomy 13 01941 g004
Figure 5. Stomatal movement response curve (stomatal opening) fitted: (a) plot of fitted curve of stomatal opening section; (b) plot of curvature of stomatal opening curve.
Agronomy 13 01941 g005
Figure 6. Different red and blue light ratios on stomatal development and motility genes: (a) effect of different treatments on the relative expression of CsaV3_1G006250; (b) effect of different treatments on the relative expression of SLAC1.
Agronomy 13 01941 g006
Table 1. Intensity of red light, blue light and green light under different treatments.
TreatmentsRed Light
(μmol·m−2·s−1)
Blue Light
(μmol·m−2·s−1)
R:BPAR (μmol·m−2·s−1)
R:B = 1:9201801:9200
R:B = 3:7601403:7200
R:B = 1:11001001:1200
R:B = 7:3140607:3200
R:B = 9:1180209:1200
Table 2. Primers are used for RT-PCR detection.
GeneForward PrimerReverse Primer
Action5′-CACCAAGCCCAAGAAGATC-3′5′-TAAACCTAATCACCACCAGC-3′
CsaV3_1G0062505′-CAGTGCCTACTGAATCAAGCGACTC-3′5′-GTAGGTACTGCCACGATTGGATGG-3′
SLAC15′-CTCGGCCAACAATGACATCAGC-3′5′-CAAACCCGTTTCCAGCGACATC-3′
Table 3. Effects on morphological indices of cucumber seedlings.
TreatmentsPlant Height
(cm)
Stem Diameter
(mm)
Total Leaf Area
(cm2)
Fresh Weight
(g)
Dry Weight
(g)
R:B = 1:916.020 ± 1.260 d6.320 ± 1.005 a492.935 ± 34.325 c18.624 ± 2.804 c1.644 ± 0.162 a
R:B = 3:717.270 ± 0.610 d5.960 ± 1.109 a557.733 ± 54.466 b20.910 ± 0.595 bc1.818 ± 0.170 a
R:B = 1:120.320 ± 1.850 bc5.457 ± 1.22 a606.001 ± 12.166 ab22.095 ± 1.780 bc1.954 ± 0.136 a
R:B = 7:332.900 ± 3.310 a6.230 ± 1.017 a638.663 ± 15.177 a27.610 ± 0.690 a2.005 ± 0.035 a
R:B = 9:132.300 ± 1.630 a6.143 ± 1.289 a629.950 ± 30.9701 a23.731 ± 1.982 b1.820 ± 0.099 a
Note: Within the same column, different letters represent significant differences (p < 0.05), while the same letters represent no significant differences (p > 0.05).
Table 4. Effects on structural parameters of cucumber seedling leaves.
TreatmentsUpper Epidermis
(μm)
Palisade Tissue
(μm)
Spongy Tissue
(μm)
Inferior Epidermis
(μm)
Blade Thickness
(μm)
R:B = 1:915.72 ± 0.905 a69.001 ± 1.491 a88.87 ± 5.443 ab8.941 ± 0.547 a188.964 ± 5.731 a
R:B = 3:713.148 ± 1.026 b52.214 ± 1.488 bc92.196 ± 3.804 a8.27 ± 0.738 a182.772 ± 13.120 a
R:B = 1:18.854 ± 0.570 c48.845 ± 1.542 c78.079 ± 2.331 c7.773 ± 0.412 b150.424 ± 2.823 bc
R:B = 7:39.895 ± 0.771 c50.707 ± 2.333 bc83.172 ± 2.992 ab8.154 ± 0.515 a155.673 ± 4.864 b
R:B = 9:19.357 ± 0.462 c38.347 ± 1.946 d75.621 ± 3.500 c5.716 ± 0.341 c136.028 ± 4.725 c
Note: Within the same column, different letters represent significant differences (p < 0.05), while the same letters represent no significant differences (p > 0.05).
Table 5. Stomatal ringing curve parameters related to the stomatal opening section.
TreatmentskiSlmaxGsmaxr0
R:B = 1:9225.7810.2210.124
R:B = 3:7206.0040.2090.099
R:B = 1:1266.4610.1990.108
R:B = 7:3256.1850.1880.097
R:B = 9:1307.1110.1890.102
Disclaimer/Publisher’s Note: The statements, opinions and data contained in all publications are solely those of the individual author(s) and contributor(s) and not of MDPI and/or the editor(s). MDPI and/or the editor(s) disclaim responsibility for any injury to people or property resulting from any ideas, methods, instructions or products referred to in the content.