Article

A Visual Method of Hydroponic Lettuces Height and Leaves Expansion Size Measurement for Intelligent Harvesting

College of Agricultural Equipment Engineering, Henan University of Science and Technology, Luoyang 471003, China
*
Author to whom correspondence should be addressed.
Agronomy 2023, 13(8), 1996; https://doi.org/10.3390/agronomy13081996
Submission received: 30 June 2023 / Revised: 25 July 2023 / Accepted: 26 July 2023 / Published: 27 July 2023

Abstract

:
Harvesting is an important procedure for hydroponic lettuces in plant factories. At present, hydroponic lettuces are mainly harvested manually, and the key difficulty in mechanical harvesting is reducing the occurrence of leaf injury. Measuring the size of hydroponic lettuces using the image processing method and intelligently adjusting the operating parameters of the harvesting device are the foundation of high-quality harvesting for lettuces. The overlapped leaves of adjacent hydroponic lettuces cause difficulties in measuring lettuce size, especially the leaves expansion size. Therefore, we proposed an image processing method for measuring lettuce height and leaves expansion size according to the upper contour feature of lettuces and an image included three lettuces. Firstly, the upper contours of the lettuces were extracted and segmented via image preprocessing. Secondly, lettuce height was measured according to the maximum ordinate of the contour. Lastly, the lettuce’s upper contour was fitted to a function to measure the leaves expansion size. The measurement results showed that the maximal relative error of the lettuce height measurements was 5.58%, and the average was 2.14%. The effect of the quadratic function in fitting the upper contour was the best compared with the cubic function and sine function. The maximal relative error of the leaves expansion size measurements was 8.59%, and the average was 4.03%. According to the results of the lettuce height and leaves expansion size measurements, the grabbing parameters of each lettuce were intelligently adjusted to verify the harvesting effect. The harvesting success rates of lettuces was above 90%, and the injured leaves areas of the left, middle, and right lettuces in each image were 192.6 mm2, 228.1 mm2, and 205.6 mm2, respectively. This paper provides a reference for the design and improvement of intelligent harvesters for hydroponic lettuces.

1. Introduction

Hydroponic lettuce is the main cultivated crop in plant factories in China [1,2]. At present, hydroponic lettuces are mainly harvested manually, which is time-consuming and laborious [3,4]. The delicate leaves of hydroponic lettuces are easily injured during mechanical harvesting, and the variation in plant size can influence the harvesting success rate [5]. A good way to improve harvesting quality is by adjusting the harvesting parameters intelligently, and machine vision technologies such as image processing are widely utilized for plant size measurement [6].
The collection of crop characteristic information is a precondition for the intelligent operation of agricultural equipment. Currently, machine vision technology is widely used to detect the phenotypic parameters of crops [7,8,9]. Machine vision technology mainly focuses on 3D point cloud and 2D planar imaging [10,11]. A 3D point cloud obtains the coordinates of targets through high-precision equipment, such as depth cameras and lidar, which have the advantage of being free from perspective distortions [12,13,14]. Currently, studies on the measurement of the phenotypic parameters of lettuces mainly focus on the volume [15], height, diameter, and leaf area [16] of a single lettuce, and there are few studies on those of multiple lettuces. To measure the height and diameter of lettuce, Hu et al. [15] and Zhang et al. [16] obtained point cloud information using depth cameras, and the measurement accuracies were 97.42% and 93.70%, respectively. Anna et al. [17] combined 3D imaging and deep learning to measure the overall coverage rate and average height of massive lettuces, but the sizes of every lettuce were unclear. Overall, the research on detecting the phenotypic parameters of each lettuce simultaneously amongst multiple lettuces is still deficient. Compared to 3D point clouds, 2D imaging has a faster processing speed and lower equipment costs [18], but image distortion is a problem for 2D imaging, which can be corrected through calibration [19]. Two-dimensional imaging devices have been widely used to measure basic shape characteristics, including plant height, stem-base width, leaf length, and leaf width. In a study of the phenotypic parameters of rice seedlings [20,21,22,23], Li et al. [24] proposed a measurement method for stem-base width and height based on the 2D images of rice seedlings. The R2 value of the stem-base width and height were 0.9832 and 0.9796, respectively. Gupta et al. [25] used image processing algorithms to segment 2D images of chili plants, and the height and width of the chili plants were measured using a minimum bounding rectangle, which had a good effect on the measurements in both static and field conditions. Liao et al. [26] used an ellipse-fitting algorithm to process 2D images of potatoes. They measured the long and short axes of the potatoes by setting correction factors, and the relative error was less than 4%. The above studies used 2D imaging technology to measure the basic shape characteristics of crops, which ensured good measurement accuracy and fast processing speed. The measurement of lettuce height and leaves expansion size is key to intelligent harvesting equipment for hydroponic lettuces [27]. Therefore, the use of 2D imaging equipment to measure the height and leaves expansion size of multiple lettuces has significant advantages.
The end effector is an important component of intelligent harvesters [28], and its function is to clamp onto target objects by grabbing or picking. To reduce the injury of fruit and vegetables during harvesting, flexible end effectors have been used to harvest apple, tomato [29], and mango [30]. Goulart et al. [30] used six flexible fingers to fully wrap mangoes in order to reduce their damage during harvesting. These end effectors were suitable for harvesting spherical fruits or vegetables. While the leaves of hydroponic lettuces were scattered without being knotted, the above effectors were not suitable for harvesting lettuces. Ma et al. [27] proposed a flexible harvesting method for a single hydroponic lettuce. They used four pneumatic flexible fingers to grab the lettuce, and the height ratio and circumference ratio were optimized to reduce leaf injury. In actual production, hydroponic lettuces are cultivated adjacently, and the leaves of adjacent lettuces overlap. It is difficult to measure the size of continuous hydroponic lettuces for flexible harvesting.
To measure the sizes of multiple lettuces accurately and realize the high-quality harvesting of lettuces, we studied a visual measuring method for the lettuce height and leaves expansion size of continuous hydroponic lettuce for flexible harvesting and verified its harvesting effect using a flexible harvesting device.

2. Materials and Device for the Experiments

2.1. Experimental Materials

The Naiyou variety of hydroponic lettuce (Figure 1), which is widely cultivated in Chinese plant factories, was used in the experiment. The hydroponic lettuces were purchased from Xutian Photoelectric Co., Ltd. (Xi’an, China). The average values of the lettuce height and leaves expansion size were 86.3 mm and 225.5 mm, respectively. The hydroponic lettuces were mostly cultivated in single rows, and the distance between adjacent lettuces was 160 mm; thus, the leaves of adjacent lettuces were in an overlapping state (Figure 1b). It was difficult to measure the leaves expansion size of the lettuces directly. In order to explore the visual measuring method for continuous lettuce size measurement in intelligent harvesting, the front view of the hydroponic lettuces (Figure 1a) was selected as the image acquisition perspective in this study. Every image included three lettuces (Figure 1).

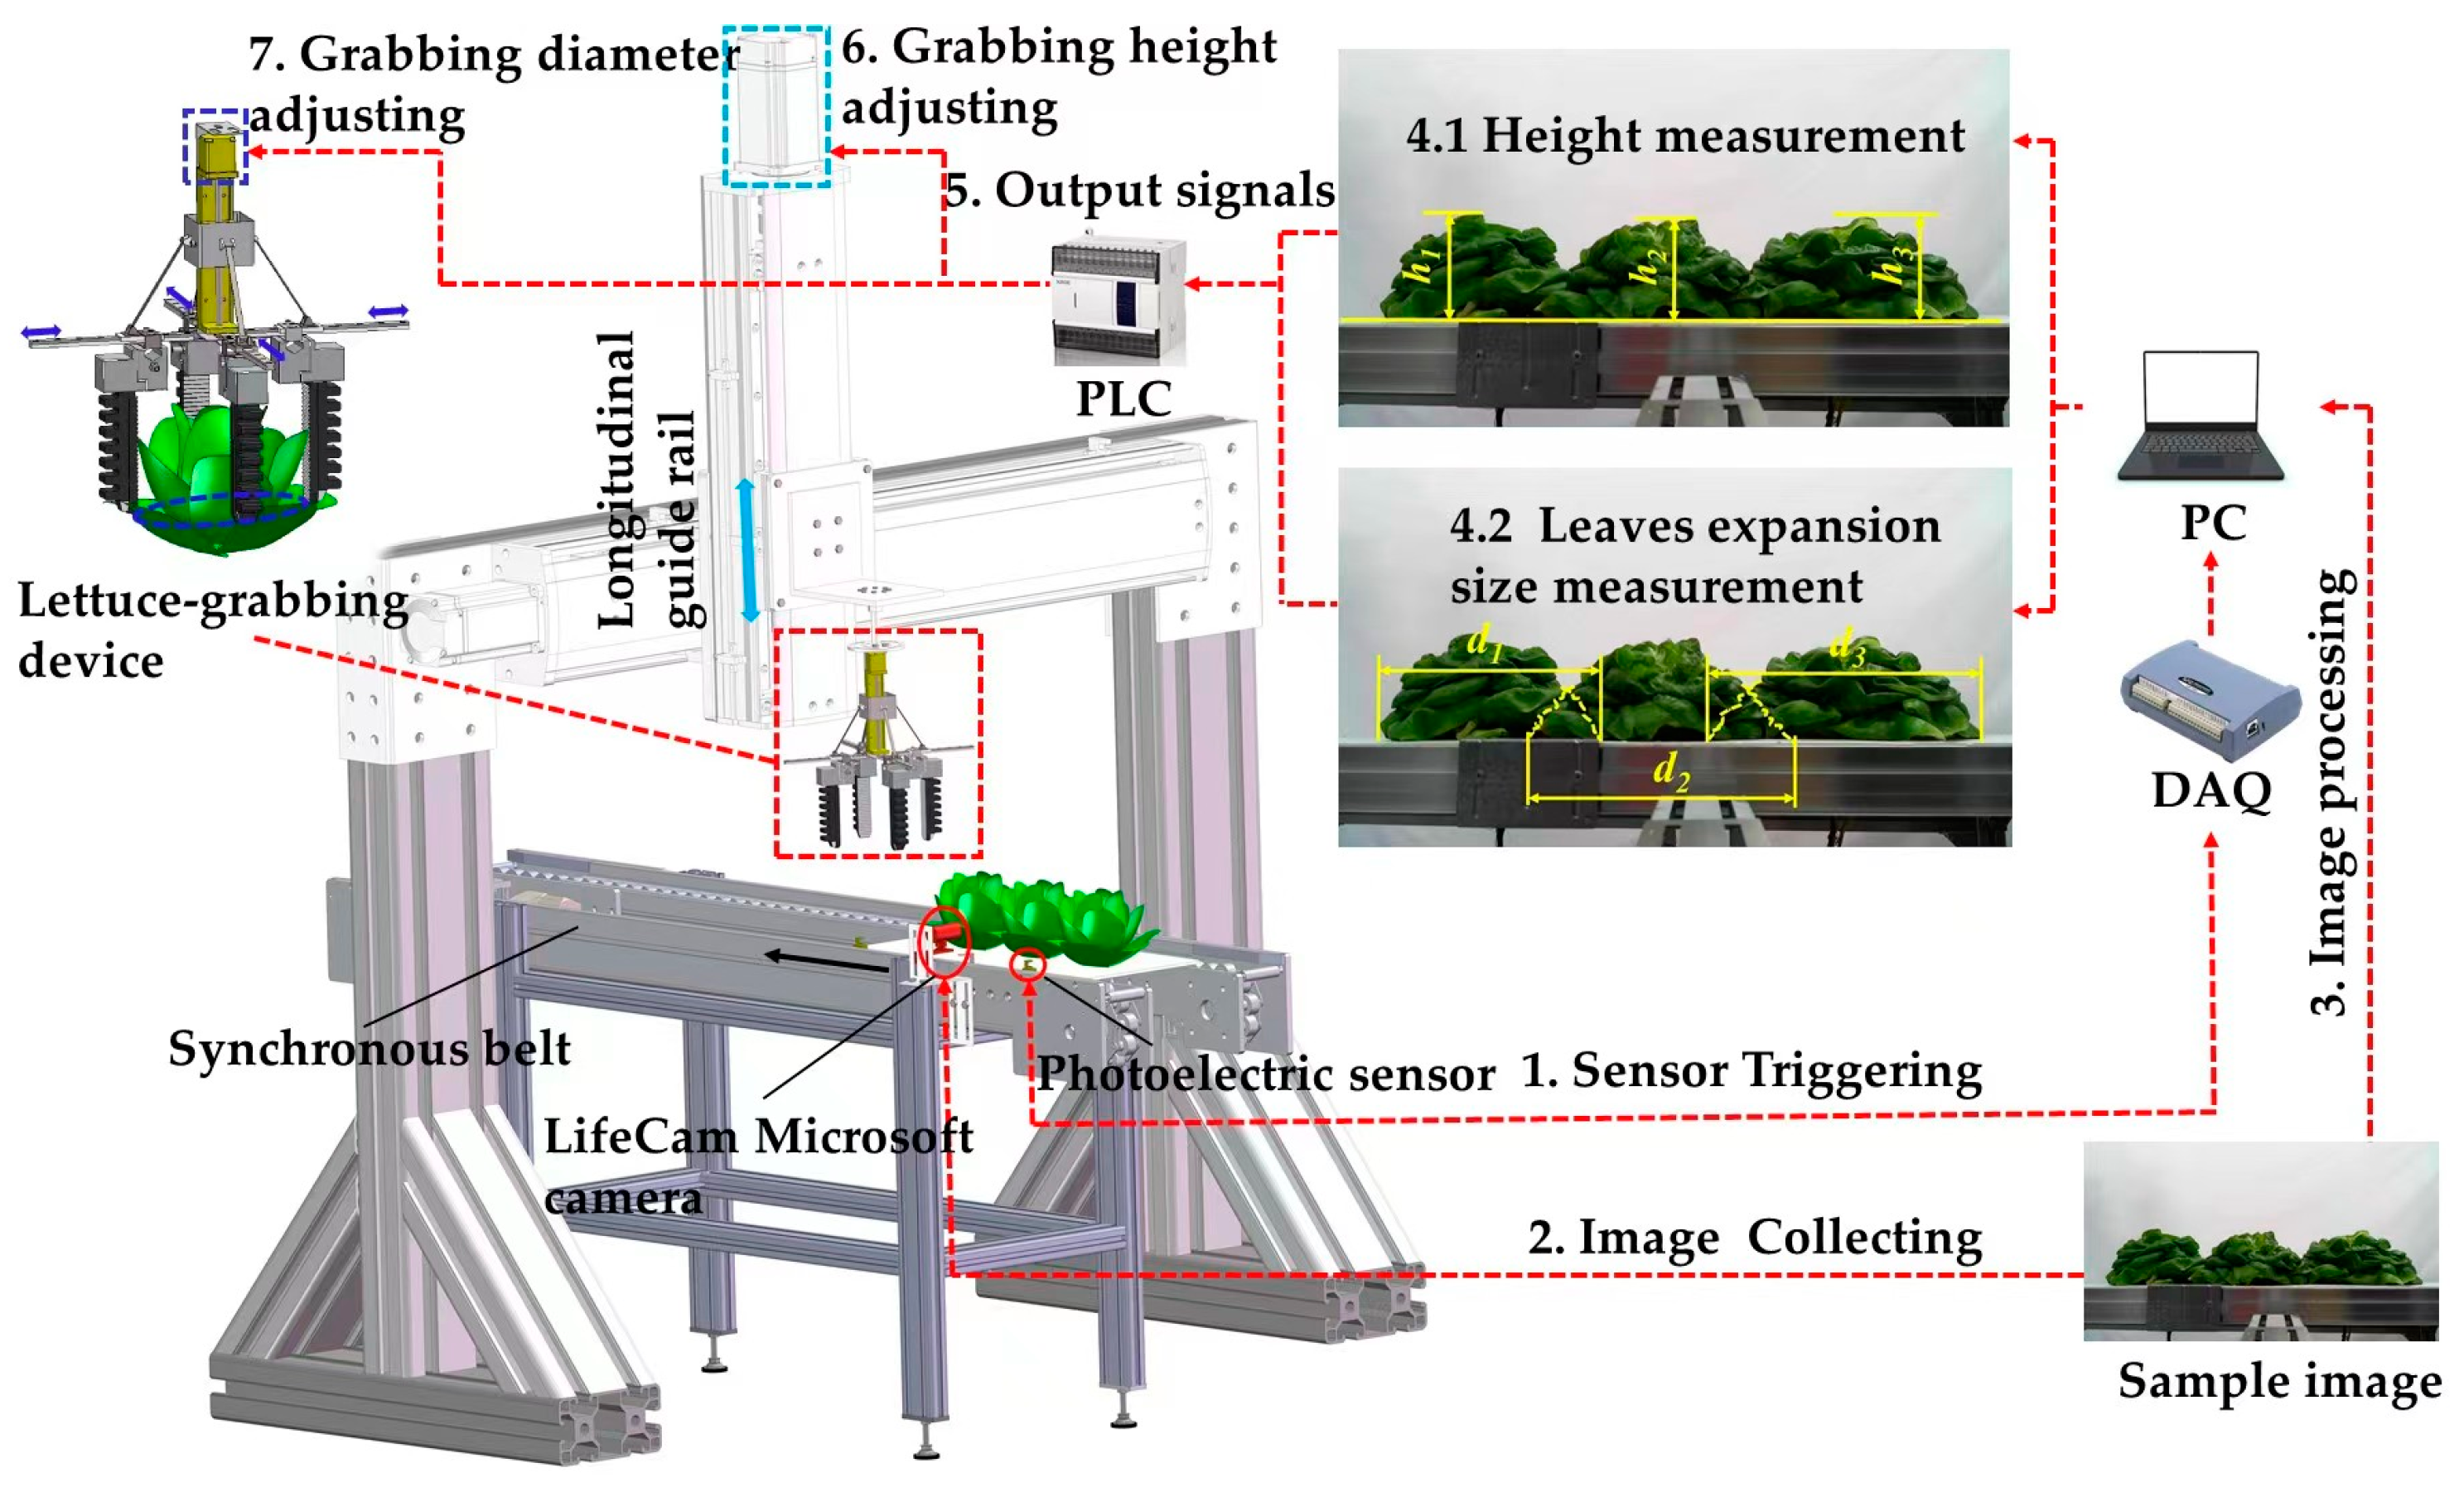
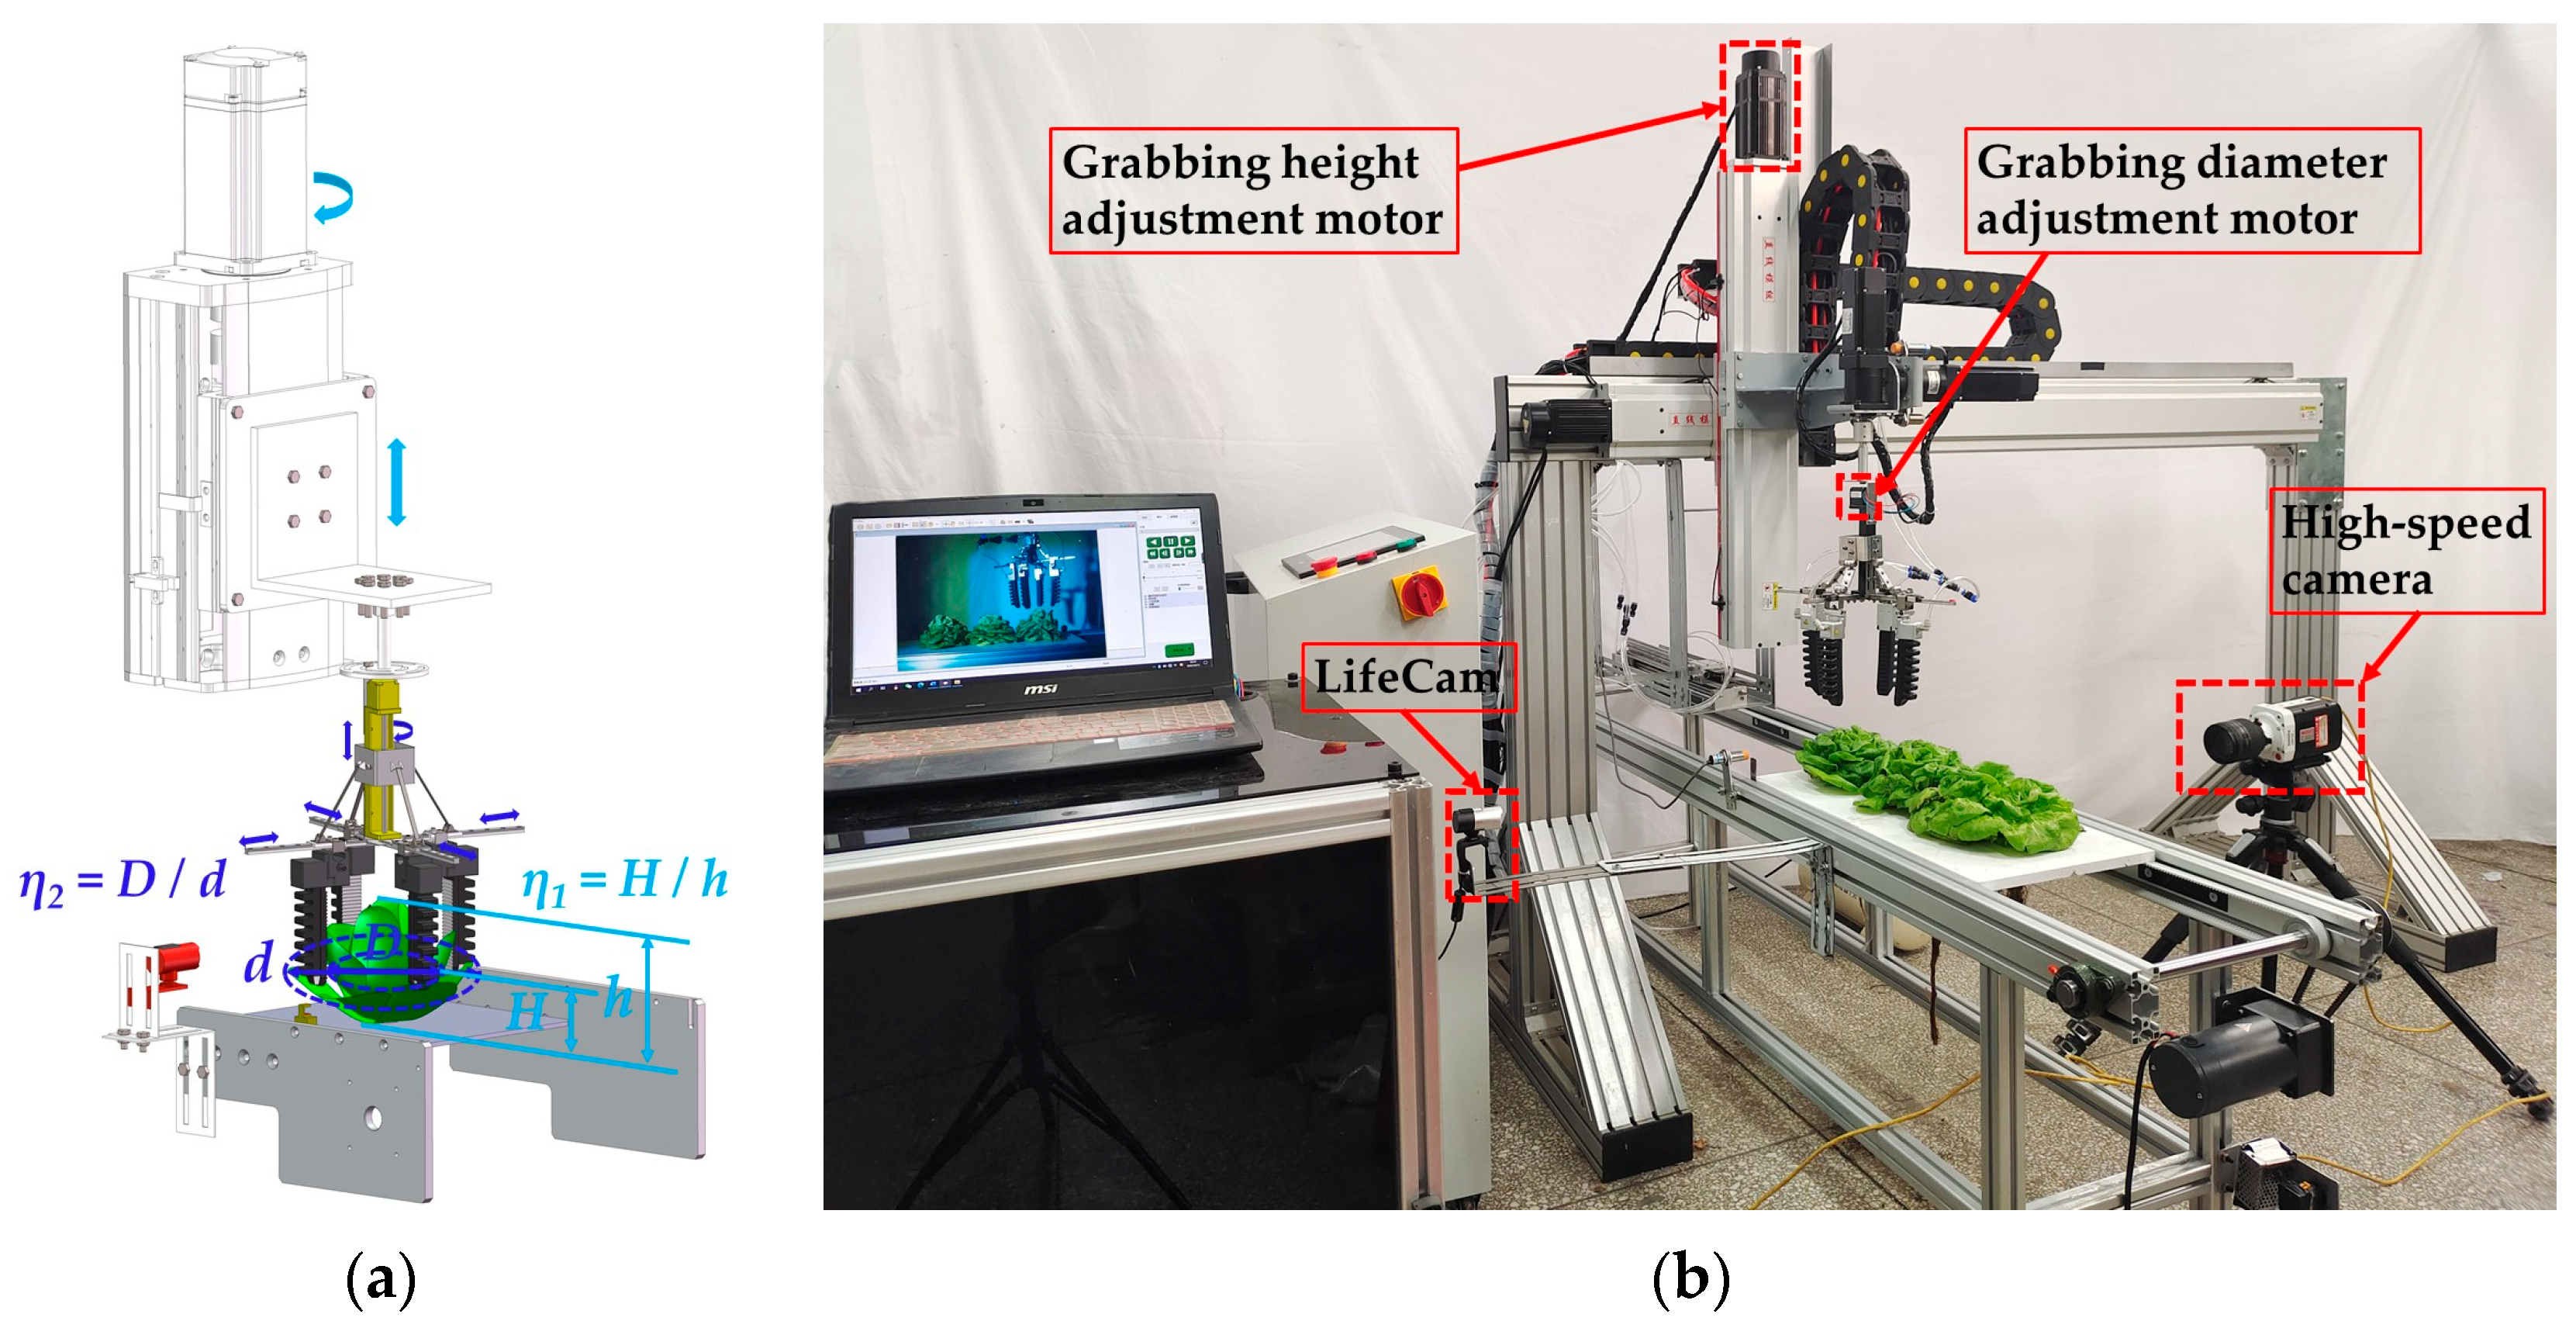
2.2. Experimental Device

Figure 2 shows the intelligent and continuous harvesting device for hydroponic lettuces. The device was mainly composed of a Microsoft LifeCam camera, a flexible lettuce-grabbing device, and a control system. The control system consisted of a personal computer (PC, MSI GL62M), a 16-channel data acquisition card (DAQ card, USB-1608GX-2AO, Measurement Computing Corporation, Norton, MA, USA), a programmable logic controller (PLC, XINJE-XD5-32T4-E, Wuxi Xinjie Electric Co., Ltd., Wuxi, China), and a photoelectric sensor (MT-J12-D15NK, Zhejiang BAK Electric Co., Ltd., Wenzhou, China). The software Python3.8 and PyCharm2021.2 were downloaded on the PC for image processing. The working steps of the harvesting device are shown in Figure 2. Firstly, the hydroponic lettuces were detected by the photoelectric sensor, and the camera was prompted by the PC to acquire the original image. Secondly, the size information of all the lettuces was obtained through image processing (lettuce height and leaves expansion size), and the sizes were sent to the PLC through the RS232 serial port. Lastly, the parameters of longitudinal manipulator and lettuce-grabbing device were adjusted by the PLC for flexible harvesting.
Figure 3 shows the process of size measurement and intelligent control for lettuce harvesting. Firstly, the original image was preprocessed via region of interest (ROI) extraction, binarization, etc., to obtain the upper contour of the hydroponic lettuces. Secondly, the height and leaves expansion size of all the lettuces were calculated according to the upper contour. Lastly, the longitudinal manipulator was used to adjust the grabbing diameter, and the lettuce-grabbing device was used to adjust the grabbing height according to the visual measuring results. The height ratio η1 and circumference ratio η2 of the grabbing device were 0.55 and 0.76 [27], respectively, as shown in Figure 3.

3. Experimental Method

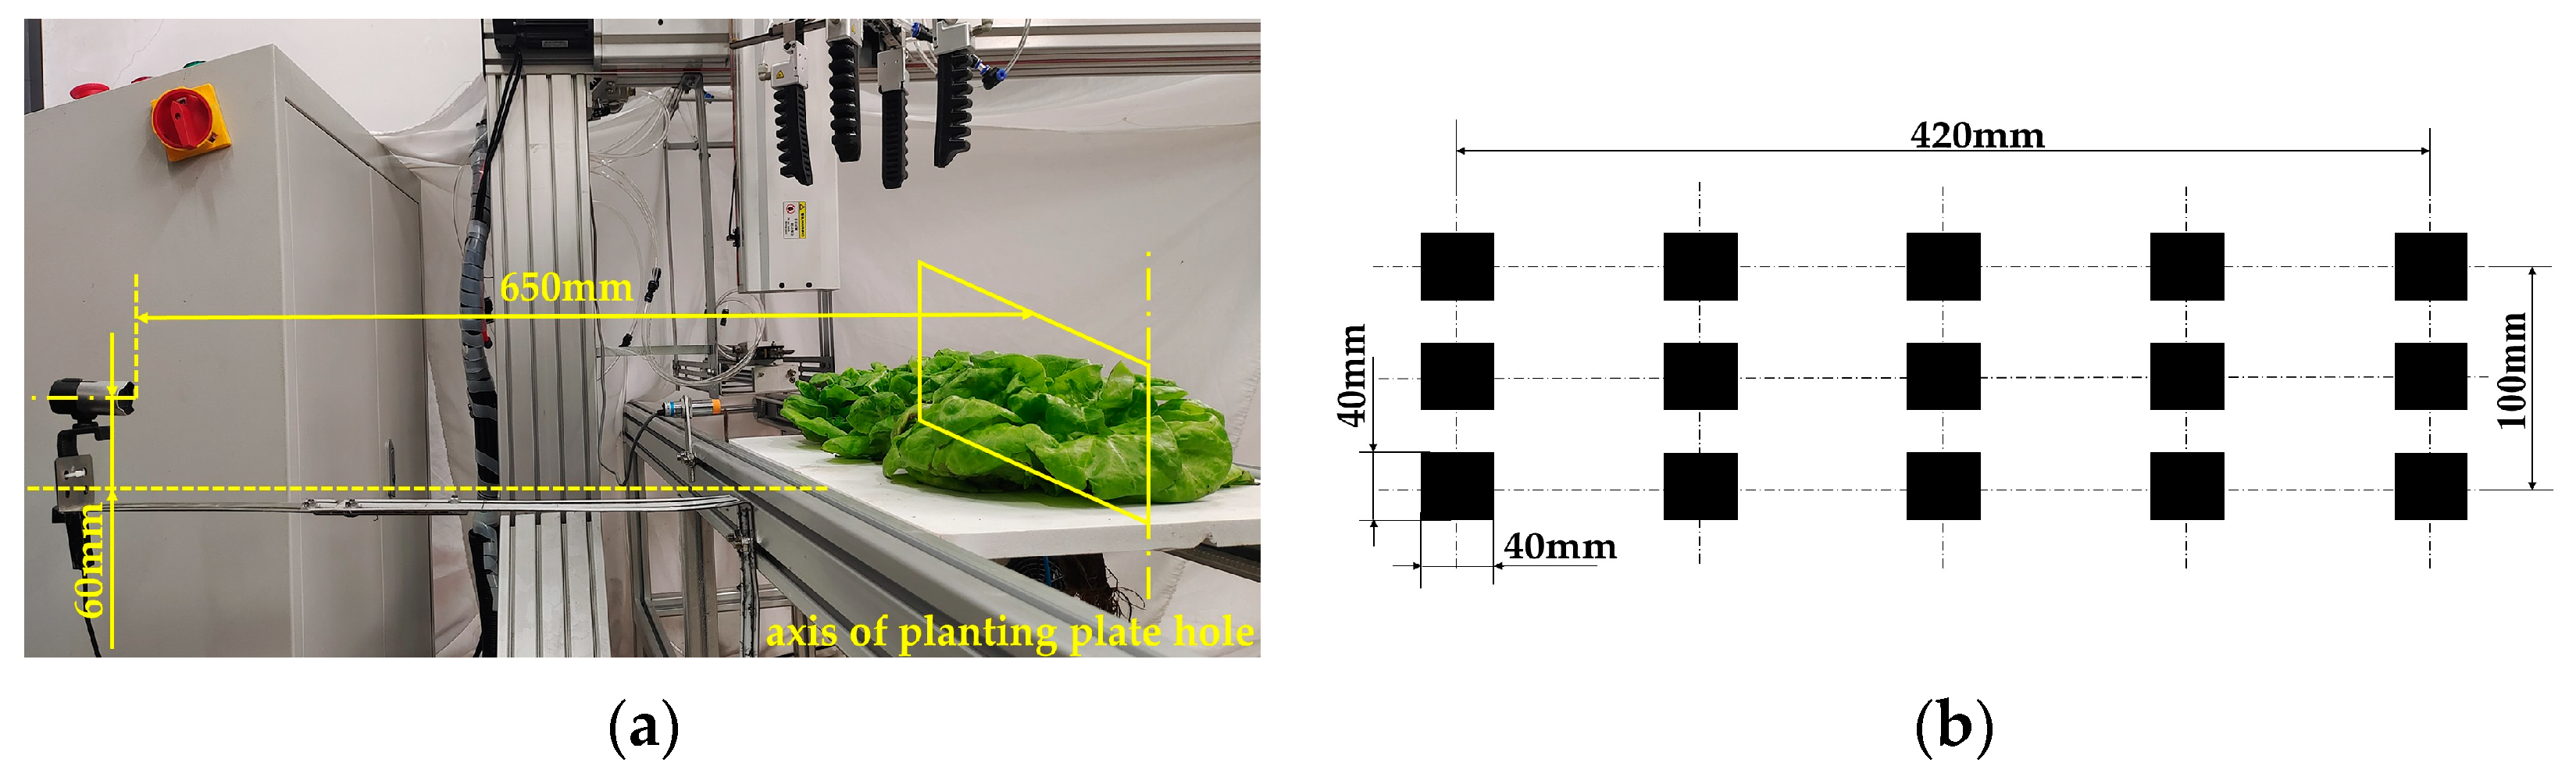
3.1. Image Acquisition and Calibration

Figure 4 shows the image acquisition system. To collect the image of all three lettuces, the horizontal distance between the camera and planting hole was set to 650 mm, and the vertical distance between the camera and planting plate was set to 60 mm (Figure 4a). The acquired image pixel size was 1920 × 1080. Fifteen calibration units were located in the axis of the planting plate hole to calibrate the acquired images (Figure 4b). The calibration results showed that the width of one pixel was 0.27 mm; therefore, the scaling factor K was set as 0.27 mm/pixel in this study.

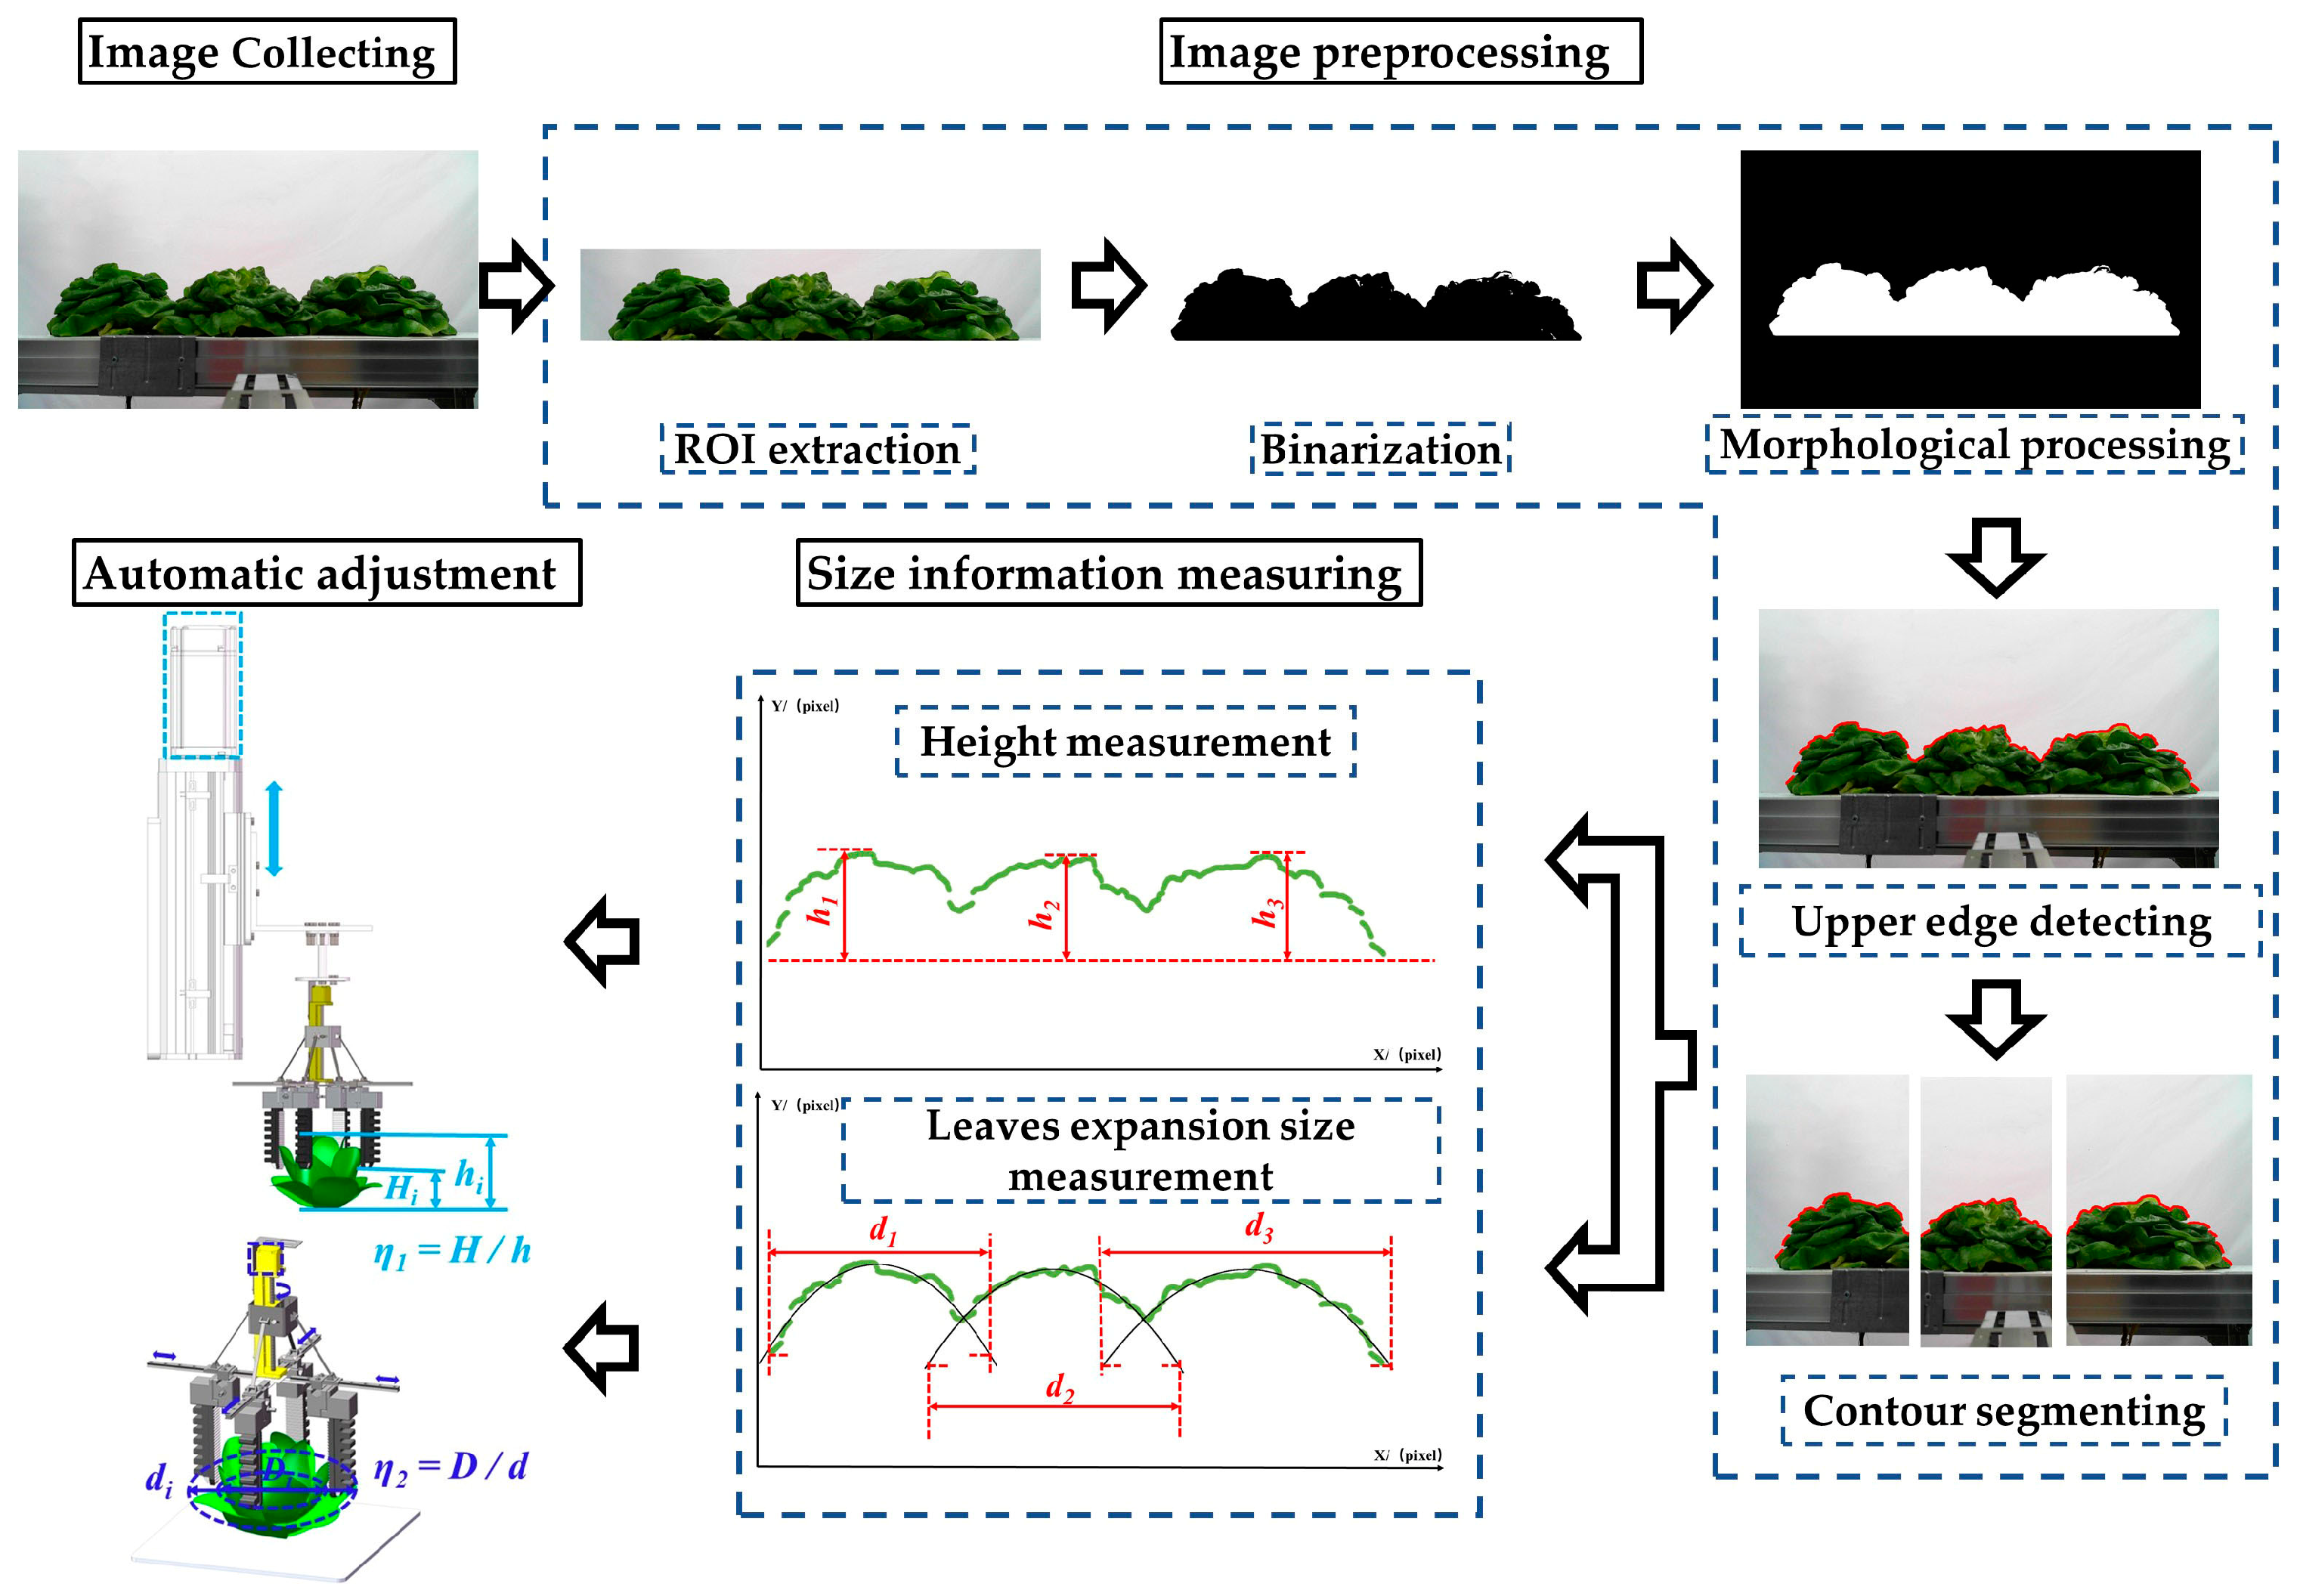
3.2. Image Preprocessing

The original image (Figure 5a) included the foreground (three lettuces) and background (the conveyor belt and colonization plate). To reduce the measuring error of the lettuce height and leaves expansion size, it was necessary to preprocess the original images. The preprocessing procedure mainly included image foreground extraction, upper contour detection, and segmentation.

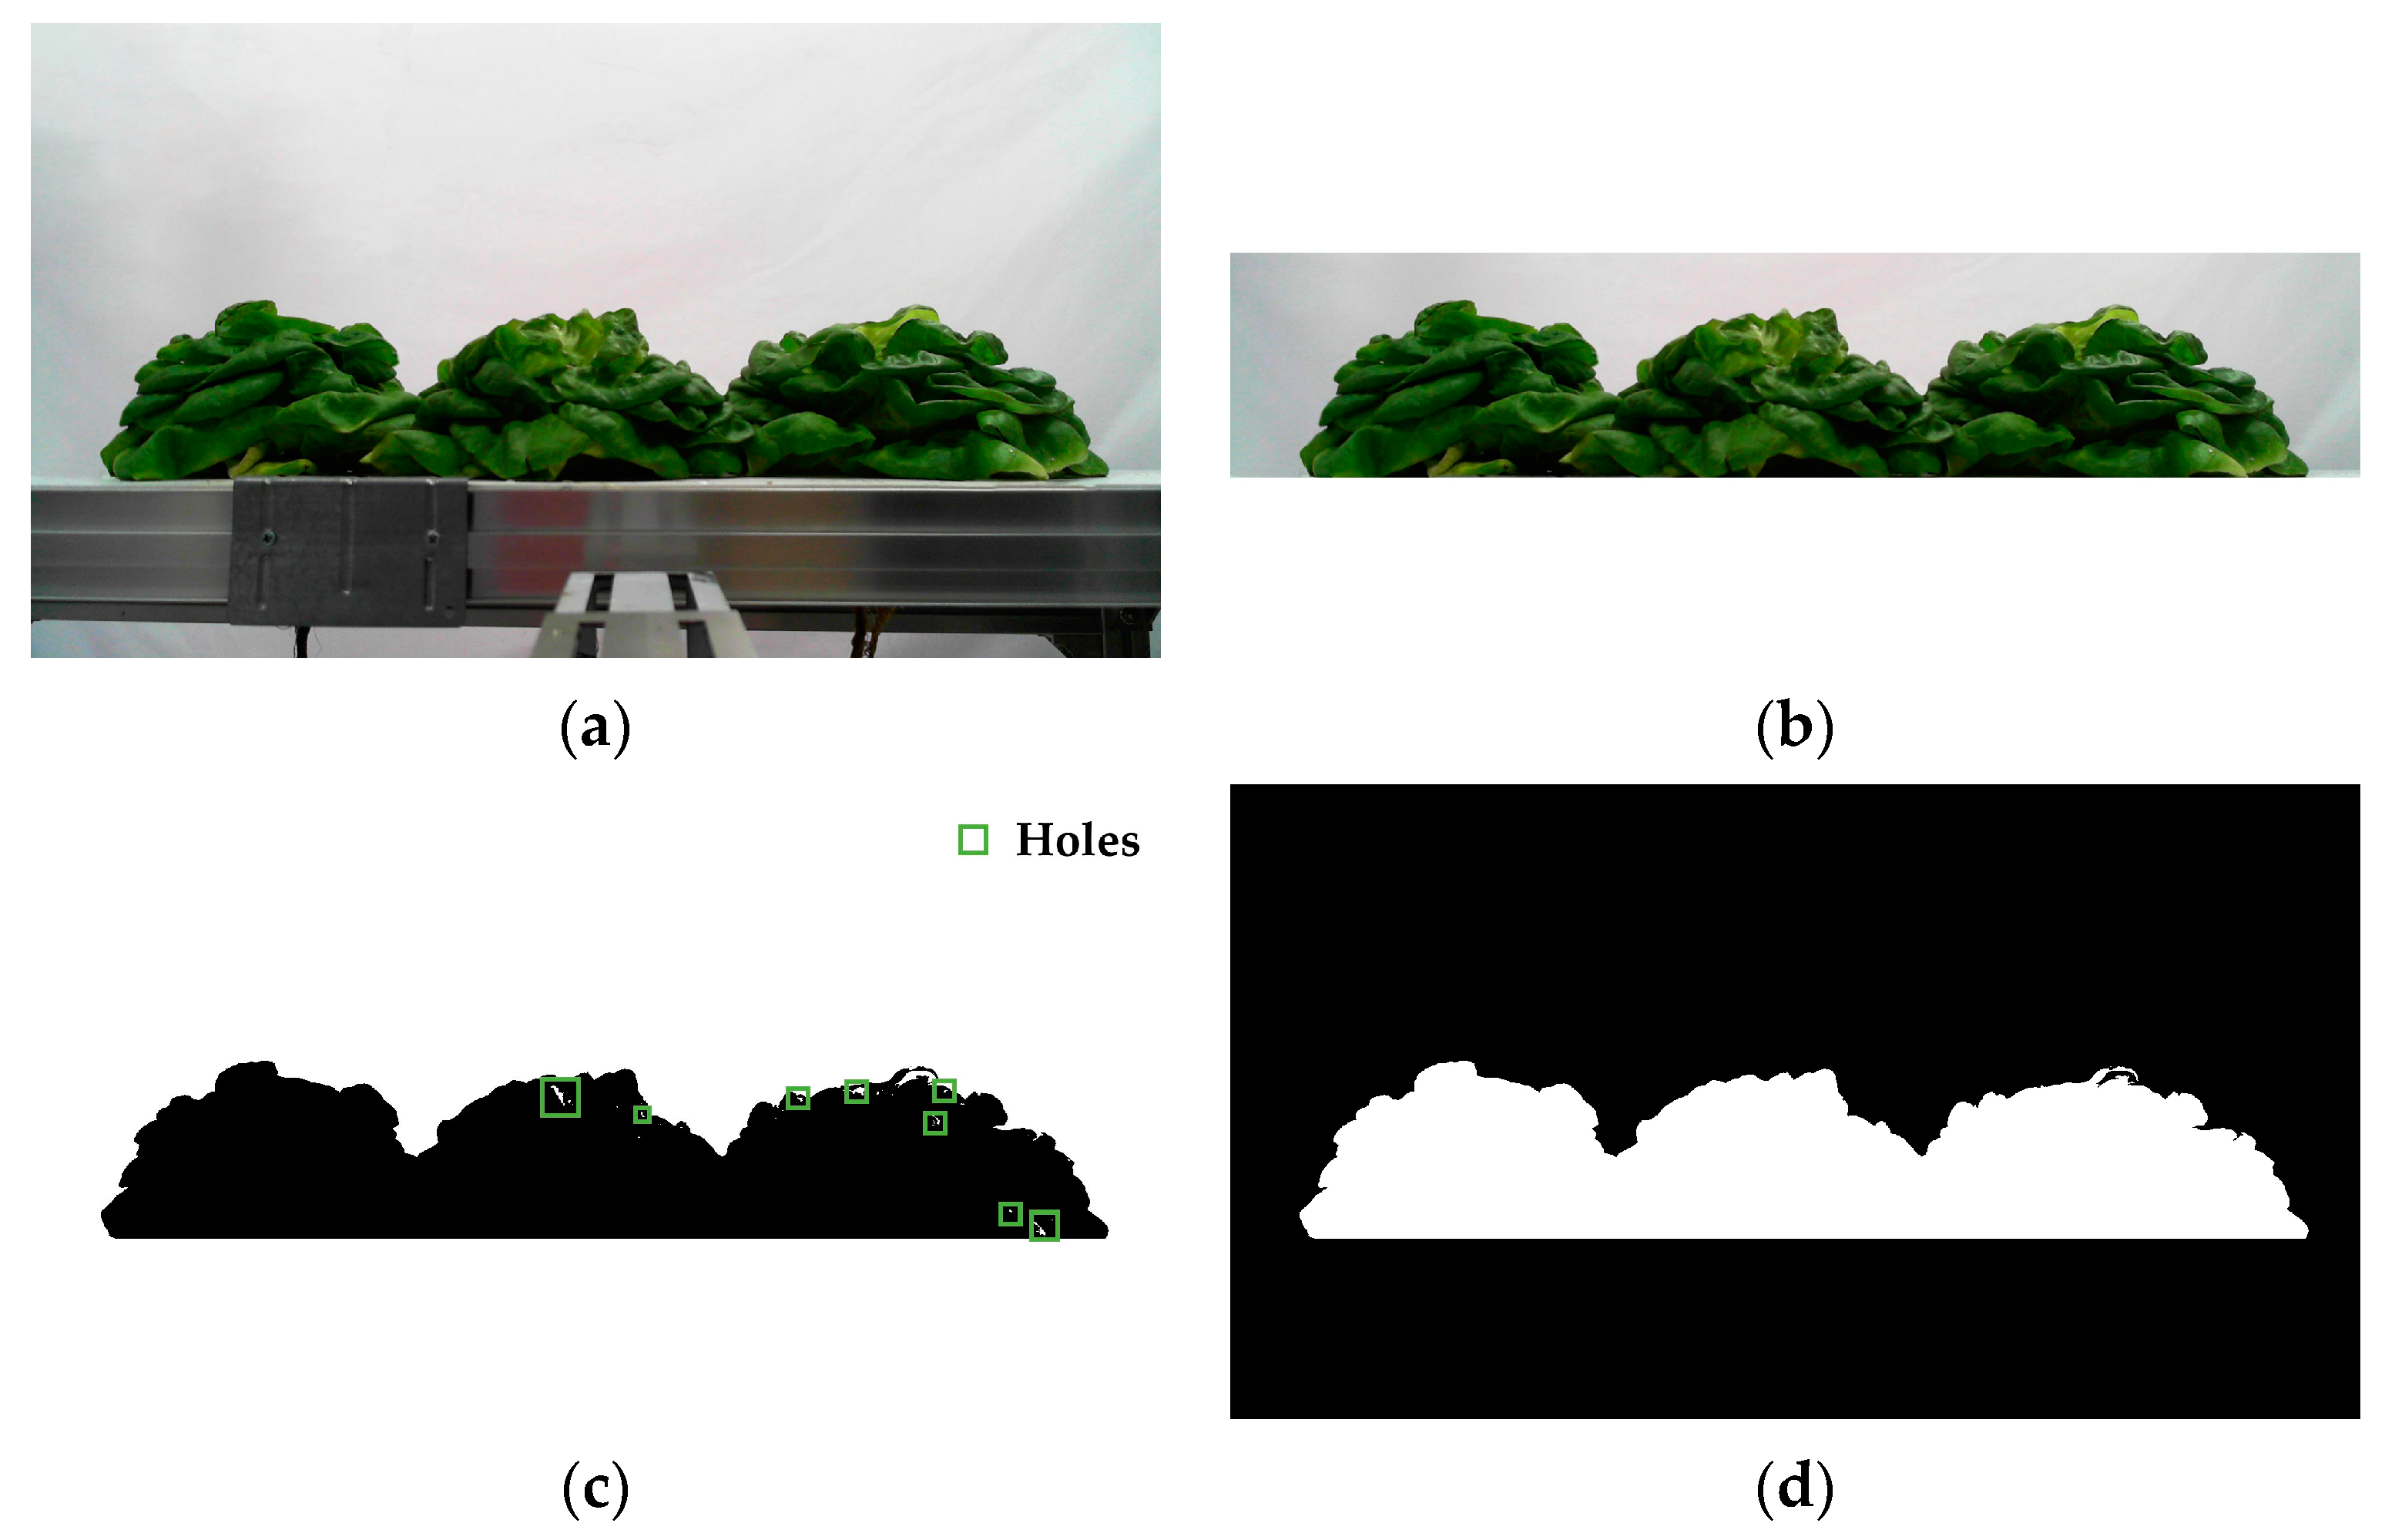
3.2.1. Foreground Extraction

Figure 5 shows the foreground extraction process, which included region of interest (ROI) extraction, binarization, and hole filling. To accurately obtain the size information of the three lettuces, the region including the three lettuces in original image was set as the ROI. The ROI was a pixel rectangle region. The pixel coordinates in vertical direction of the rectangle were from 390 to 773 and the pixel coordinates in horizontal direction of were from 0 to 1920. The ROI image was binarized using the Otsu algorithm, while we noted that the complex phenotype and color of the original image might have caused holes (Figure 5c). To improve the accuracy of detection and segmentation for the lettuces’ upper contours, the holes were filled.

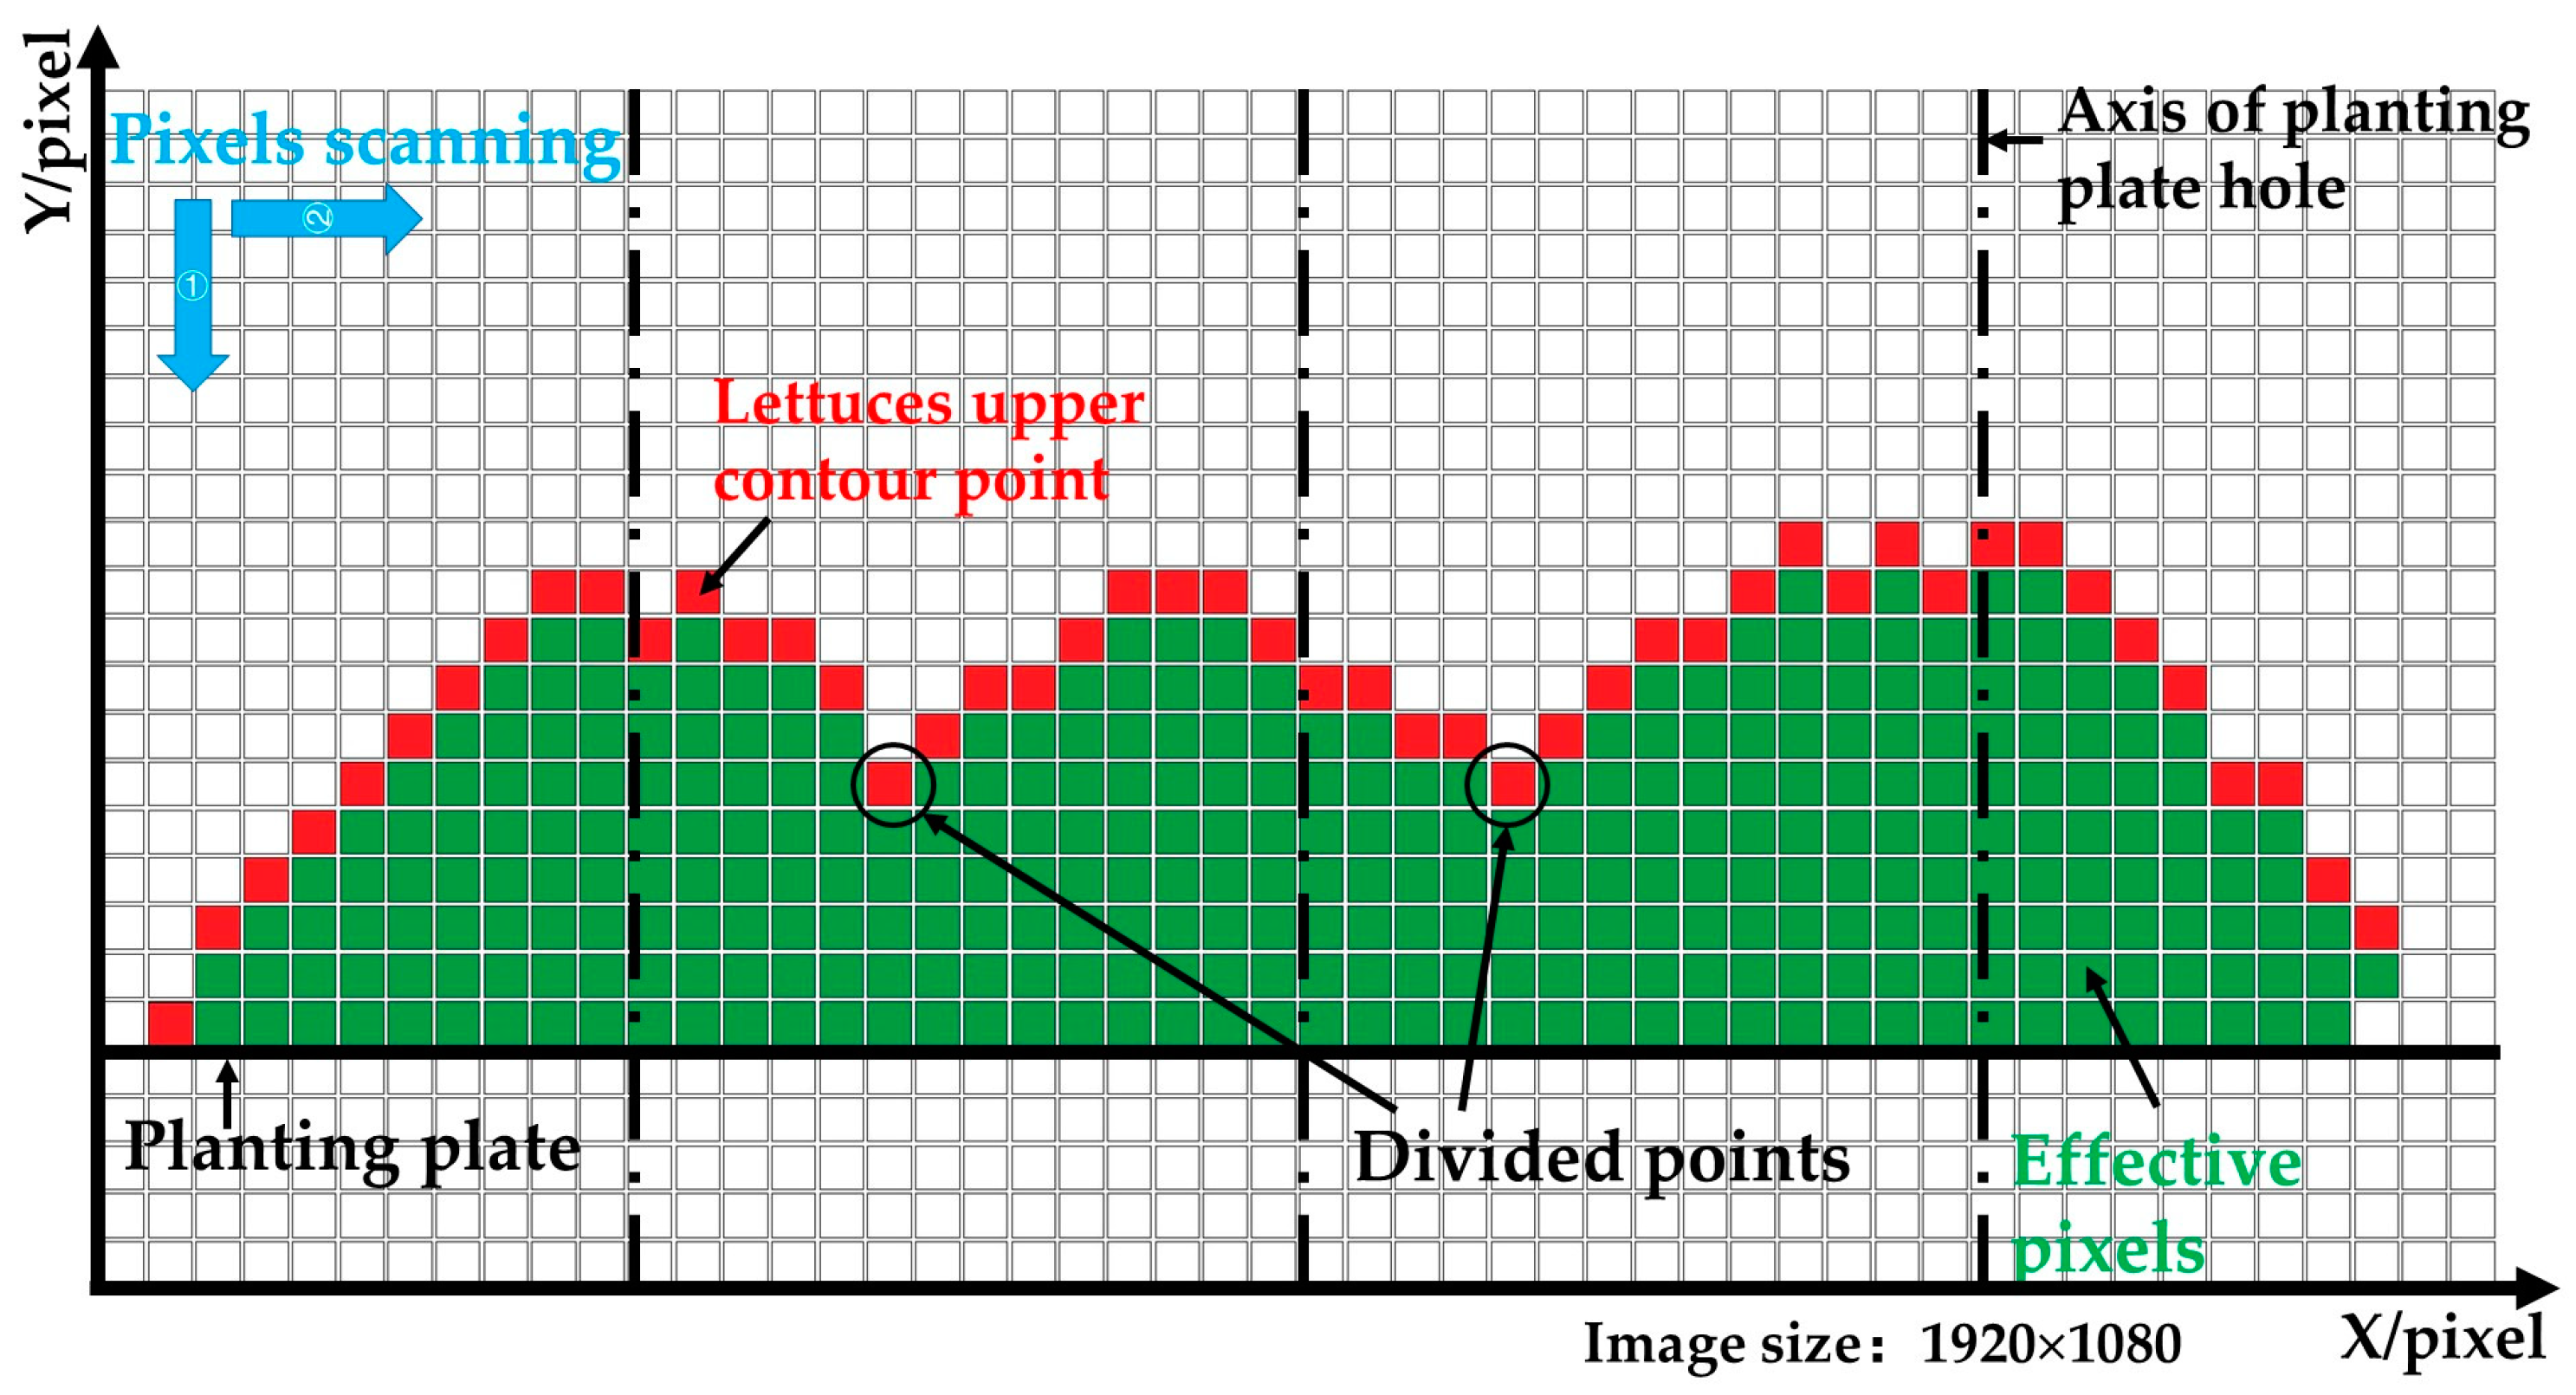
3.2.2. Detection and Segmentation of Lettuces’ Upper Contours

The upper contours of hydroponic lettuces were the detection basis for measuring the lettuce height and leaves expansion size, and the detection and segmentation method is shown in Figure 6. The upper contour was detected based on the pixels’ characteristics in the binarized image (Figure 5d), and the gray value of the foreground area in the binarized image was 255. The main steps of upper contour detection are listed as follows:
(1)
The binarized image (Figure 5d) was converted into a matrix of 1080 × 1920. The coordinate system was established according to the matrix. In the matrix, the 1080th row was set as the X-axis, and the first column was set as the Y-axis.
(2)
The first column of the matrix was scanned along the Y- direction, and the coordinate value of the pixel was recorded when a gray value of 255 was first detected.
(3)
To detect all the coordinate values of the lettuces’ upper contours, step 2 was repeated along the X+ direction.
The lowest points between the adjacent axes of the planting plate holes were selected as the dividing points of the lettuces’ upper contours. The distance between the adjacent axes of the planting plate holes was 160 mm.
Figure 7 shows an example of the detection and segmentation of the lettuces’ upper contours. The lettuces’ upper contours were divided into the left lettuce (Figure 7b), middle lettuce (Figure 7c), and right lettuce (Figure 7d) based on the dividing points (P1, P2). The segmented lettuce was used to measure the height and leaves expansion size in the follow-up study.

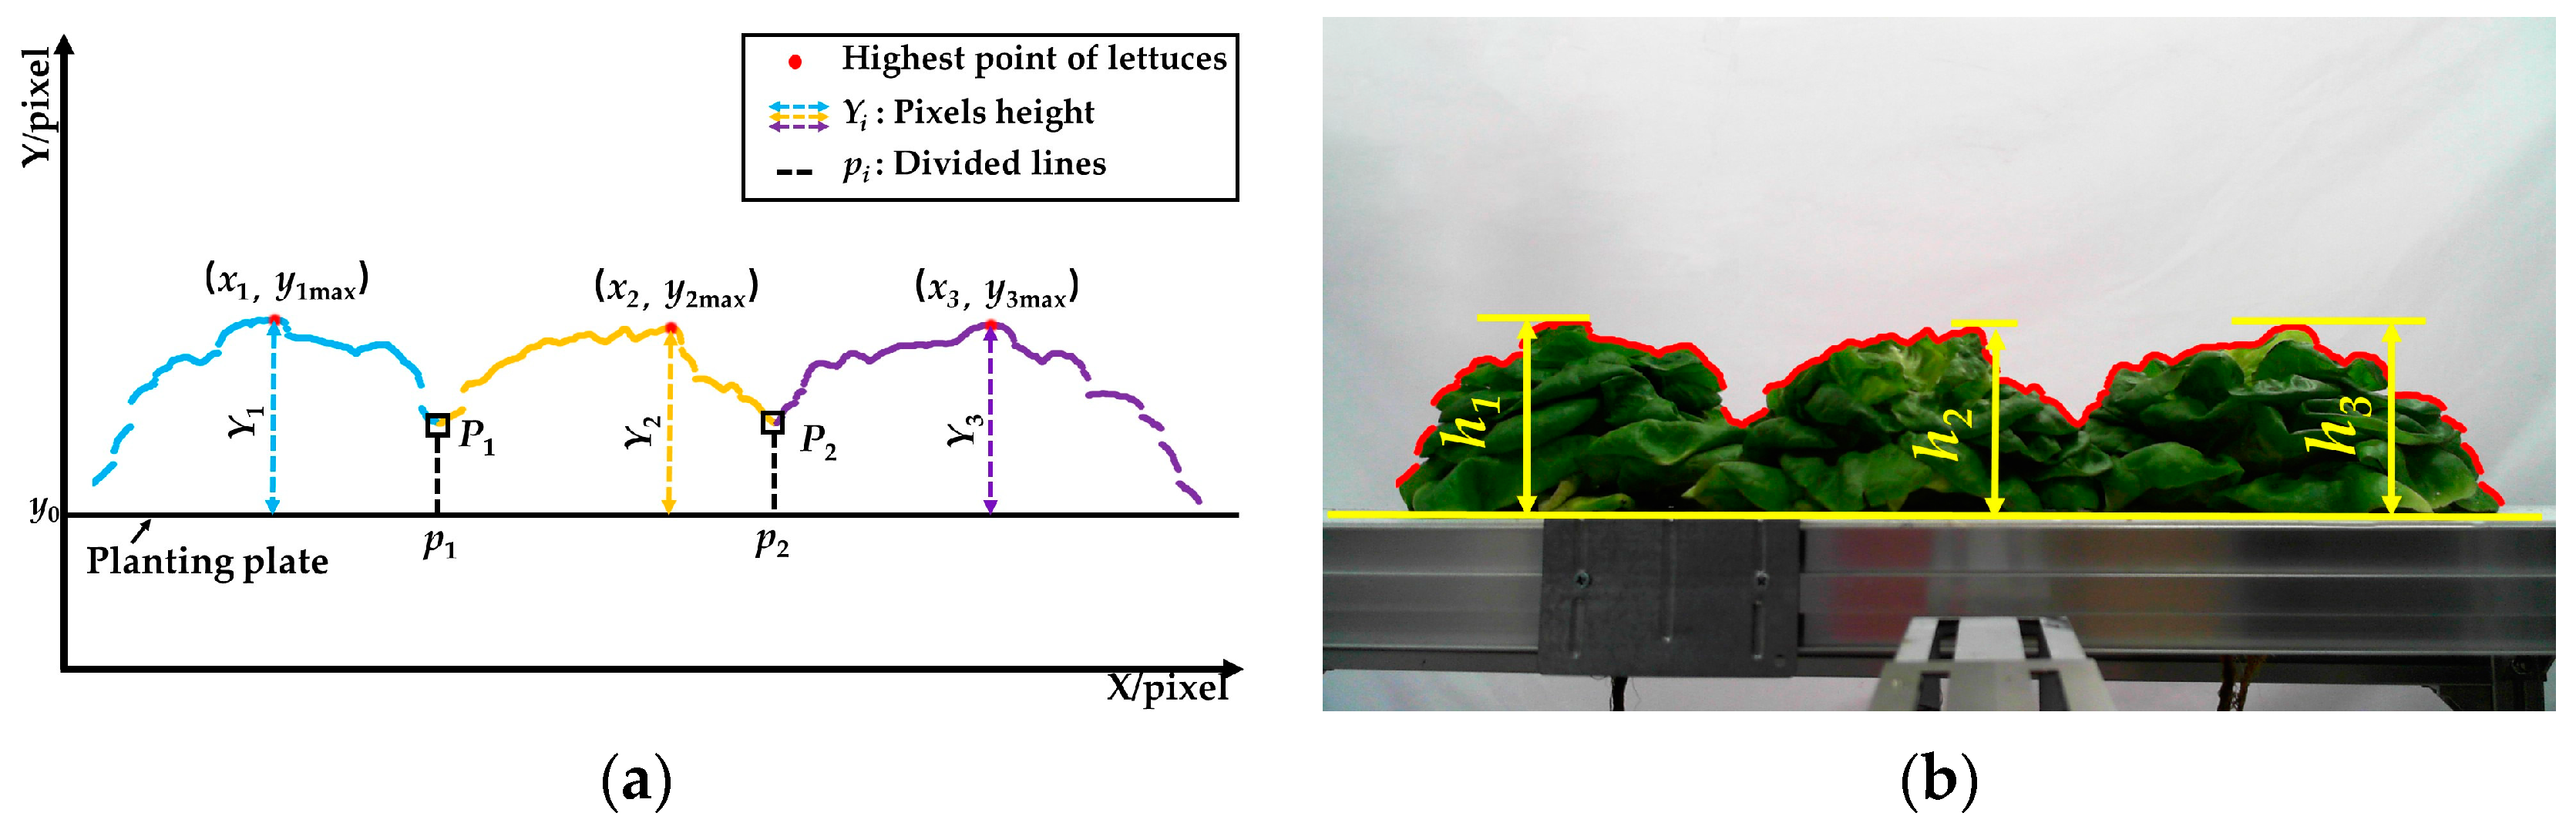
3.3. Measurement of Lettuce Height

The highest points (Mi) of the segmented lettuces were selected to measure the lettuces’ heights, and Figure 8 shows the height measurements of the three hydroponic lettuces. A total of twenty-five images (including seventy-five lettuces) were used in the height measurement, and every image included three lettuces. The upper contours of the three lettuces were divided into three coordinate sets based on the divided points Pi. The ordinate yimax of Mi in every coordinate set was detected to calculate the lettuce height. Equations (1) and (2) show the calculation process.
Yi = yimax − y0
hi = Yi × K
where Yi denotes the pixel height of lettuce, y0 denotes the pixel height of the planting plate’s upper surface, yimax denotes the pixel height of lettuces’ highest points, and hi denotes the automatically measured lettuce height. K is the scaling factor, which has a value of 0.27 mm/pixel.

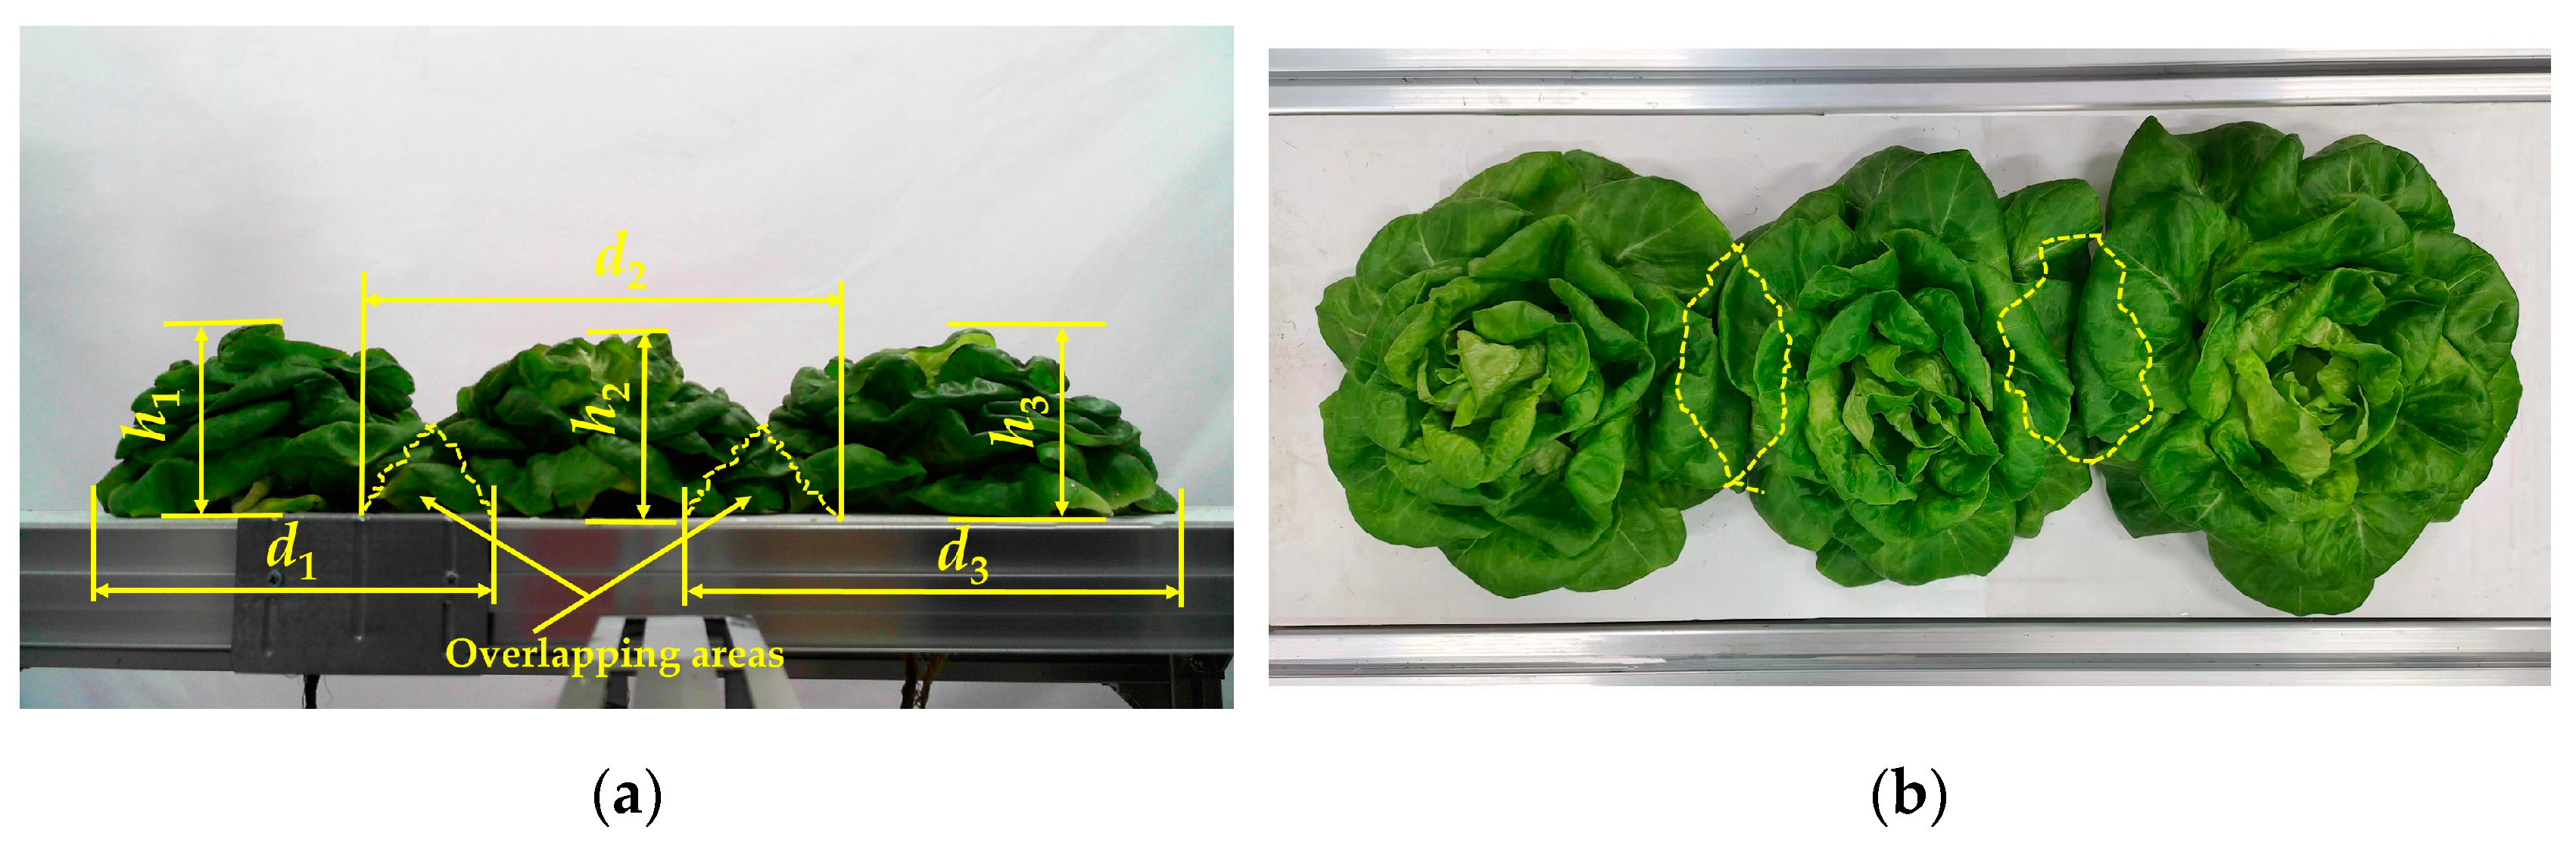
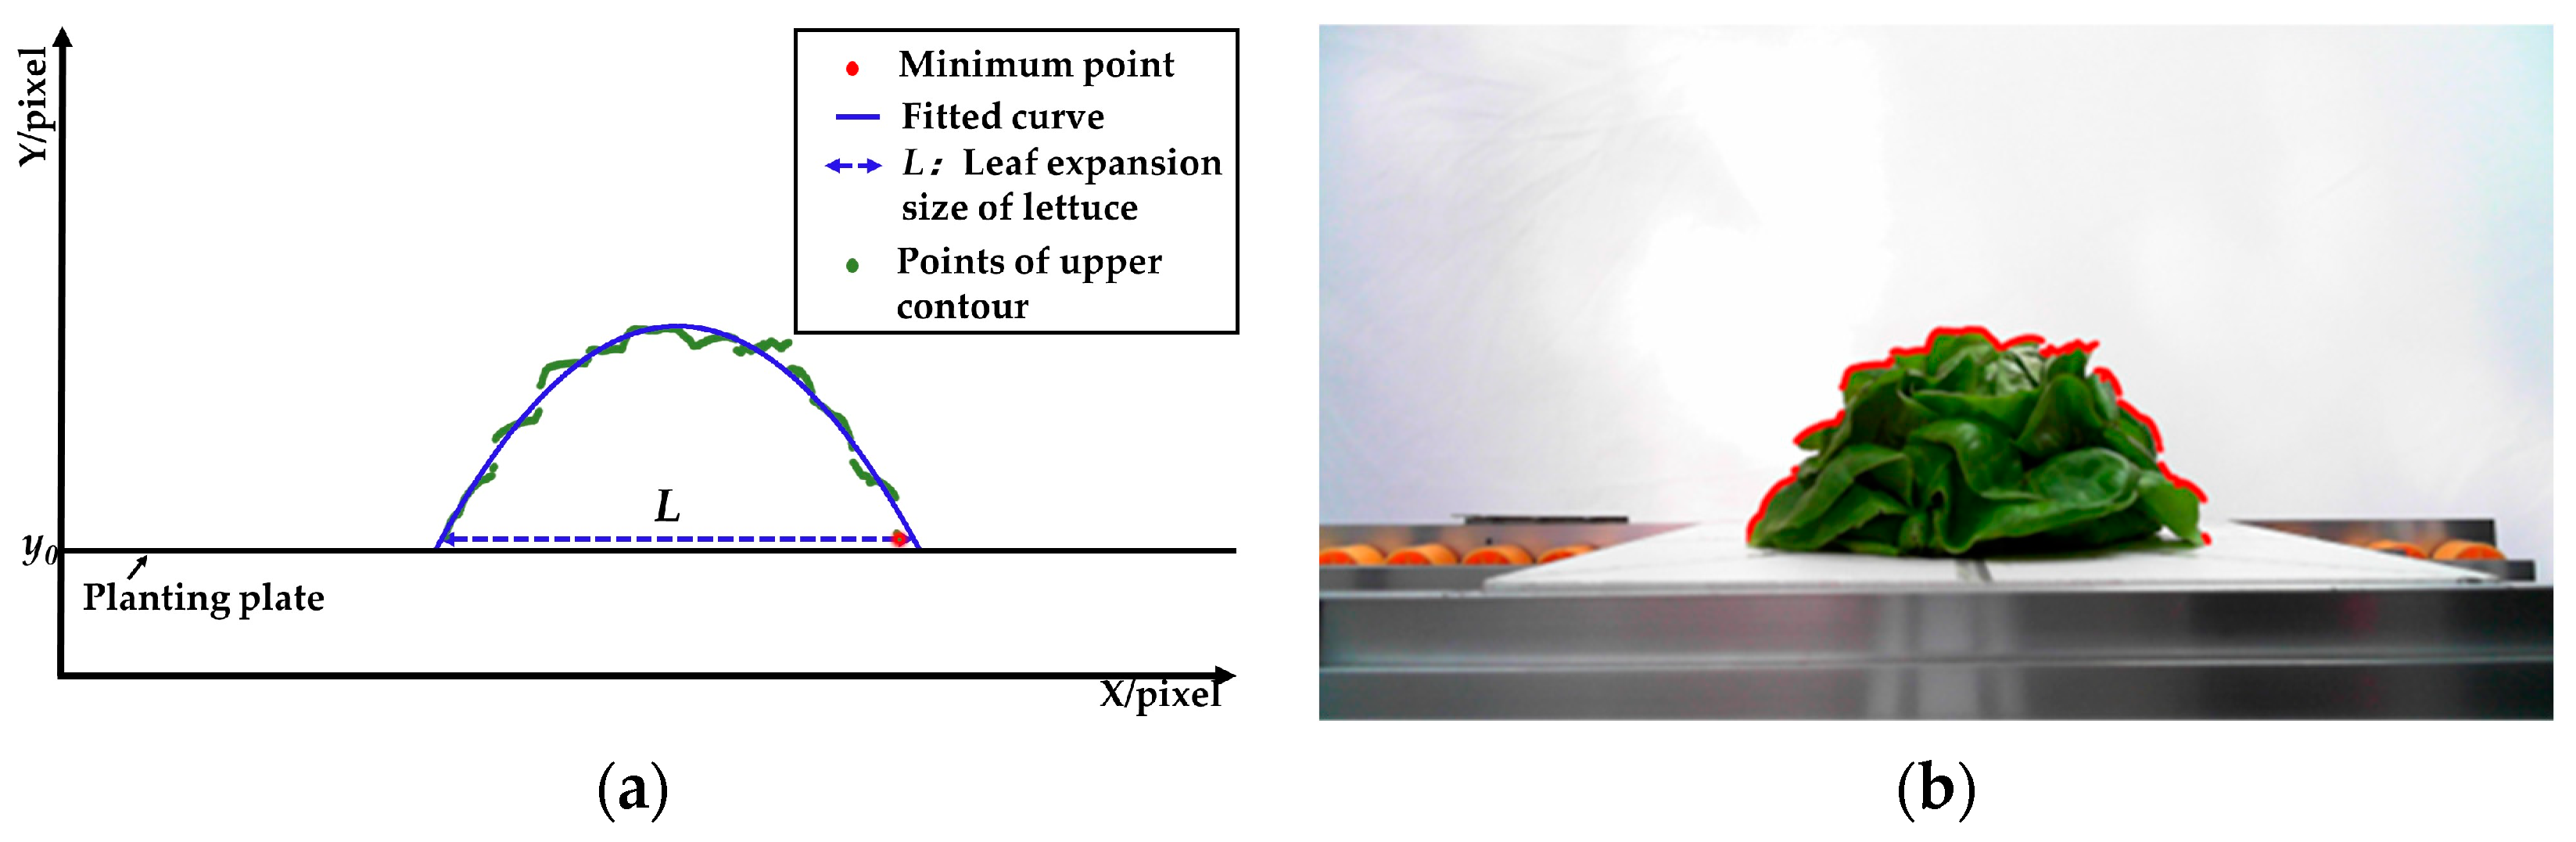
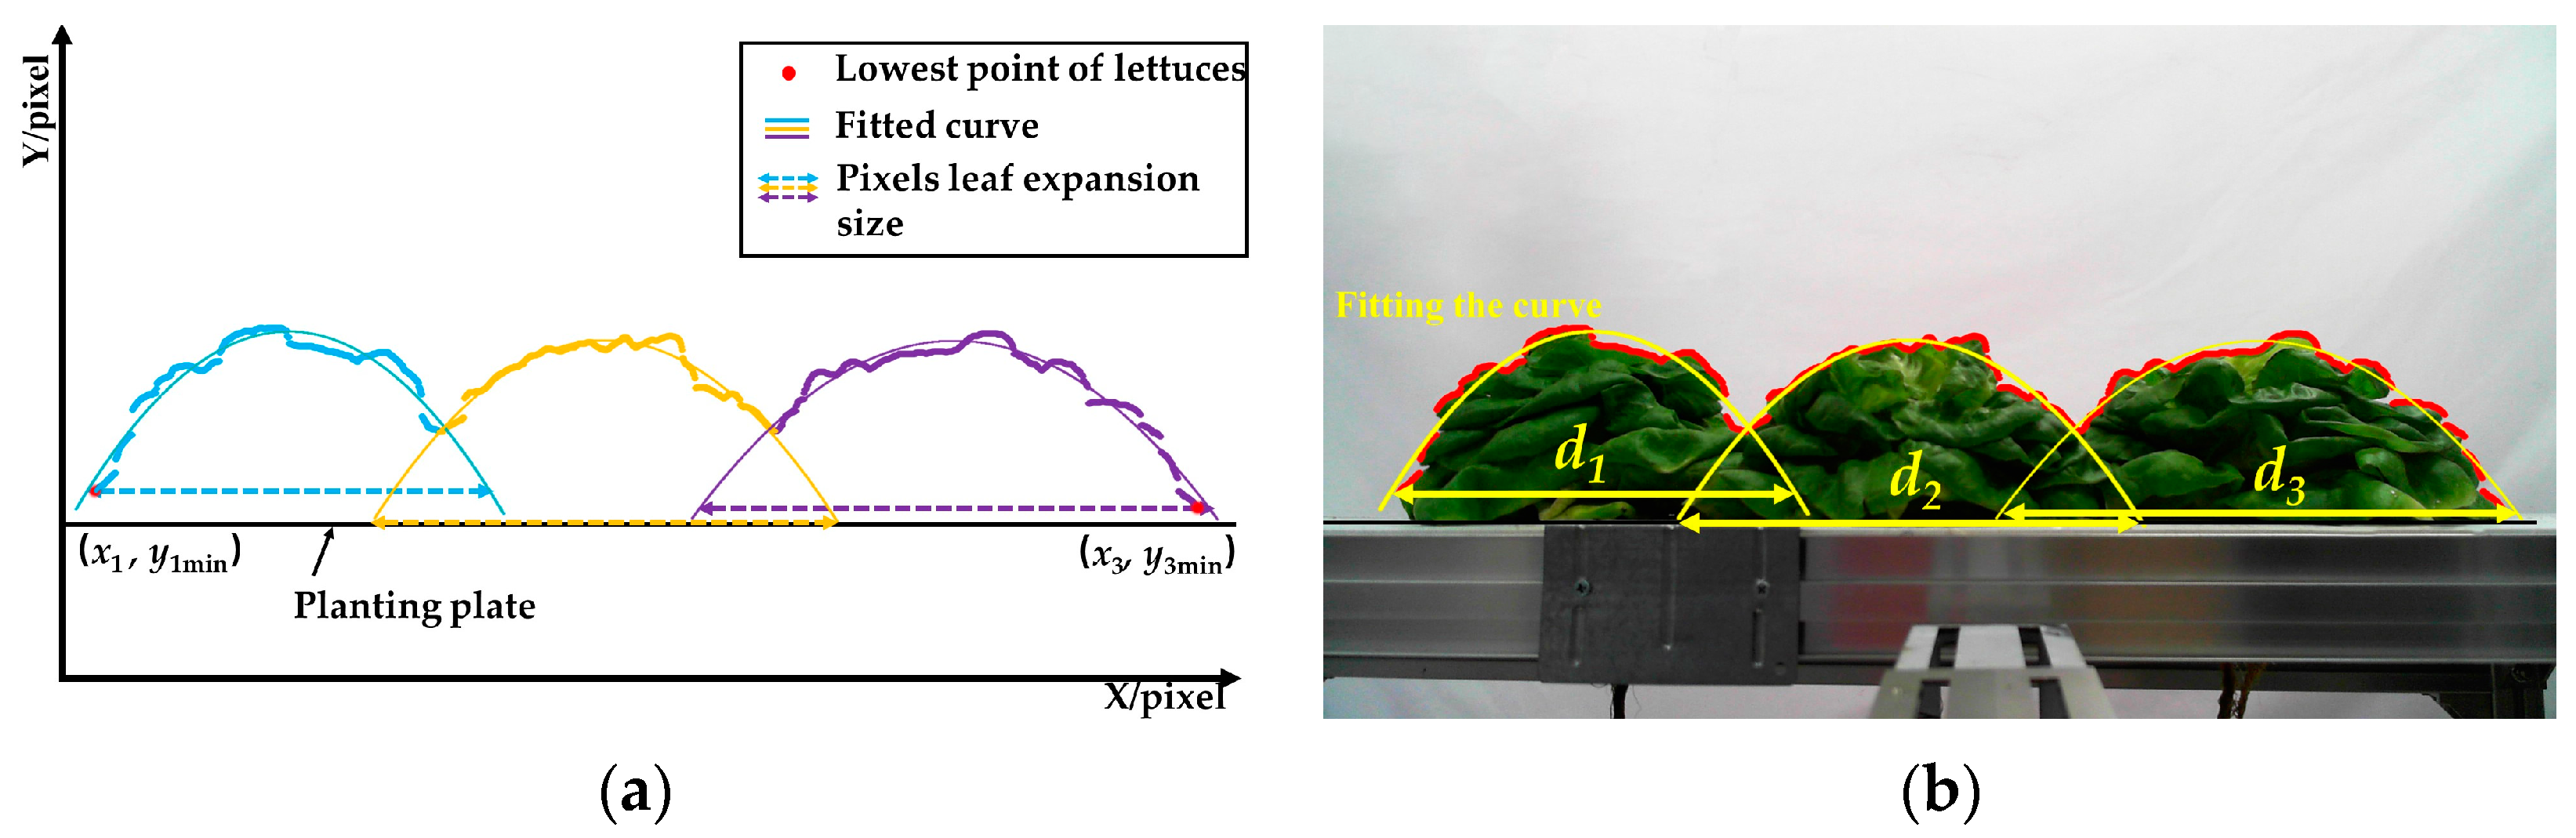
3.4. Measurement of Leaves Expansion Size

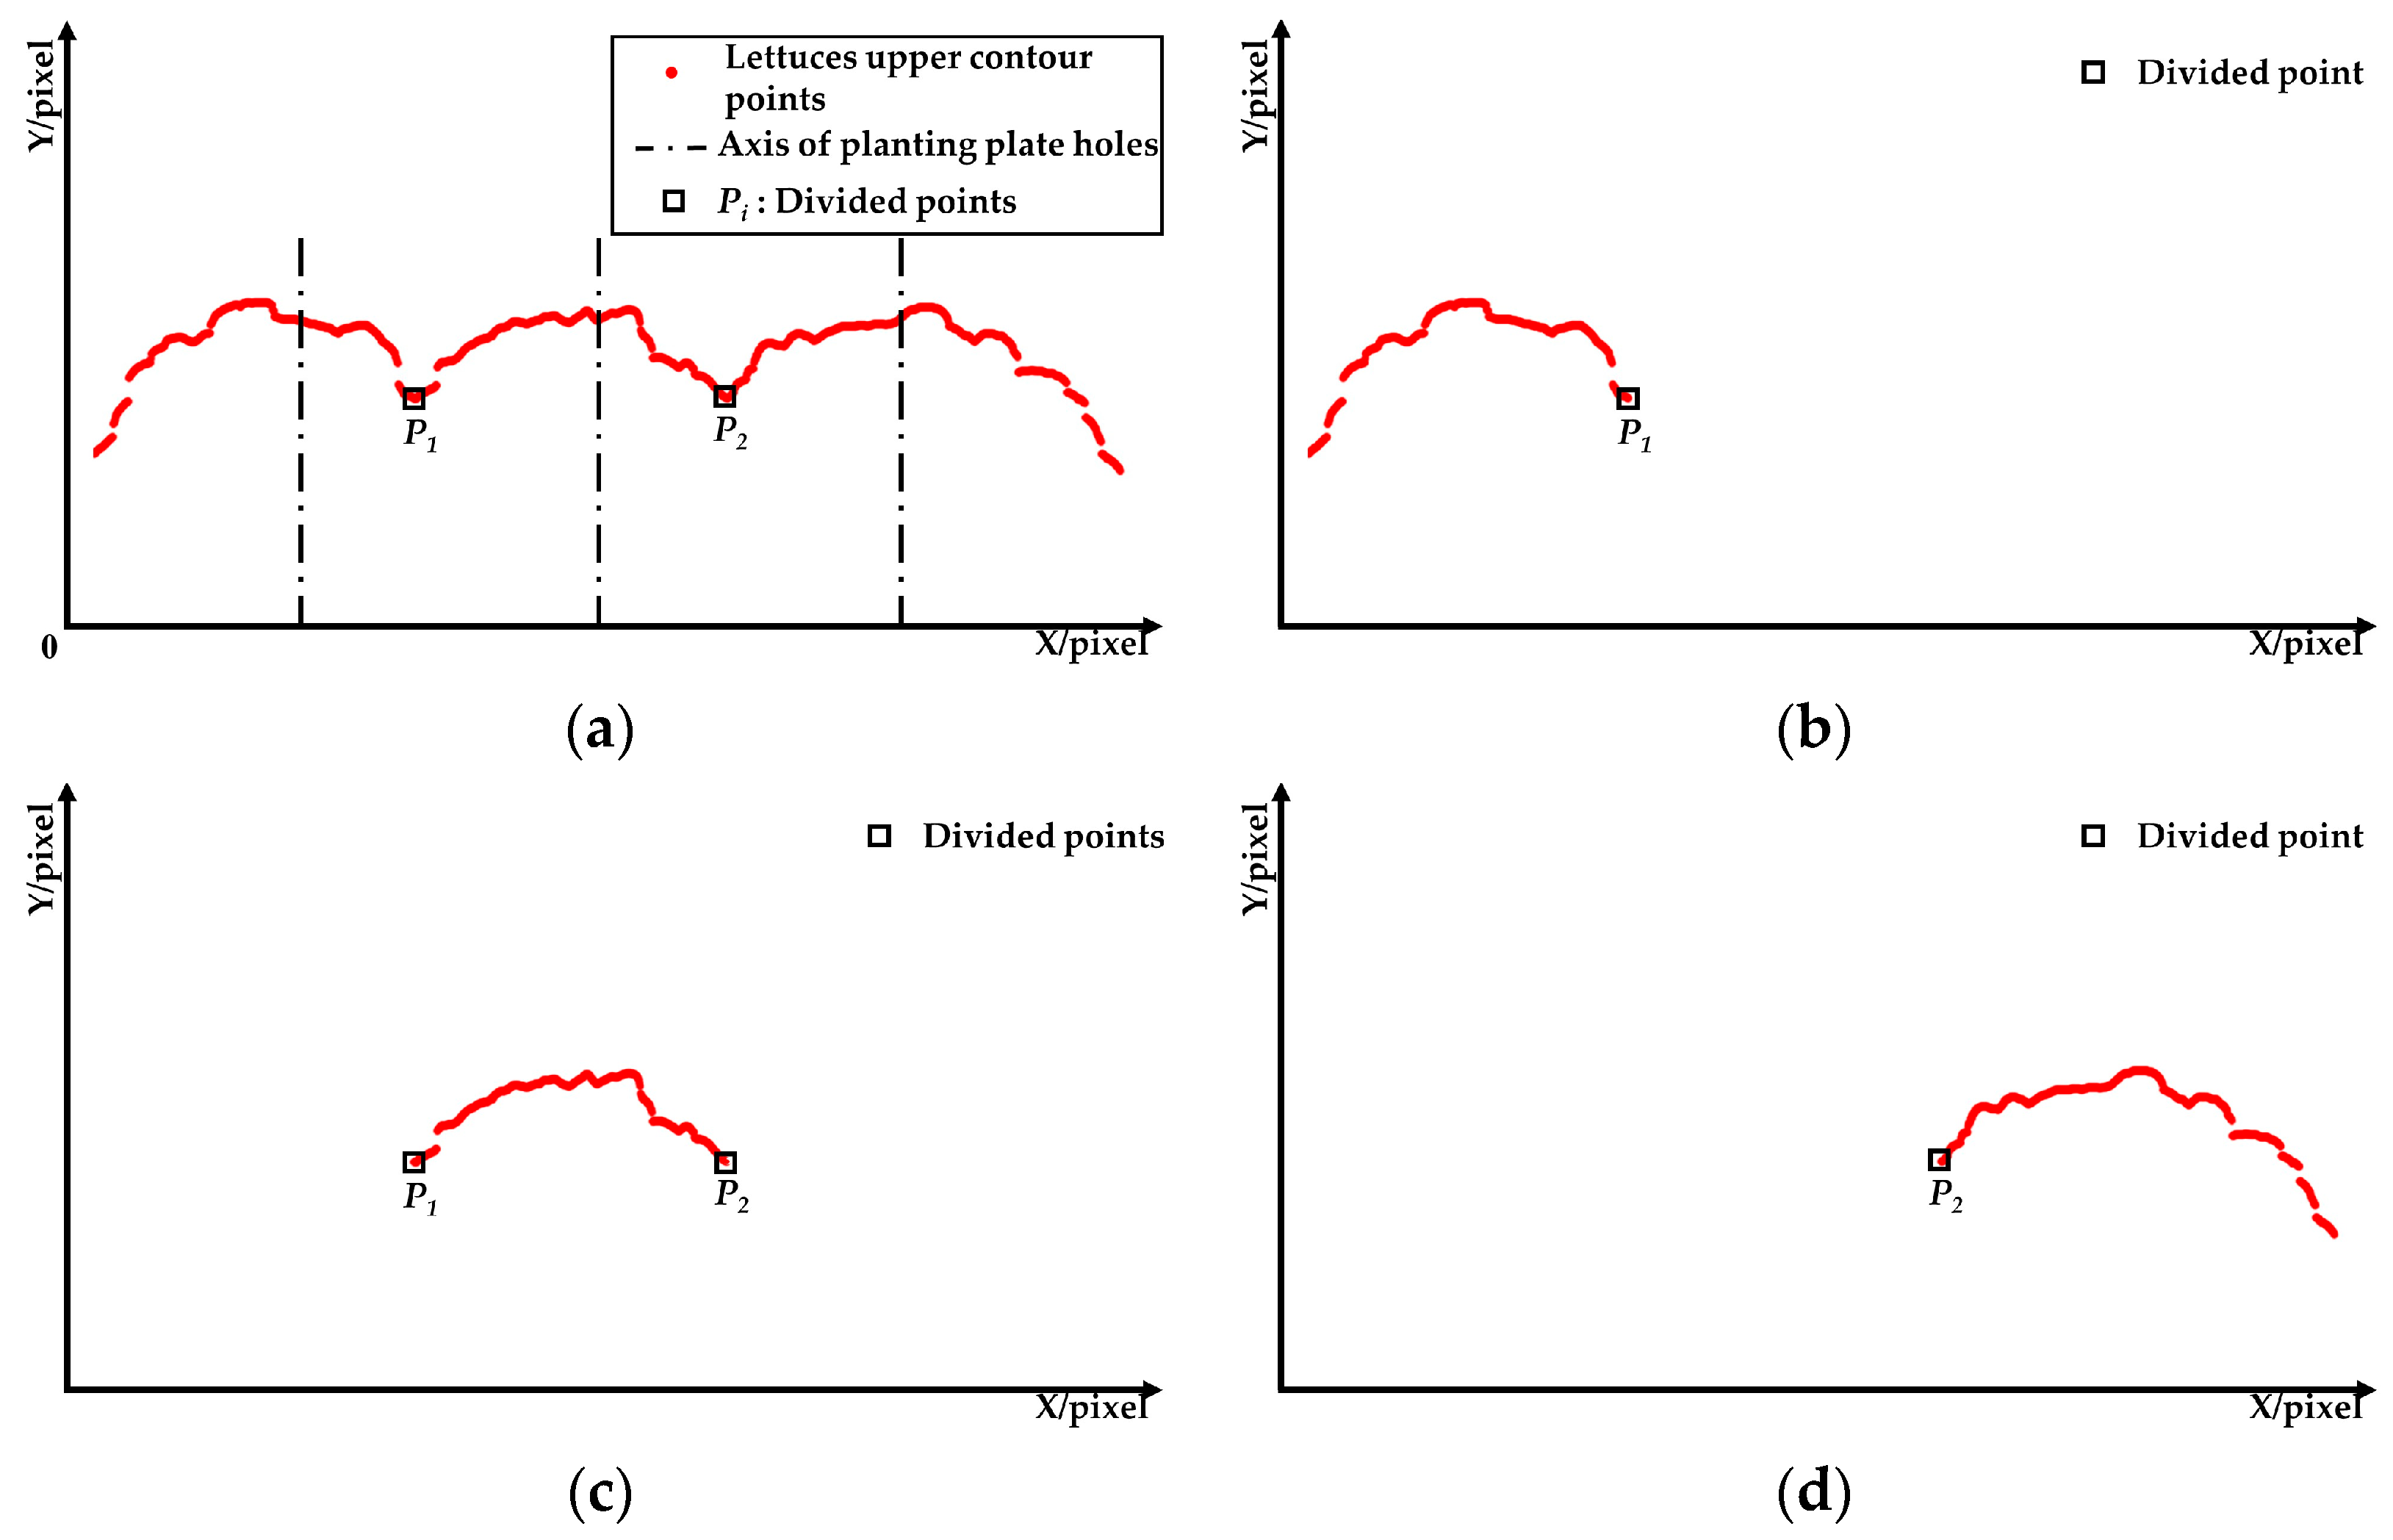
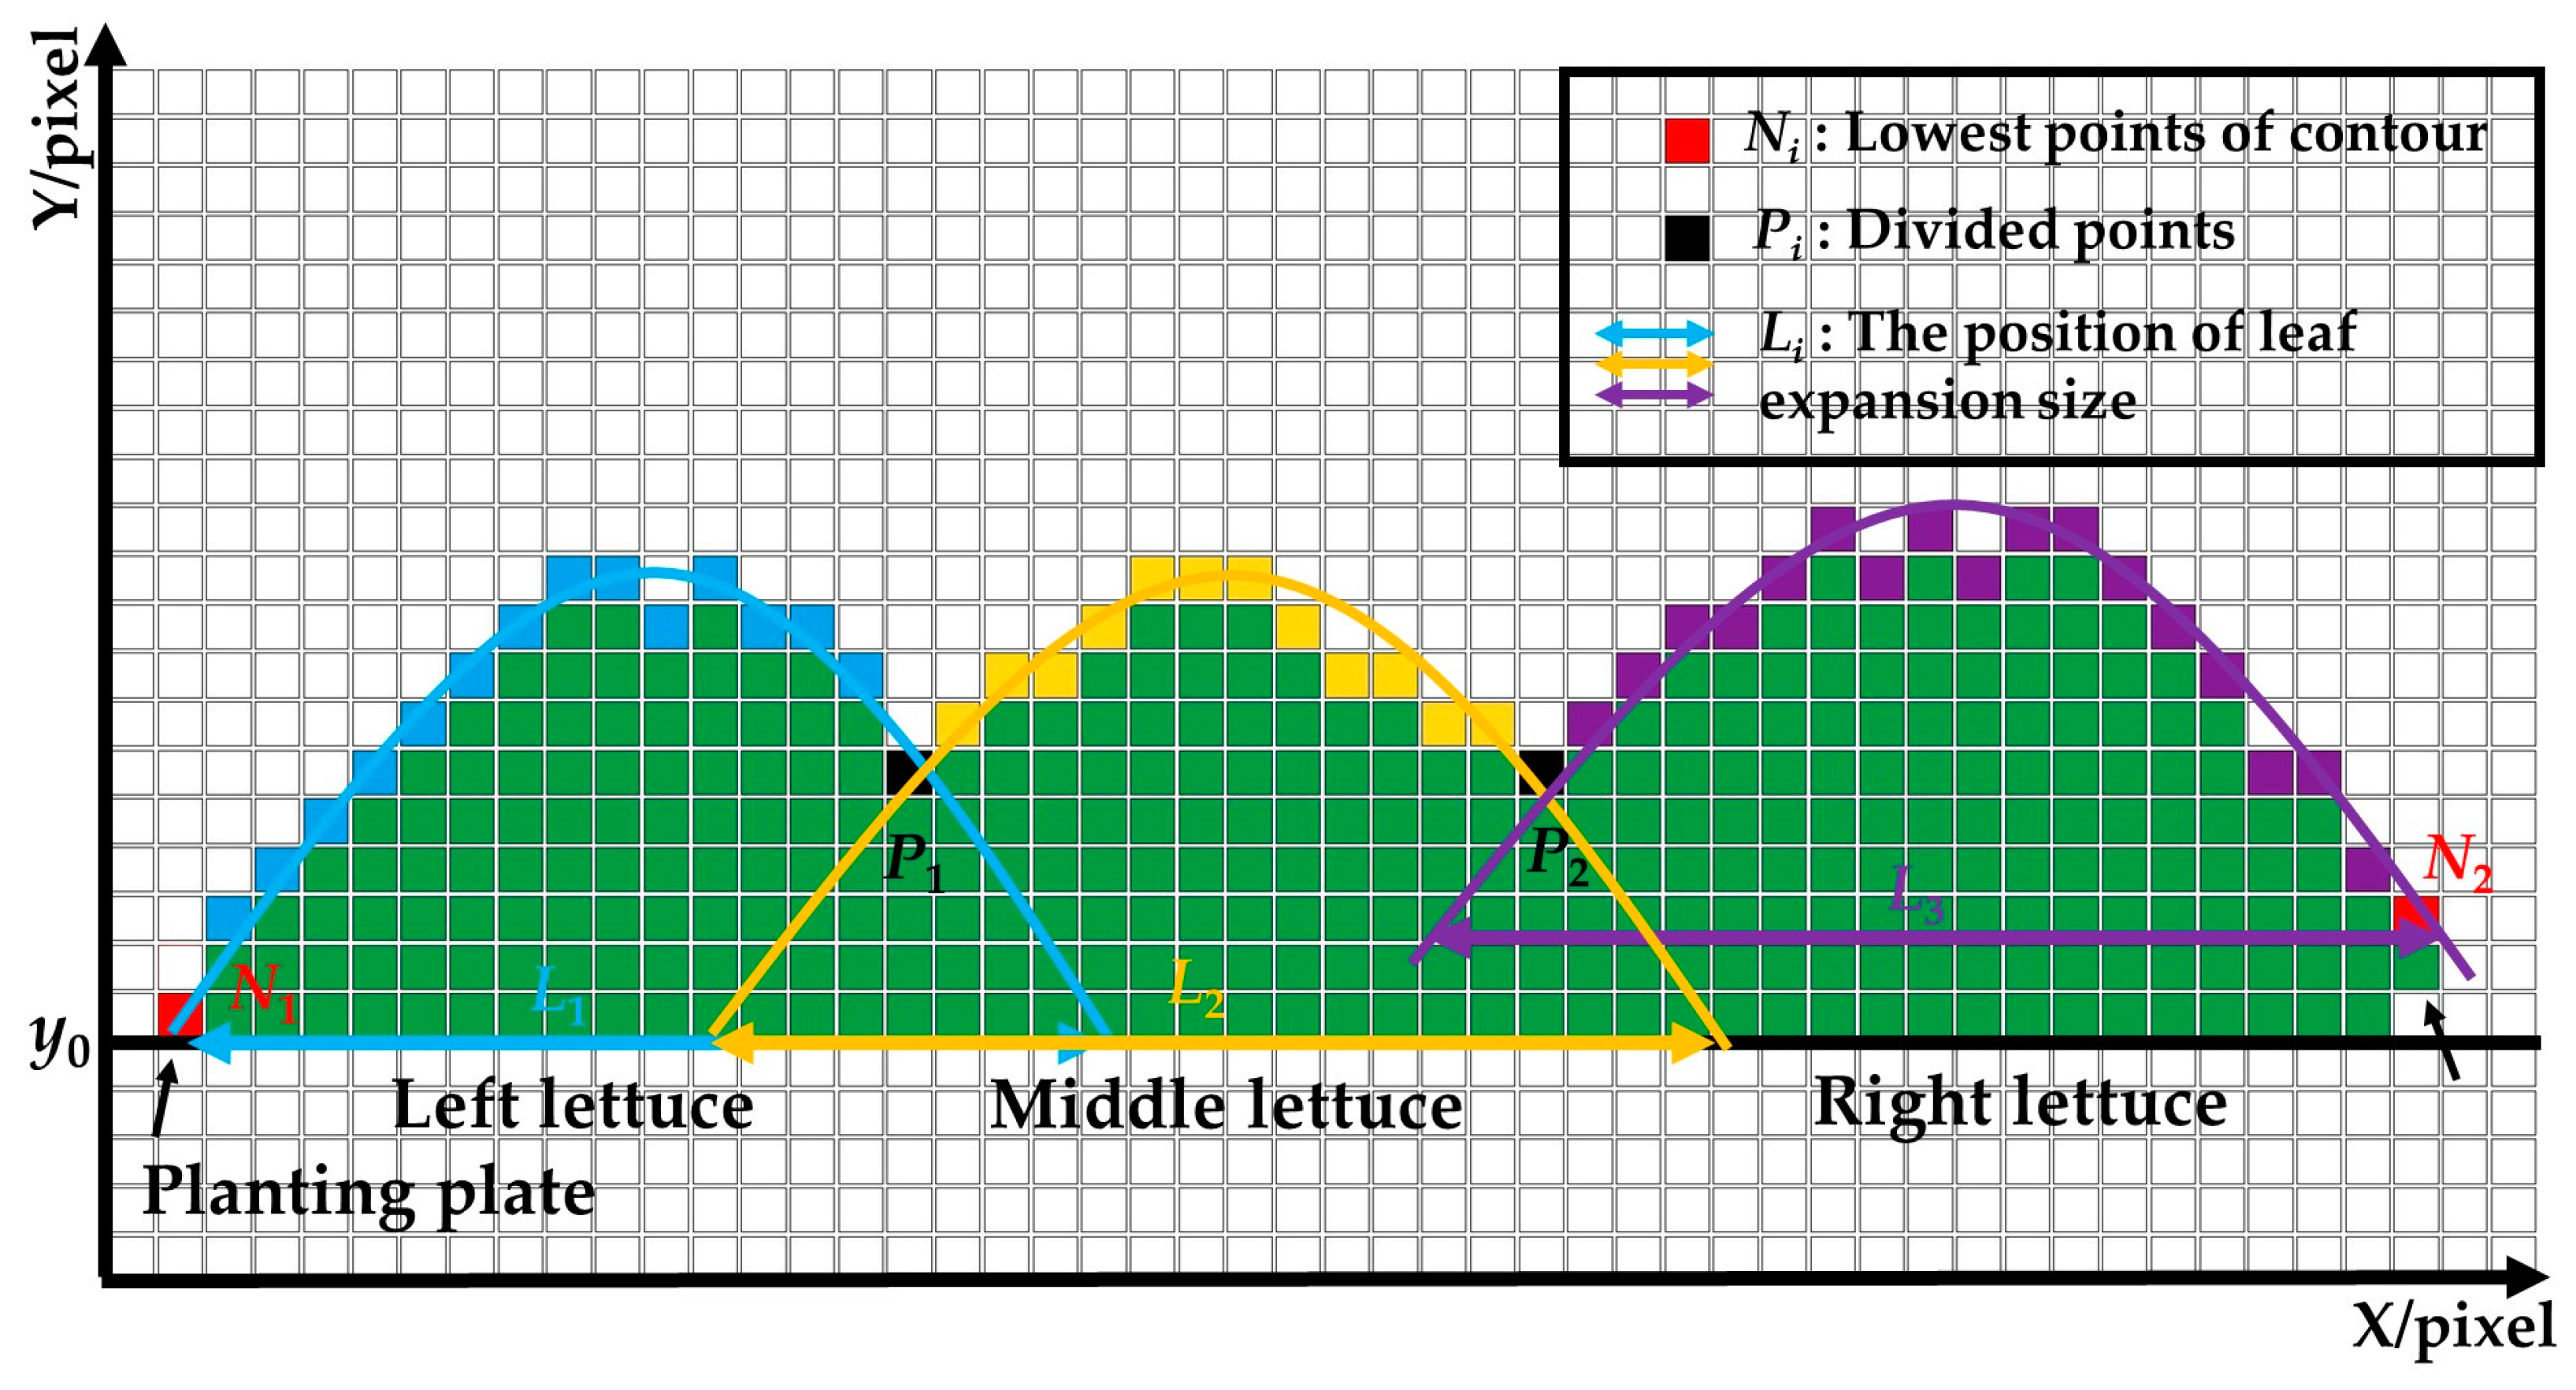
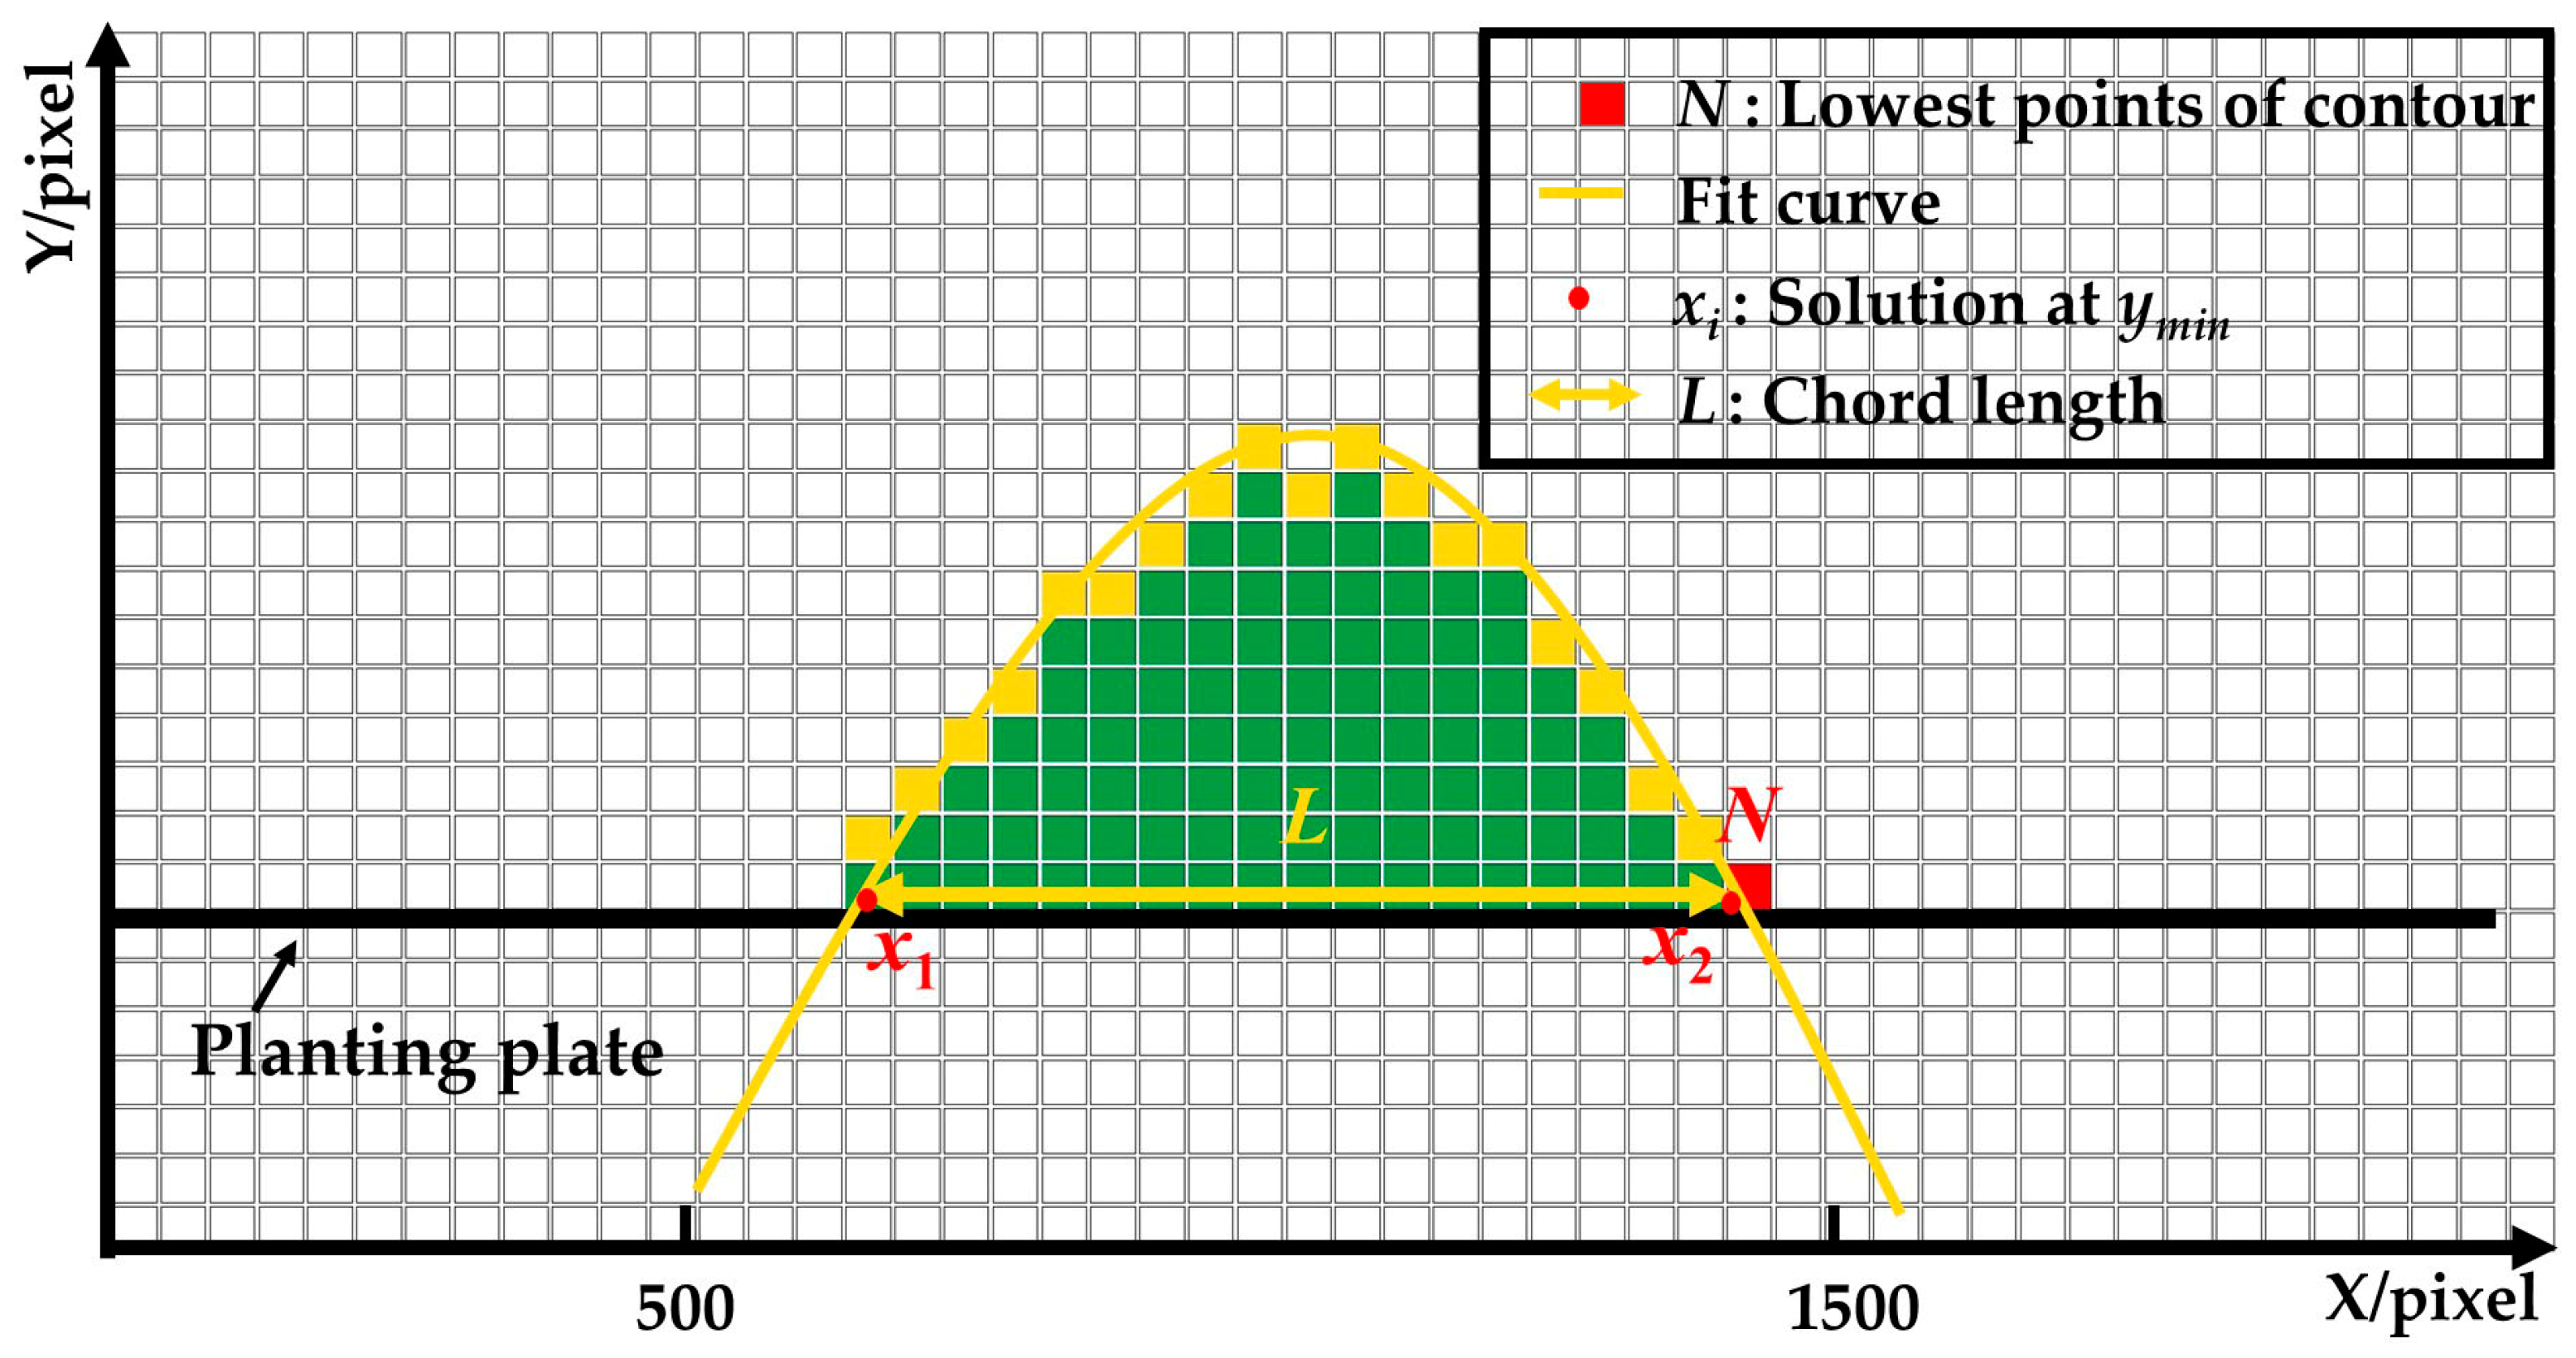
3.4.1. Position and Measurement Method for Leaves Expansion Size

Figure 9 shows the measurement method for leaves expansion size for the three lettuces. The leaves of adjacent lettuces were overlapping, and the leaves expansion sizes were difficult to detect directly. Therefore, according to the distribution characteristics of the lettuces’ leaves, the upper contour was fitted to a function in order to measure the leaves expansion size indirectly. The samples for the leaves expansion size measurements were the same as those for the lettuce height measurement. The leaves expansion sizes of the lettuces were measured from left to right, and the measurement methods for different lettuces are listed as follows:
(1)
The leaves expansion sizes of the left and right lettuces were measured according to the fitting function and the lowest point of the upper contour. Firstly, the lowest points (Ni) of the upper contours were detected and set as the measuring points of leaves expansion size. Secondly, the coordinate sets of lettuces’ upper contour were fitted to function curves. Lastly, the pixel leaves expansion sizes (L1 and L3) were calculated according to the ordinate yi of the lowest points and the fitting function.
(2)
The leaves of the middle lettuce overlapped with the leaves of the left and right lettuces. According to the leaves’ distribution characteristics in the pre-experiment, the planting plate’s upper surface y0 was set as the measuring point to measure the middle lettuce’s leaves expansion size. Firstly, the fitting function of the middle lettuce was established using the upper contour between P1 and P2. Then, the pixel leaves expansion size L2 was calculated according to the measuring point and the fitting function.

3.4.2. Measuring Method of Leaves Expansion Size Using Different Fitting Functions

According to the shape characteristics of the lettuce’s contour and the pre-experiment, the quadratic function, cubic function, and sine function were selected to fit the upper contour of lettuce, respectively. To verify the measurement accuracy of different fitting functions, sixty images of a single lettuce were used.
Figure 10 shows the measurement method of the lettuce’s leaves expansion size based on the fitting functions. According to the ordinate (ymin) of the lowest point (N) and the fitting function, the solutions of the function (xi) were obtained. xi was distributed between 500 and 1500 along the X-axis according to the pre-experiment. Therefore, effective solutions (x1 and x2) were extracted within the range of (500, 1500). The calculation process of the leaves expansion size is shown in Equations (3) and (4).
L = x 2 x 1
d = L × K
where L denotes the pixel length of leaves expansion size, xi denotes the effective solutions of the fitting functions, d denotes the actual value of leaves expansion size, and K is the scaling factor.

3.5. Harvesting Verification According to the Measurement Results of Lettuce Height and Leaves Expansion Size

Ninety hydroponic lettuces were randomly selected to verify the harvesting effect. These lettuces were divided into thirty groups. Twenty groups of lettuces were used to verify the injured area of the lettuces’ leaves, and each lettuce was only used once. The other 10 groups of lettuces were used to verify the success rate, and each lettuce was used 10 times. The injured area of one lettuce was the sum of the injured area of all the lettuce leaves [16]. For the harvesting device (Figure 11b), we automatically adjusted the grabbing parameters according to the measurement results of the lettuces’ sizes, and the process is shown in Figure 2 and Figure 3. The grabbing height H was adjusted according to the measured lettuce height h and the optimal grabbing height ratio η1 (Figure 11a), and η1 equaled 0.55. The grabbing diameter D was adjusted according to the measured leaves expansion size d and the optimal grabbing diametrical ratio η2 (Figure 11a), and η2 equaled 0.76 [27]. To analyze the grabbing process of the hydroponic lettuces, a PHANTOM high-speed camera (Vision Research Inc., Wayne, NJ, USA) (Figure 11b) was utilized to record the grabbing process. The frame rate of the high-speed camera was 300 f/s.

4. Results and Discussion

4.1. Measurement Results of Lettuce Height and Leaves Expansion Size

4.1.1. Measurement Results of Lettuce Height

Figure 12 shows a case of lettuce height measurement. The heights of the three lettuces in every image were measured at the same time. The linear regression results of the image processing measurements and manual measurements of seventy-five lettuces’ heights are shown in Figure 13, and the R2 ranged from 0.89 to 0.95. The RMSE2 of the middle lettuces was 1.64 mm, which was lower than that of the left and right lettuces. This phenomenon indicated that the image processing measurement results for the height of the middle lettuces were closer to the manual measurement results.
Figure 14 shows the relative errors of the lettuces’ height measurements. The maximal relative error was 5.58%, and the mean relative error was 2.14%. The mean relative error of the lettuces’ height measurement was better than that obtained by Hu et al. [15], who measured the lettuce height using Kinect (2.58%). The mean relative error of the middle lettuces was 1.46%, which was lower than that of the left lettuces (2.20%) and right lettuces (2.06%). Figure 13 and Figure 14 show that the height measurement effect of the middle lettuce was the most accurate in the images, and this phenomenon was caused by the position for image acquisition. Because the camera was installed in front of the middle lettuce, the distortion of the middle lettuce was minimal. This finding is consistent with the study of Zhong [19], who found that image distortion increased with the distance between the pixels and the optic axis.

4.1.2. Analysis of Measurement Results for Leaves Expansion Size

(1)
The Accuracy of Different Fitting Functions for Lettuce Leaves Expansion Size
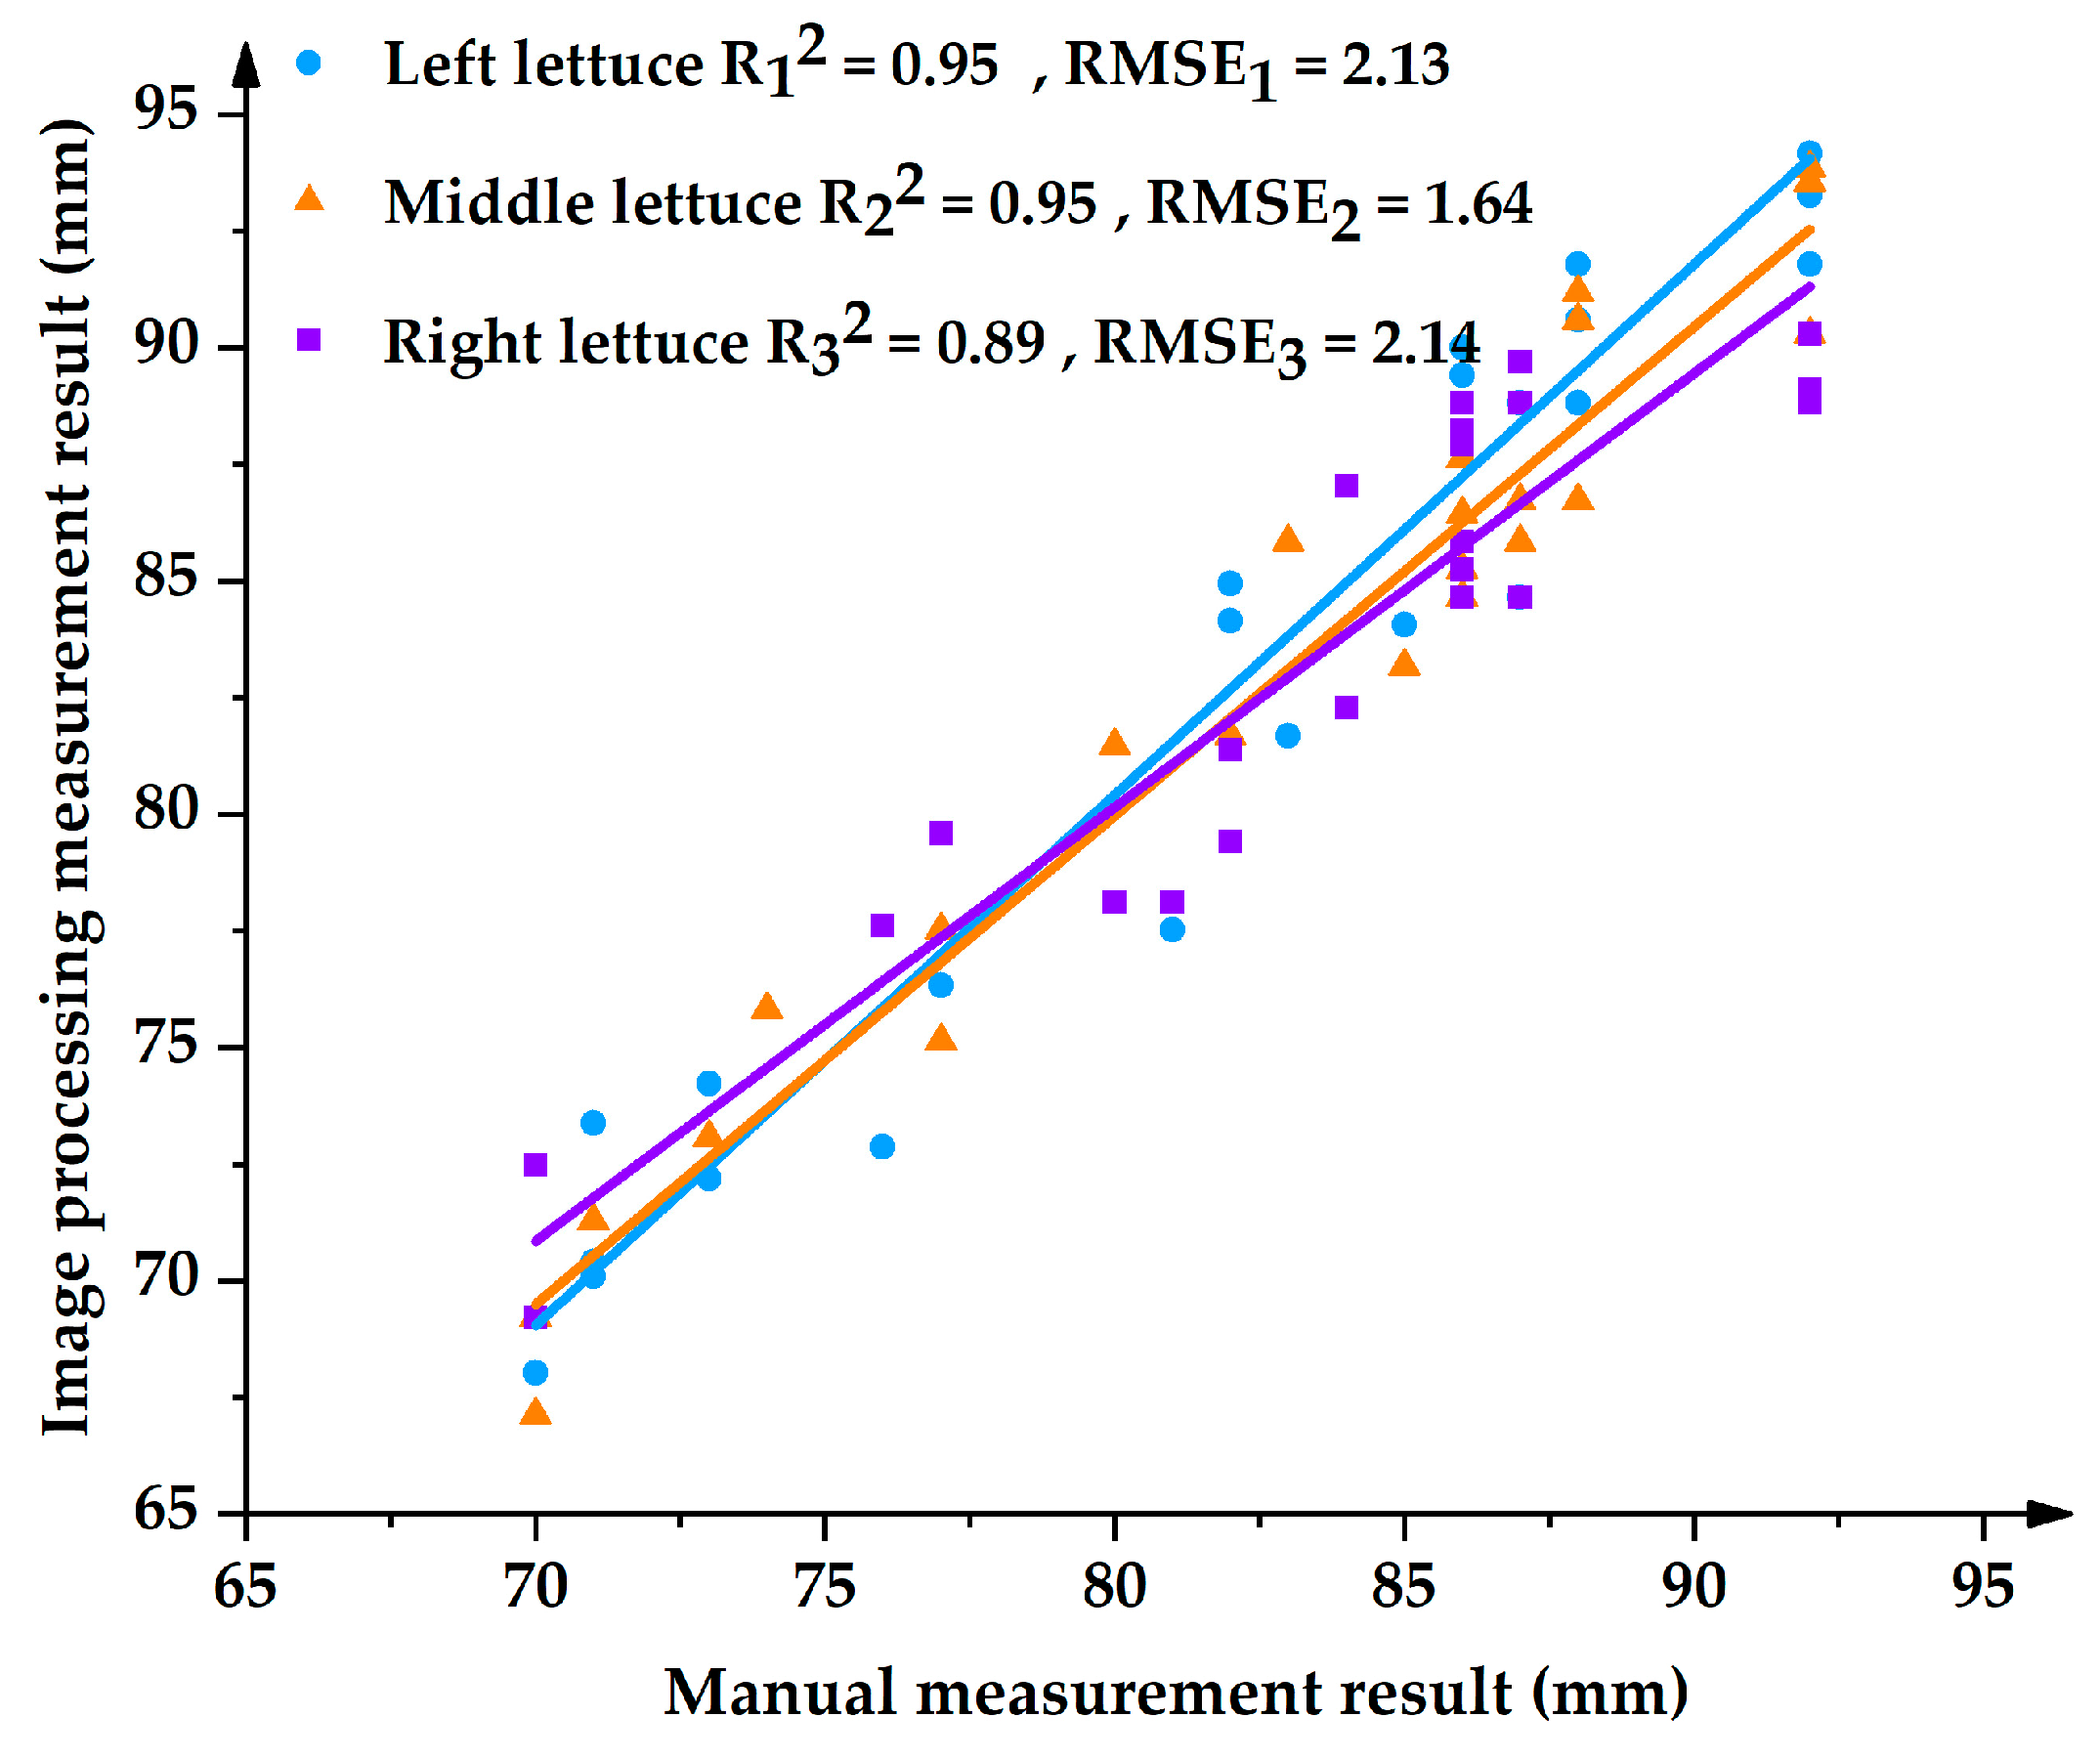
The fitting effects of the different functions for the lettuces’ upper contour are shown in Table 1, and a total of sixty lettuces (sixty images) were used to test the fitting effect. These functions included the quadratic function, cubic function, and sine function. The R2 of the fitting functions was 0.85–0.98, and the RMSE was 3.71–8.83 mm. The results indicated that the fitting effect of the three functions was suitable for lettuces’ contours.
The linear regression results of the image processing and manual measurements for leaves expansion size are shown in Figure 15. The quadratic function had the maximum RQ2 (0.89) and the minimum RMSEQ (3.50 mm). This showed that the leaves expansion size calculated using the quadratic function was the closest to the manual measurement value. Figure 16 shows the statistical results of the relative error for the lettuces’ leaves expansion size measurements. In the measurements of the three functions, the maximal relative error was 9.31%, and the mean relative error was 3.26%. The mean relative error was close to that of Ma et al. [27], who measured the leaves expansion size of a single lettuce using the lettuce’s bounding rectangle. The mean relative error of the quadratic function was 2.42%, which was lower than that of both the cubic (2.98%) and sine functions (4.36%). This indicated that the measurement effect of leaves expansion size using the quadratic function was the best among the three fitting functions. According to the analysis in Figure 15 and Figure 16, the quadratic function was used to measure the leaves expansion size of lettuces in this study. Figure 17 shows a case of lettuce leaves expansion size measurement using the quadratic function.
(2)
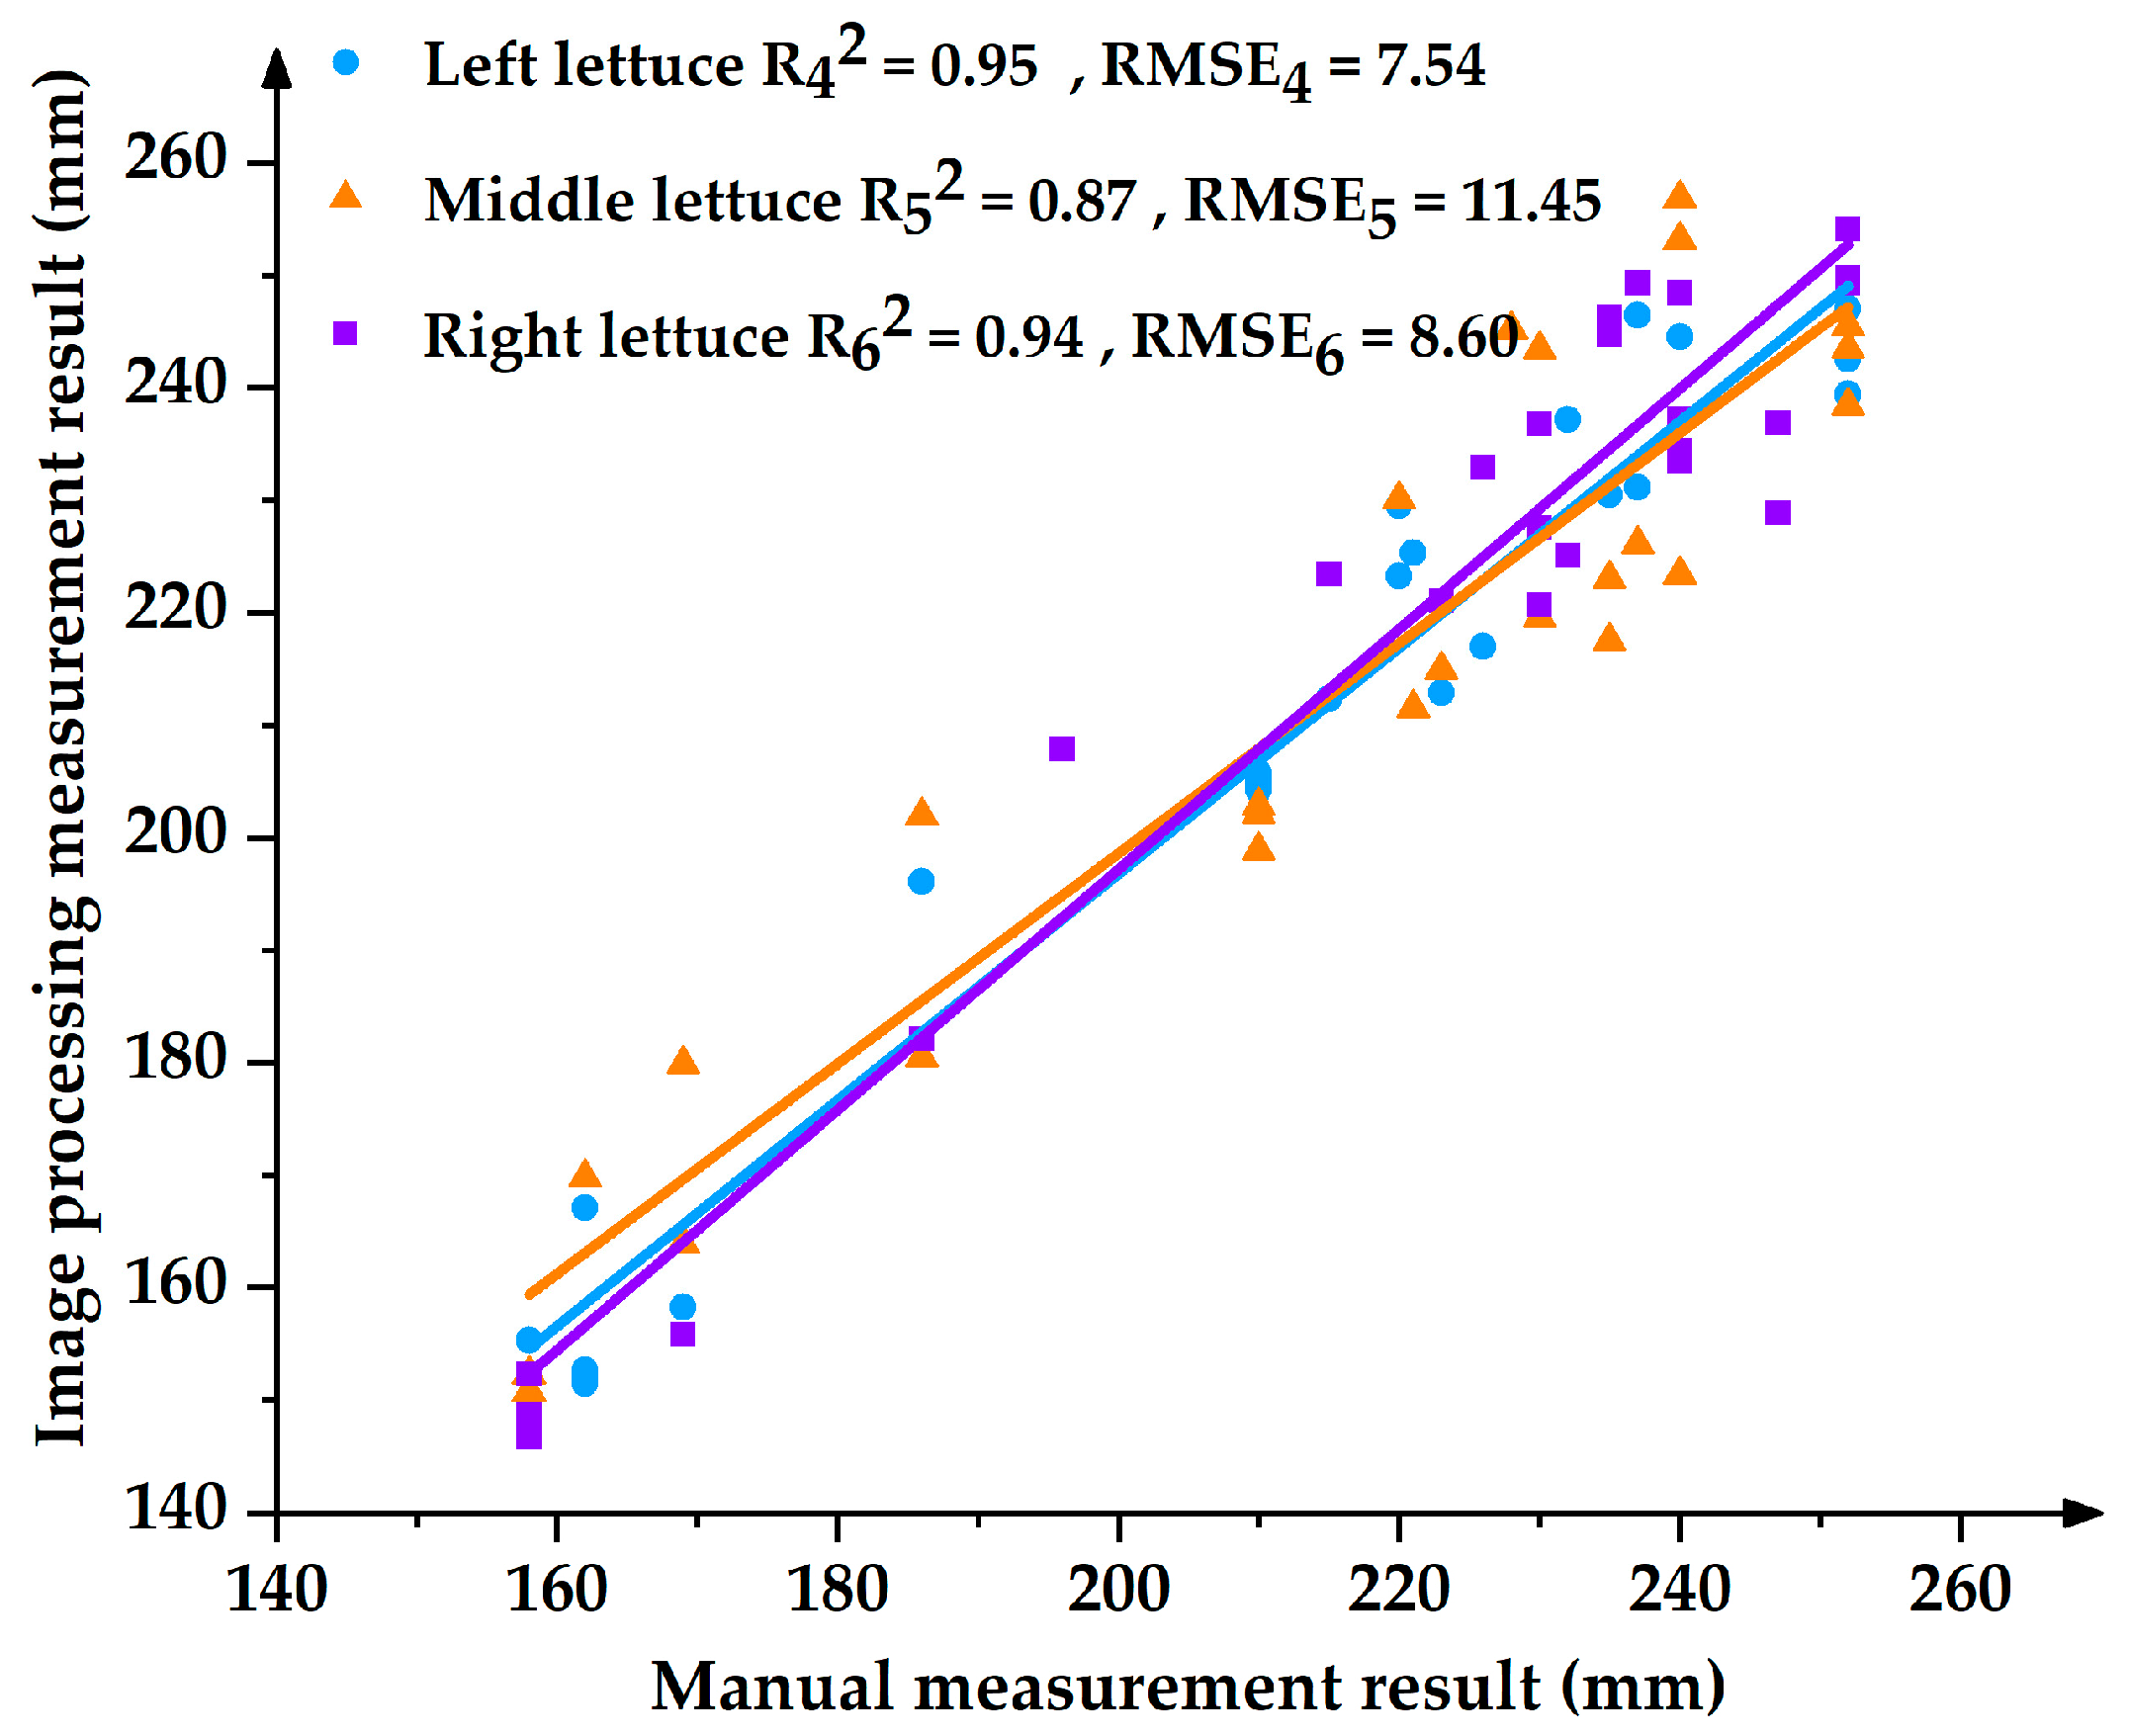
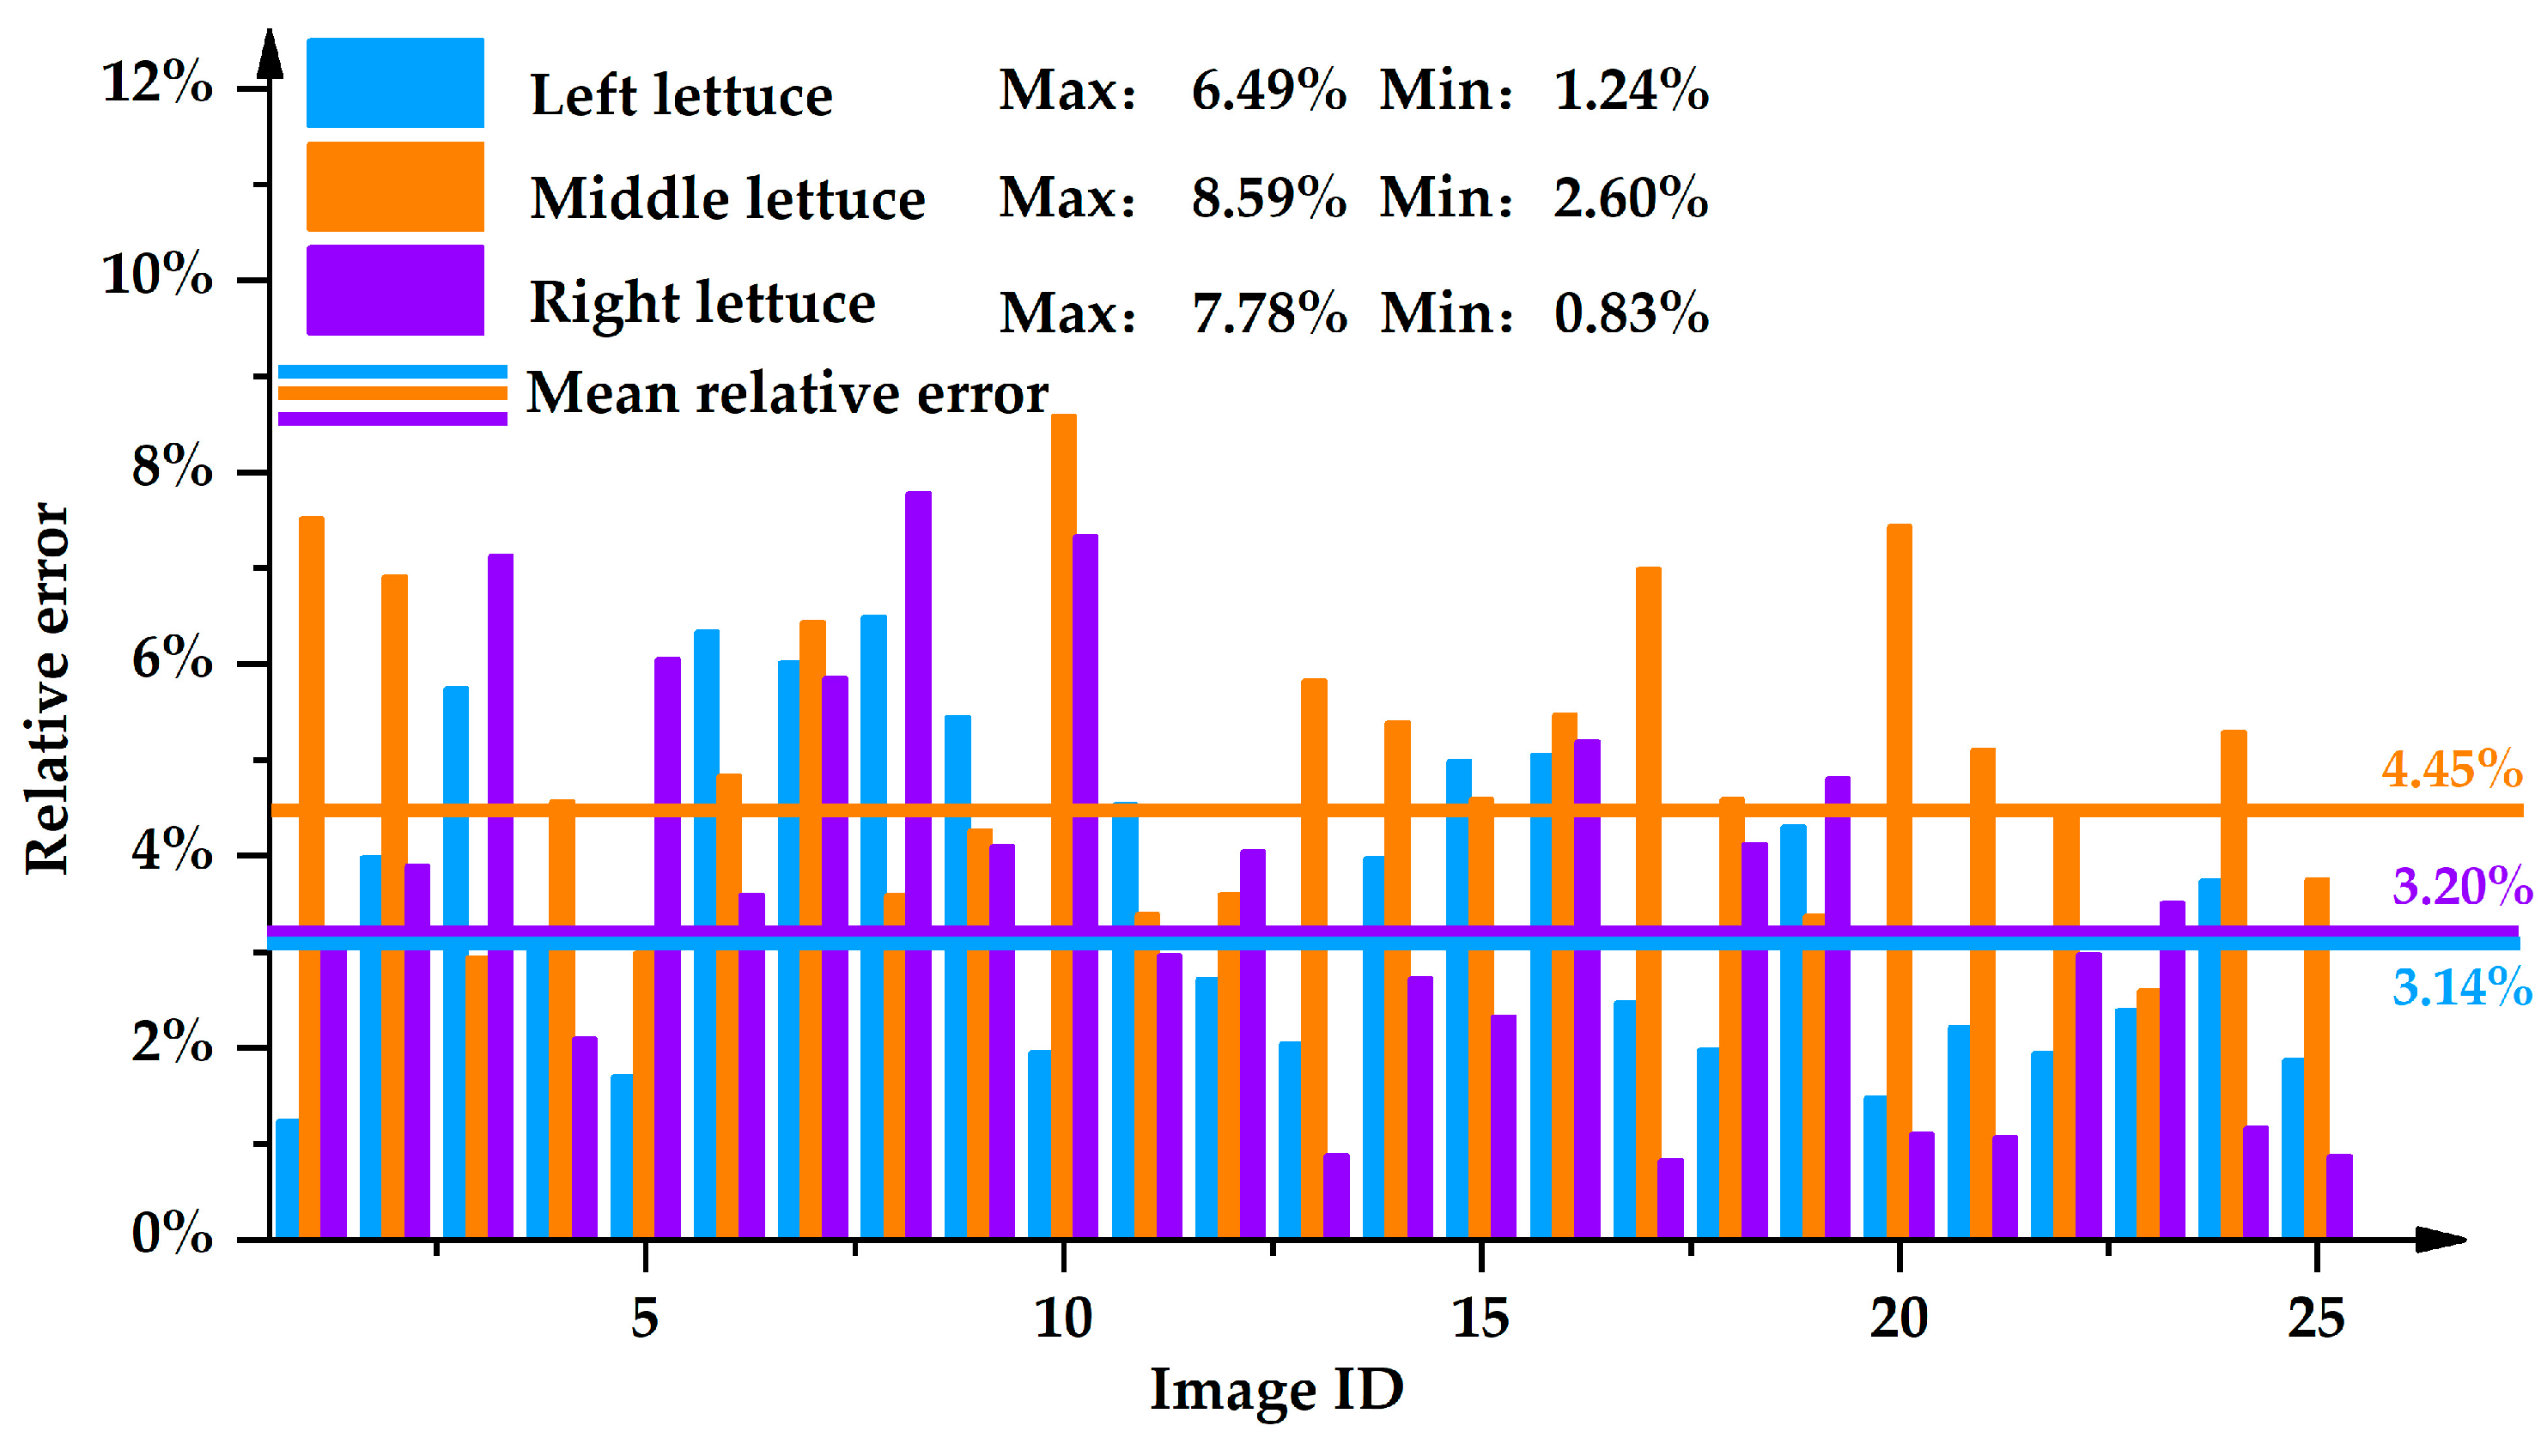
The Measurement Effect of the Quadratic Function for Lettuce Leaves Expansion Size in Different Positions
Figure 18 shows a case of leaves expansion size measurement using the quadratic function. The linear regression results of the image processing and manual measurements for seventy-five lettuces’ leaves expansion size are shown in Figure 19. The R2 of the linear regressions for the middle lettuces was 0.87, which was the lowest in the three positions. The RMSE5 of the middle lettuces was 11.45 mm, which was less than the values for the left (7.54 mm) and right lettuces (8.60 mm). This showed that the image processing measurements of both the left and right lettuces were closer to the manual measurement of the lettuces’ leaves expansion size. This phenomenon was caused by the lower number of pixel points for the middle lettuce’s upper contour (i.e., the fact that the upper contour of the middle lettuce might be covered by the left and right lettuces).
Figure 20 shows the relative errors of the lettuces’ leaves expansion size measurements. The maximal relative error was 8.59%, and the mean relative error was 4.06%. The mean relative error was close to that (3.3%) of Ma et al., who measured the leaves expansion size based on a lettuce’s bounding rectangle [27]. The mean relative error of the middle lettuces was 4.45%, which was higher than that of both the left (3.14%) and right lettuces (3.20%). This showed that the leaves expansion size measurement of the middle lettuce was the worst in the images, which was consistent with the R2 and RMSE in Figure 19. This phenomenon was caused by the fact that the planting plate’s upper surface was set as the measuring point of the middle lettuces, as shown in Figure 9, which might not reflect the real position of the leaves expansion size. The relative errors of both the left and right lettuces were higher than that of the single lettuce, as shown in Figure 16, and were caused by image distortion and the overlapping leaves of adjacent lettuces.

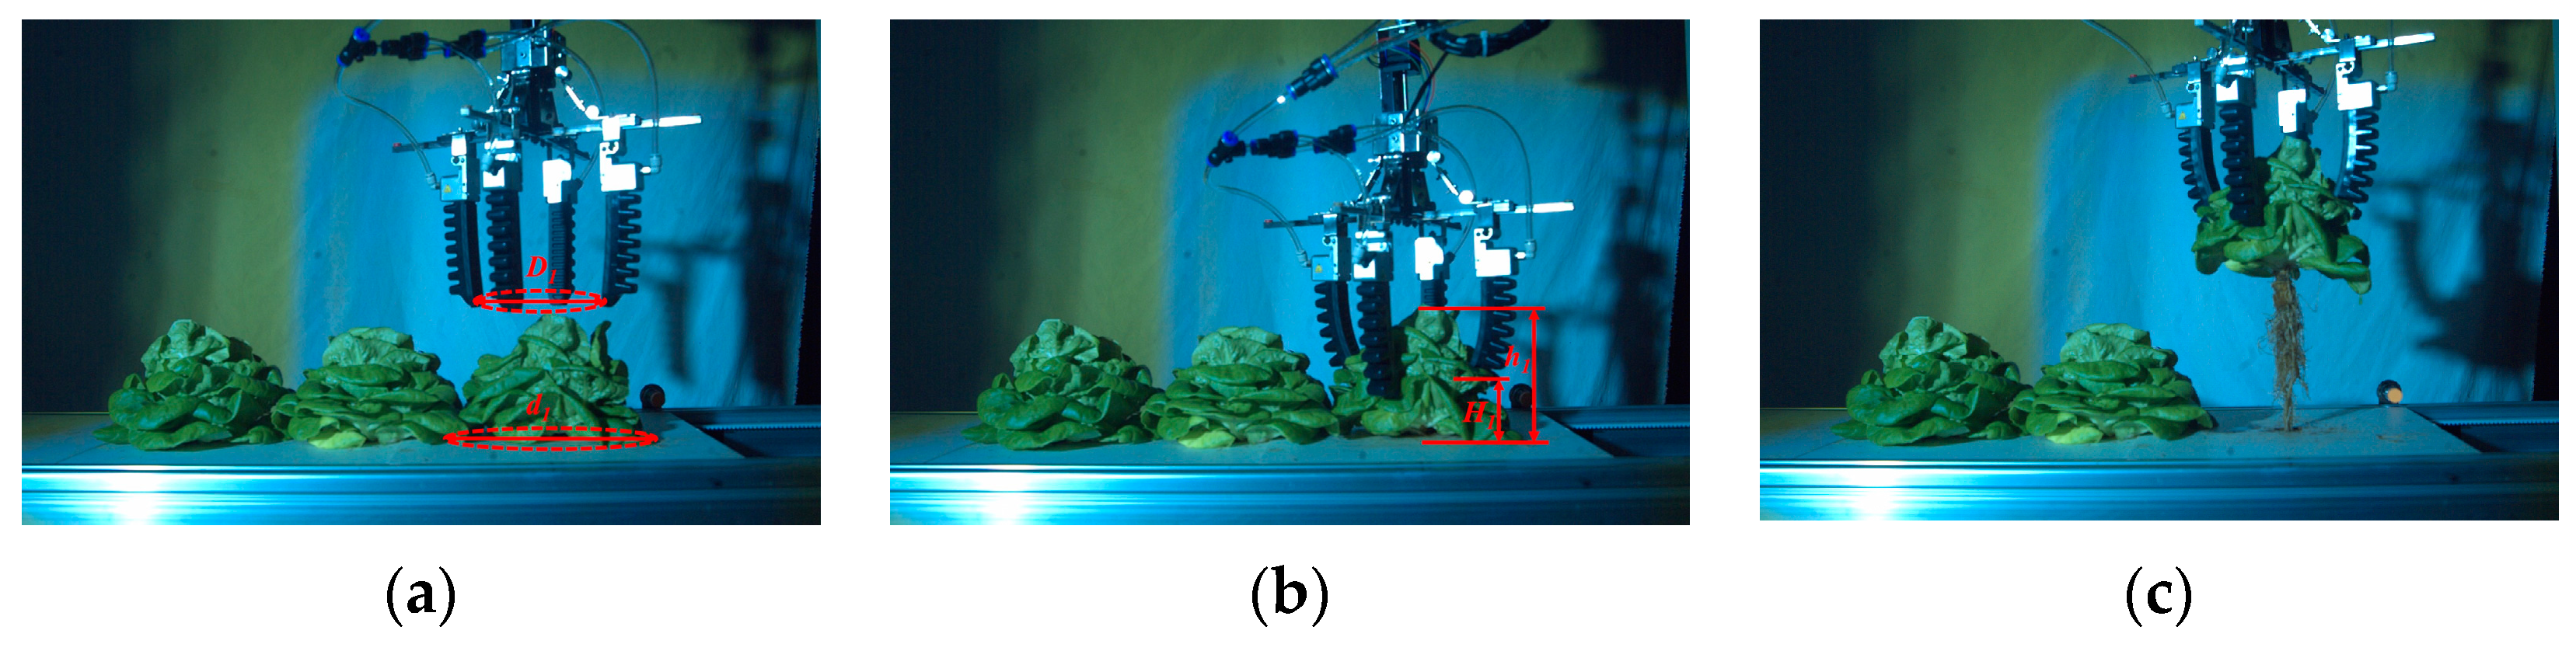
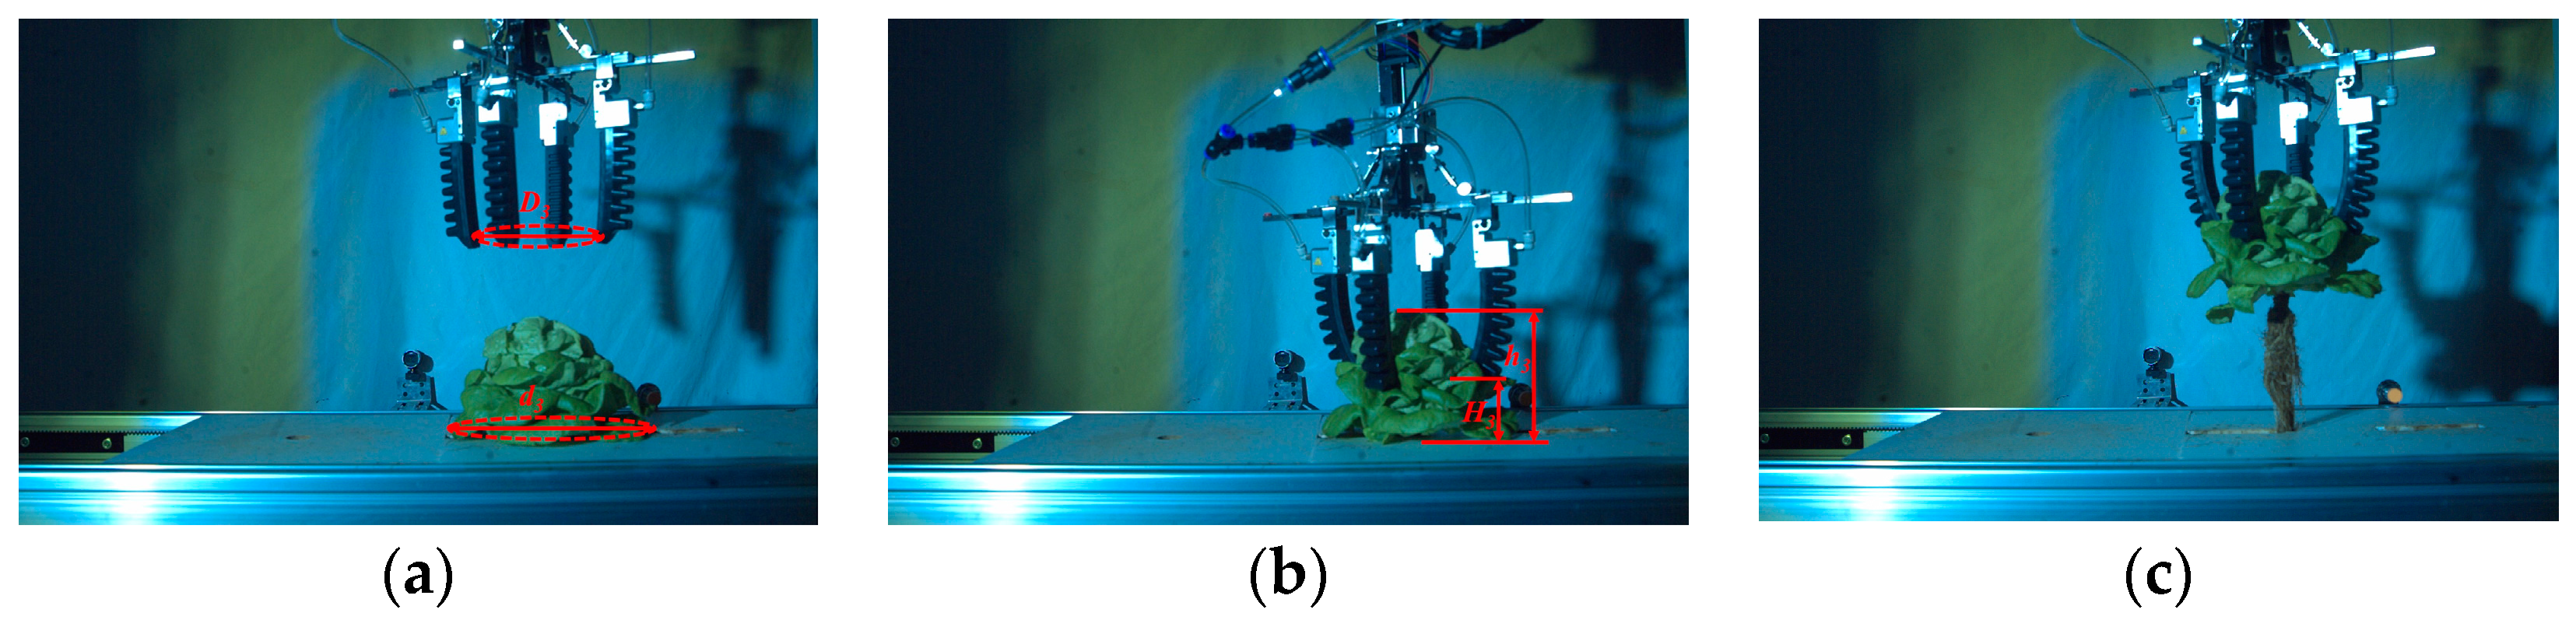
4.2. Verification Test of Intelligent and Continuous Harvesting

According to the measurement results of the lettuce height and leaves expansion size, the effect of intelligent and continuous harvesting on the lettuces was verified. Figure 21 shows a case of lettuce height and leaves expansion size measurement in the verification tests. Figure 22, Figure 23 and Figure 24 show the intelligent and continuous harvesting process of three lettuces, where the main process of harvesting was recorded using a high-speed camera. Because the LifeCam and high-speed camera were located on both sides of the conveyor belt, the original image in Figure 21 shows the opposite view to the high-speed camera image in Figure 22, Figure 23 and Figure 24. Figure 22a, Figure 23a and Figure 24a show the adjustment of the grabbing diameter for leaves expansion size, and Figure 22b, Figure 23b and Figure 24b show the adjustment of the grabbing height. During the continuous harvesting process, the left lettuce was harvested first, and the right lettuce was harvested last. The fingers might grab the overlapping leaves when grabbing the left and right lettuces, which will influence the harvesting success rate and leaves’ injured area. The overlapping leaves of the middle lettuce (Figure 22b) and right lettuce (Figure 23b) might be injured due to repeated grabbing.
Table 2 shows the harvesting success rate and injured area in the verification tests. The left lettuce’s mean relative error of leaves expansion size was lower than that of the middle lettuce (Figure 20); therefore, the harvesting success rate of the left lettuce (94%) was higher than that of the middle lettuce. The left lettuce was grabbed first, as shown in Figure 22, and the leaves were not injured repeatedly by fingers. Thus, the injured leaves area of the left lettuce (192.6 mm2) was better than the outcomes for the other positions shown in the images, and the injured area was closed to that (186 mm2) of Ma et al. [27]. The injured leaves area (228.1 mm2) and harvesting success rate (91%) of the middle lettuce were the worst, caused by both the repeated grabbing (Figure 22b and Figure 23b) and the fact that the middle lettuce had the highest mean relative error in the leaves expansion size measurement. The mean relative errors of both the left and right lettuces’ leaves expansion size were lower than the value of the middle lettuce, and the right lettuce was harvested last, with no influence of an adjacent lettuce. Thus, the harvesting success rate for the right lettuce was the highest (96%), while the overlapping leaves of the right lettuce could be grabbed by the fingers twice (Figure 23b and Figure 24b); hence, the injured leaves area of the right lettuce (205.6 mm2) was worse than that of the left lettuce.

5. Conclusions

1.
A measuring method of lettuce height was proposed. The maximal relative error of the lettuce height measurement was 5.58%, and the average relative error was 2.14%. The relative errors of the lettuce height for the left, middle, and right lettuces were 2.20%, 1.46%, and 2.06%, respectively.
2.
The upper contour of the lettuces was fitted to different functions, and the fitting effect of the quadratic function was the best among the quadratic, cubic, and sine functions. The quadratic function was used to measure the leaves expansion size of the lettuces. The maximal relative error of leaves expansion size was 8.59%, and the average relative error was 4.03%. The relative errors of leaves expansion size for the left, middle, and right lettuces were 3.14%, 4.45%, and 3.20%, respectively.
3.
The lettuce harvesting effects were verified according to the visual measurement results. The harvesting success rates of the left, middle, and right lettuces were 94%, 91%, and 96%, respectively. The injured leaves areas of the left, middle, and right lettuces were 192.6 mm2, 228.1 mm2, 205.6 mm2, respectively.

Author Contributions

Conceptualization, Y.M. and X.J.; methodology, Y.M. and Y.Z.; software and code, Y.Z. and X.L.; validation, X.L., C.Q. and H.W.; data analysis, Y.Z. and X.J.; writing, Y.Z., H.W., and C.Q.; project administration, Y.M. and X.J. All authors have read and agreed to the published version of the manuscript.

Funding

This study was supported by the National Key Research and Development China Project (2021YFD2000700), and the National Natural Science Foundation of China (52105252).

Conflicts of Interest

The authors declare no conflict of interest.

References

  1. Razmjooei, Z.; Etemadi, M.; Eshghi, S.; Ramezanian, A.; Mirazimi Abarghuei, F.; Alizargar, J. Potential Role of Foliar Application of Azotobacter on Growth, Nutritional Value and Quality of Lettuce under Different Nitrogen Levels. Plants 2022, 11, 406. [Google Scholar] [CrossRef]
  2. Zhang, L.; Su, W.; Tao, R.; Zhang, W.; Chen, J.; Wu, P. RNA sequencing provides insights into the evolution of lettuce and the regulation of flavonoid biosynthesis. Nat. Commun. 2017, 8, 2264. [Google Scholar] [CrossRef]
  3. Cui, Y.; Wang, W.; Wang, M.; Ma, Y.; Fu, L. Effects of cutter parameters on shearing stress for lettuce harvesting using a specially developed fixture. Int. J. Agric. Biol. Eng. 2021, 14, 152–158. [Google Scholar] [CrossRef]
  4. Suo, R.; Wang, W.; Ma, Y.; Fu, L.; Cui, Y. Effect of different root lengths for retaining freshness of hydroponic lettuce. J. Agric. Food Res. 2021, 4, 100131. [Google Scholar] [CrossRef]
  5. Ma, Y.; Xu, C.; Cui, Y.; Fu, L.; Liu, H.; Yang, C. Design and Test of Harvester for Whole Hydroponic Lettuce with Low Damage. Trans. CSAM 2019, 50, 162–169. [Google Scholar]
  6. Fu, L.; Feng, Y.; Wu, J.; Liu, Z.; Gao, F.; Majeed, Y.; Al-Mallahi, A.; Zhang, Q.; Li, R.; Cui, Y. Fast and accurate detection of kiwifruit in orchard using improved YOLOv3-tiny model. Precis. Agric. 2020, 22, 754–776. [Google Scholar] [CrossRef]
  7. Xie, C.; Yang, C. A review on plant high-throughput phenotyping traits using UAV-based sensors. Comput. Electron. Agric. 2020, 178, 105731. [Google Scholar] [CrossRef]
  8. Subramanian, R.; Spalding, E.P.; Ferrier, N.J. A high throughput robot system for machine vision based plant phenotype studies. Mach. Vis. Appl. 2012, 24, 619–636. [Google Scholar] [CrossRef]
  9. Kolhar, S.; Jagtap, J. Plant trait estimation and classification studies in plant phenotyping using machine vision—A review. Inf. Process. Agric. 2023, 10, 114–135. [Google Scholar] [CrossRef]
  10. Tian, Z.; Ma, W.; Yang, Q.; Duan, F. Application status and challenges of machine vision in plant factory—A review. Inf. Process. Agric. 2022, 9, 195–211. [Google Scholar] [CrossRef]
  11. Li, Z.; Guo, R.; Li, M.; Chen, Y.; Li, G. A review of computer vision technologies for plant phenotyping. Comput. Electron. Agric. 2020, 176, 105672. [Google Scholar] [CrossRef]
  12. Liu, Y.; Yuan, H.; Zhao, X.; Fan, C.; Cheng, M. Fast reconstruction method of three-dimension model based on dual RGB-D cameras for peanut plant. Plant Methods 2023, 19, 17. [Google Scholar] [CrossRef] [PubMed]
  13. Stilla, U.; Xu, Y. Change detection of urban objects using 3D point clouds: A review. ISPRS J. Photogramm. Remote Sens. 2023, 197, 228–255. [Google Scholar] [CrossRef]
  14. Xiang, L.; Wang, D. A review of three-dimensional vision techniques in food and agriculture applications. Smart Agric. Technol. 2023, 5, 100259. [Google Scholar] [CrossRef]
  15. Hu, Y.; Wang, L.; Xiang, L.; Wu, Q.; Jiang, H. Automatic Non-Destructive Growth Measurement of Leafy Vegetables Based on Kinect. Sensors 2018, 18, 806. [Google Scholar] [CrossRef] [PubMed]
  16. Zhang, Y.; Li, M.; Li, G.; Li, J.; Zheng, L.; Zhang, M.; Wang, M. Multi-phenotypic parameters extraction and biomass estimation for lettuce based on point clouds. Measurement 2022, 204, 112094. [Google Scholar] [CrossRef]
  17. Petropoulou, A.S.; van Marrewijk, B.; de Zwart, F.; Elings, A.; Bijlaard, M.; van Daalen, T.; Hemming, S. Lettuce Production in Intelligent Greenhouses-3D Imaging and Computer Vision for Plant Spacing Decisions. Sensors 2023, 23, 2929. [Google Scholar] [CrossRef]
  18. Li, Z.; Zhao, Y.; Yang, P.; Wu, Y.; Li, Y.; Guo, R. Review of Research on Fish Body Length Measurement Based on Machine Vision. Trans. CSAM 2021, 52, 207–218. [Google Scholar]
  19. Zhong, Y.; Gou, R.; Hu, H. Calculation of the relative distortion coefficient about camera. Opt. Tech. 2002, 28, 381–383. [Google Scholar]
  20. Yang, W.; Xu, X.; Duan, L.; Luo, Q.; Chen, S.; Zeng, S.; Liu, Q. High-throughput measurement of rice tillers using a conveyor equipped with x-ray computed tomography. Rev. Sci. Instrum. 2011, 82, 025102. [Google Scholar] [CrossRef]
  21. Iyer-Pascuzzi, A.S.; Symonova, O.; Mileyko, Y.; Hao, Y.; Belcher, H. Imaging and analysis platform for automatic phenotyping and trait ranking of plant root systems. Plant Physiol. 2010, 152, 1148–1157. [Google Scholar] [CrossRef]
  22. Ishikawa, T.; Hayashi, A.; Nagamatsu, S.; Kyutoku, Y.; Dan, I. Classification of Strawberry Fruit Shape by Machine Learning. Int. Arch. Photogramm. Remote Sens. Spat. Inf. Sci. 2018, XLII-2, 463–470. [Google Scholar] [CrossRef]
  23. Green, J.M.; Appel, H.; Rehrig, E.M.; Harnsomburana, J.; Chang, J.-F.; Balint-Kurti, P.; Shyu, C.-R. PhenoPhyte: A flexible affordable method to quantify 2D phenotypes from imagery. Plant Methods 2012, 8, 45. [Google Scholar] [CrossRef] [PubMed]
  24. Li, H.; Dong, W.; Li, Z.; Cao, X.; Tan, S.; Qi, L. Smartphone application-based measurements of stem-base width and plant height in rice seedling. Comput. Electron. Agric. 2022, 198, 107002. [Google Scholar] [CrossRef]
  25. Gupta, C.; Tewari, V.K.; Machavaram, R.; Shrivastava, P. An image processing approach for measurement of chili plant height and width under field conditions. J. Saudi Soc. Agric. Sci. 2022, 21, 171–179. [Google Scholar] [CrossRef]
  26. Liao, G.; Wang, X.; Jin, J.; Li, J. Potato Size and Shape Detection Using Machine Vision. MATEC Web Conf. 2015, 31, 15003. [Google Scholar] [CrossRef]
  27. Ma, Y.; Hu, P.; Jin, X.; Li, X.; Zhang, C.; Zhang, Y. Design and Experiment of Low Damage Flexible Harvesting Device for Hydroponic Lettuce. Trans. CSAM 2022, 53, 175–183, 210. [Google Scholar]
  28. Zhang, F.; Chen, Z.; Wang, Y.; Bao, R.; Chen, X.; Fu, S. Research on Flexible End-Effectors with Humanoid Grasp Function for Small Spherical Fruit Picking. Agriculture 2023, 13, 123. [Google Scholar] [CrossRef]
  29. Vrochidou, E.; Tsakalidou, V.N.; Kalathas, I.; Gkrimpizis, T.; Pachidis, T.; Kaburlasos, V.G. An Overview of End Effectors in Agricultural Robotic Harvesting Systems. Agriculture 2022, 12, 1240. [Google Scholar] [CrossRef]
  30. Goulart, R.; Jarvis, D.; Walsh, K.B. Evaluation of End Effectors for Robotic Harvesting of Mango Fruit. Sustainability 2023, 15, 6769. [Google Scholar] [CrossRef]
Figure 1. Hydroponic lettuces: (a) Front view. (b) Vertical view. Notes: di is the leaves expansion size. hi is the lettuce height.
Agronomy 13 01996 g001
Figure 2. Intelligent and continuous harvesting of hydroponic lettuces using image processing.
Agronomy 13 01996 g002
Figure 3. Image processing of hydroponic lettuces and adjustment of grabbing parameters.
Agronomy 13 01996 g003
Figure 4. Image acquisition system: (a) Camera position. (b) Calibration units.
Agronomy 13 01996 g004
Figure 5. Extracting the image foreground: (a) Original image. (b) ROI. (c) Binarization. (d) Hole filling.
Agronomy 13 01996 g005
Figure 6. Detection and segmentation methods of lettuces’ upper contours.
Agronomy 13 01996 g006
Figure 7. Detection and segmentation process of lettuces’ upper contours: (a) Lettuces’ upper contours. (b) Left lettuce. (c) Middle lettuce. (d) Right lettuce.
Agronomy 13 01996 g007
Figure 8. Lettuce height measurements of three hydroponic lettuces.
Agronomy 13 01996 g008
Figure 9. Leaves expansion size measurement methods of lettuces.
Agronomy 13 01996 g009
Figure 10. Method of leaves expansion size measurement for a single lettuce.
Agronomy 13 01996 g010
Figure 11. Intelligent and continuous harvesting of hydroponic lettuces: (a) Grabbing parameter adjustment. (b) Harvesting device.
Agronomy 13 01996 g011
Figure 12. Measurement results for lettuce height: (a) Measurement process of height. (b) Measurement effect of height.
Agronomy 13 01996 g012
Figure 13. Linear regression plots of image processing measurement result and manual measurement result for lettuce height.
Agronomy 13 01996 g013
Figure 14. Relative errors of lettuces’ height measurements.
Agronomy 13 01996 g014
Figure 15. Linear regression plots of image processing measurement result and manual measurement results for lettuce leaves expansion size.
Agronomy 13 01996 g015
Figure 16. Relative errors of lettuce leaves expansion size measurements.
Agronomy 13 01996 g016
Figure 17. Measurement results for lettuce leaves expansion size: (a) Measurement process of leaves expansion size. (b) Measurement effect of leaves expansion size.
Agronomy 13 01996 g017
Figure 18. Measurement result of lettuces’ leaves expansion size: (a) measurement process of leaves expansion size; (b) measurement effect of leaves expansion size.
Agronomy 13 01996 g018
Figure 19. Linear regression plots of image processing measurement result and manual measurement results for lettuces’ leaves expansion size.
Agronomy 13 01996 g019
Figure 20. Relative errors of lettuces’ leaves expansion size measurement.
Agronomy 13 01996 g020
Figure 21. Case of the size measurement of hydroponic lettuces: (a) Original image of lettuces. (b) Results of size measurement for lettuces.
Agronomy 13 01996 g021
Figure 22. Intelligent harvesting process of left lettuce: (a) Adjusting grabbing diameter. (b) Adjusting grabbing height. (c) Grabbing of a lettuce.
Agronomy 13 01996 g022
Figure 23. Intelligent harvesting process of middle lettuce: (a) Adjusting grabbing diameter. (b) Adjusting grabbing height. (c) Grabbing of a lettuce.
Agronomy 13 01996 g023
Figure 24. Intelligent harvesting process of right lettuce: (a) Adjusting grabbing diameter. (b) Adjusting grabbing height. (c) Grabbing of a lettuce.
Agronomy 13 01996 g024
Table 1. Fitting effect of lettuce’s upper contours.
FunctionQuadraticCubicSine
R20.87–0.980.87–0.980.85–0.98
RMSE/mm3.72–8.503.71–8.363.91–8.83
Table 2. Harvesting success rate and injured area.
Average ValueStandard DeviationCoefficient of Variation (%)
Injured leaves
area (mm2)
Left lettuce192.67.23.8
Middle lettuce228.112.45.4
Right lettuce205.69.14.4
Harvesting
success rate (%)
Left lettuce946.67.1
Middle lettuce919.410.4
Right lettuce964.95.1
Disclaimer/Publisher’s Note: The statements, opinions and data contained in all publications are solely those of the individual author(s) and contributor(s) and not of MDPI and/or the editor(s). MDPI and/or the editor(s) disclaim responsibility for any injury to people or property resulting from any ideas, methods, instructions or products referred to in the content.

