Abstract
Optimizing nitrogen (N) inputs is crucial for maximizing wheat yield and ensuring environmental sustainability. Wheat’s economic significance in India calls for a comprehensive evaluation of its ecological implications to develop a resilient production system. This study aimed to identify and evaluate ten wheat cultivars for their yield and N-use efficiency under varying nitrogen inputs (control (N0), half of the recommended nitrogen (N75), and the recommended nitrogen (N150)) using the surface application of neem-oil-coated urea. All N inputs were applied in three splits, basal, crown root initiation, and tillering stages, and an experiment was conducted in a split-plot design. The application of N150 gave the highest dry matter accumulation (DMA) at harvesting stage (AHS) (871 g m−2), seed/spike (60), grain yield (GY = 7.4 t ha−1), straw yield (SY = 8.9 t ha−1), harvest index (HI = 45.2%), protein (12.5%), and total uptake of N (TUN) (223 kg ha−1) by the cultivar ‘HD 3249’, being closely followed by the cultivar ‘HD3117’. Six cultivars (‘HD 3298’, ‘HD 3117’, ‘HD 3249’, ‘PBW 550’, ‘HD 3086’, ‘HD 2967’) out of the ten cultivars evaluated responded well to different input treatments with respect to the grain yield efficiency index (GYEI ≥ 1). Regarding N input, N75 and N150 recorded the highest increases in plant height, AHS (16.5%; 21.2%), dry matter accumulation (DMA) at 30 days after sowing (DAS) (37.5%; 64%), DMA-60 DAS (42%; 53%), DMA-90 DAS (39.5%; 52.5%), TILL-30 DAS (19.8%; 26.4%), TILL-60 DAS (33.3%; 44%), TILL-90 DAS (37.2%; 47.2%), seed/spike (8%; 10%), 1000-grain weight (7.8%; 12.2%), and protein content (23.3%; and 33%) when compared with N0. Furthermore, the application of N75 and N150 improved GY (72.1%; 142.6%), SY (61.1%; 110.6%), BY (65.5%; 123%), and HI by 4.4% and 9%, respectively, over N0. Nitrogen addition (N75 and N150) also significantly increased total nitrogen uptake (104.7%; 205.6%), respectively, compared to N0. The correlation analysis revealed a positive association among most of the crop parameters. Overall, our research results suggest that the cultivars ‘HD 3249’ and ‘HD 3117’ have the potential to be effective options for improving N utilization efficiency, grain yield, and GYEI in North-West India.
1. Introduction
To meet the demands of the expanding population, wheat cultivation requires the rigorous use of agricultural inputs, mainly nitrogen (N) fertilizers, to ensure satisfactory yields and superior grain quality. Although N fertilizer is indispensable for global food security, its depletion through various processes can lead to catastrophic environmental consequences such as soil acidification, nutrient runoff, eutrophication, reduced biological diversity, and greenhouse gas emissions [1]. The prevailing notion is that farm input, particularly inorganic N sources, has been introduced to assist farmers in enhancing crop productivity. However, the scarcity of knowledge and technological proficiency among farmers has resulted in an unwarranted application of these inputs, leading to unfavorable consequences [2,3]. An undeniable truth is that the use of high amounts of N fertilizers during crop growing periods is heavily dependent on copious amounts of nonrenewable energy sources [4]. According to estimates from UN-FAO (United Nations Food and Agriculture Organization), approximately 17% of global nitrogen fertilizer consumption is used in wheat production processes [5]. Utilization of such a massive amount unquestionably results in possible losses of a noteworthy quantity of applied N, coupled with extensive energy consumption during production processes and application in the field. Applying N fertilizer to meet plant demands in the absence or insufficiency thereof is a challenging task to accomplish. Undoubtedly, both of these parameters have the potential to inflict a negative effect on the quality and quantity of crop yields. Considering the persistent challenge of achieving efficient use of N in agriculture, the identification of genotypes that exhibit a high, medium, or low N response remains a promising approach. This strategy has the potential to improve the NUE of crops, which is currently below 50% [6]. However, more research is needed on the identification of genotypes that can thrive at specific N rates. A recent investigation has revealed that the latest cultivars have advanced yield output coupled with improved efficiency in nutrient utilization [7], indicating that it is expected that the efficiency of elevated nutrient use is augmented indirectly through the preference for high yield.
One crucial requirement for the identification, selection, and development of N-efficient germplasm is the availability of genetic diversity. Previous studies on wheat cultivars with N inputs reported that the genetic variation for NUE and its component traits was available [8,9,10,11]. Previous investigations have also shown that the use of N inputs in different seasons and years can result in diverse responses in yields and NUE among different wheat cultivars [12]. Thus, it is crucial to investigate genotypes with different N rates in particular soil and environmental conditions that enable farmers to enhance crop yields, curtail production expenses, and ensure sustainable agricultural practices. Looking at this point of view, the innovation and nurturing of N-efficient wheat cultivars can curtail the N utilized as input without compromising the grain output. The NUE of wheat has been estimated to be <60% [13,14,15], suggesting that nitrogen is not optimally used for grain production. Several strategies have been employed to increase the nitrogen use efficiency in cereal crops, viz., the use of slow-release N fertilizers, nitrification inhibitors, modified urea materials, including neem-coated urea, precise nitrogen management, leaf color charts, method, rate and time of N application, balanced fertilization [16], etc. In addition, the identification of nitrogen-efficient cultivars is yet another promising strategy to increase the NUE.
Depending on the cultivars grown, the N input of N80 (80 kg ha−1) to N120 (120 kg ha−1) can result in a range of 28.8 to 40 kg of wheat grains with an NUE of 1 kg of grain per kg of N applied [17]. The accumulation of phytomass and the concentration of chlorophyll in leaves are intrinsically linked to the efficiency of N utilization, which enables them to serve as indirect selection markers for cultivars that exhibit a high degree of efficiency in nitrogen utilization. Thus, the judicious application of an optimal dosage of N fertilizer, tailored to the specific cultivar, can be perceived as the main strategy for maximizing economic yields, improving N uptake, and improving the effectiveness of N utilization in wheat. Despite advances in breeding techniques, there are instances where superior cultivars are developed without considering their ability to sustain growth and productivity on soils with low fertility. These cultivars were specifically chosen for their ability to yield more under high-input fertilizer regimes. Therefore, to satisfy the growing global food demands of populations, it is crucial to constantly assess N-efficient varieties and choose breeds based on their genetic outputs. The objectives of this study were as follows: (i) to evaluate the growth, yield components, and N use efficiencies of wheat cultivars under control versus half and recommended N supplies; (ii) to investigate the differences between wheat cultivars in terms of economic yield and harvest index; and (iii) to screen the wheat cultivars based on grain yield efficiency index.
2. Materials and Methods
2.1. Location Overview
This field investigation was carried out at the research farm of the ICAR-Indian Agricultural Research Institute, New Delhi, in the North-West region of India (28°38’ N 77°10’ E). The research site experiences a typical pattern of mildly cold winters with temperatures ranging from 10.6 °C (minimum)to 27.1 °C (maximum) in first season (2020–21), and from 11.5 °C (minimum) to 26.9 °C (maximum) in the second season (2021–22), respectively, accompanied by a rainfall of 74.3 mm in the first season and 181.5 mm in the second season. Rainfall is concentrated mainly between November and April (Figure 1 and Figure 2). Agrometeorological statistics were retrieved from the NASA online repository (https://power.larc.nasa.gov/, accessed on 1 January 2023) using cutting-edge techniques. The experimental soil had a sandy clay loam texture, according to the USDA soil taxonomy. Before wheat sowing and after rice harvesting, the following soil characteristics were determined from a 0.02 m soil depth: soil pH 7.8 (1:25, soil: water), 0.4% organic carbon [18], 221 kg ha–1 available N [19], 15.23 kg ha–1 P [20], 252.2 kg ha–1 K [21].
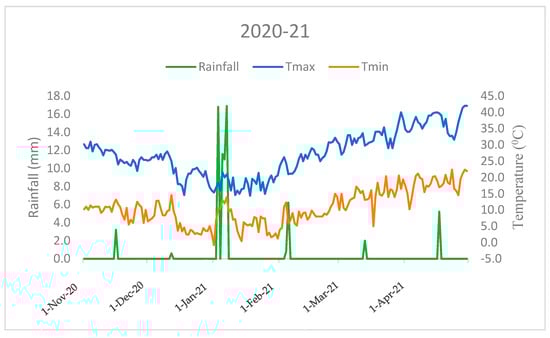
Figure 1.
Monthly mean temperature and total rainfall variations during the crop growing period (2020–21) in the ICAR-IARI, New Delhi (Nov: November; Dec: December, Jan: January; Feb: February; Mar: March; Apr: April).
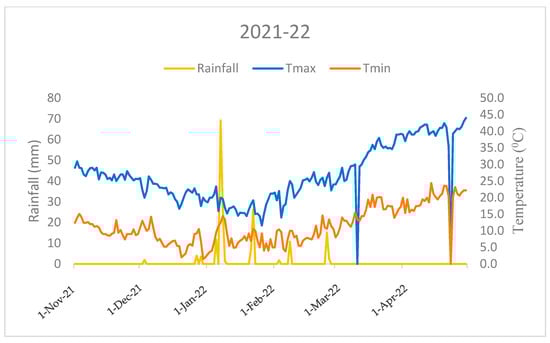
Figure 2.
Monthly mean temperature and total rainfall variations during the crop growing period (2021–22) in the ICAR-IARI, New Delhi (Nov: November; Dec: December, Jan: January; Feb: February; Mar: March; Apr: April).
2.2. Experimental Frameworks and Treatments
These field trials were conducted across the two successive growing seasons (2020/21 to 2021/22) and laid down under controlled flooded irrigation conditions. The measured quantity of water (5 cm) was applied at each irrigation after two days of the disappearance of the water from the field. The irrigation was avoided during the rainfall periods. The treatments (30) were allocated in a split-plot design, as specified by Gomez and Gomez [22]. The N inputs (main plots) were carried out with three N levels, in which portions of N0 (without external N application), N75 (75 kg N ha−1), and N150 (150 kg N ha−1) were utilized as neem-oil coated urea (46.6% N) throughout the trial. Half of the N dose was applied as a basal dose, 1/4th during the crown root initiation (CRI) phase (20–25 DAS days after sowing), and the remaining 1/4th during the tillering stage (TS) (40–45 DAS). Various doses of nitrogen were applied at rates of 0–0-0, 37.5–18.75–18.75 kg N ha−1, and 75–37.5–37.5 kg N ha−1, respectively, during sowing, CRI, and TS phases. In the subplot, a total of 10 wheat cultivars were sown, namely C1 (‘HD 3226’), C2 (‘HDCSW18’), C3 (‘HD 2967’), C4 (‘HD 3086’), C5 (‘HD 3249’), C6 (‘HD 2733’), C7 (‘PBW550’), C8 (‘PBW 343’), C9 (‘HD 3117’), and C10 (‘HD 3298’) (pictures of cultivars at three N inputs are available in the Supplementary Materials).
2.3. Crop Management
The wheat cultivars were sown at the beginning of November, and harvesting was carried out in the middle of April. Using a conventional seed drill, wheat was meticulously seeded at a rate of 100 kg ha–1, with rows spaced 22.5 cm apart. In addition to nitrogen (N) inputs (N0, N75, and N150), basal doses of phosphorus of 60 kg ha–1 (P60) and of potassium of 60 kg ha–1 (K60) were also applied in the experimental field. To control the growth of the weeds, manual hoeing was carried out.
2.4. Crop Parameters
Before crop harvesting, measurements of plant height, tiller numbers (m−2), dry matter accumulation (g m–2), seed/spike were carried out at the plot level. Similarly, the grain, straw, and biological yields were recorded at the plot level. The above-ground biomass yield data were subsequently used to compute the harvest index of the wheat cultivars. The chlorophyll content in the leaves of wheat cultivars was measured at 30, 60, and 90 DAS (days after sowing) by the SPAD 502 chlorophyll meter. For recording the SPAD data of chlorophyll, fully expanded upper leaves were chosen from the 15 different plants in the plot. For computing the protein content in wheat cultivars, the N concentration in grain was multiplied by 5.70 (the conversion factor) [23], and 1000-seed weight was measured with a weighting machine.
2.5. Computations of Related Metrics
Total uptake of nitrogen (TUN) = (TUNg + TUNs);
TUNg = Total uptake of N in grain; TUNs = Total uptake of N in straw;
Nitrogen grain productivity efficiency (NUEg) = (GYPua/TNApu);
GYPua = Grain yield per unit area, TNApu = total N accumulation per unit area;
Nitrogen harvest index = (NUG/NUG + NUS);
NUG = N uptake in grain, NUS = N uptake in straw.
Grain yield efficiency index (GYEI):
GYEI serves as the primary criterion for categorizing cultivars as inefficient or efficient in N utilization. In screening experiments, grain yield remains the most effective measure for genotype evaluation. The GYEI enables the distinction of genotypes into categories: those that exhibit high-yielding, robust, and resourceful characteristics, and those that show low-yielding, fragile, and nutrient-inefficient cultivars [24].
GYEI = (wheat crop grain output when subjected to low N input/average grain output of 10 wheat cultivars when subjected to low N input) × (wheat crop grain output when subjected to high N input/average grain output of 10 wheat cultivars when subjected to high N input).
The classification of GYEI-based wheat cultivars was as follows: efficient (≥1), moderate efficient (0.5–1), and inefficient (≤0.5).
2.6. Statistical Analysis
Statistical analysis was performed using the latest version of open-access R Studio software, which is version 2023.03.1-446 [25]. The package ‘agricolae’ was used for data analysis, while the package ‘metan’ (multi-environment trial analysis) was used to make the Pearson’s correlation coefficient (PCC) matrix. The PPC matrix shows the association between different variables.
3. Results
3.1. Plant Height
The influence of the N × C interaction (nitrogen × cultivar, NCI) on plant height was found to be statistically significant at all growth stages (30, 60, 90 DAS, and harvesting stage) (Table 1). The tallest plants were recorded across the N inputs in cultivar ‘HD 3249’ (124.1 cm). Except for HD 3226, all remaining cultivars responded up to N levels N150. The sequence of genotypes in terms of decreasing plant height at harvesting stage was as follows: ‘HD 3249’ > ‘HDCSW 18’ > ‘HD 3086’ > ‘PBW 550’ ≥ ‘HD 3298’ > ‘HD 3117’ > ‘HD 3226’ > ‘PBW 343’ > ‘HD 2967’ > ‘HD 2733’.

Table 1.
Effect of nitrogen × cultivar interaction on plant height (cm) at 30, 60 and 90 DAS of wheat.
3.2. Number of Tillers
Among all cultivars, ‘PBW 550’ gave the highest number of tillers at all stages of growth (30, 60, and 90 DAS), followed closely by ‘HD 3117’ (Table 2). The order of decreasing tiller count (30 DAS), listed in descending order, was as follows: ‘PBW 550’ > ‘HD 3117’ > ‘HD 3249’ > ‘HD 3226’ > ‘HDCSW 18’ > ‘HD 2733’ ≥ ‘PBW 343’ > ‘HD 3298’ > ‘HD 2967’ > ‘HD 3086’. Similarly, the descending trends in tiller count at 60 and 90 DAS was ‘PBW 550’ > ‘HD 3117’ ≥ ‘HD 3249’ > ‘HD 3226’ > ‘HDCSW 18’ > ‘HD 2733’ > ‘PBW 343’ > ‘HD 3298’ > ‘HD 2967’ > ‘HD 3086’ and ‘PBW 550’ > ‘HD 3117’ > ‘HD 3249’ > ‘HD 3226’ > ‘HDCSW 18’ > ‘HD 2733’ ≥ ‘PBW 343’ > ‘HD 3298’ > ‘HD 2967’ > ‘HD 3086’. Throughout all growth stages, all genotypes showed a positive response up to N150, with the maximum number of tillers being observed at 90 DAS.
Table 2.
Effect of nitrogen × cultivar interaction on tillers m−2 at 30, 60, 90 DAS and seed/spike of wheat.
3.3. Chlorophyll Content
The chlorophyll (chl) status of leaves at different growth stages was determined by measuring the SPAD (soil–plant analysis development) meter (Table 3). The genotype ‘PBW 343’ had a higher SPAD value at all the growth stages, with values of 30 DAS = 34.7, 60 DAS = 42.9, and 90 DAS = 46.3, and was statistically on par with the performance of genotype ‘HD 3298’ with corresponding values of 30 DAS = 34.2, 60 DAS = 41.8, and 90 DAS = 45.7 (as shown in Table 2 and Table 3). The N × C interaction (NCI) effects on chl content were non-significant at all growth stages.
Table 3.
Effect of nitrogen input on chlorophyll content of wheat crop at different growth stages.
3.4. Grain Quality of Wheat
The effect of N inputs on the grain protein content (GPC) of wheat cultivars and other quality parameters, such as 1000 seed weight, are presented in Table 4. Across the 2 years of the study, the N × C interaction (NCI) on the parameters assessed (GPC, 1000-seed weight) was found to be statistically nonsignificant. The mean analysis indicated that the highest impact of N on quality parameters was noticeable in the GPC of the ‘HD 3249’ cultivar (12.6%) and the 1000-grain weight of the ‘HD 3298’ cultivar (42.7 g). The GPC and 1000-grain weight of the cultivar exhibited consistent and significant responses to increasing N rates, showing a positive correlation. The GPC increased from 9.1% in the absence of N to 11.3% with N75 and further to 12.2% with N150, as shown in Table 5. Similarly, the 1000-grain weight values followed a pattern, with a recorded value of 39.1 g in the absence of nitrogen, 42.2 g with N75, and reaching their pinnacle at 43.9 g with the highest N input, N150. Regardless of the variability of protein content and 1000-grain weight measurements obtained from different experiments conducted in diverse cultivars, the distinctions were not deemed statistically significant. The sequence of genotypes in terms of 1000-grain weight and GPC, listed in decreasing order, was as follows: ‘HD 3298’ ≥ ‘HD 3086’ ≥ ‘PBW 343’ ≥ ‘HD 2733’ > ‘HD 3117’ > ‘HD 2967’ ≥ ‘HD 3226’ ≥ ‘PBW 550’ ≥ ‘HD 3249’ > ‘HDCSW 18’ and ‘HD 3249’ ≥ ‘HD 3117’ > ‘HD 3086’ ≥ ‘HDCSW 18’ ≥ ‘HD 2733’ > ‘HD 3298’ > ‘PBW 343’ > ‘PBW 550’ ≥ ‘HD 2967’ ≥ ‘HD 3226’.
Table 4.
Effect of nitrogen input on grain weight, protein content (%) of wheat.
Table 5.
Effect of nitrogen × cultivar interaction on dry matter accumulation (g m−2) at 30, 60 and 90 DAS of wheat.
3.5. Wheat Grain Yield and Yield Components
The N × C (nitrogen × cultivar) interaction (NCI) effect on the wheat cultivars grain yield (GY) and yield components is shown in Table 2, Table 3, Table 4, Table 5 and Table 6. On average, the wheat crop yielded 2.4 tha–1 of GY, 3.9 tha–1 of straw yield (SY), and 6.3 tha–1 of biological yield (BY) and had a harvest index (HI) of 38.29% in the absence of nitrogen treatment (N0). However, in the presence of N75 treatment, the mean values increased to 4.2 tha–1 for GY, 6.2 tha–1 for SY, 10.4 tha–1 for BY, and 40% for HI. Similarly, under the N150 treatment, the mean values further increased to 5.9 tha–1 for GY, 8.1 tha−1 for SY, 14 tha–1 for BY, and 41.7% for HI. Among the wheat genotypes, ‘HD 3249’ exhibited the highest GY, SY, BY, and HI, while ‘HD 3226’ had the lowest grain yield (p ≤ 0.05). There was a significant increase in GY (72.1%; 142.6%), SY (61.1%; 110.6%), BY (65.5%; 123%), and HI (4.4%; 9%) with the application of N75 and N150 compared to N0. The genotypes were ranked according to their decreasing GY, SY, BY, and HI as follows: ‘HD 3249’ > ‘HD 3117’ > ‘PBW 550’ ≥ ‘HD 3086’ ≥ ‘HD 2967’ ≥ ‘HD 3298’ > ‘HD 2733’ > ‘HDCSW 18’ > ‘PBW 343’ > ‘HD 3226’; ‘HD 3249’ ≥ ‘HD 3117’ ≥ ‘HD 2967’ ≥ ‘HD 3086’ ≥ ‘PBW 550’ ≥ ‘HD 3298’ ≥ ‘HD 2733’ > ‘HDCSW 18’> ‘PBW 343’ ≥ ‘HD 3226’; ‘HD 3249’ ≥ ‘HD 3117’ ≥ ‘PBW 550’ ≥ ‘HD 2967’ ≥ ‘HD 3086’ ≥ ‘HD 3298’ ≥ ‘HD 2733’ > ‘HDCSW 18’ > ‘PBW 343’ > ‘HD 3226’ and ‘HD 3249’ > ‘HD 3117’ > ‘PBW 550’ > ‘HD 3086’ > ‘HD 2967’ > ‘HD 3298’ > ‘HD 2733’ > ‘HDCSW 18’ > ‘PBW 343’ > ‘HD 3226’.
Table 6.
Effect of nitrogen × cultivar interaction on grain yield, straw yield, biological yield, and harvest index of wheat.
The NCI interaction with yield and yield components was significant. Most cultivars showed a strong positive correlation between N input, yield, and its associated yield components. The highest GY (7.4 tha–1, 7 tha–1) was achieved in genotypes ‘HD 3249’ and ‘HD 3117’ when N150 splits were applied, indicating their superior response to the input regime. The genotype ‘HD 3249’ showed the best results among the cultivars in terms of seeds/spike (60), SY (8.9 tha–1), BY (16.3 tha–1), HI (45.2%), plant height (30 DAS = 38.2 cm, 60 DAS = 94.7 cm, 90 DAS = 119 cm, harvesting stage = 130 cm), and dry matter accumulation (DMA) (30 DAS = 106 g m−2, 60 DAS = 350 g m−2, 90 DAS = 871 g m−2) when the N management approach N150 splits was applied (Table 1, Table 2 and Table 5). The genotypes were arranged in descending order according to decreasing DMA, seed/spike and plant height, as follows: ‘HD 3249’ > ‘HD 3117’ > ‘HD 2967’ > ‘PBW 550’ > ‘HD 3298’ > ‘HD 3086’ > ‘HD 2733’ > ‘HDCSW 18’ > ‘PBW 343’ > ‘HD 3226’; ‘HD 3249’ > ‘HD 3117’ > ‘PBW 550’ > ‘HD 3086’ > ‘HD 2967’ >‘HD 3298’ > ‘HD 2733’ > ‘HDCSW 18’ > ‘PBW 343’ > ‘HD 3226’ and ‘HD 3249’ > ‘HDCSW 18’ > ‘HD 3086’ > ‘HD 3298’ ≥ ‘PBW 550’ > ‘HD 3117’ > ‘HD 3226’ > ‘PBW 343’ > ‘HD 2967’ > ‘HD 2733’.
3.6. Plant Nitrogen Uptake and Utilization
Total uptake of nitrogen (TUN) experienced a significant improvement concomitantly with the increased N inputs (Table 7). In contrast, raising N inputs significantly decreased both the N harvest index (NHI) and the N grain use efficiency (NUEg). Among all genotypes at N150 and mean N inputs, cultivars ‘HD 3249’ and ‘HD 3117’ performed better in terms of TUN and NHI; however, in terms of NUEg, ‘HD 2967’ and ‘PBW 550’ outperformed other cultivars. In terms of TUN, all cultivars responded up to N150 except two, namely ‘HD 3226’ and ‘HD 3117’. Similarly, in terms of NUEg, only four cultivars (‘HD 3226’, ‘HD 2967’, ‘HD 2733’, ‘PBW 550’) responded up to N150. The ‘HD 3226’ had lower TUN and NHI values. The variations in the cultivars N uptake and utilization can be attributed to the distinct genetic traits inherent in each genotype.
Table 7.
Effect of nitrogen × cultivar interaction on total uptake of N (TUN), nitrogen grain production efficiency (NUEg), nitrogen harvest index (NHI) of wheat.
3.7. Grain Yield Efficiency Index
This is a good measure in agronomic research to categorize the cultivars into three clusters or groups, viz., nitrogen use efficient, moderately nitrogen use efficient, and inefficient. Thus, GYEI ≥ 1 signifies highly N-use-efficient cultivars, GYEI = 1–0.5 signifies moderately N-use-efficient cultivars, and GYEI ≤ 0.5 denotes low N-use-efficient cultivars (Table 8, Figure 3). Among all the wheat cultivars, six wheat genotypes (‘HD2967’, ‘HD3298’, ‘HD 3117’, ‘PBW550’, ‘HD 3249’, and ‘HD 3086’) were classified as highly efficient N users. Furthermore, two cultivars (‘HDCSW 18’ and ‘HD 2733’) were classified as moderately efficient N users, while two cultivars (‘PBW 343’ and ‘HD 3226’) were considered inefficient N users.
Table 8.
Grain yield efficiency index (GYEI) of 10 wheat genotypes.
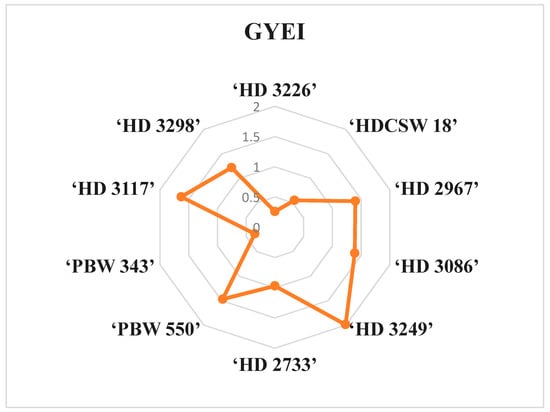
Figure 3.
Pictorial representation of mean grain yield efficiency index (GYEI) of ten wheat genotypes in radar charts under different N inputs grown over two years, 2020–21 and 2021–22.
3.8. Exploration of the Correlation among Various Agro-Morphological Traits of Wheat
The correlation between plant traits such as plant height (PH) at 30 days after sowing (30DAS), 60, 90 DAS (PH-30, PH-60, and PH-90), dry matter accumulation at 30, 60, 90 DAS (DMA-30, DMA-60, and DMA-90 DAS), tillers m−2 at 30, 60, 90 DAS (TILL-30, TILL-60, TILL90), chlorophyll reading taken from the soil plant analysis meter at 30, 60, 90 DAS (SPAD-30, SPAD-60 and SPAD-90), grain yield (GY), straw yield (SY), biological yield (BY), harvest index (HI), test weight (TW), seed/spike (SD/SP), test weight (TW), N harvest index (NHI), and total N uptake (TNU) was analyzed using the ‘Metan’ package of Pearson’s correlation coefficient (Figure 4). The SPAD-60 was significantly positively correlated with NHI at p < 0.01, the TILL-60 was significantly positively correlated with NHI at p < 0.01, the TILL0–60 was significantly positively correlated with NHI and SPAD-60 at p < 0.01, and the test weight was non-significantly negatively correlated with NHI at p < 0.05. The remaining agro-morphological parameters show a highly significant positive correlation with each other at p < 0.001.
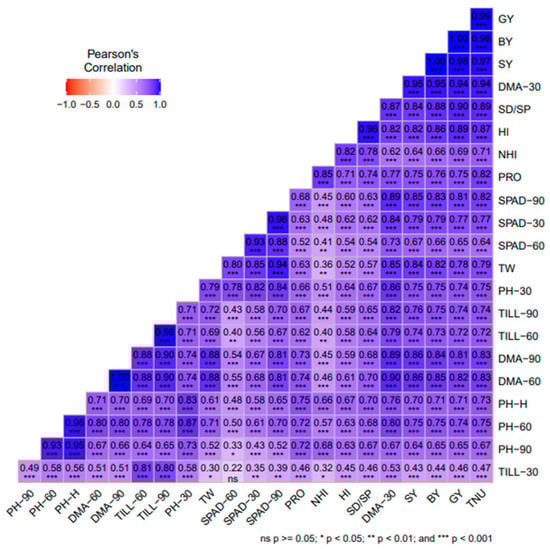
Figure 4.
Pearson’s correlation among agro-morphological traits/parameters of ten wheat genotypes under mean nitrogen inputs. The correlation coefficient (r values) was calculated from the mean of two years’ data from 2020–21 to 2021–22. *** = significance at p < 0.001, ** = significance at p < 0.01 and * = p < 0.05, respectively. DAS = days after sowing, plant height (PH) at 30 DAS, 60 DAS, 90 DAS (PH-30, PH-60, PH-90), dry matter accumulation at 30DAS, 60 DAS and 90DAS (DMA-30, DMA-60 and DMA-90 DAS), tillers m−2 at 30 DAS, 60 DAS, 90 DAS (TILL-30, TILL-60, TILL-90), chlorophyll reading taken from soil plant analysis carried out at 30 DAS, 60 DAS and 90 DAS (SPAD-30, SPAD-60 and SPAD-90); grain yield (GY); straw yield (SY); biological yield (BY); harvest index (HI); test weight (TW); seed/spike (SD/SP); nitrogen harvest index (NHI); total nitrogen uptake (TNU).
4. Discussion
Our scientific investigation aimed to assess the performance of wheat cultivars under different levels of nitrogen (N) inputs in the North-West region of India. The objective was to enhance both the economic yield and quality of the crops while also minimizing nitrogen losses to the environment. Nitrogen management strategies included the timing of application of N at the appropriate stages (three splits, namely the basal, CRI, and tillering stages) [26]. The comprehensive findings indicated that among all cultivars, ‘HD 3249’ and ‘HD 3117’ showed superior performance with N150-split treatments, resulting in higher GY and its components. Across N inputs, N150 resulted in the highest seed/spike, dry matter accumulation, and grain yield (GY) (Table 2, Table 4 and Table 6). However, plant traits responses to heterogeneous N inputs can vary depending on soil properties, crop genotypic constitution, agronomic management methodologies, and methodology circumstances throughout the entire course of the growth season [27]. Yano et al. [28] reported nonsignificant variations in GY regarding N sources and application timings. However, notable disparities in GY were observed when different N inputs were used. Our result aligns with the prevailing results that show a positive correlation between GY and N inputs [14]. A notable improvement in GY was observed up to the N input of N150 in certain cultivars. The N0 application did not show a significant increase in GY; however, a substantial increase in GY was observed when comparing the application rates of N75 and N150. Numerous studies have proven that the optimal N rate for wheat cultivation in North-West India can vary between 50 and 185 kg of N ha–1 to attain the desired GY [29]. Cultivar GY outcomes were dissimilar, likely due to the unique genetic potential of each cultivar, soil characteristics, and weather conditions prevalent during the conductance of field trials [30,31]. Some previous studies have shown that selecting phenotypes adapted to specific environmental conditions and considering early generation selection of partitioning traits, such as harvest index (HI) and GY, can lead to high HI and GY in wheat [32].
Fuertes-Mendizabal et al. [33] suggest that the amalgamation of an intensified N rate with delayed N application could induce the expansion of the crop canopy, increase photosynthetic efficiency, increase carbohydrate accumulation during the vegetative stages, and ultimately result in a boost in GY. Our study produced compelling results, suggesting that cultivars ‘HD 3249’ and ‘HD 3117’ exhibited notable improvements in yield when N150 was distributed between the split treatments of 75–37.5–37.5 kg N ha−1. These observations signify the remarkable potential of wheat for yield production. In particular, the application of N150 resulted in a higher number of spikes per square meter, SY, biological yield (BY), harvest index (HI), dry matter accumulation (DMA), and tiller production in most genotypes (Table 2, Table 4 and Table 6). However, the response varied in each wheat cultivar, as the capacity for N uptake is generally low during the initial growth season and rapidly increases during the vegetative growth phase. Based on studies conducted by Zhang et al. [34], the N input application at three times and two different times resulted in a 15% and 7% increase in GY compared to a single-dose application. Similarly, Singh et al. [35] reported that the increase in GY was feasible by applying 50% to 75% of N inputs at the sowing stage in loam soil, with urea spread/drilled in rows. Despite variations in N inputs and application timing, the utilization of N150 leads to a superior yield compared to the N rates of N75 and N0. The rationale behind this can be that NCU/NOCU is a slow-release type and undergoes gradual conversion to ammonia in soil, making it plantable over an extended period compared to N inputs N75 and N0. Singh et al. [36] reported that the use of NCU/NOCU in wheat shows an approximate 5–6% increase in GY as compared to urea at the same levels. However, it is essential to acknowledge that the response of GY to N inputs may be influenced by several factors, such as climatic conditions, soil properties, and the specific cultivar of the crop.
Yang and Baker [37] suggested that the variability in GY between cultivars across different environments can be due to the expression of diverse gene sets in those different environments or to discrepancies in the reactions of the same gene set to varying environmental conditions. Furthermore, the variations of yield and yield traits may be due to the genetic composition of the cultivars influencing the grain filling and transfer of biochemical assimilates from source to sink. ElMetwally et al. [38], EI-Habbal et al. [39], and Hassan et al. [40] reported on varietal disparities in yield attributes of wheat cultivars. Elevating N levels to N150 resulted in an improvement in yield and yield-contributing characteristics in wheat and was due to the influential function of N as a vital element of chlorophyll on the accumulation of dry matter. N inputs influence carbohydrates biosynthesis by modifying the leaf area, which is responsible for capturing solar energy and assimilating CO2. Furthermore, they enhance the efficiency of the photosynthesis process. Previous studies by Fu et al. [41] reported that GY and its components significantly increased with an optimal increase in N inputs.
The application of N inputs has significantly increased the agro-morphological performance measures of cultivars, such as tillers and chlorophyll content. Each cultivar exhibits distinct characteristics based on its unique genetic potential and traits. Certain efficient genotypes demonstrate reduced N losses and improved the growth and development processes. N inputs play a regulatory role in several plant hormones, such as auxin and cytokinin, as well as gene expression, thereby influencing tillering emergence and growth [42,43]. The accumulation of dry matter in wheat cultivars varies, which could be attributed to the genotypic diversity influencing the distribution of photoassimilates in the leaves, resulting in different plant growth patterns and assimilate allocation to reproductive organs [44,45]. Factors such as plant height, spike size, and hormones are likely responsible for the variations observed in tillering capacity among wheat cultivars [46,47]. The ‘HD 3249’ and ‘HD 3117’ genotypes exhibited the highest yield attributes, possibly due to a larger surface area of wheat roots, improved growth and development, and higher photosynthetic efficiency of the leaf area index during flowering and physiological maturity stages.
Nitrogen assumes a pivotal and irreplaceable role in the proliferation and maturation of plants, acting as a vital macronutrient that orchestrates their intricate physiological processes. The results of our investigation showed that the plant height of wheat cultivars was shortest under N input N0 compared to N75 and N150 (Table 1). Similar kinds of results were reported by Tanka et al. [48] and Wolf et al. [49]. However, the response to nitrogen input differs in each cultivar due to their unique genetic potential and characteristics [50,51]. Chlorophyll has a significant role as a photosynthetic pigment and an effective indicator of leaf functions amid the detrimental impact of various ecological stressors [52]. In addition, it serves as a critical parameter for observing nitrogen uptake in wheat [48]. Our results show that, compared to the untreated plants, there was an increase in total chlorophyll content as the N input increased (Table 3). The elevated levels of N and chlorophyll in the leaves exhibited a positive correlation with the net photosynthetic rate, resulting in enhanced carbohydrate production. Consequently, this metabolic shift led to increased biomass accumulation in both the above-ground and below-ground plant components [53,54].
The N × genotypes interaction (NCI) shows a nonsignificant relationship with both grain protein content (GPC) and 1000-grain weight (G.W.). Although statistically non-significant, the measurements of GPC and G.W. displayed notable variation across the different wheat cultivars used in our experiments (Table 5). The detailed results reveal that N150 and N75 increased the G.W. and GPC of wheat cultivars as compared to N0. The variation in GPC and G.W. between genotype ‘HD 3249’ and ‘HD 3298’ can be attributed to the different genotypic characteristics of each cultivar. In fact, splitting and N inputs’ application timing have more significant effects on GPC [14] and other quality traits of wheat [51] than simply increasing N inputs. Fuertes-Mendizabal et al. [33] reported that splitting of N rates enhanced quality parameters, while GY remained unaffected. During our N inputs experiment, we observed that increasing the N inputs results in a favorable effect on GPC and G.W. Wheat cultivar traits show divergent responses to N inputs, and this is due to variations in N availability, N release from slow-release fertilizers, genotype-specific genetic traits, and the influence of soil moisture and temperature levels [55,56]. Some previous studies reported that nitrate reductase (NR) activity was two times higher at N input N105 compared to N0 [57]. The NR activity in the cultivar at N150 might be a reason for higher GY and GPC. Balotf et al. [58] and Lambeck et al. [59] reported that NR activities in wheat increase as external nitrate is applied.
Plant N accumulation and N grain production efficiency (NUEg) at maturity are influenced by a variety of factors such as N inputs, cultivars, prevailing weather conditions, and yearly variations [9,60]. Our 2 years of study revealed that the total uptake of N (TUN) was increased by N inputs and ranged between 55.5 and 169.6 kg ha−1 (Table 8). According to a study by Singh et al. [61], under irrigation conditions, the TUN and NUEg were between 49 and 160 kg ha–1 and 35 and 79 kg kg–1, respectively. In a 3-year pioneering study by Xue et al. [62] in the south-eastern Chinese area of Taihu Lake, it was revealed that the TUN by wheat was 132 and 149 kg ha–1, respectively, when N inputs of 180 and 240 kg ha–1 were applied. Similarly, Jia et al. [63] reported that increasing N inputs from 150 to 270 kg ha–1 led to an increase in TUN in wheat cultivars, from 198 to 238 kg ha–1. According to Wang et al. [64], in wheat, N absorption originated from N fertilizer was increased two-fold when N input increased from 96 to 240 kg ha–1.
Zhu et al. [65] observed that at N input N100, the NUEg ranged from 28.8 to 58.4 kg kg–1. Wu et al. [66] reported that superior cultivars show comparatively elevated TUN at the same N inputs. This suggests that a greater TUN could potentially lead to a higher NUE. We have noticed that ‘HD 3249’ and ‘HD 3117’ had a comparatively higher TUN than the other cultivars, leading to a higher GY (Table 8). The data presented for the NHI and NUEg parameters displayed a diverse range of 67.4 to 77.3% and 35.3 to 44.3 kg kg−1, respectively, across various N inputs (Table 8). High N uptake in genotypes ‘HD 3249’ and ‘HD 3117’ was due to more developed root systems in these cultivars, which helped in exploring large soil volumes and making a better use of the resources [67].
The grain yield efficiency index (GYEI) is a highly reliable indicator of GY and an effective method of evaluating genotypes in terms of their potential grain production [68]. Among all wheat cultivars, only six cultivars (‘HD 3298’, ‘HD 3117’, ‘PBW 550’, ‘HD 3249’, ‘HD 3086’ and ‘HD 2967’) show a GYEI value of ≥1, indicating favorable responses to various N inputs (Table 7 and Figure 2). Our results suggest that GYEI varied among all wheat cultivars. There is an abundance of literature available on how various cultivars and species within the wheat family exhibit various nitrogen utilization mechanisms [69,70]. The diversity in wheat cultivars for NUE was due to multiple factors, including root morphology, root exudation patterns, uptake capacity, transport mechanisms, metabolic pathways, and the partitioning of assimilates. In addition, variations in physiological and biochemical traits such as photosynthetic efficiency, transpiration rates, nitrogen assimilation and remobilization, and sink strength also contribute to differences in NUE [71,72].
Pearson’s correlation analysis revealed that, except for some of the parameters, all traits of wheat cultivars were highly positively correlated with each other at p < 0.01 (Figure 3), [66,73,74]. The HI shows a significant positive correlation with GY in our study [75]. Our results were consistent with those of Peng et al. [76], Ayadi et al. [77], Kubar et al. [78], Boulelouah et al. [79], and Wang et al. [80]. Multiple research studies have shown that it is possible to achieve high GY and NUE by focusing on the distribution of biomass into the grains rather than solely increasing its concentrations [80]. Thus, understanding N metabolism in a specific genotype, and identifying wheat cultivars with greater NUE in conjunction with optimizing N input strategies may improve NUE and GY, and reduce the negative impacts of excess fertilizer application.
The N-use-efficient wheat cultivars accumulated more N in their grains and biomass, suggesting a higher uptake of N in comparison to the N-use-inefficient cultivars. Thus, it can be easily stipulated that the increased uptake of N by efficient N users reduces the losses of N. At a particular point in time, the quantity of nitrate-nitrogen available can be removed by the plants or lost to the environment. Thus, the efficient N-user wheat cultivars can have efficient N uptake, and very little N may be available for loss in comparison to the N-user-inefficient cultivars.
5. Conclusions
The results presented in this study were obtained through two years of field-based experiments that considered the overall performance of various wheat cultivars under different N inputs, and the evaluation was performed based on multiple performance indicators. In particular, the wheat cultivars ‘HD 3249’ and ‘HD 3117’, in combination with a N input of N150, show good performance in terms of several parameters like yield, yield components, N use efficiency (NUE), and grain yield efficiency index (GYEI), and are considered N-efficient genotypes. The observations of these two elite cultivars strongly indicate that they have the potential to be efficient candidates for utilization in breeding programs and molecular investigations. Their ability to provide valuable insights at the genomic level can unveil the fundamental molecular mechanisms responsible for genetic variations in crop cultivars, thereby shedding light on their overall performance.
Supplementary Materials
The following supporting information can be downloaded at: https://www.mdpi.com/article/10.3390/agronomy13082011/s1.
Author Contributions
Conceptualization, methodology, investigation, writing—original draft preparation, S.G., D.K. and Y.S.S.; Methodology, Software, Data interpretation, B.K., R.K., R.S.; Data analysis, writing—review and editing, Supervision, S.M., K.C. and N.A.-A.; writing—review and editing, funding acquisition, N.A.-A., A.A., A.Z.D. and M.A.M. All authors have read and agreed to the published version of the manuscript.
Funding
This research was funded by the Deanship of Scientific Research, King Saud University through the Vice Deanship of Scientific Research Chairs; Research Chair of Prince Sultan Bin Abdulaziz International Prize for Water.
Institutional Review Board Statement
Not applicable.
Informed Consent Statement
Not applicable.
Data Availability Statement
Not applicable.
Acknowledgments
The authors extend their appreciation to the Deanship of Scientific Research, King Saud University for funding through the Vice Deanship of Scientific Research Chairs; Research Chair of Prince Sultan Bin Abdulaziz International Prize for Water. This research experiment was financially supported by ICAR-Indian Agricultural Research Institute, New Delhi. The lead author is very grateful to the ICAR-Indian Agricultural Research Institute, New Delhi, for offering a senior research fellowship for the entire duration of his Ph.D. work.
Conflicts of Interest
The authors declare no conflict of interest.
References
- Walling, E.; Vaneeckhaute, C. Nitrogen Fertilizers and the Environment. In Nitrate Handbook; CRC Press: Boca Raton, FL, USA, 2022; pp. 103–135. [Google Scholar] [CrossRef]
- Kostić, M.M.; Tagarakis, A.C.; Ljubičić, N.; Blagojević, D.; Radulović, M.; Ivošević, B.; Rakić, D. The Effect of N Fertilizer Application Timing on Wheat Yield on Chernozem Soil. Agronomy 2021, 11, 1413. [Google Scholar] [CrossRef]
- Sainju, U.M.; Ghimire, R.; Pradhan, G.P. Nitrogen Fertilization I: Impact on Crop, Soil, and Environment. Nitrogen Fixation. 2019, 9, 1–9. [Google Scholar] [CrossRef]
- Ziaei, S.; Mazloumzadeh, S.; Jabbary, M. A comparison of energy use and productivity of wheat and barley (case study). J. Saudi Soc. Agric. Sci. 2015, 14, 19–25. [Google Scholar] [CrossRef]
- Food and Agriculture Organization of the United Nations (FAO). FAOSTAT. 2021. Available online: http://www.fao.org/faostat/en/#data/QC (accessed on 22 March 2023).
- Salim, N.; Raza, A. Nutrient use efficiency (NUE) for sustainable wheat production: A review. J. Plant Nutr. 2019, 43, 297–315. [Google Scholar] [CrossRef]
- Voss-Fels, K.P.; Stahl, A.; Wittkop, B.; Lichthardt, C.; Nagler, S.; Rose, T.; Chen, T.-W.; Zetzsche, H.; Seddig, S.; Baig, M.M.; et al. Breeding improves wheat productivity under contrasting agrochemical input levels. Nat. Plants 2019, 5, 706–714. [Google Scholar] [CrossRef] [PubMed]
- Cormier, F.; Foulkes, J.; Hirel, B.; Gouache, D.; Moënne-Loccoz, Y.; Le Gouis, J. Breeding for increased nitrogen-use efficiency: A review for wheat (T. aestivum L.). Plant Breed. 2016, 135, 255–278. [Google Scholar] [CrossRef]
- Gaju, O.; Allard, V.; Martre, P.; Snape, J.W.; Heumez, E.; LeGouis, J.; Foulkes, M.J. Identification of traits to improve the nitrogen-use efficiency of wheat genotypes. Field Crops Res. 2011, 123, 139–152. [Google Scholar] [CrossRef]
- Guttieri, M.J.; Frels, K.; Regassa, T.; Waters, B.M.; Baenziger, P.S. Variation for nitrogen use efficiency traits in current and historical great plains hard winter wheat. Euphytica 2017, 213, 87. [Google Scholar] [CrossRef]
- Nehe, A.; Misra, S.; Murchie, E.; Chinnathambi, K.; Foulkes, M. Genetic variation in N-use efficiency and associated traits in Indian wheat cultivars. Field Crops Res. 2018, 225, 152–162. [Google Scholar] [CrossRef]
- Cai, J.; Jiang, D.; Liu, F.; Dai, T.; Cao, W. Effects of split nitrogen fertilization on post-anthesis photoassimilates, nitrogen use efficiency and grain yield in malting barley. Acta Agric. Scand. Sect. B—Soil Plant Sci. 2011, 61, 410–420. [Google Scholar] [CrossRef]
- Hawkesford, M.J. The diversity of nitrogen use efficiency for wheat varieties and the potential for crop improvement. Better Crops 2012, 96, 10–12. [Google Scholar]
- Haile, D.; Nigussie, D.; Ayana, A. Nitrogen use efficiency of bread wheat: Effects of nitrogen rate and time of application. J. Soil Sci. Plant Nutr. 2012, 12, 389–410. [Google Scholar]
- Duan, Y.-H.; Shi, X.-J.; Li, S.-L.; Sun, X.-F.; He, X.-H. Nitrogen Use Efficiency as Affected by Phosphorus and Potassium in Long-Term Rice and Wheat Experiments. J. Integr. Agric. 2014, 13, 588–596. [Google Scholar] [CrossRef]
- Singh, B. Nitrogen Use Efficiency in Crop Production in India: Trends, Issues, and Challenges. Agric. Res. 2023, 12, 32–44. [Google Scholar] [CrossRef]
- Rahman, M.A.; Sarker, M.; Amin, M.; Jahan, A.; Akhter, M. Yield Response and Nitrogen Use Efficiency of Wheat Under Different Doses and Split Application of Nitrogen Fertilizer. Bangladesh J. Agric. Res. 1970, 36, 231–240. [Google Scholar] [CrossRef]
- Walkley, A.; Black, I.A. An examination of the Degtjareff method for determining soil organic matter, and a proposed modification of the chromic acid titration method. Soil Sci. 1934, 37, 29–38. [Google Scholar] [CrossRef]
- Subbiah, B.V. A rapid procedure for the determination of available nitrogen in soils. Curr. Sci. 1956, 25, 259–260. [Google Scholar]
- Olsen, S.R. Estimation of Available Phosphorus in Soils by Extraction with Sodium Bicarbonate (No. 939); US Department of Agriculture: Washington, DC, USA, 1954; Available online: https://ia903207.us.archive.org/21/items/estimationofavai939olse/estimationofavai939olse.pdf (accessed on 1 January 2023).
- Hanway, J.J.; Heidel, H. Soil analysis methods as used in Iowa state college soil testing laboratory. Iowa State Coll. Agric. Bull. 1952, 57, 1–31. [Google Scholar]
- Gomez, K.A.; Gomez, A.A. Statistical Procedures for Agricultural Research; John Wiley & Sons: Hoboken, NJ, USA, 1984. [Google Scholar]
- Association of Official Analytical Chemists. Official Methods of Analysis; Association of Official Analytical Chemists: Washington, DC, USA, 1995. [Google Scholar]
- Fageria, N.K.; Baligar, V.C. Methodology for Evaluation of Lowland Rice Genotypes for Nitrogen Use Efficiency. J. Plant Nutr. 2003, 26, 1315–1333. [Google Scholar] [CrossRef]
- Mendiburu, F.D.; Yaseen, M. Agricolae: Statistical Procedures for Agricultural Research. R Package Version 2023.03.1-446. Available online: https://posit.co/download/rstudio-desktop/ (accessed on 1 January 2023).
- Roberts, T.L. Right product, right rate, right time and right place… the foundation of best management practices for fertilizer. Fertil. Best Manag. Pract. 2007, 29, 1–8. [Google Scholar]
- Garrido-Lestache, E.; López-Bellido, R.J.; López-Bellido, L. Effect of N rate, timing and splitting and N type on bread-making quality in hard red spring wheat under rainfed Mediterranean conditions. Field Crops Res. 2004, 85, 213–236. [Google Scholar] [CrossRef]
- Yano, G.T.; Takahashi, H.W.; Watanabe, T.S. Avaliação de fontes de nitrogênio e épocas de aplicação em cobertura para o cultivo do trigo. Semin. Ciências Agrárias 2005, 26, 141–148. [Google Scholar] [CrossRef]
- Sapkota, T.B.; Singh, L.K.; Yadav, A.K.; Khatri-Chhetri, A.; Jat, H.S.; Sharma, P.C.; Jat, M.L.; Stirling, C.M. Identifying optimum rates of fertilizer nitrogen application to maximize economic return and minimize nitrous oxide emission from rice–wheat systems in the Indo-Gangetic Plains of India. Arch. Agron. Soil Sci. 2020, 66, 2039–2054. [Google Scholar] [CrossRef]
- Khan, G.R.; Akma, M. Nitrogen application rate and timing management for improved grain quality parameters of wheat crop. Pak. J. Agric. Sci. 2021, 58, 1141–1153. [Google Scholar]
- Khan, G.R.; Alkharabsheh, H.M.; Akmal, M.; AL-Huqail, A.A.; Ali, N.; Alhammad, B.A.; Hoogenboom, G. Split Nitrogen Application Rates for Wheat (Triticum aestivum L.) Yield and Grain N Using the CSM-CERES-Wheat Model. Agronomy 2022, 12, 1766. [Google Scholar] [CrossRef]
- Porker, K.; Straight, M.; Hunt, J.R. Evaluation of G × E × M Interactions to Increase Harvest Index and Yield of Early Sown Wheat. Front. Plant Sci. 2020, 11, 994. [Google Scholar] [CrossRef]
- Fuertes-Mendizábal, T.; Aizpurua, A.; González-Moro, M.; Estavillo, J. Improving wheat breadmaking quality by splitting the N fertilizer rate. Eur. J. Agron. 2010, 33, 52–61. [Google Scholar] [CrossRef]
- Tedone, L.; Verdini, L.; Grassano, N.; Tarraf, W.; De Mastro, G. Optimising nitrogen in order to improve the efficiency, eco-physiology, yield and quality on one cultivar of durum wheat. Ital. J. Agron. 2014, 9, 49. [Google Scholar] [CrossRef]
- Singh, Y.; Singh, M.; Sidhu, H.; Humphreys, E.; Thind, H.; Jat, M.; Blackwell, J.; Singh, V. Nitrogen management for zero till wheat with surface retention of rice residues in north-west India. Field Crops Res. 2015, 184, 183–191. [Google Scholar] [CrossRef]
- Singh, B. Agronomic benefits of neem coated urea—A review. In International Fertilizer Association Review Papers; International Fertilizer Association: Paris, France, 2016. [Google Scholar]
- Yang, R.; Baker, R.J. Genotype-Environment Interactions in Two Wheat Crosses. Crops Sci. 1991, 31, 83–87. [Google Scholar] [CrossRef]
- El-Metwally, I.M.; Saudy, H.S. Herbicides tankmixtures efficiency on weeds and wheat productivity. Ann. Agric. Sci. Moshtohor. Benha. Univ. 2009, 47, 95–109. [Google Scholar]
- El-Habbal, M.S.; Noureldin, N.A.; Zolfakar, H.A. Response of some wheat cultivars to transplanting. Ann. Agric. Sci. 2000, 45, 189–199. [Google Scholar]
- Hassan, A.A.; Gaballah, A.B. Response of some wheat cultivars to different levels and sources of nitrogen fertilizers under new reclaimed sandy soils. Zagazig J. Agric. Res. 2000, 27, 13–29. [Google Scholar]
- Fu, Q.; Wang, Q.; Shen, X.; Fan, J. Optimizing water and nitrogen inputs for winter wheat cropping system on the Loess Plateau, China. J. Arid. Land 2014, 6, 230–242. [Google Scholar] [CrossRef]
- Huang, M.; Chen, J.; Cao, F.; Jiang, L.; Zou, Y.; Deng, G. Improving physiological N-use efficiency by increasing harvest index in rice: A case in super-hybrid cultivar Guiliangyou 2. Arch. Agron. Soil Sci. 2015, 62, 725–743. [Google Scholar] [CrossRef]
- Huang, M.; Shan, S.; Cao, J.; Fang, S.; Tian, A.; Liu, Y.; Cao, F.; Yin, X.; Zou, Y. Primary-tiller panicle number is critical to achieving high grain yields in machine-transplanted hybrid rice. Sci. Rep. 2020, 10, 2811. [Google Scholar] [CrossRef]
- Haque, A.; Haque, M.M. Growth, Yield and Nitrogen Use Efficiency of New Rice Variety under Variable Nitrogen Rates. Am. J. Plant Sci. 2016, 7, 612–622. [Google Scholar] [CrossRef]
- Shivay, Y.S.; Prasad, R.; Pal, M. Effect of nitrogen levels and coated urea on growth, yields and nitrogen use efficiency in aromatic rice. J. Plant Nutr. 2015, 39, 875–882. [Google Scholar] [CrossRef]
- Ferrante, A.; Savin, R.; Slafer, G.A. Floret development of durum wheat in response to nitrogen availability. J. Exp. Bot. 2010, 61, 4351–4359. [Google Scholar] [CrossRef]
- Yang, H.; Li, Y.; Qiao, Y.; Sun, H.; Liu, W.; Qiao, W.; Li, W.; Liu, M.; Dong, B. Low light stress promotes new tiller regeneration by changing source–sink relationship and activating expression of expansin genes in wheat. Plant Cell Environ. 2023, 46, 1562–1581. [Google Scholar] [CrossRef]
- Tanka, P.G.; Brian, K.N. Impacts of tillage systems, nitrogen fertilizer rates and a legume green manure on light interception and yield of winter wheat. Cogent Food Agric. 2019, 5, 1580176. [Google Scholar]
- Wolf, N.; Wolf, A.; Hoskins, B. Dry matter analysis method. A report to the manure analysis. Cop. Ext. Publ. 2003, 3769, 1–2. [Google Scholar]
- Yingkui, Y.; Yasuyuki, I.; Sachiko, I. Year-Round forage yield stability through a system combining triple-maize crops with winter barley in kyushu, Japan. Am. J. Agric. Biol. Sci. 2016, 11, 19–28. [Google Scholar]
- Ahmed, S.; Raza, M.A.; Zhou, T.; Hussain, S.; Bin Khalid, M.H.; Feng, L.; Wasaya, A.; Iqbal, N.; Ahmed, A.; Liu, W.; et al. Responses of Soybean Dry Matter Production, Phosphorus Accumulation, and Seed Yield to Sowing Time under Relay Intercropping with Maize. Agronomy 2018, 8, 282. [Google Scholar] [CrossRef]
- Bertheloot, J.; Martre, P.; Andrieu, B. Dynamics of Light and Nitrogen Distribution during Grain Filling within Wheat Canopy. Plant Physiol. 2008, 148, 1707–1720. [Google Scholar] [CrossRef]
- Hessini, K.; Issaoui, K.; Ferchichi, S.; Saif, T.; Abdelly, C.; Siddique, K.H.; Cruz, C. Interactive effects of salinity and nitrogen forms on plant growth, photosynthesis and osmotic adjustment in maize. Plant Physiol. Biochem. 2019, 139, 171–178. [Google Scholar] [CrossRef] [PubMed]
- Khalsa, S.D.S.; Smart, D.R.; Muhammad, S.; Armstrong, C.M.; Sanden, B.L.; Houlton, B.Z.; Brown, P.H. Intensive fertilizer use increases orchard N cycling and lowers net global warming potential. Sci. Total. Environ. 2020, 722, 137889. [Google Scholar] [CrossRef]
- Xue, C.; Erley, G.S.A.; Rossmann, A.; Schuster, R.; Koehler, P.; Mühling, K.-H. Split Nitrogen Application Improves Wheat Baking Quality by Influencing Protein Composition Rather Than Concentration. Front. Plant Sci. 2016, 7, 738. [Google Scholar] [CrossRef]
- McKenzie, R.H.; Bremer, E.; Middleton, A.B.; Pfiffner, P.G.; Dowbenko, R.E. Controlled-release urea for winter wheat in southern Alberta. Can. J. Soil Sci. 2007, 87, 85–91. [Google Scholar] [CrossRef]
- Effah, Z.; Li, L.; Xie, J.; Liu, C.; Xu, A.; Karikari, B.; Anwar, S.; Zeng, M. Regulation of Nitrogen Metabolism, Photosynthetic Activity, and Yield Attributes of Spring Wheat by Nitrogen Fertilizer in the Semi-arid Loess Plateau Region. J. Plant Growth Regul. 2022, 42, 1120–1133. [Google Scholar] [CrossRef]
- Balotf, S.; Kavoosi, G.; Kholdebarin, B. Nitrate reductase, nitrite reductase, glutamine synthetase, and glutamate synthase expression and activity in response to different nitrogen sources in nitrogen-starved wheat seedlings. Biotechnol. Appl. Biochem. 2015, 63, 220–229. [Google Scholar] [CrossRef]
- Lambeck, I.C.; Fischer-Schrader, K.; Niks, D.; Roeper, J.; Chi, J.-C.; Hille, R.; Schwarz, G. Molecular Mechanism of 14-3-3 Protein-mediated Inhibition of Plant Nitrate Reductase*. J. Biol. Chem. 2012, 287, 4562–4571. [Google Scholar] [CrossRef] [PubMed]
- Bingham, I.; Karley, A.; White, P.; Thomas, W.; Russell, J. Analysis of improvements in nitrogen use efficiency associated with 75 years of spring barley breeding. Eur. J. Agron. 2012, 42, 49–58. [Google Scholar] [CrossRef]
- Singh, U.; Ladha, J.; Castillo, E.; Punzalan, G.; Tirol-Padre, A.; Duqueza, M. Genotypic variation in nitrogen use efficiency in medium- and long-duration rice. Field Crops Res. 1998, 58, 35–53. [Google Scholar] [CrossRef]
- Xue, L.; Yu, Y.; Yang, L. Maintaining yields and reducing nitrogen loss in rice–wheat rotation system in Taihu Lake region with proper fertilizer management. Environ. Res. Lett. 2014, 9, 115010. [Google Scholar] [CrossRef]
- Jia, S.; Wang, X.; Yang, Y.; Dai, K.; Meng, C.; Zhao, Q.; Zhang, X.; Zhang, D.; Feng, Z.; Sun, Y.; et al. Fate of labeled urea-15N as basal and topdressing applications in an irrigated wheat–maize rotation system in North China Plain: I winter wheat. Nutr. Cycl. Agroecosystems 2011, 90, 331–346. [Google Scholar] [CrossRef]
- Wang, D.; Xu, Z.; Zhao, J.; Wang, Y.; Yu, Z. Excessive nitrogen application decreases grain yield and increases nitrogen loss in a wheat–soil system. Acta Agric. Scand. Sect. B—Soil Plant Sci. 2011, 61, 681–692. [Google Scholar] [CrossRef]
- Zhu, G.; Peng, S.; Huang, J.; Cui, K.; Nie, L.; Wang, F. Genetic Improvements in Rice Yield and Concomitant Increases in Radiation- and Nitrogen-Use Efficiency in Middle Reaches of Yangtze River. Sci. Rep. 2016, 6, 21049. [Google Scholar] [CrossRef]
- Wu, L.; Yuan, S.; Huang, L.; Sun, F.; Zhu, G.; Li, G.; Fahad, S.; Peng, S.; Wang, F. Physiological Mechanisms Underlying the High-Grain Yield and High-Nitrogen Use Efficiency of Elite Rice Varieties under a Low Rate of Nitrogen Application in China. Front. Plant Sci. 2016, 7, 1024. [Google Scholar] [CrossRef]
- Touzy, G.; Rincent, R.; Bogard, M.; Lafarge, S.; Dubreuil, P.; Mini, A.; Deswarte, J.-C.; Beauchêne, K.; Le Gouis, J.; Praud, S. Using environmental clustering to identify specific drought tolerance QTLs in bread wheat (T. aestivum L.). Theor. Appl. Genet. 2019, 132, 2859–2880. [Google Scholar] [CrossRef]
- Fageria, N.K. Yield Physiology of Rice. J. Plant Nutr. 2007, 30, 843–879. [Google Scholar] [CrossRef]
- Jiang, L.G.; Cao, W.X.; Gan, X.Q.; Xu, J.Y.; Dong, D.F.; Chen, N.P.; Lu, F.Y.; Qin, H.D. Nitrogen uptake and utilization under different nitrogen management and influence on grain yield and quality in rice. Agri. Sci. China 2004, 37, 490–496. [Google Scholar]
- Fageria, N.K.; dos Santos, A.B.; Coelho, A.M. Growth, yield, and yield components of lowland rice as influenced by ammonium sulfate and urea fertilization. J. Plant Nutr. 2011, 34, 371–386. [Google Scholar] [CrossRef]
- Fageria, N.; Baligar, V.; Clark, R. Physiology of Crop Production; CRC Press: 2006. [CrossRef]
- Fageria, N.K.; Baligar, V.C.; Li, Y.C. The Role of Nutrient Efficient Plants in Improving Crop Yields in the Twenty First Century. J. Plant Nutr. 2008, 31, 1121–1157. [Google Scholar] [CrossRef]
- Huang, L.; Sun, F.; Yuan, S.; Peng, S.; Wang, F. Different mechanisms underlying the yield advantage of ordinary hybrid and super hybrid rice over inbred rice under low and moderate N input conditions. Field Crops Res 2018, 216, 150–157. [Google Scholar] [CrossRef]
- Huang, L.; Sun, F.; Yuan, S.; Peng, S.; Wang, F. Responses of candidate green super rice and super hybrid rice varieties to simplified and reduced input practice. Field Crops Res. 2018, 218, 78–87. [Google Scholar] [CrossRef]
- Yang, J.; Zhang, J. Crop management techniques to enhance harvest index in rice. J. Exp. Bot. 2010, 61, 3177–3189. [Google Scholar] [CrossRef]
- Peng, C.; Zhang, Z.; Li, Y.; Zhang, Y.; Dong, H.; Fang, Y.; Han, L.; Xu, W.; Hu, L. Genetic improvement analysis of nitrogen uptake, utilization, translocation, and distribution in Chinese wheat in Henan Province. Field Crops Res. 2021, 277, 108406. [Google Scholar] [CrossRef]
- Ayadi, S.; Karmous, C.; Chamekh, Z.; Hammami, Z.; Baraket, M.; Esposito, S.; Rezgui, S.; Trifa, Y. Effects of nitrogen rates on grain yield and nitrogen agronomic efficiency of durum wheat genotypes under different environments. Ann. Appl. Biol. 2015, 168, 264–273. [Google Scholar] [CrossRef]
- Kubar, M.S.; Alshallash, K.S.; Asghar, M.A.; Feng, M.; Raza, A.; Wang, C.; Saleem, K.; Ullah, A.; Yang, W.; Kubar, K.A.; et al. Improving Winter Wheat Photosynthesis, Nitrogen Use Efficiency, and Yield by Optimizing Nitrogen Fertilization. Life 2022, 12, 1478. [Google Scholar] [CrossRef] [PubMed]
- Boulelouah, N.; Berbache, M.R.; Bedjaoui, H.; Selama, N.; Rebouh, N.Y. Influence of Nitrogen Fertilizer Rate on Yield, Grain Quality and Nitrogen Use Efficiency of Durum Wheat (Triticum durum Desf) under Algerian Semiarid Conditions. Agriculture 2022, 12, 1937. [Google Scholar] [CrossRef]
- Wang, W.; Huang, L.; Zhu, G.; Zhang, H.; Wang, Z.; Adnan, M.; Saud, S.; Hayat, Z.; Fahad, S. Screening of Rice Cultivars for Nitrogen Use Efficiency and Yield Stability under Varying Nitrogen Levels. J. Plant Growth Regul. 2021, 41, 1808–1819. [Google Scholar] [CrossRef]


Disclaimer/Publisher’s Note: The statements, opinions and data contained in all publications are solely those of the individual author(s) and contributor(s) and not of MDPI and/or the editor(s). MDPI and/or the editor(s) disclaim responsibility for any injury to people or property resulting from any ideas, methods, instructions or products referred to in the content. |
© 2023 by the authors. Licensee MDPI, Basel, Switzerland. This article is an open access article distributed under the terms and conditions of the Creative Commons Attribution (CC BY) license (https://creativecommons.org/licenses/by/4.0/).