

Spatial Variability Analysis of Wheat Nitrogen Yield Response: A Case Study of Henan Province, China

Abstract
:1. Introduction
2. Materials and Methods
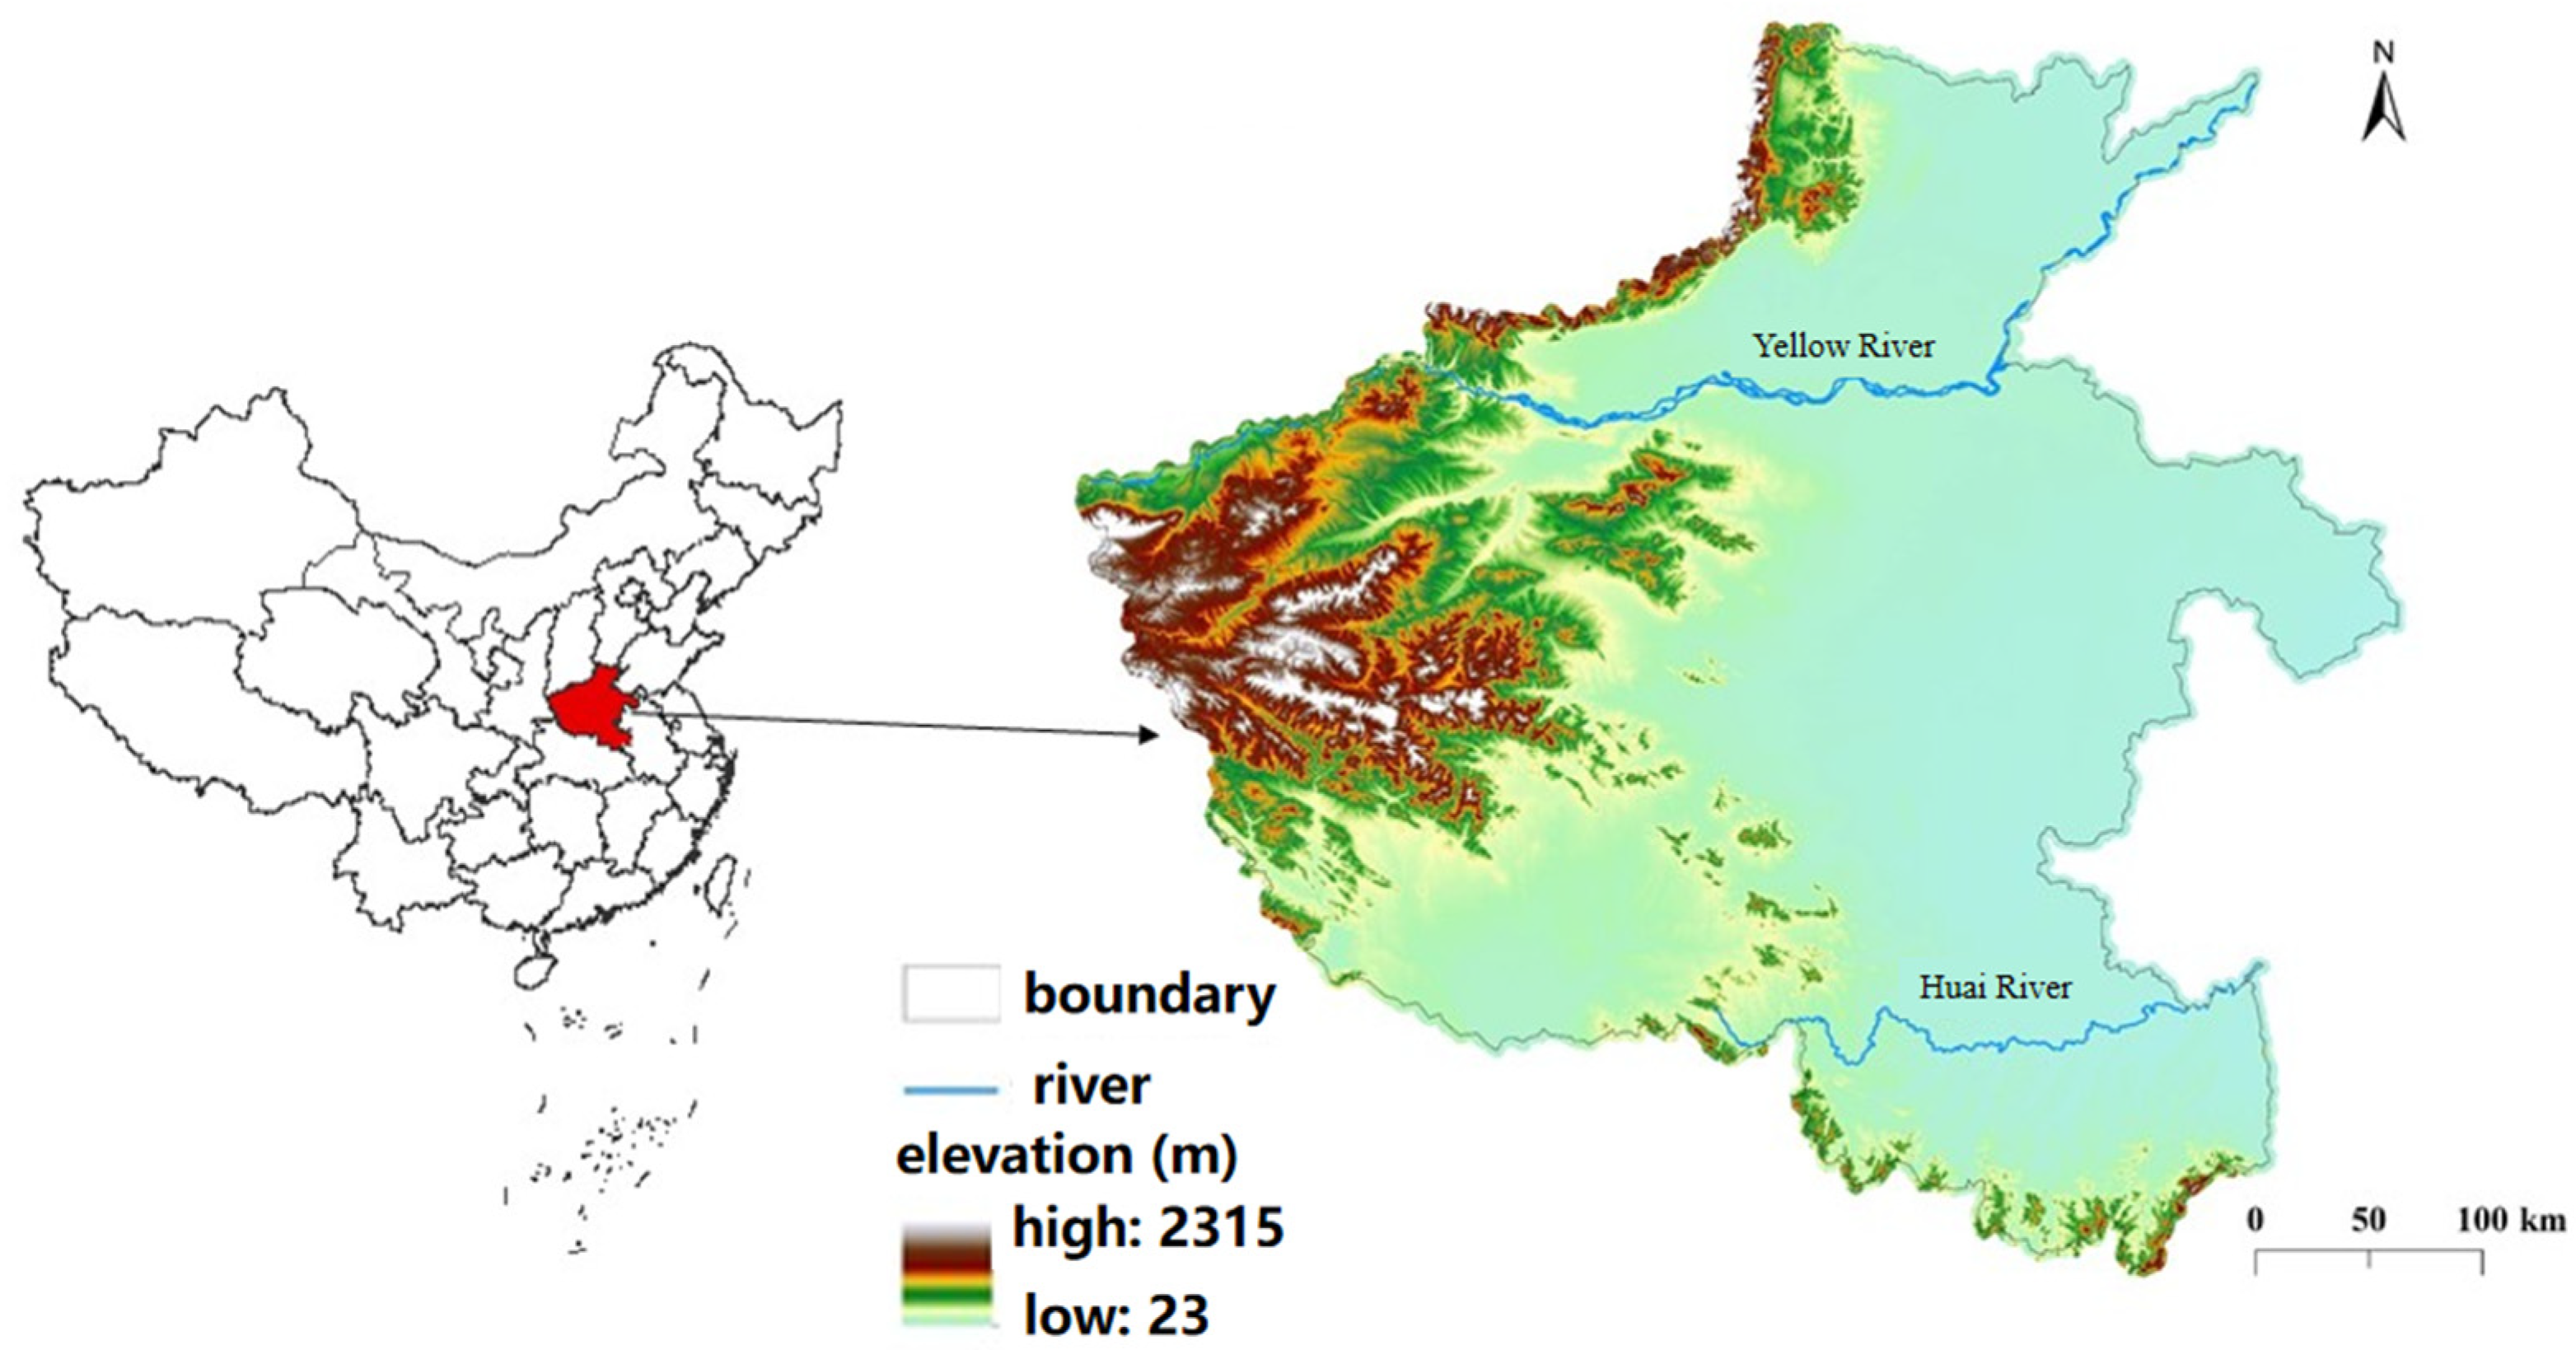
2.1. Study Areas and Soil Types
2.2. Data Collation and Analysis
2.3. Data Analysis
3. Results
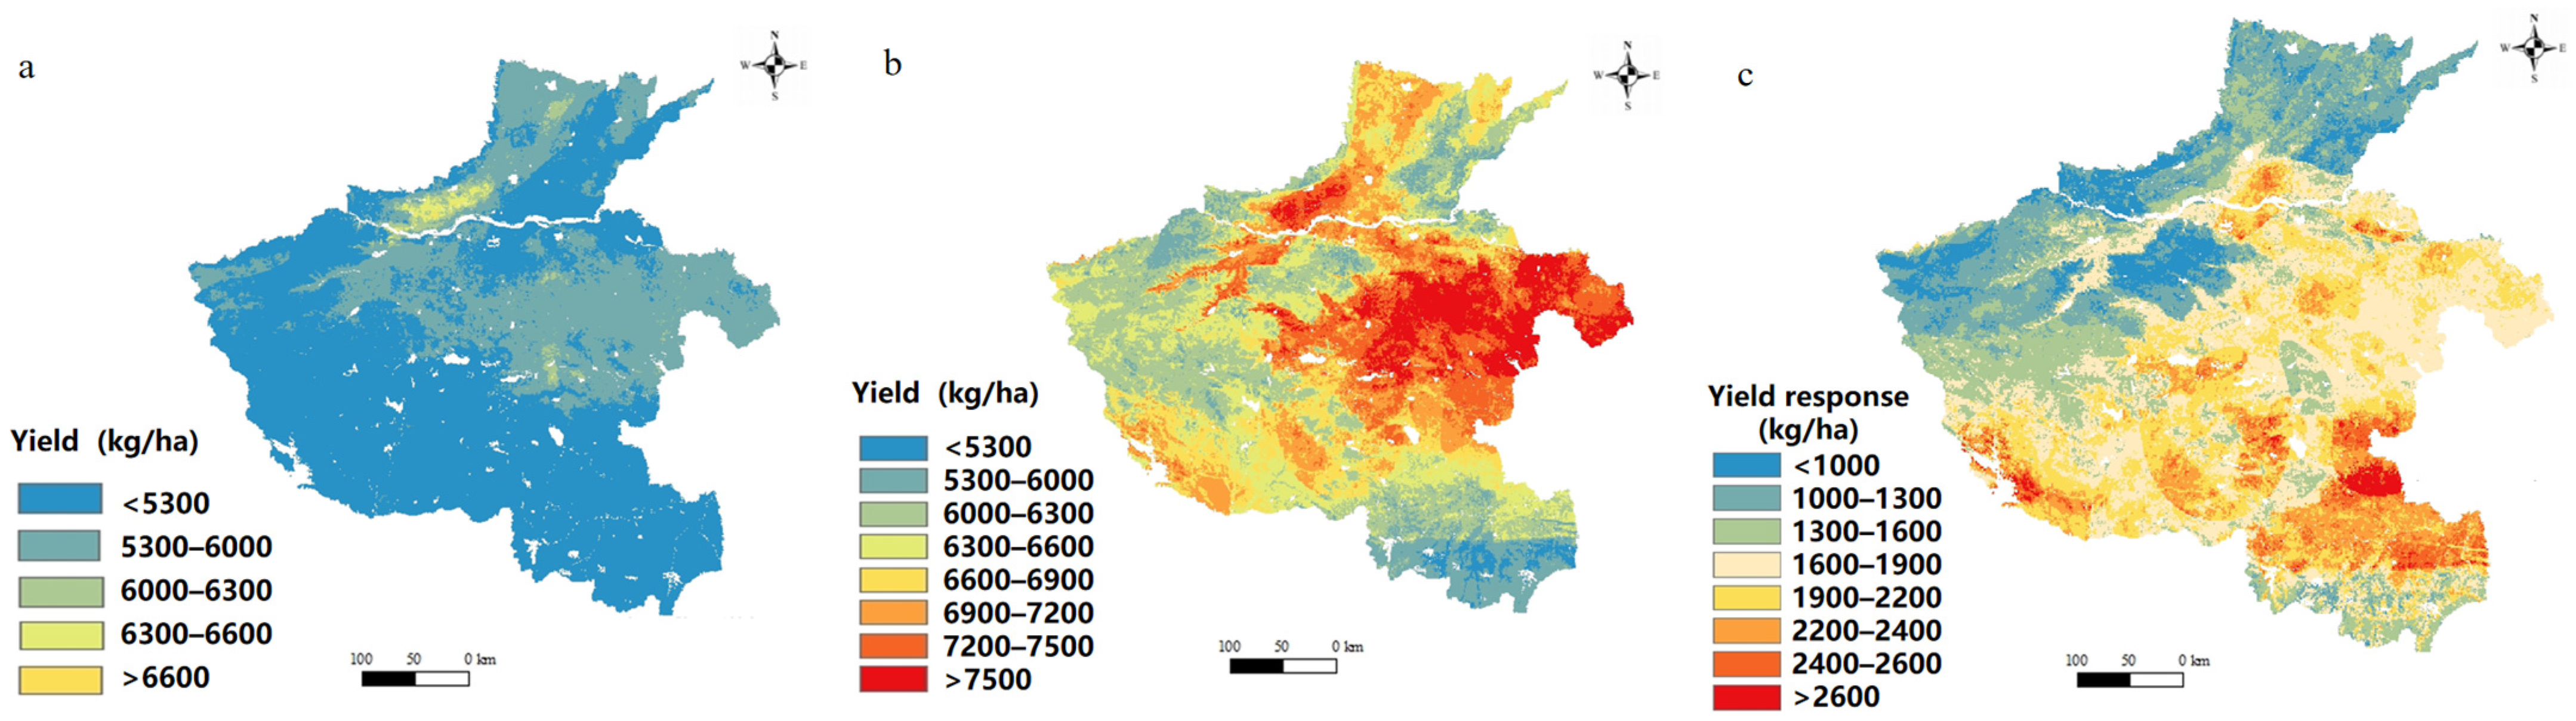
3.1. The Characteristics of Statistics and Spatial Variation of Wheat Nitrogen Yield Response
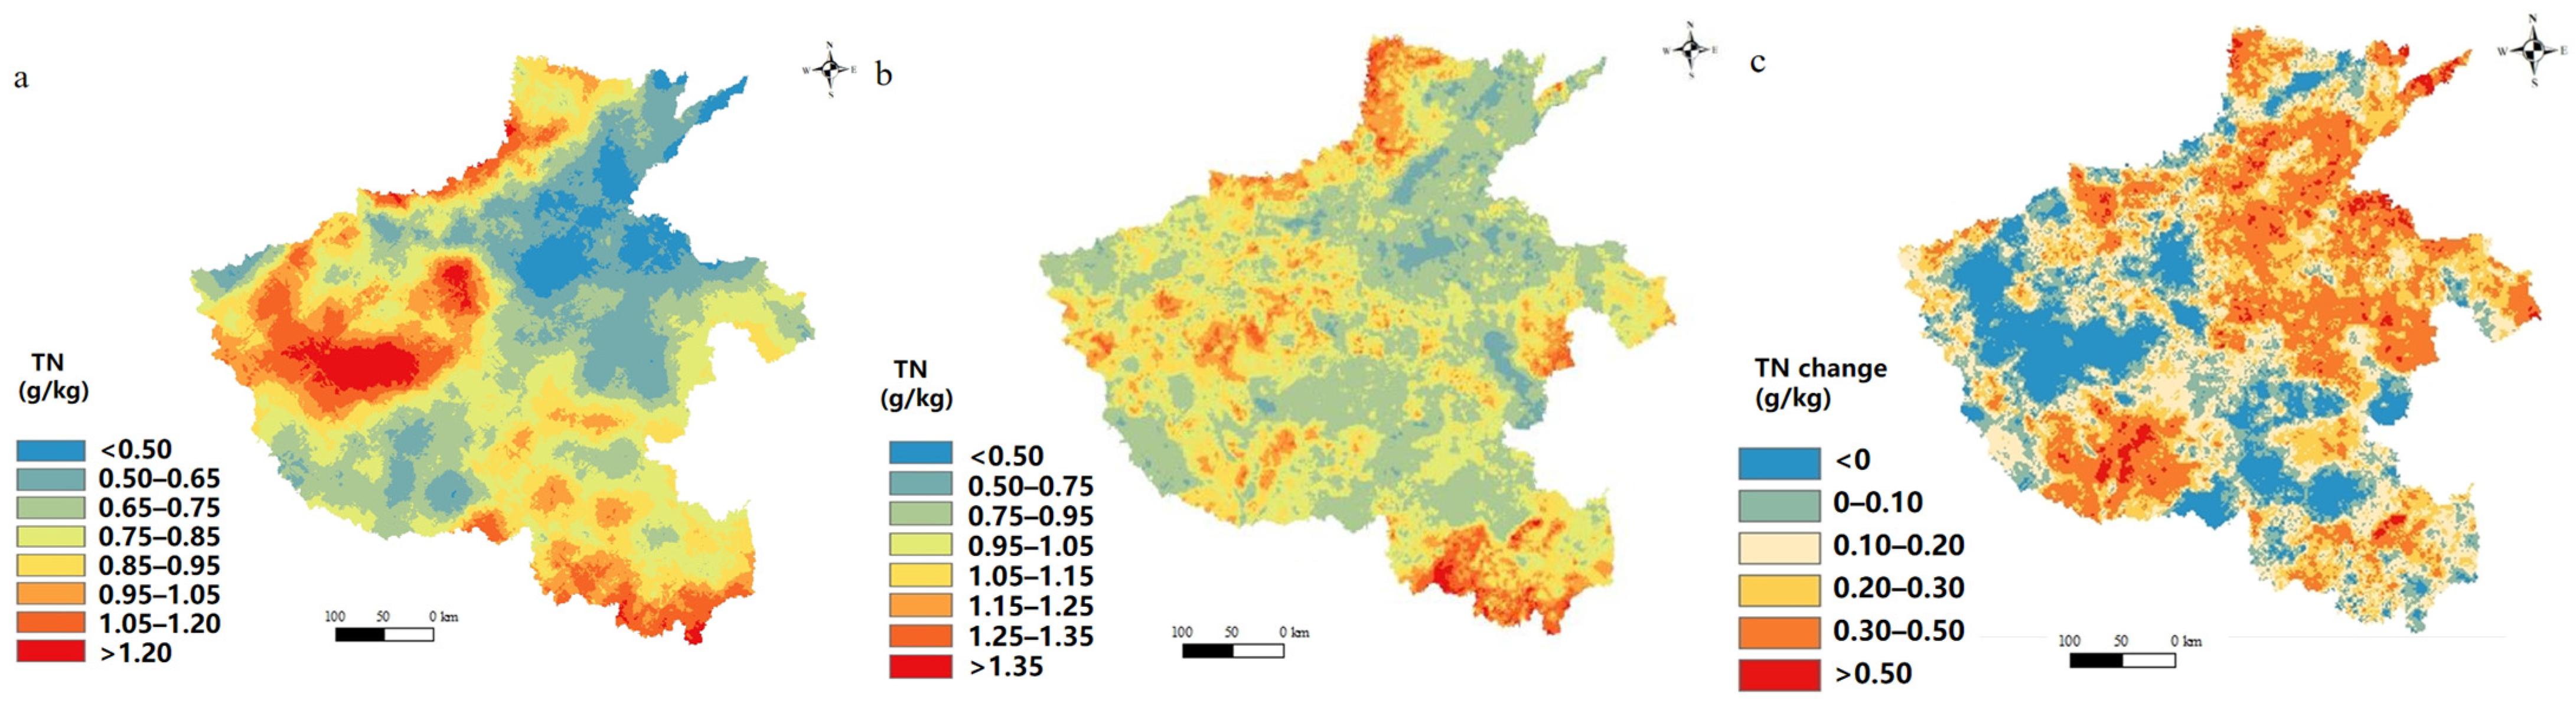
3.2. The Spatial Variation of Soil Nitrogen
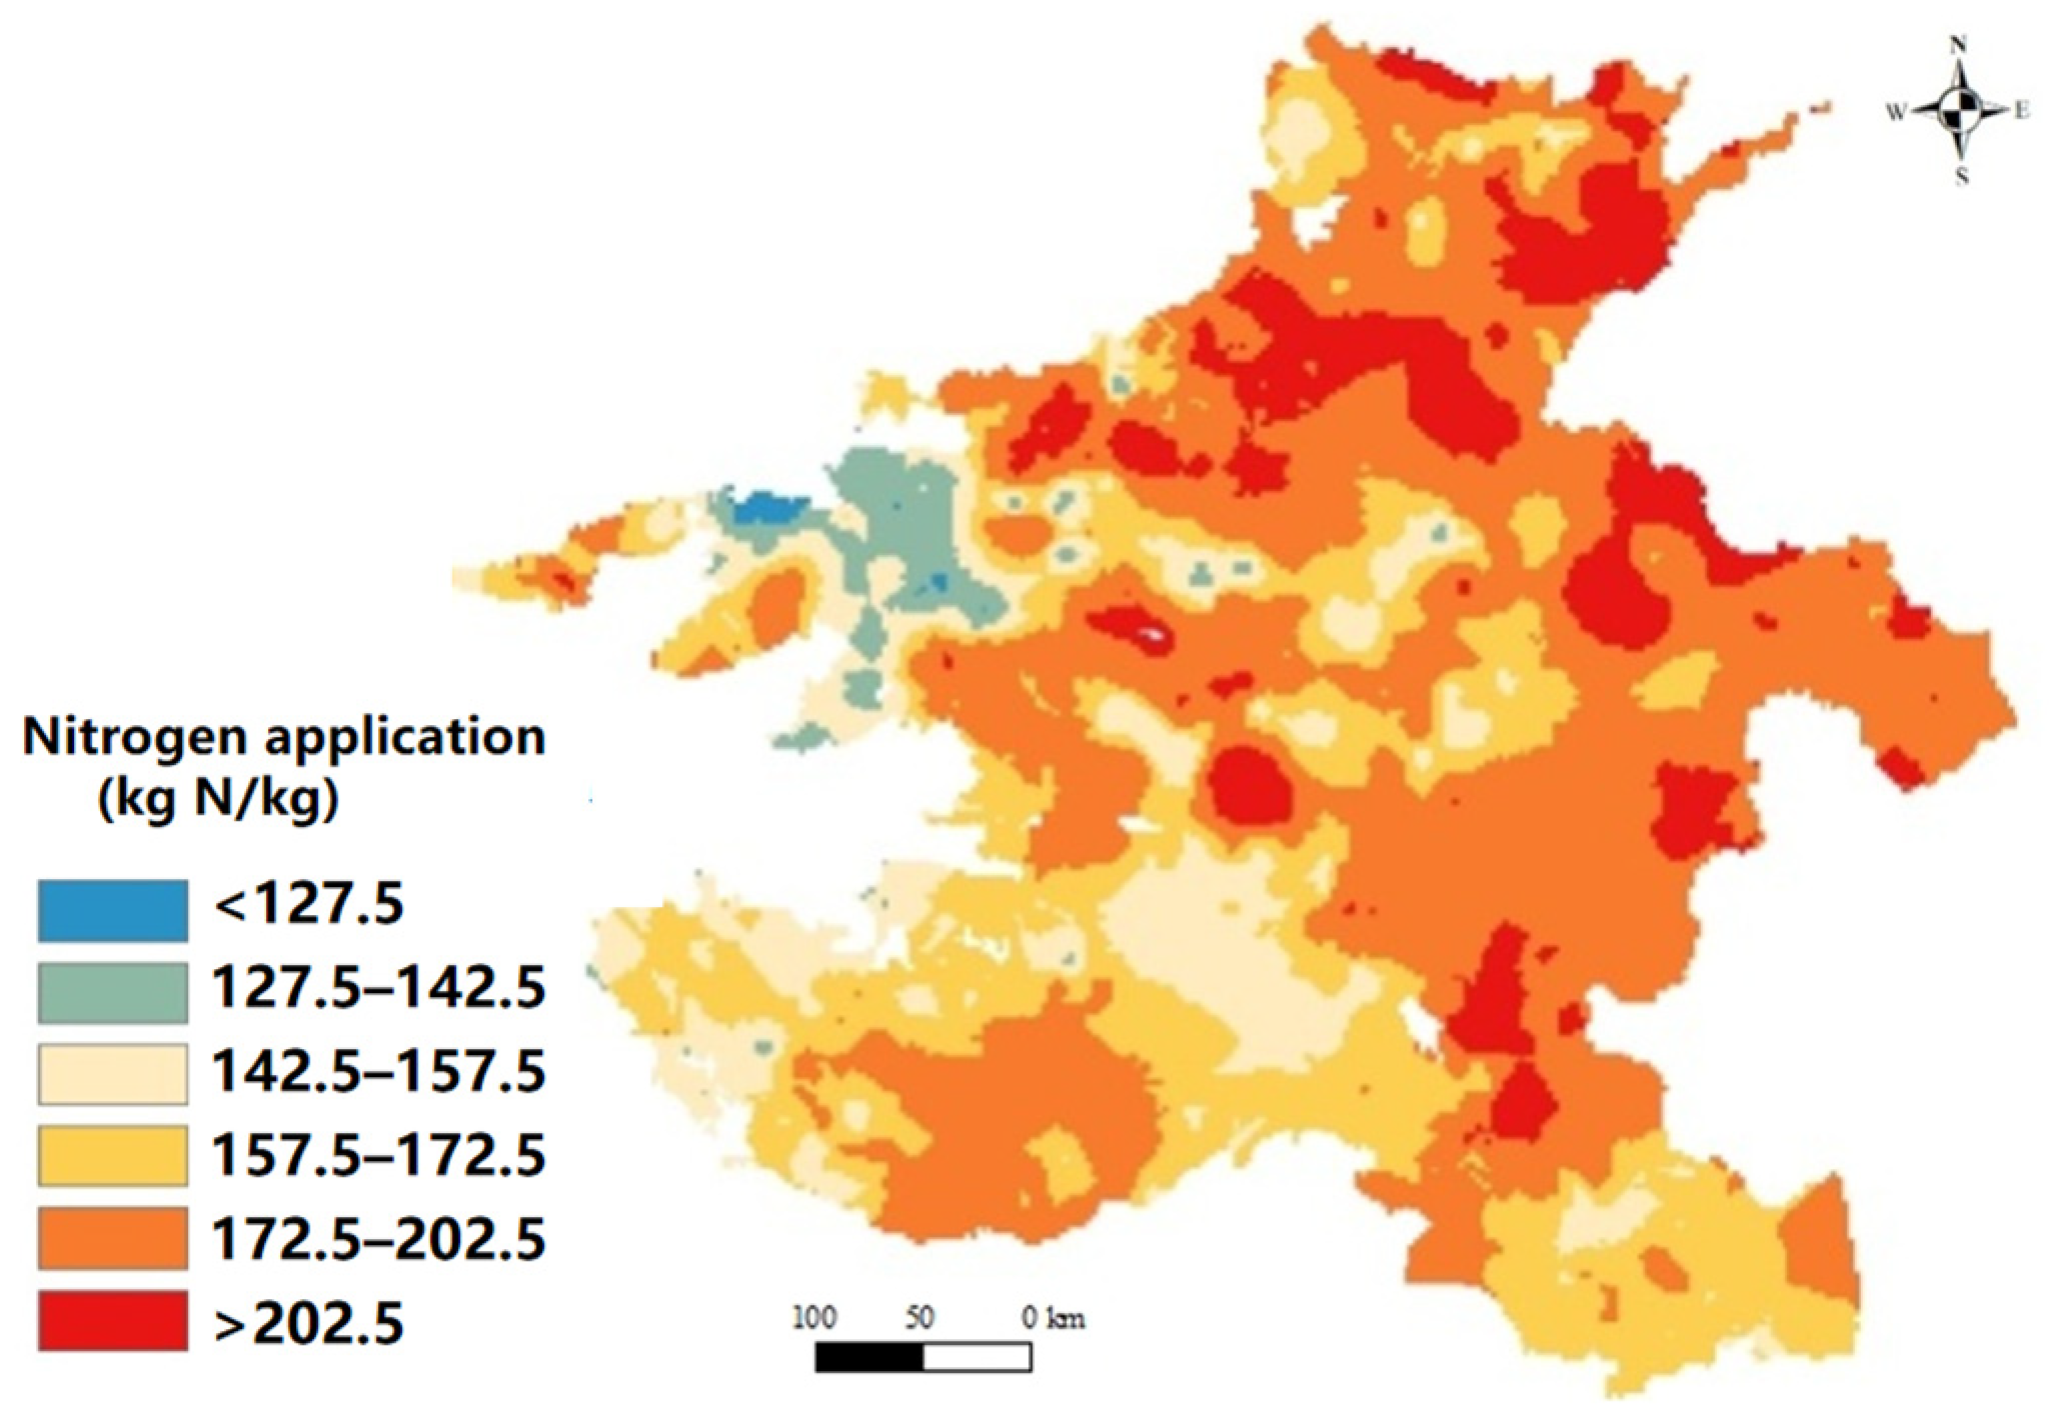
3.3. Nitrogen Fertilization
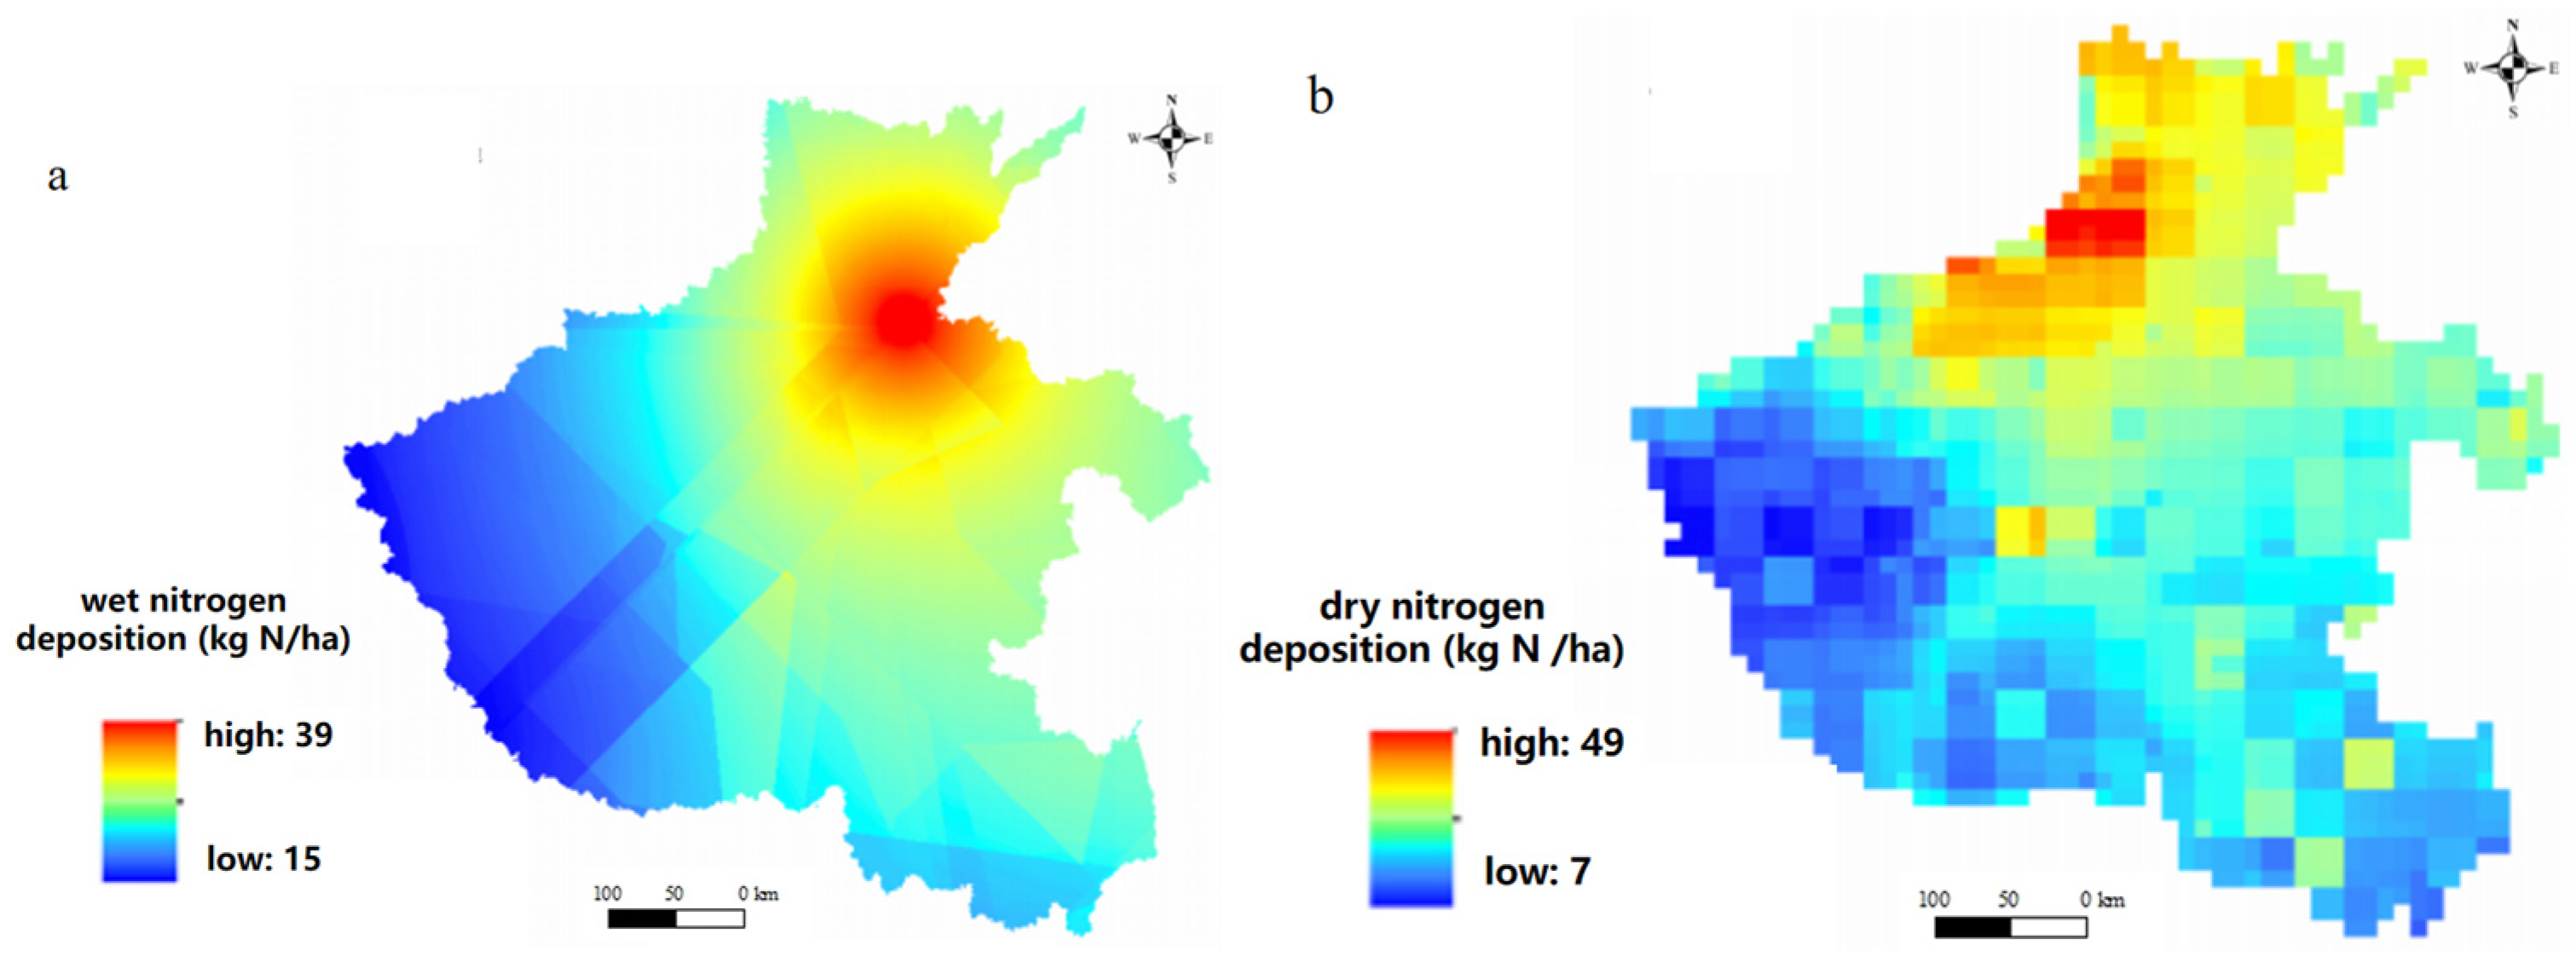
3.4. Nitrogen Deposition
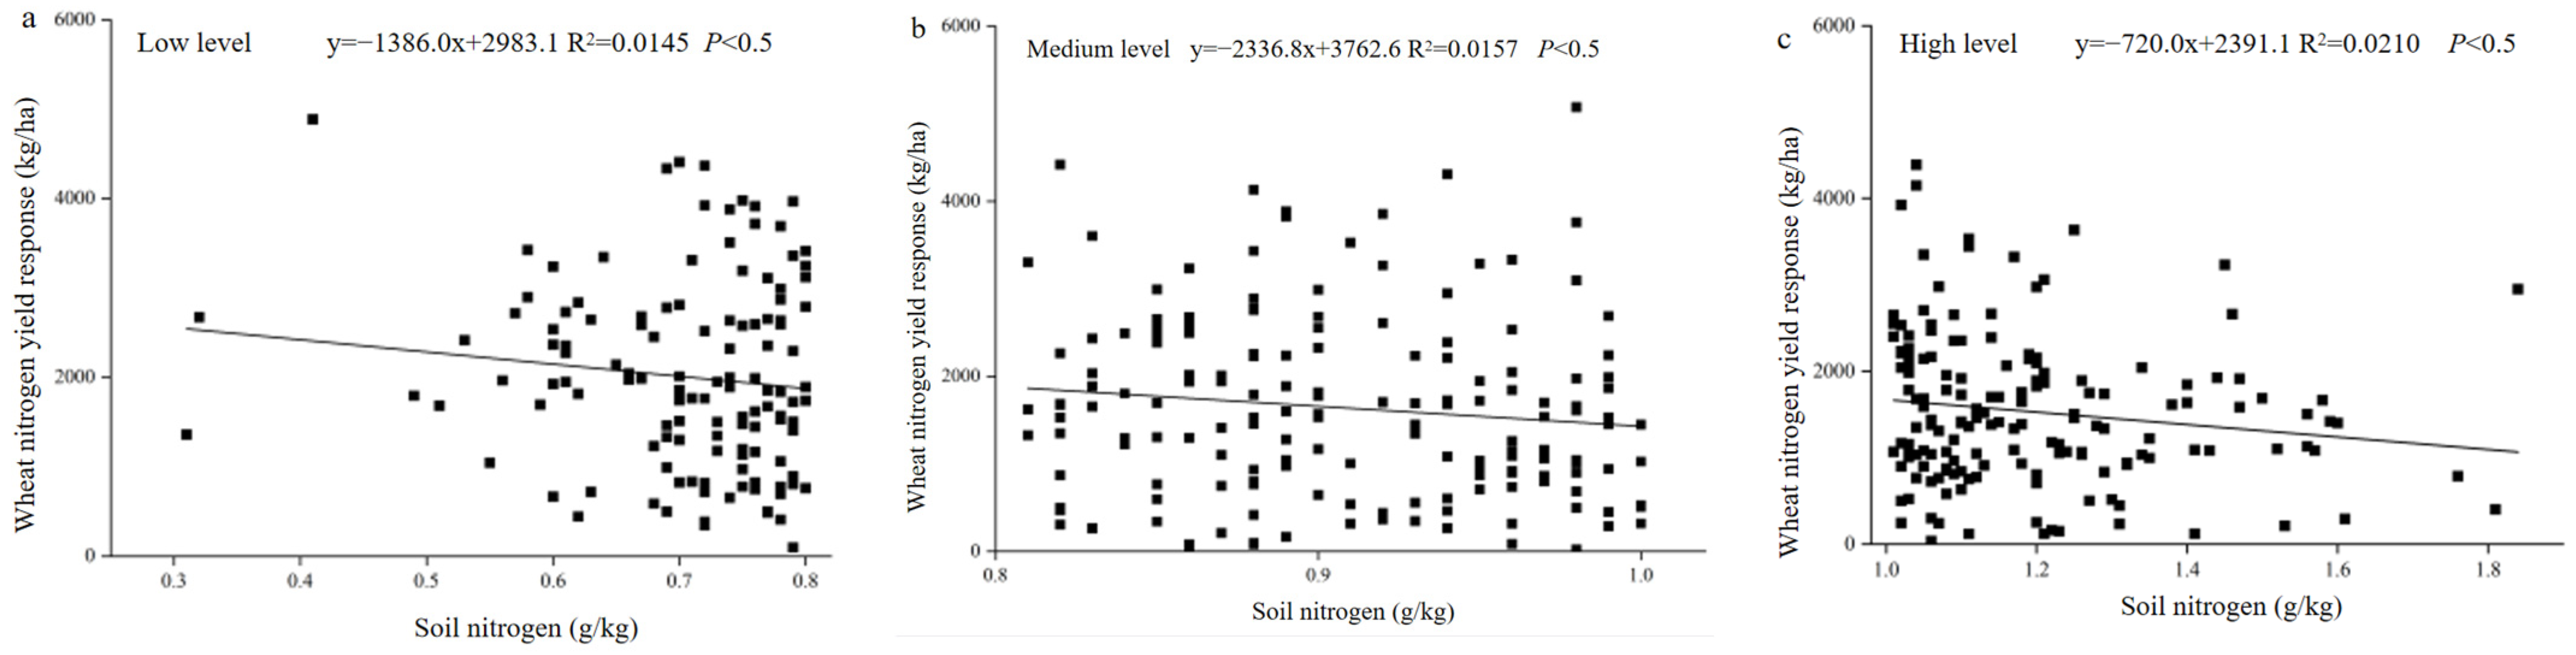
3.5. Soil Nitrogen Supply Capacity and Wheat Nitrogen Uptake
4. Discussion
4.1. Multiple Reasons for Spatial Variation in Wheat Nitrogen Yield Response
4.2. The Main Factors Influencing the Soil Nitrogen Mineralization Rate
5. Conclusions
Author Contributions
Funding
Data Availability Statement
Conflicts of Interest
References
- Wang, R.R.; Wang, H.Q.; Jiang, G.Y.; Liu, J.G.; Yin, H.J.; Xie, B.Y.; Che, Z.Q.; Jiang, F.; Zhang, T. Effect of nitrogen application on root and yield traits of Chinese spring wheat (Triticum aestivum L.) under drip irrigation. Agronomy 2022, 12, 2618. [Google Scholar] [CrossRef]
- Chuan, L.; He, P.; Pampolino, M.F.; Johnston, A.M.; Jin, J.; Xu, X.; Zhao, S.; Qiu, S.; Zhou, W. Establishing a scientific basis for fertilizer recommendations for wheat in China: Yield response and agronomic efficiency. Field Crop. Res. 2013, 140, 1–8. [Google Scholar] [CrossRef]
- Pelzer, E.; Bazot, M.; Makowski, D.; Corre-Hellou, G.; Naudin, C.; Al Rifaï, M.; Baranger, E.; Bedoussac, L.; Biarnes, V.; Boucheny, P.; et al. Pea-wheat intercrops in low input conditions combine high economic performances and low environmental impacts. Eur. J. Agron. 2012, 40, 39–53. [Google Scholar] [CrossRef]
- Alhajj Ali, S.; Tedone, L.; Verdini, L.; De Mastro, G. Effect of different crop management systems on rainfed durum wheat GHG emissions and carbon footprint under Mediterranean conditions. J. Clean. Prod. 2017, 140, 608–621. [Google Scholar] [CrossRef]
- Bouwman, A.F.; Boumans, L.J.M.; Batjes, N.H. Emissions of N2O and NO from fertilized fields: Summary of available measurement data. Glob. Biogeochem. Cycles 2002, 16, 6-1–6-13. [Google Scholar] [CrossRef]
- Abedi, T.; Alemzadeh, A.; Kazemeini, S.A. Effect of organic and inorganic fertilizers on grain yield and protein banding pattern of wheat. Aust. J. Crop Sci. 2010, 4, 384–389. [Google Scholar]
- Chen, J.; Luo, Y.; van Groenigen, K.J.; Hungate, B.A.; Cao, J.; Zhou, X.; Wang, R.-W. A keystone microbial enzyme for nitrogen control of soil carbon storage. Sci. Adv. 2018, 4, eaaq1689. [Google Scholar] [CrossRef] [Green Version]
- Saudy, H.S.; Hamed, M.F.; Abd El-Momen, W.R.; Hussein, H. Nitrogen use rationalization and boosting wheat productivity by applying packages of humic, amino acids, and microorganisms. Commun. Soil Sci. Plan. 2020, 51, 1036–1047. [Google Scholar] [CrossRef]
- Weigel, A.; Russow, R.; Korschens, M. Quantification of airborne N input in long-term field experiments and its validation through measurements using 15N isotope dilution. J. Plant Nutr. Soil Sci. 2000, 163, 261–265. [Google Scholar] [CrossRef]
- Ju, X.T.; Pan, J.R.; Liu, X.J.; Chen, X.P.; Zhang, F.S.; Mao, D. The fate of nitrogen fertilizer in winter wheat growth season under high soil fertility condition. Acta Agric. Nucl. Sin. 2002, 16, 397–402, (In Chinese with English Abstract). [Google Scholar]
- Saudy, H.S.; El-Momen, W.R.A.; El-Khouly, N.S. Diversified nitrogen rates influence nitrogen agronomic efficiency and seed yield response index of sesame (Sesamum indicum L.) cultivars. Commun. Soil Sci. Plant Anal. 2018, 49, 2387–2395. [Google Scholar] [CrossRef]
- Zhang, Y.; Liu, X.; Fangmeier, A.; Goulding, K.; Zhang, F. Nitrogen inputs and isotopes in precipitation in the North China Plain. Atmos. Environ. 2008, 42, 1436–1448. [Google Scholar] [CrossRef]
- Jia, S.; Yuan, D.; Li, W.; He, W.; Raza, S.; Kuzyakov, Y.; Zamanian, K.; Zhao, X. Soil Chemical Properties Depending on Fertilization and Management in China: A Meta-Analysis. Agronomy 2022, 12, 2501. [Google Scholar] [CrossRef]
- Liu, X.; Ju, X.; Zhang, Y.; He, C.; Kopsch, J.; Fusuo, Z. Nitrogen deposition in agroecosystems in the Beijing area. Agric. Ecosyst. Environ. 2006, 113, 370–377. [Google Scholar] [CrossRef]
- He, C.-E.; Liu, X.; Fangmeier, A.; Zhang, F. Quantifying the total airborne nitrogen input into agroecosystems in the North China Plain. Agric. Ecosyst. Environ. 2007, 121, 395–400. [Google Scholar] [CrossRef]
- Tedone, L.; Ali, S.A.; Verdini, L.; De Mastro, G. Nitrogen management strategy for optimizing agronomic and environmental performance of rainfed durum wheat under Mediterranean climate. J. Clean. Prod. 2018, 172, 2058–2074. [Google Scholar] [CrossRef]
- Li, X.; Dong, W.L.; Song, A.L.; Li, Y.L.; Lu, Y.Q.; Wang, E.Z.; Liu, X.D.; Wang, M.; Fan, F.L. Effects of straw addition on soil biological N2-fixation rate and diazotroph community properties. Sci. Agric. Sin. 2020, 54, 980–991, (In Chinese with English Abstract). [Google Scholar]
- Fu, W.; Wang, Y.; Ye, Y.; Zhen, S.; Zhou, B.; Wang, Y.; Hu, Y.; Zhao, Y.; Huang, Y. Grain Yields and Nitrogen Use Efficiencies in Different Types of Stay-Green Maize in Response to Nitrogen Fertilizer. Plants 2020, 9, 474. [Google Scholar] [CrossRef] [Green Version]
- Cai, T.; Chen, Y.; Pan, J.; Ye, Y.; Miao, Q.; Zhang, H.; Cui, Z. Improved Crop Management Achieved High Wheat Yield and Nitrogen Use Efficiency. Int. J. Plant Prod. 2021, 15, 317–324. [Google Scholar] [CrossRef]
- Zhu, J.X.; He, N.P.; Wang, Q.F.; Yuan, G.F.; Wen, D.; Yu, G.R.; Jia, Y.L. The composition, spatial patterns, and influencing factors of atmospheric nitrogen deposition in Chinese terrestrial ecosystems. Sci. Total Environ. 2015, 511, 777–785. [Google Scholar] [CrossRef]
- Jia, Y.; Yu, G.; Gao, Y.; He, N.; Wang, Q.; Jiao, C.; Zuo, Y. Global inorganic nitrogen dry deposition inferred from ground- and space-based measurements. Sci. Rep. 2016, 6, 19810. [Google Scholar] [CrossRef] [Green Version]
- Speiser, J.L.; Miller, M.E.; Tooze, J.; Ip, E. A comparison of random forest variable selection methods for classification prediction modeling. Expert Syst. Appl. 2019, 134, 93–101. [Google Scholar] [CrossRef] [PubMed]
- Liu, F.; Zhang, G.-L.; Song, X.; Li, D.; Zhao, Y.; Yang, J.; Wu, H.; Yang, F. High-resolution and three-dimensional mapping of soil texture of China. Geoderma 2020, 361, 114061. [Google Scholar] [CrossRef]
- Chen, Y.L.; Jiao, X.G. Semivariogram fitting with linear programming. Comput. Geosci. 2001, 27, 71–76. [Google Scholar] [CrossRef]
- Macholdt, J.; Piepho, H.-P.; Honermeier, B. Mineral NPK and manure fertilisation affecting the yield stability of winter wheat: Results from a long-term field experiment. Eur. J. Agron. 2018, 102, 14–22. [Google Scholar] [CrossRef]
- Faber, A.; Jarosz, Z.; Rutkowska, A.; Jadczyszyn, T. Reduction of Nitrogen Losses in Winter Wheat Grown on Light Soils. Agronomy 2021, 11, 2337. [Google Scholar] [CrossRef]
- Li, J.; Wang, Z.; Song, Y.; Li, J.; Zhang, Y. Effects of Reducing Nitrogen Application Rate under Different Irrigation Methods on Grain Yield, Water and Nitrogen Utilization in Winter Wheat. Agronomy 2022, 12, 1835. [Google Scholar] [CrossRef]
- Chen, J.; Manevski, K.; Lærke, P.E.; Jørgensen, U. Biomass yield, yield stability and soil carbon and nitrogen content under cropping systems destined for biorefineries. Soil Tillage Res. 2022, 221, 105397. [Google Scholar] [CrossRef]
- Li, C.; Wang, X.; Qin, M. Spatial variability of soil nutrients in seasonal rivers: A case study from the Guo River Basin, China. PLoS ONE 2021, 16, e0248655. [Google Scholar] [CrossRef]
- Xu, H.-C.; Dai, X.-L.; Chu, J.-P.; Wang, Y.-C.; Yin, L.-J.; Ma, X.; Dong, S.; He, M.-R. Integrated management strategy for improving the grain yield and nitrogen-use efficiency of winter wheat. J. Integr. Agric. 2018, 17, 315–327. [Google Scholar] [CrossRef]
- Zhang, N.; Zhang, H.L.; Qu, Z.Y.; Zhang, D.L. Fractal study on organic matter spatial heterogeneity of different soil layers in Inner Mongolia Hetao irrigation district. Agric. Res. Arid Areas 2017, 35, 157–163, (In Chinese with English Abstract). [Google Scholar]
- Dogan, R.; Bilgili, U. Effects of previous crop and N-fertilization on seed yield of winter wheat (Triticum aestivum L.) under rain-fed Mediterranean conditions. Bulg. J. Agric. Sci. 2010, 16, 733–739. [Google Scholar]
- Dessureault-Rompré, J.; Zebarth, B.J.; Georgallas, A.; Burton, D.L.; Grant, C.A.; Drury, C.F. Temperature dependence of soil nitrogen mineralization rate: Comparison of mathematical models, reference temperatures and origin of the soils. Geoderma 2010, 157, 97–108. [Google Scholar] [CrossRef]
- Autret, B.; Guillier, H.; Pouteau, V.; Mary, B.; Chenu, C. Similar specific mineralization rates of organic carbon and nitrogen in incubated soils under contrasted arable cropping systems. Soil Tillage Res. 2020, 204, 104712. [Google Scholar] [CrossRef]
- McKenzie, R.H.; Bremer, E.; Middleton, A.B.; Pfiffner, P.G.; E Dowbenko, R. Controlled-release urea for winter wheat in southern Alberta. Can. J. Soil Sci. 2007, 87, 85–91. [Google Scholar] [CrossRef]
- Devita, P.; Dipaolo, E.; Fecondo, G.; Difonzo, N.; Pisante, M. No-tillage and conventional tillage effects on durum wheat yield, grain quality and soil moisture content in southern Italy. Soil Tillage Res. 2007, 92, 69–78. [Google Scholar] [CrossRef]


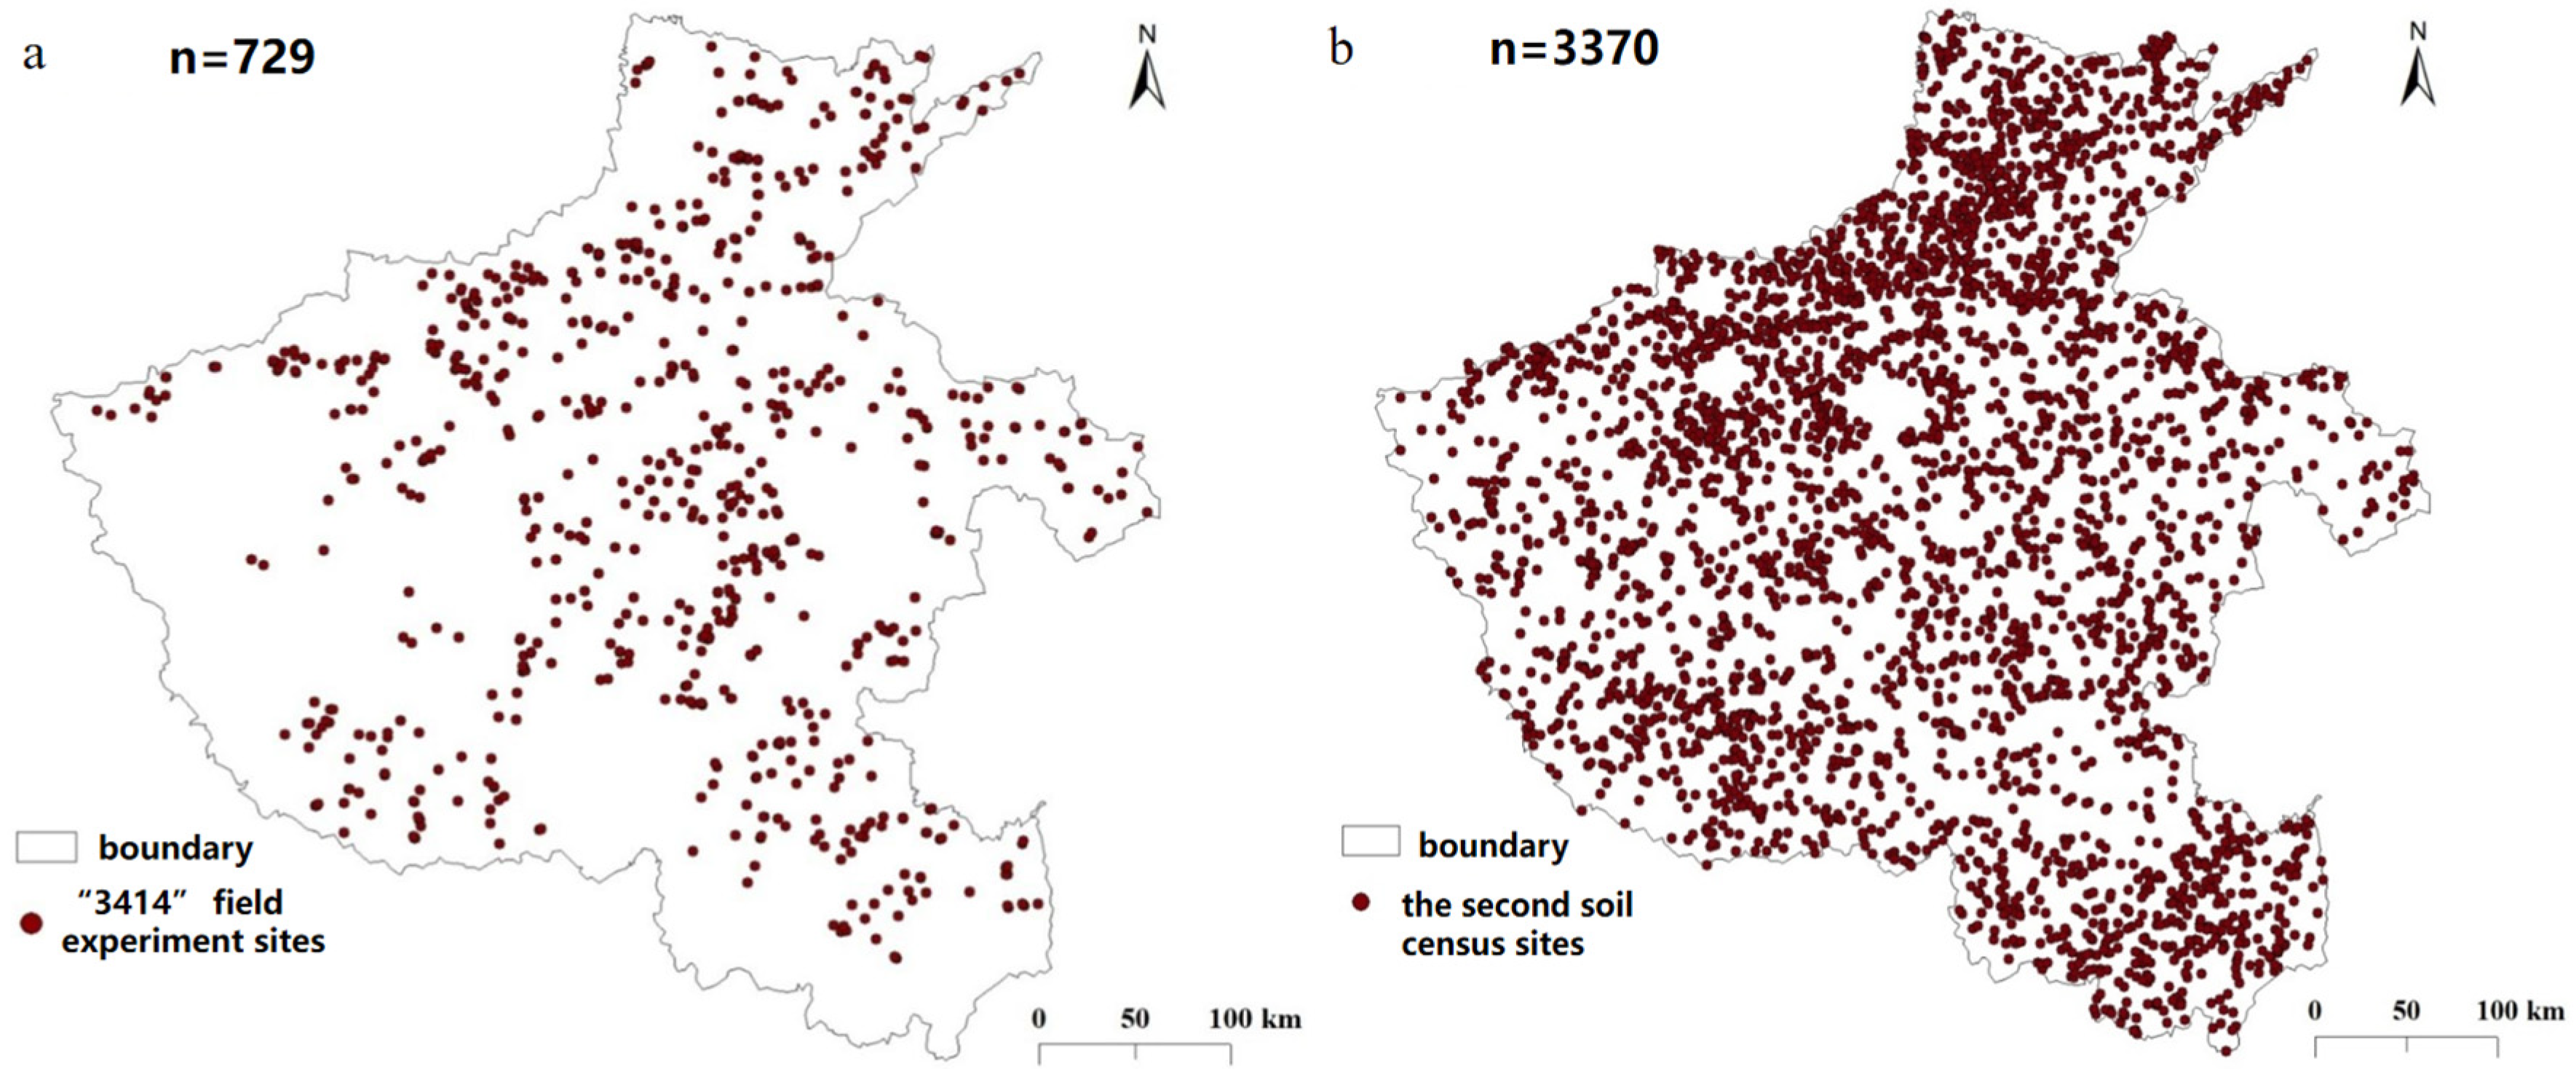
| Variables | Soil Samples | Source | Year |
|---|---|---|---|
| Wheat yield | 729 | “3414” field experiment | 2010 |
| Soil nitrogen content | 3370 | The second soil census | 1980 |
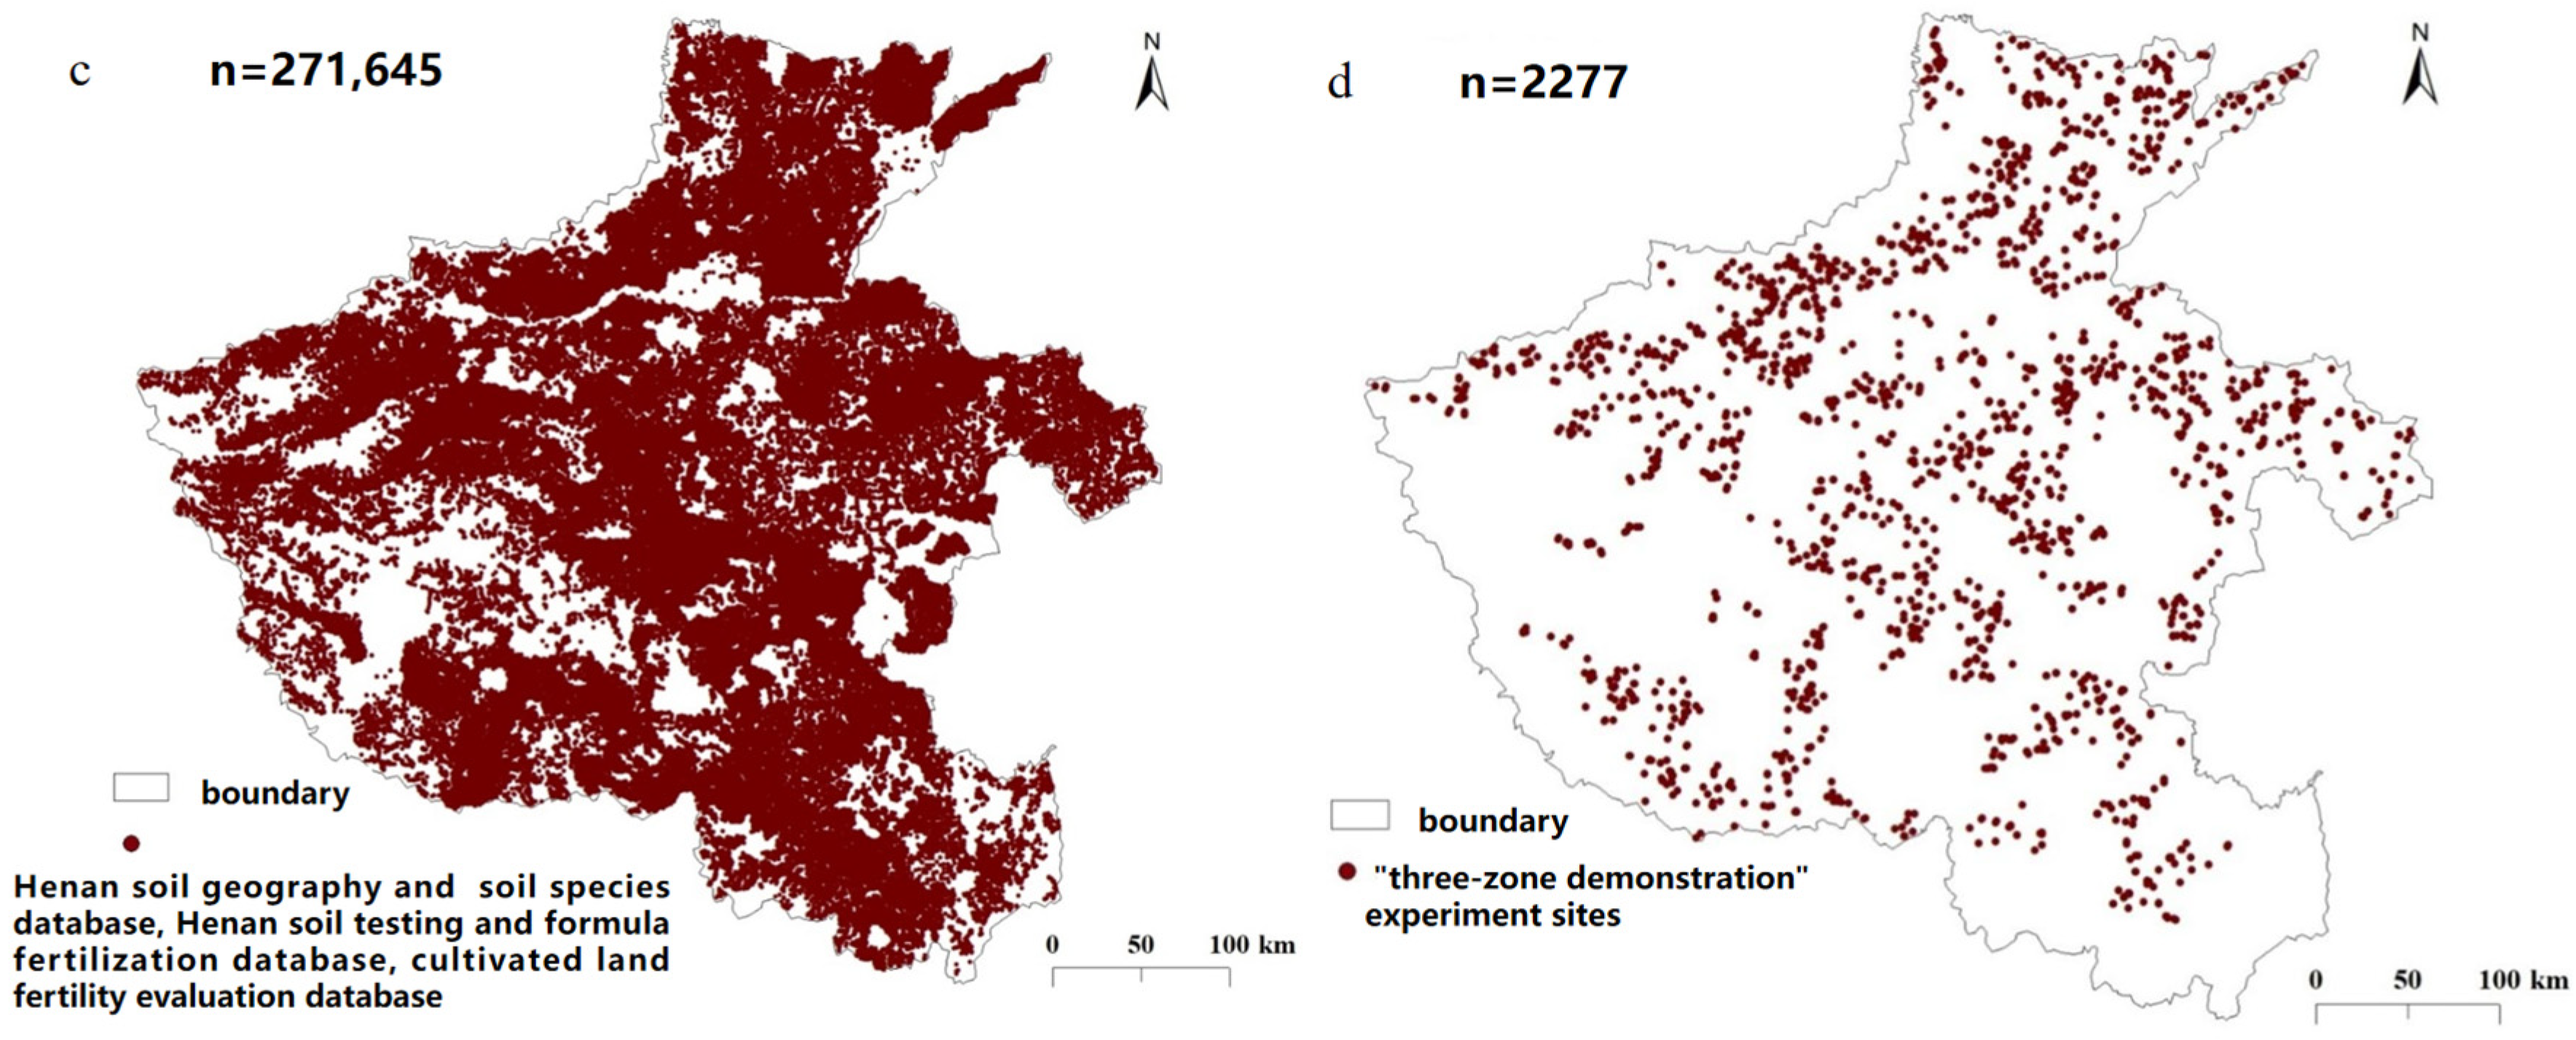
| Soil nitrogen content | 271,645 | Henan Province soil testing and formula fertilization and cultivated land fertility evaluation database | 2010 |
| Nitrogen fertilization application | 2277 | “three-zone demonstration” experiment | 2010 |
| Variables | Abbreviation | Format | Resolution | Source |
|---|---|---|---|---|
| Precipitation | Pre. | Polygon | 1:3,500,000 | National Data Center for Meteorological Sciences, 2010 |
| Evaporation | Eva. | Polygon | 1:3,500,000 | National Data Center for Meteorological Sciences, 2010 |
| Sunshine hours | SH | Polygon | 1:3,500,000 | National Data Center for Meteorological Sciences, 2010 |
| Emissivity | Emi. | Polygon | 1:3,500,000 | National Data Center for Meteorological Sciences, 2010 |
| Accumulated temperature | AT | Polygon | 1:3,500,000 | National Data Center for Meteorological Sciences, 2010 |
| Fertilization Treatments | Number | Minimum Yield (kg/ha) | Maximum Yield (kg/ha) | Average Yield (kg/ha) | Standard Error |
|---|---|---|---|---|---|
| No nitrogen | 729 | 1871 | 8772 | 5219 | 52 |
| Recommended nitrogen | 729 | 2393 | 10,467 | 6881 | 46 |
| Wheat nitrogen yield response | 729 | 528 | 4887 | 1662 | 37 |
| Pre. | Eva. | SH | Emi. | AT |
| 0.364 ** | −0.057 | −0.270 ** | 0.015 | 0.249 ** |
| pH | OM | TN | AP | AK |
| −0.248 ** | −0.148 ** | −0.113 ** | 0.031 | −0.183 ** |
Disclaimer/Publisher’s Note: The statements, opinions and data contained in all publications are solely those of the individual author(s) and contributor(s) and not of MDPI and/or the editor(s). MDPI and/or the editor(s) disclaim responsibility for any injury to people or property resulting from any ideas, methods, instructions or products referred to in the content. |
© 2023 by the authors. Licensee MDPI, Basel, Switzerland. This article is an open access article distributed under the terms and conditions of the Creative Commons Attribution (CC BY) license (https://creativecommons.org/licenses/by/4.0/).
Share and Cite
Feng, X.; Li, Y.; Zhao, Y.; Chen, J. Spatial Variability Analysis of Wheat Nitrogen Yield Response: A Case Study of Henan Province, China. Agronomy 2023, 13, 1796. https://doi.org/10.3390/agronomy13071796
Feng X, Li Y, Zhao Y, Chen J. Spatial Variability Analysis of Wheat Nitrogen Yield Response: A Case Study of Henan Province, China. Agronomy. 2023; 13(7):1796. https://doi.org/10.3390/agronomy13071796
Chicago/Turabian StyleFeng, Xiaojie, Yixin Li, Yanfeng Zhao, and Jie Chen. 2023. "Spatial Variability Analysis of Wheat Nitrogen Yield Response: A Case Study of Henan Province, China" Agronomy 13, no. 7: 1796. https://doi.org/10.3390/agronomy13071796
APA StyleFeng, X., Li, Y., Zhao, Y., & Chen, J. (2023). Spatial Variability Analysis of Wheat Nitrogen Yield Response: A Case Study of Henan Province, China. Agronomy, 13(7), 1796. https://doi.org/10.3390/agronomy13071796