Article

Apical Dominance and Branching in Plantlets of Colt Cherry Lines Expressing Different Light and Auxin Signalling Sensitivities

1
Department of Agriculture, Food and Environment (DAFE), University of Pisa, Via del Borghetto 80, 56124 Pisa, Italy
2
Department of Agricultural and Forestry Sciences (DAFNE), Tuscia University, Via S. C. De Lellis, snc., 01100 Viterbo, Italy
3
School of Life Sciences, University of Warwick, Coventry CV4 7AL, UK
4
Vivai Piante Battistini Soc. Agr. s.s., Via Ravennate 1500, 47522 Cesena, Italy
5
Department of Chemical, Pharmaceutical and Agricultural Sciences (DOCPAS), University of Ferrara, Via Luigi Borsari 46, 44121 Ferrara, Italy
*
Author to whom correspondence should be addressed.
Agronomy 2023, 13(8), 2018; https://doi.org/10.3390/agronomy13082018
Submission received: 13 June 2023 / Revised: 21 July 2023 / Accepted: 27 July 2023 / Published: 29 July 2023
(This article belongs to the Section Horticultural and Floricultural Crops)

Abstract

:
The establishment of plant architecture requires coordination of distinct processes including shoot branching and apical dominance (AD). AD involves the bud apical shoot, mainly through indole-3-acetic acid (IAA) synthetized by the cells of the meristem and young leaves. The rootward flow generates an auxin gradient in the stem and buds, regulating lateral bud (LB) outgrowth. Phytochromes and AD are involved in the shade-avoidance syndrome in woody plants. However, the underlying mechanisms remain poorly understood. The aim of this study was to evaluate the sensitivity of cherry rootstocks to light, mediated by the photoreceptor phytochrome, and its effect on the role of auxin in driving branching by AD. Pharmacological treatments using transport inhibitors and a competitor of IAA were applied to transgenic lines of Colt cherry rootstock, which showed different sensitivities to light because of the ectopic expression of a rice phyA gene. Results showed different physiological behaviours among the transgenic lines and between themselves and the Colt-wt line. Exogenous IBA inhibited Colt-wt LB outgrowth, and this inhibition was less intense in transgenic lines. The IAA-inhibitors and IAA-competitor promoted branching. In in vitro phyA-transgenic plantlets, the ectopic gene induced greater branching and a higher number of buds developed in new shoots. This work confirms a positive action of phytochrome on lateral branching in cherry rootstock, playing a role in the regulation of AD. Moreover, we suggest that the confined in vitro system might now be used as a phenotyping screening to test the plasticity of the response, highlighting the behaviour of modified genotypes due to an ectopic insertion event by simple and rapid procedures.

1. Introduction

The inhibitory control exerted by the meristem of the terminal bud on the underlying lateral buds (LB) hampers their outgrowth in lateral shoots (LS); this interaction is commonly explained by the physiological action of endogenous auxin, a phenomenon known as apical dominance (AD), correlative inhibition, or paradormancy [1,2,3]. Meristem and young leaf tissues synthetize and secrete indole-3-acetic acid (IAA) [4,5,6], and from these organs, it is basipetally transported through the tissues of the stem to the sink organs [7]. This can prevent the outflow of auxin from the meristems of the LBs, which, correlated with sugar availability, inhibits their outgrowth, thus establishing the inhibition of branching [8]. IAA moves passively rootwards in the phloem, and it is actively transported through the cells of vascular cambium in a gravitropic and lateral polar manner [9,10], regulated by carrier proteins [11]. The influx AUX1/LAX and effluxes PINs and ABCBs are auxin carriers which contribute to the directionality of auxin transport towards the LB organs [11,12,13]. Auxin regulates the contrasting hormones cytokinins and strigolactones, both of which move shootward from the roots and promote and inhibit LB outgrowth, respectively [14]. The inhibitors of IAA interrupt the basipetal, acropetal, and lateral auxin transport flow and reduce the efflux of IAA towards and inside the sink organs, as occurs with the inhibitors 2,3,5,-triiodobenzoic acid (TIBA) and 1-N-naphthylphthalamic acid (NPA). In addition, the inhibitor may compete for the recognition site, as is the case with p-Chlorophenoxyisobutyric acid (PCIB), AUX/IAA proteins [15] or the ARF protein recognition site [16], which transfers the auxin signal to the nucleus, selectively activating and/or repressing gene expression. Changes in the content of IAA in LBs regulate the activation of cell division and outgrowth of buds in LSs [17], which are positively regulated by cytokinin, which permits the export of auxin from LBs [18].
Light quantity, duration, quality, and direction are fundamental for the development and growth of plants [19,20,21]. Plant chromoproteins perceive and translate the physical signal of surrounding light into biochemical signals and regulate gene expression and physiological and phenological events of the response. Phytochromes are chromoproteins that exist in two forms, Pr, which absorbs maximally in the red (610–690 nm), and Pfr, which absorbs in the far-red (700–750 nm) and is generally considered to be the biologically active form. The two forms are reciprocally photo-interconvertible and establish an equilibrium depending on the relative quantities of red and far-red photons of the incident radiation, determining the Pfr amounts and hence the regulatory input of phytochrome, even when plants are grown under in vitro systems [22]. Therefore, red and far-red light is an environmental signalling factor that regulates the development and ecological interactions of plants both in heterogeneous and homogeneous communities [23,24,25,26,27,28]. The competitive interaction between plants determines the success of an individual and/or a species and manifests itself with syndromes, including the shadow escape syndrome, that enhances AD and the correlative inhibition of branching, that control plant architecture [29]. It is known that in phyB mutant plants of several species, the AD is enhanced [30,31,32]. In plants exposed to a low R:FR ratio, the chromoprotein PHYTOCHROME A (PHYA), regulating the photoperiod responses, antagonizes the action of the chromoprotein PHYB, which regulates shade avoidance responses in the control of elongation growth [33,34], although it has been also found that PHYA mediates some PHYB responses [35], acting in detecting shading conditions through the change in the R:FR ratio [36,37].
In the in vitro culture systems, cytokinins added into the medium removed the AD and promoted the outgrowth of LBs. Shoot proliferation is the result of two distinct events: the development of new LBs (nodes) and the escape of the buds from inhibition [38]. Light modulates endogenous cytokinin amounts [39,40], an event that was found to be relevant in the outgrowth of LBs in shoot clusters of plum, peach, and apple rootstocks [41,42]. Exogenous auxin, usually IBA, is added into the medium at a very low amount to improve the quality of micropropagated plantlets, taking advantage of the possibility that auxins can also be transported acropetally through the xylem [43], and probably through appropriate IBA-transporters which are spread across different tissues [44].
In a plant nursery farm which uses micropropagation as the multiplication procedure, branching degree represents the possibility of increasing the number of plants to commercialize with relevant economic aspects [45]. The different sensitivities to light of plantlets were induced by an ectopic insertion of the phytochrome A (phyA) gene of rice into the Colt genome [23]. The aim of this work was to improve our knowledge on shoot branching, AD, and LBs and plantlets’ development under the pharmacological inhibition of the endogenous auxin IAA in in vitro grown plantlet lines of Colt rootstock (P. avium × P. cerasus), showing different sensitivities to light. Finally, this study evaluated whether the in vitro growth system may be a suitable system to highlight different phenotypic behaviours, so that it can be used as a quick and simple phenotyping system for studying modified genotypes.

2. Materials and Methods

2.1. Plant Material and Culture Medium

The phyA-transgenic lines of the Colt cherry rootstock were obtained as previously reported [23,26]. Plantlets were grown on DKW medium [46], with 20 g L−1 of sucrose added, and with the plant growth regulators BAP (1.5 mg L−1; 6.66 µM), IBA (0.1 mg L−1; 0.5 µM), and GA3 (0.1 mg L−1; 2.88 µM). The pH was titrated to 5.8 before a sterilization cycle in an autoclave at 120 °C for 20 min; the gelling of the medium was carried out by adding 7 g L−1 of Bacto-Agar (Difco, Sigma Aldrich, Milan, Italy). The temperature of the growth chamber was maintained at 24 ± 1 °C, with a photoperiod of 16/8 light/darkness. The white light source was obtained with Philips TDL 18 W/35 fluorescent lamps with an irradiance of 40 μM m−2 s−1. The same DKW medium was used in the tests.
Plantlets of Colt-PD3, Colt-PO1, Colt-PO2, and Colt-PA lines, from 24 subcultures sharing a homologous genetic background, carrying the phyA alien gene of rice (Supplementary Figures S4 and S5, Appendix A), but showing different sensitivities to light, and the Colt-wt line as a control, were used.

2.2. Experimental Design and Parameters

The auxin inhibitors were dissolved in a few drops of absolute ethanol and brought to volume with sterilized warm water. Plantlets were subjected to four treatments for each inhibitor; for TIBA (Merck, Milan, Italy), the treatments were 0.01, 0.1, 1, and 2 mg L−1 (0.02 µM, 0.2 µM, 2 µM, and 4 µM, respectively), whereas for the treatments with PCIB (Merck, Milan, Italy) and NPA (Merck, Milan, Italy) the quantities used were 0.01, 0.1, 0.5, and 1 mg L−1 (0.046 µM, 0.46 µM, 2.3 µM, and 4.6 µM, respectively, for PCIB; 0.034 µM, 0.34 µM, 1.7 µM, and 3.4 µM, respectively, for NPA). Finally, two further treatments were performed that were used as a control: the first without IBA (IBA0), and the second with the addition of IBA 0.1 mg L−1 (IBA01), without inhibitors.
For each treatment, five glass containers were used, each containing five plantlets of each line, about 15 mm long and uniform in vigour, with five nodes and a mean fresh weight of about 20 mg, were placed on 50 mL of medium in 250 mL glass containers. All experiments were repeated twice, and the average data of all five plantlets for each glass were pooled together for the statistical analysis. At the end of each subculture (21 days), the total fresh weight of the cluster, increase in elongation of the shoot leader, number of newly formed nodes (LBs), number and position of outgrowing buds, and number of newly formed lateral shoots (LSs) on the stem leader were recorded for each Colt line perauxin inhibitor treatments. The mean internode length and the number of nodes per centimetre, which represent the potential of branching, and the effective degree of branching, were also calculated. Finally, AD was assessed by counting the number of nodes interposed between the apex and the first outgrowing LB into a LS, indicated as distance from the apex [41].

2.3. Statistical Analysis

Statistical analyses were performed for each auxin inhibitor by using one-way analysis of variance (ANOVA test) based on a completely randomized block design; each analysis was performed by the DSAASTAT [47] and mean values were separated by Tukey’s test at p < 0.05. Percentage data before the ANOVA test were transformed into arcsine values before analysis in order to homogenize the variance, and the data shown in the results were back transformed.
CDA (canonical discriminant analysis) and MDA (multigroup discriminant analysis) factorial discriminant analyses were conducted on morpho-physiological traits and carbohydrate accumulations. MRPP and CDA allowed us to discriminate among genotypes under auxin inhibitors to evaluate the changes of the development of plantlets and branching traits in response to the combined treatments. These analyses were performed by using the JMP 4.0 statistical software package (SAS Institute Inc., Cary, NC, USA).

3. Results

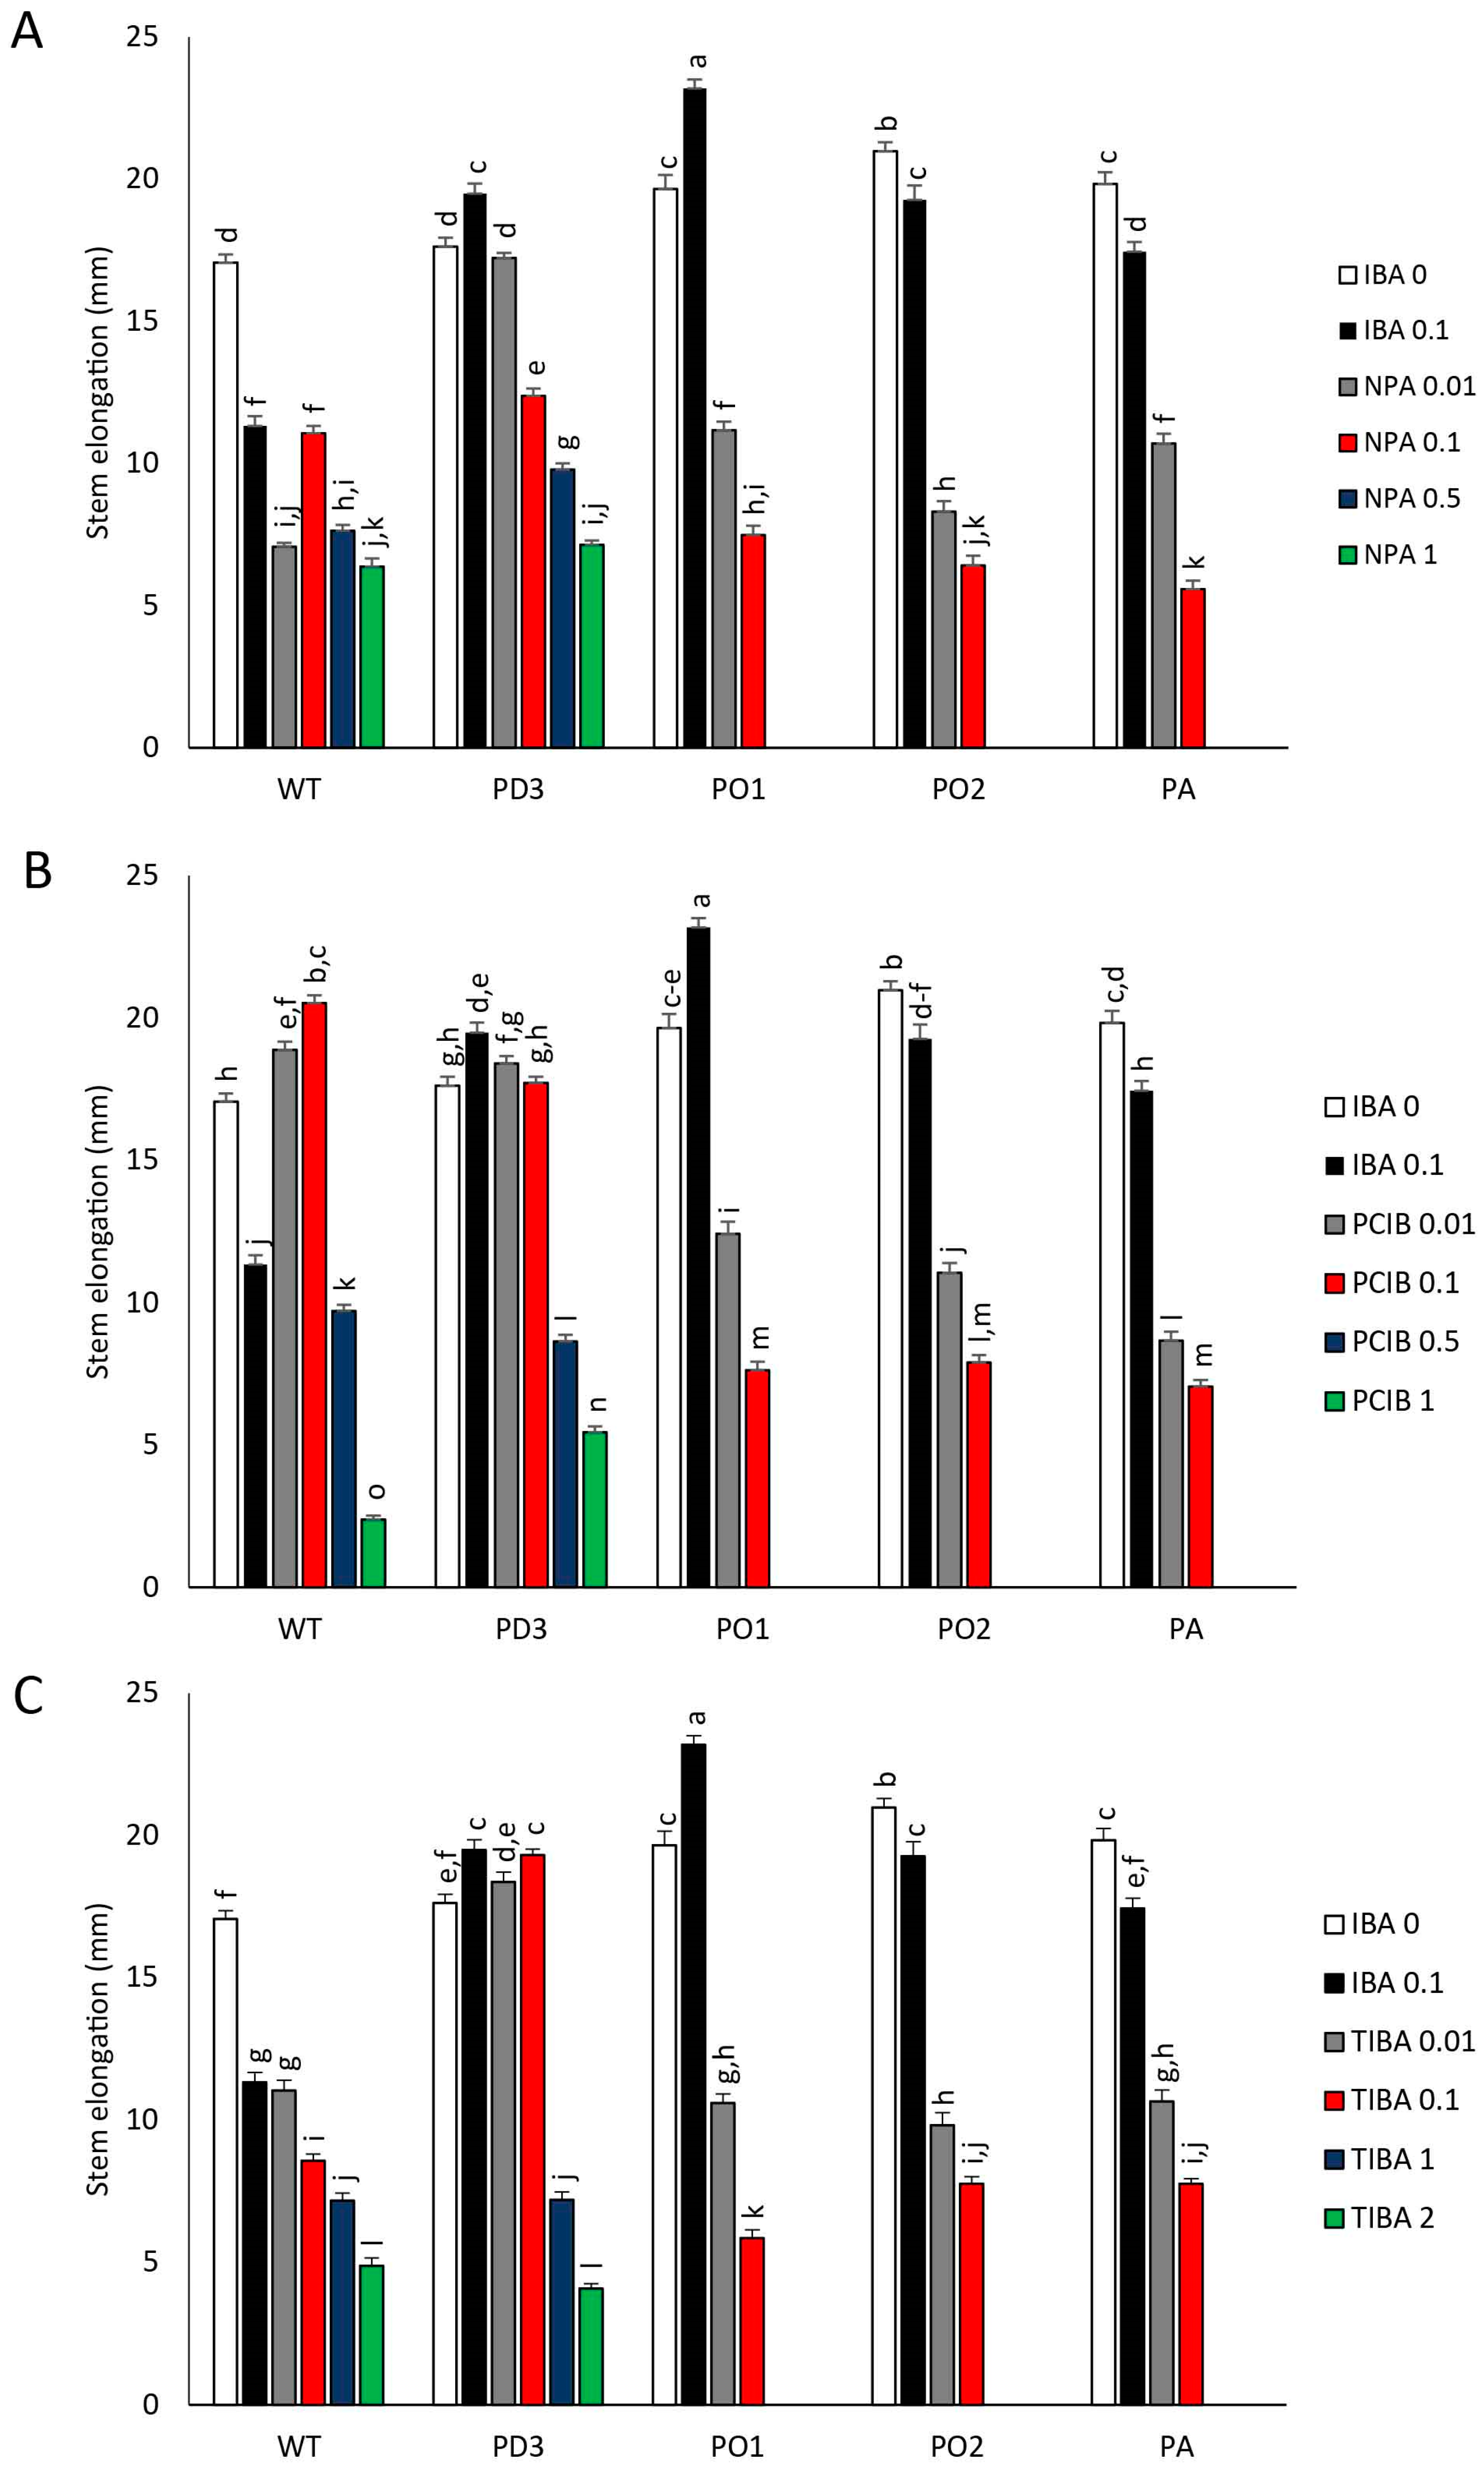
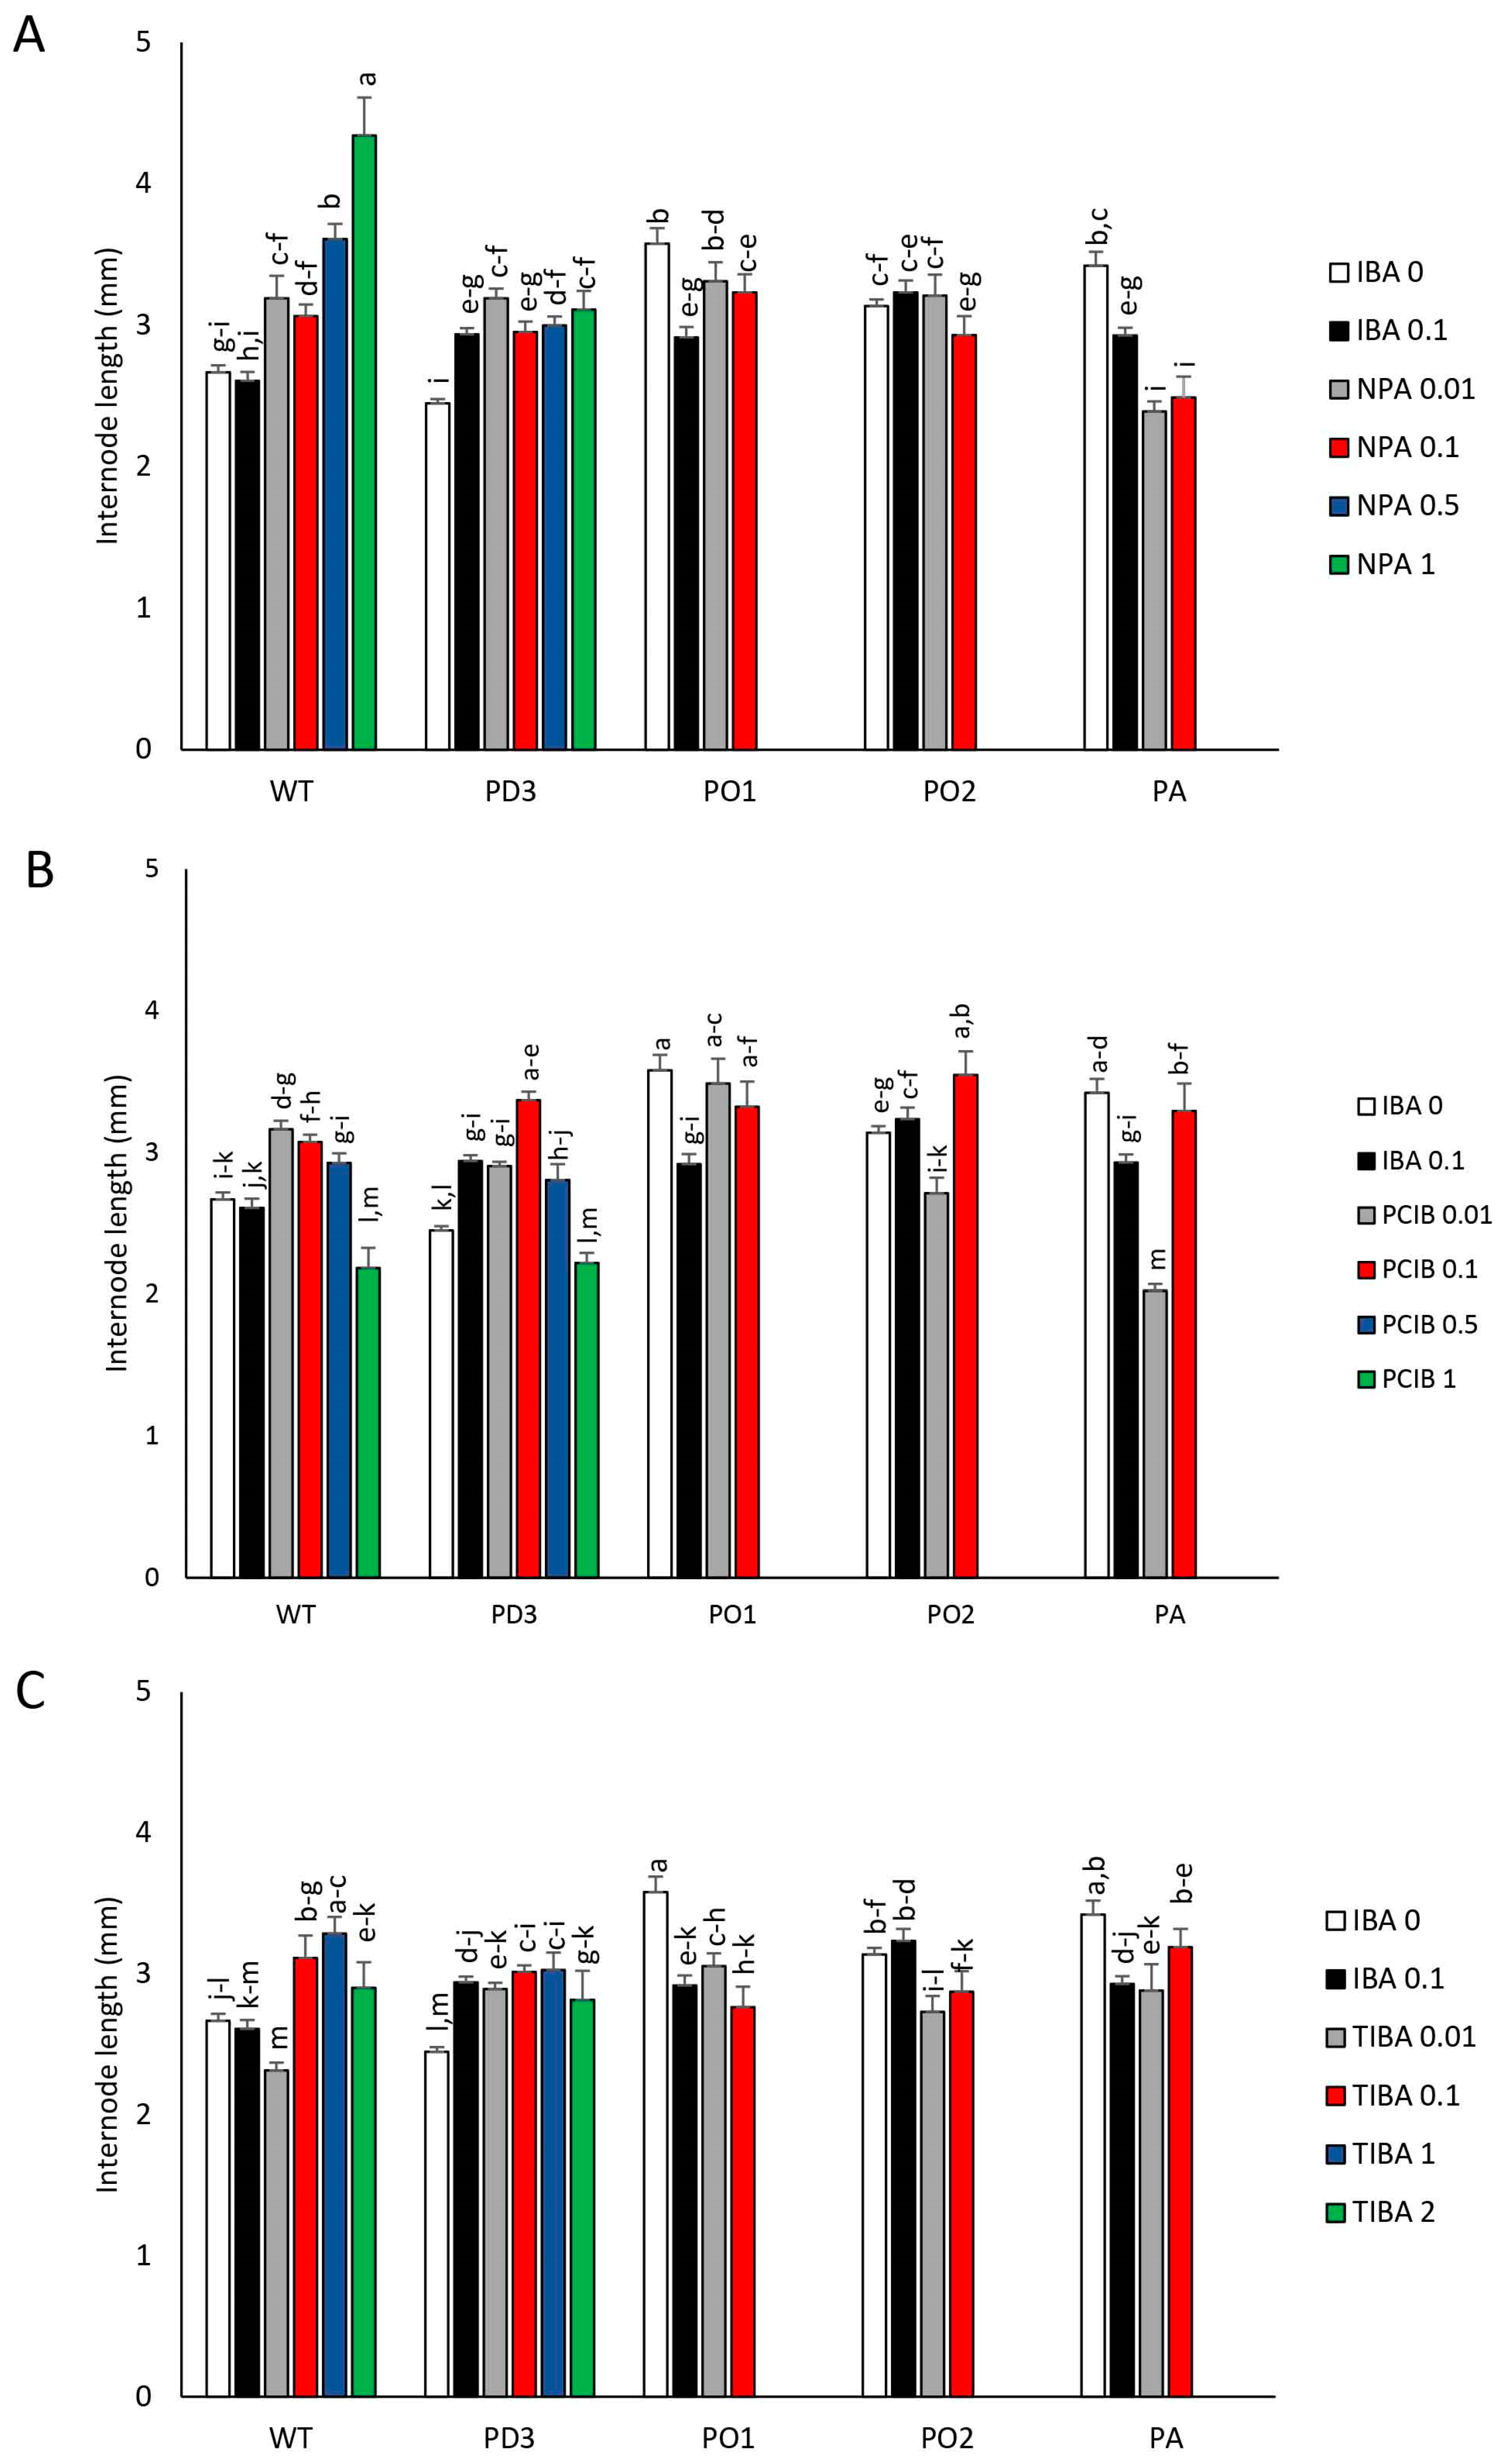
3.1. Plantlet Growth

The stem leader of the phyA-transgenic lines Colt-PO1, Colt-PO2, and Colt-PA scored the greatest elongation compared to Colt-wt and Colt-PD3 when grown in IBA0 medium (Figure 1A–C).
The treatment with the three auxin inhibitors NPA, PCIB, and TIBA at the two highest concentrations (1 and 2 mg L−1 for TIBA, and 0.5 and 1 mg L−1 for PCIB and NPA) completely blocked the growth of the Colt-PO1, Colt-PO2, and Colt-PA plantlets (Figure 1A–C).
Plantlets of all phyA-transgenic lines reacted differently from wt-lines to the application of exogenous auxin, showing an increase in stem elongation. The elongation of plantlet stems was inhibited by IBA in the Colt-wt line by 34% compared to IBA0, and at lesser intensity in the phyA-transgenic Colt-PO2 and Colt-PA lines (8% and 12%, respectively). A significant increment was detected in the plantlets of phyA-transgenic Colt-PD3 and Colt-PO1 lines (Figure 1A–C and Figure S1). Surprisingly, the auxin competitor PCIB, at the two lowest concentrations, stimulated the stem elongation in Colt-wt plantlets, whereas in Colt-PD3 plantlets, no variation in stem elongation was detectable compared to the two conditions of IBA0 and IBA0.1 (Figure 1B). Therefore, the behaviour of Colt-PD3 appeared similar to Colt-wt, but different from the other phyA-transgenic lines. In both lines, at the two highest concentrations of PCIB, a strong inhibition of the stem elongation of plantlets occurred (Figure 1B). In Colt-PO1, Colt-PO2, and Colt-PA, a highly significant reduction in stem elongation was detected at the lowest concentrations (Figure 1B). The addition to the medium of the auxin transport inhibitor NPA drastically blocked the elongation of the stem leader, except in the Colt-PD3 plantlets at the lowest concentration (Figure 1A and Figure S1), although the values were always higher than those of Colt-wt. All the lines treated with TIBA, except for plantlets of Colt-PD3 at the two lowest concentrations, sharply reduced growth by 50 to 100 percent stem elongation compared to those cultured in the two media, IBA0 and IBA0.1 (Figure 1C).
Internode extension in all phyA-transgenic lines, except for Colt-PD3, was significantly higher than in Colt-wt (Figure 2A–C) when plantlets were grown in IBA0. When auxin was present in the medium, the internode extension increased in all phyA-transgenic lines compared to Colt-wt. Only Colt-PO1 and Colt-PA plantlets showed a decrease in the mean internode extension in comparison to IBA0, while in Colt-PD3, the internode extension increased, and it remained equal in Colt-wt. The addition of NPA into the medium increased the internode extension in Colt-wt and Colt-PD3, whereas it remains unchanged overall in Colt-PO1 and Colt-PO2 compared to their growth in the IBA0 medium. Only the Colt-PA line showed a strong decrease in internode extension when treated with the inhibitor NPA (Figure 2A). The observations performed on PCIB-treated plantlets detected an increasing trend in Colt-wt at the three lower concentrations of inhibitor, whereas the internode extension decreased when plantlets were treated at the highest concentration (Figure 2B). Colt-PD3 appeared sensitive to PCIB 0.1, which induced the highest extension in this line, as well as in Colt-PO2. Although some different behaviours were observed, overall, the addition of TIBA in the medium induced greater internode extension at the higher concentrations only in Colt-wt (Figure 2C).
All clusters of the phyA-transgenic lines, except Colt-PA, showed a higher fresh weight in comparison to Colt-wt when grown in IBA0 (Supplementary Figure S2).
The presence of IBA at 0.1 mg L−1 negatively affected the fresh weight of the cluster of all lines. Among all the lines, the highest mass growth was detected in Colt-PD3 (Supplementary Figure S2). The addition of NPA to the media at the lowest concentration drastically reduced the fresh weight of Colt-wt plantlets, while in all phyA-transgenic lines, a comparable and weak reduction was observed. At the two higher concentrations, a strong reduction in the accumulation of fresh weight was observed in plantlets of Colt-wt, and to a lesser extent in Colt-PD3 (Supplementary Figure S2A). In all lines, lower values of fresh weight were detected under treatment with PCIB, in comparison to the IBA0 medium, although with a behaviour that differentiated all phyA-transgenic lines compared to the Colt-wt line under the two lowest concentrations (Supplementary Figure S2B). Only the Colt-PD3 line treated with TIBA at the lower concentrations appeared insensitive to the treatment (Supplementary Figure S2C).

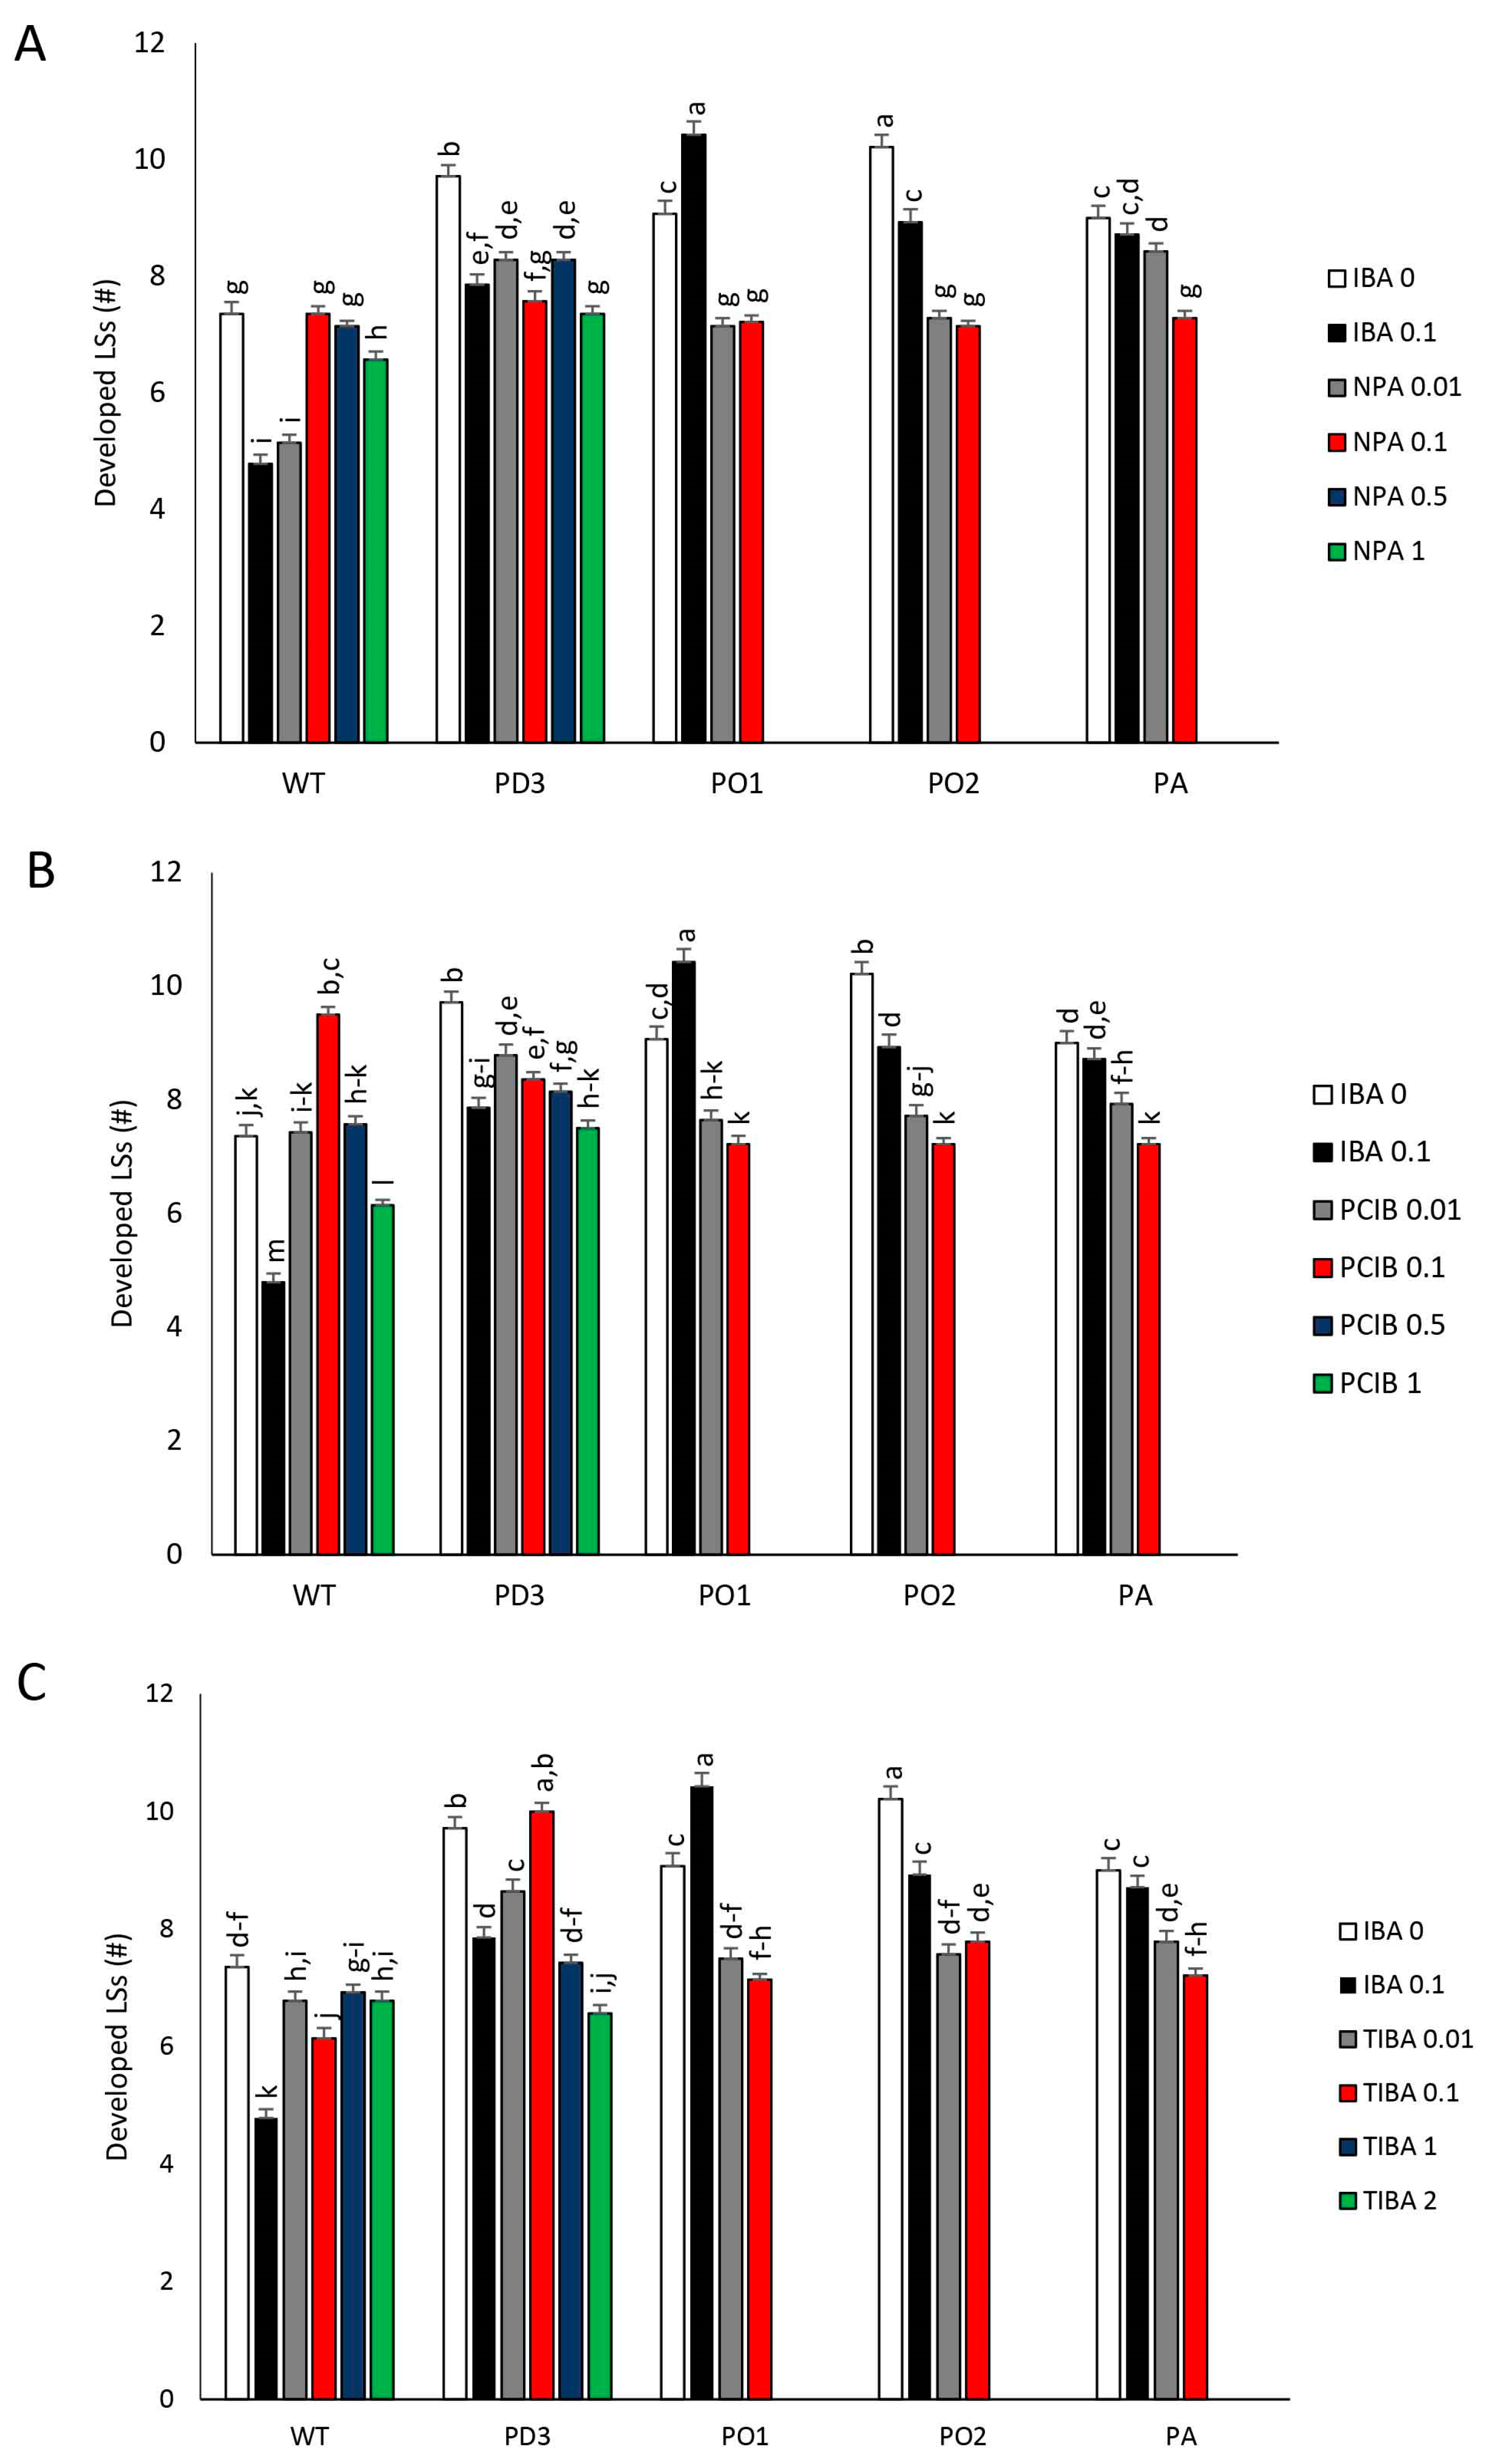
3.2. Development of Nodes (LBs) and Apical Dominance (AD)

In the IBA-free medium, the number of neo-formed nodes increased in Colt-PD3 and decreased in Colt-PO1 and Colt-PA when compared to Colt-wt (Figure 3A–C).
All auxin inhibitors at the two highest levels (1 and 2 mg L−1 for TIBA, and 0.5 and 1 mg L−1 for PCIB and NPA) strongly reduced node development in Colt-wt and Colt-PD3 (Figure 3A–C).
The addition of IBA in the medium reduced the LB formation in the Colt-wt plantlets, and this process was only reversed when PCIB was added to the medium (Figure 3B) at the lowest two concentrations (0.01 and 0.1 mg L−1). When auxin inhibitors were applied at the two highest concentrations, a strong inhibition of LB formation occurred (Figure 3A–C). In the plantlets of all the lines grown in presence of the auxin efflux inhibitor NPA, a reduced formation of nodes was detected compared to those not treated and/or IBA-treated plantlets. All phyA-transgenic lines in IBA0.1 strongly increased the development of LBs on the growing stem compared to Colt-wt. IBA strongly promoted node formation in the Colt-PO1 line in comparison to all other lines (Figure 3A–C). In plantlets of Colt-PA, the neo-formed nodes (LBs) were similar to that of plantlets cultured in IBA0, whereas in Colt-PO2 and Colt-PD3 plantlets, IBA reduced the formation of LBs. When the culture medium was enriched with the two lowest concentrations of TIBA, the development of LBs in Colt-PD3 did not differ from plantlets treated with IBA. Similarly to Colt-wt, the two highest concentrations of TIBA inhibited node formation in Colt-PD3 (Figure 3C). A different behaviour was visible when Colt-PD3 plantlets were treated with NPA and PCIB (Figure 3A,B), since a reduction in LB development was observed even at the lowest concentrations of the inhibitor, albeit only when compared to Colt-wt. In the latter, the two inhibitors resulted in contrasting behaviour.
In plantlets of all lines with the ectopic phyA gene, both in the absence of IBA and in its presence, AD decreased, with a highly significant difference between Colt-wt and the other lines. In addition, a statistically significant difference was observed between the plantlets of Colt-PD3 and those of the other three phyA-transgenic lines (Figure 4A–C). The addition to the media of TIBA and NPA inhibitors and PCIB antagonist limited the auxin action. When Colt-wt plantlets were cultured in the medium enriched with these three molecules, a high increase in outgrowth of LBs into new LSs was detected (Figure 4A–C). At the lower concentrations of these molecules, the value of interposed silent nodes, and consequently the AD, decreased, and at the highest concentration, a premature outgrowth of LBs occurred in Colt-wt and Colt-PD3 (Figure 4A–C). Among the auxin inhibitors, NPA was the most effective. The action of the three auxin inhibitors was very severe in Colt-PO1, Colt-PO2, and Colt-PA plantlets, where already at a concentration of 0.1 mg L−1, the distance from the apex value was zero (Figure 4A–C).

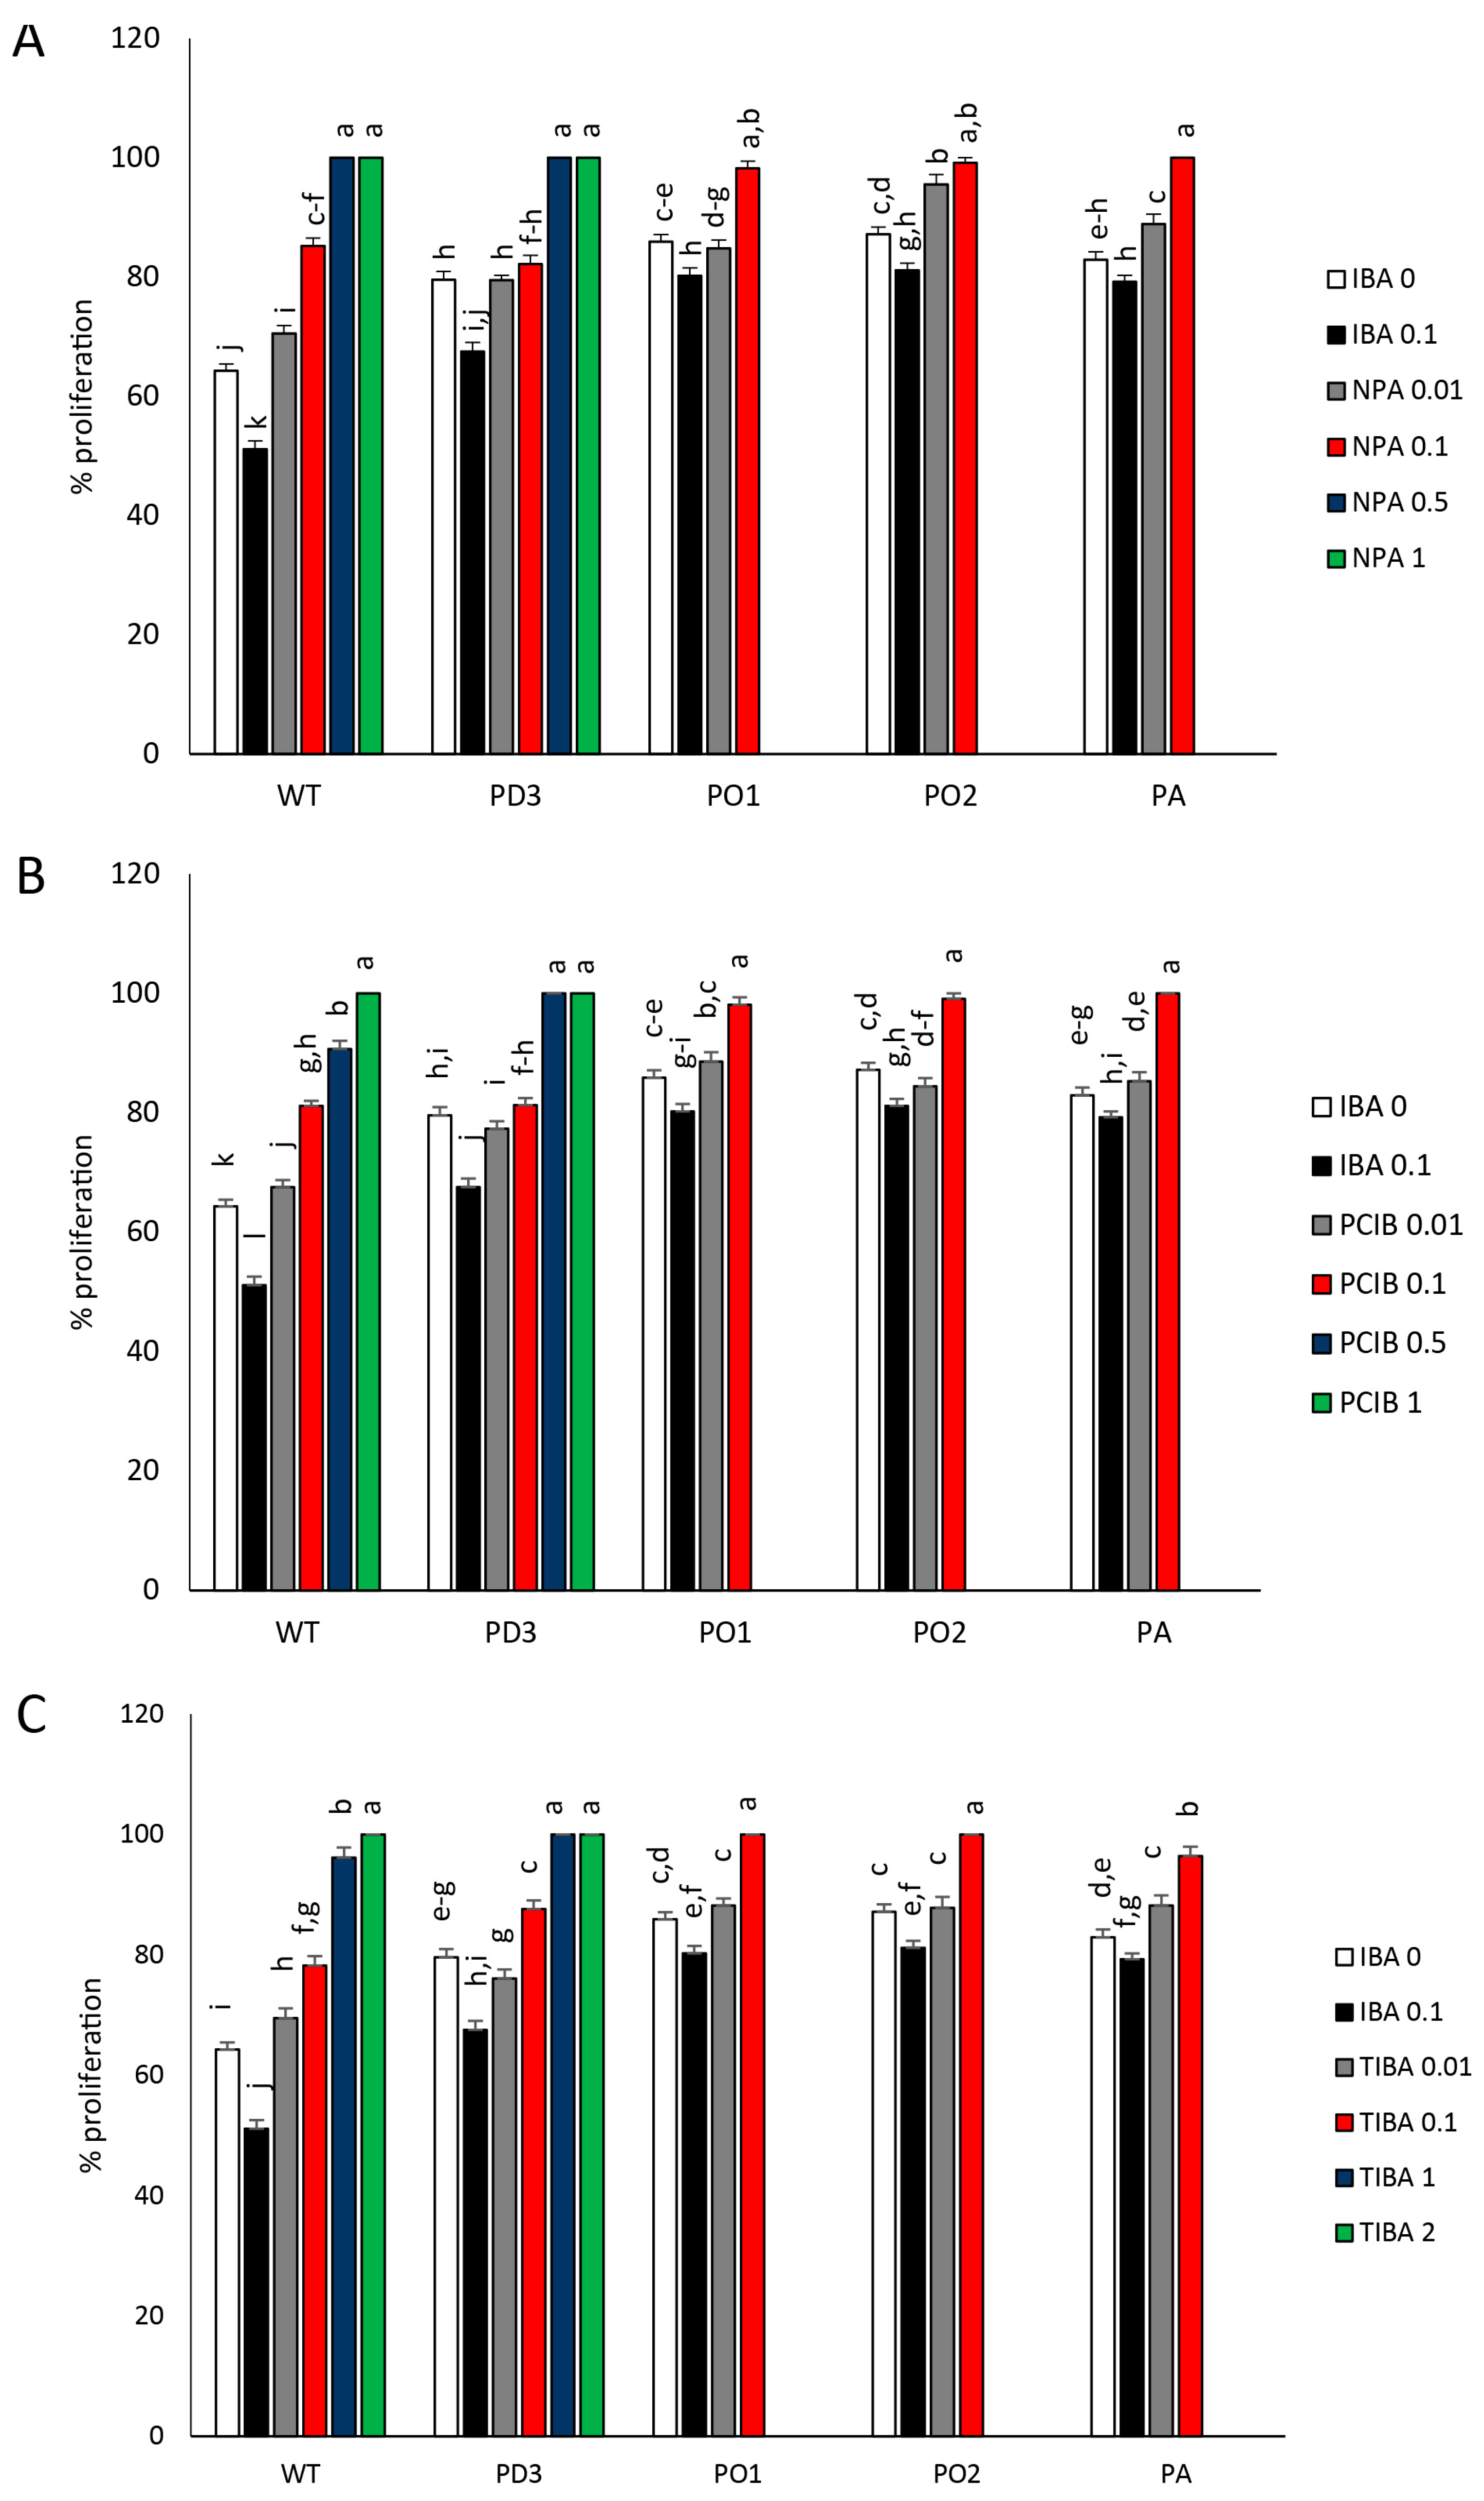
3.3. Shoot Branching (Proliferation Rate) and Dimensions of Developed Lateral Shoots

The total number of new LSs in the plantlets of all phyA-transgenic lines was significantly higher than in the Colt-wt plantlets (Figure 5A–C), both when they grew on media without IBA or with IBA0.1. In fact, in the presence of auxin, the Colt-wt plantlets reduced their LS development by 35%. The reduction was slight in the phyA-transgenic lines plantlets, and even in the case of Colt-PO1, the development of LSs was higher than in Colt-wt, although the greatest reduction was observed among the phyA-transgenic lines (Figure 5A–C). In the Colt-wt plantlets, the inhibition detected in presence of IBA reverted when the three auxin-inhibitory molecules were added into the media, except for the lowest concentration of NPA (Figure 5A–C). Surprisingly, in the plantlets of the phyA-transgenic lines, the response to each individual auxin inhibitor was not similar. Overall, they acted by inhibiting the development of lateral shoots, except for in Colt-PD3, where a slight reversal of IBA-induced inhibition was observed in some treatments with TIBA and PCIB (Figure 5B,C). However, this parameter was not indicative of the action played by auxin inhibitors on AD in interactions with the physiological background of Colt-wt and phyA-transgenic plantlet lines, since in some of the latter lines, the shoot leader growth was either greatly reduced or inhibited.
The results obtained highlight that in plantlets grown in medium IBA0, the development of nodes per cm of elongated shoot leader (node density) was, as follows from greatest to least, Colt-PD3, Colt-wt, Colt-PO2, Colt-PA, and finally Colt-PO1 (Supplementary Figure S3). The IBA added to the media only promoted node density in Colt-PO1 and Colt-PA. The three auxin inhibitors reduced the value of node density in the plantlets of Colt-wt and Colt-PD3, except at the highest level of PCIB. Results detected in the plantlets of Colt-PO1, Colt-PO2, and Colt-PA indicated that the three inhibitors at the lowest concentrations promoted node formation per cm of elongated shoot, particularly in Colt-PO2 and Colt-PA (Supplementary Figure S3).
The degree of branching, which is representative of AD and expressed as a percentage of outgrowing LSs on the total of LBs, of plantlets grown in the IBA0 medium was higher in all phyA-transgenic lines than in Colt-wt (Figure 6A–C). The highest inhibition of the degree of branching occurred when IBA was added to the medium, irrespectively of the lines. The most severe inhibition was observed in Colt-wt and Colt-PD3 plantlets, whereas only a faint decrease was observed in Colt-PO1, Colt-PO2, and Colt-PA plantlets (Figure 6). The branching degree on the stem leader strongly increased and reached the highest value when the auxin inhibitors were added to the media, irrespective of the plantlet lines (Figure 6A–C). The highest value of the branching degree occurred in the Colt-PO1, Colt-PO2, and Colt-PA lines, even at the lower concentrations of auxin inhibitors and antagonist (Figure 6A–C).
The newly formed lateral shoots were evaluated at the end of the culture period and classified into three size categories: the first category included shoots less than 5 mm in length; the second category included shoots with size between 5 and 10 mm; and the third category included shoots longer than 10 mm (Table 1, Table 2 and Table 3). Plantlets of Colt-wt and Colt-PD3 produced more LSs with small size than Colt-PO1, Colt-PO2, and Colt-PA. The addition of IBA into the medium increased the percentage of small shoots (100%), but the different trends observed between the latter three lines and former two remained significant (Table 1, Table 2 and Table 3). The auxin inhibitors NPA and TIBA did not substantially change what was detected in plantlets grown in the presence of IBA, so all new LSs were small (Table 1 and Table 3). This trend in Colt-PD3 plantlets was only observed in those grown in presence of NPA (Table 1) and in TIBA (Table 3); the percentage of small shoots was 100% only in those grown at the two highest concentrations. PCIB reversed the trend and induced the development of intermediate and larger LSs only at the lowest concentrations in the plantlets of Colt-wt and Colt-PD3 (Table 2). In the plantlets of the other three phyA-transgenic lines, PCIB partially promoted the development of side shoots greater than 10 mm at the concentration of 0.01 mg L−1. Conversely, in these plantlets, both NPA and TIBA played an inhibitory role, except for Colt-PO1 with added NPA0.01 and TIBA0.01, and Colt-PD3 with added TIBA0.1 (Table 1 and Table 3).
To understand whether there was a relationship between the increase in plantlet cluster fresh weight, as detected at the end of growth period, and the development of LSs, we calculated the ratio between total fresh weight and number of developed LSs for each line and treatment. A clear divergence appears between Colt-wt and Colt-PD3, from one side, and Colt-PO1, Colt-PO2, and Colt-PA from the other side (Table 4). In fact, in the plantlets of the first two lines, the fresh mass of clusters per developed LS was greater in the presence of 0.1 mg L−1 of IBA than that grown in the IBA0 medium and the auxin-inhibitor-enriched media. In plantlets of the latter three lines, the highest value was observed in those grown on IBA0 medium. In the presence of the inhibitors and the competitor in the media, the values calculated for the Colt-wt and Colt-PD3 plantlets were gradually lower as the concentrations of the products increased. The strong reduction observed in the presence of NPA appeared noteworthy. Overall, the amount of fresh weight per developed shoot was lower in the plantlets of the Colt-PO1, Colt-PO2 and Colt-PA lines in the IBA0 and IBA0.1 media. However, although there was a reduction in value, the presence of the auxin inhibitors affected this parameter less.

3.4. Multi-Response Permutation Procedure (MRPP) and Canonical Discriminant Analyses (CDA)

Data collected for all plantlet parameters in the five Colt lines subjected to the pharmacological treatments were used in the MRPP and CDA analyses.
MRPP results confirmed that there was always a significant difference between the Colt lines, except for Colt-PO2 vs. Colt-PA (Table 5), whereas a significance level of p = 0.0140 was present for Colt-PO1 vs. Colt-PO2 in response to the pharmacological treatments. This indicates the diverse integration of photoreception and adaptive strategies towards the auxin inhibitors. The maximum distance within genotype groups was observed in Colt-PD3 vs. Colt-wt, followed by Colt-PO1 vs. Colt-wt, Colt-PA vs. Colt-wt, Colt-PO2 vs. Colt-wt, Colt-PO1 vs. Colt-PD3, Colt-PO2 vs. Colt-PD3, Colt-PA vs. Colt-PD3, Colt-PO1 vs. Colt-PA, and Colt-PO1 vs. Colt-PO2 (Table 5).
Regarding the main effects of pharmacological treatments, the maximum distance was observed in NPA0.1 vs. IBA0 (p < 0.001), while the minimum distance was observed in PCIB0.5 vs. NPA0.1 (p = 0.046). This information indicates that each treatment affected the parameters of the five Colt lines, generating a specific behaviour, and strongly contributing to the clustering of the lines. In fact, except for the correlation of NPA0.1 with PCIB0.5 and PCIB0.5 with TIBA0.1, all other variables showed correlative values higher than p < 0.01 (Table 6).
The CDA carried out on the data for the entire analysed set of parameters showed a tendency towards diverse distribution among the spaces between the combination treatment and Colt line (Figure 7). The CDA identified two synthetic variables that explain 63.4% of the total variance. PC1 explained 44.8% of the variance and had a positive association with eight of the parameters (Int. Elon., Max. 10 mm, Out Buds, between, Stem Elon., Neo Node, mg × outgrowth, and Apic. Dis.). Variance in the Proliferation Rate (Prol. Rate) was positively associated to PC2, which explains 18.6% of the total variance. Node density, nodes per cm of elongate main stem (Nod cm), and developed lateral shoots smaller than 5 mm (Min. 5 mm) were negatively associated with PC1 and PC2. The CDA scatterplot carried out separately for each genotype split the samples into three main groups. The position of the parameters summarized the phenotypic variability of Colt lines in their responses to treatments, and the LSs, size of LSs, and fresh weight per shoot formation split the lines into three main groups. In the Colt-PO1, Colt-PO2, and Colt-PA lines, the parameters Max. 10 mm and Out Buds were associated with PCIB0.01. Stem Elon. and Neo Node were associated with IBA0.1. Considering the primary axis, the parameters Prol. Rate and Min. 5 mm were associated with NPA0.1, TIBA0.1, and PCIB0.1. In plantlets of the Colt-PD3 and Colt-wt lines, Prol. Rate and Min. 5 mm were associated with TIBA2, TIBA0.01, PCIB1, and NPA0.5, with respect to the primary axis.
All the parameters contributed to separate the five Colt lines from each other, and the combined analyses highlight an exclusive behaviour proper to each line due to their physiological backgrounds and are able to differently discriminate the information intrinsic to each pharmacological treatment.

4. Discussion

Plant architecture is considered an important phenotypic trait in the orchard, and breeders look with extreme interest to improve its plasticity, which in turn can cause qualitative differences in plant shape and their ability to fit into different environments. Shoot branching is the result of shoot elongation, number of lateral buds, and shoots developed. The rate of branching is determined by the spatial–temporal regulation of axillary buds, which are inhibited or released to grow. Also relevant is the regulation of LB initiation and formation, although in an orchard, the impact of this aspect is relatively minor compared with bud release and subsequent growth that leads to branch formation. However, under in vitro culture conditions, short branching is preponderantly similar to branching regulation [38,48], probably due to the altered periodic and oscillator systems upon which a plant’s development depends [45]. Endogenous factors, as well as environmental factors, generate signals that are integrated by plant context, leading the buds to determine the number of outgrowing LSs. A plethora of pathways may converge at the integrator system, and the output signals regulate the branching destiny and the architecture of the plant. Together with the pathways involving signal hormones and signal sugars, the pathway involved in the response to environmental signals should be also considered in the control of branching. In plantlets grown in vitro, branching control has an important economic value because it affects the rate of proliferation [49,50,51,52,53,54,55].
In in vitro conditions, the meristem of an apical plantlet produces endogenous auxin, as suggested by the pharmacological treatments in this study. The addition to the growth media of exogenous IBA plays a pivotal role in the quality of growing plantlets [56,57,58]. In our studies, it reverts the response of most of the parameters analysed in the IBA0 medium. For the stem elongation and internode extension parameters, a different behaviour of Colt-wt from the phyA-transgenic lines is highlighted, suggesting an acquired difference in light sensitivity. The basipetal movement of endogenous auxin from the shoot apex establishes the primary signal that imposes AD by inhibiting auxin export from the axillary buds, which prevents the buds’ outgrowth [20,59,60]. However, it cannot be ruled out that IBA added to the medium, once it moves to the basal end of the plantlet, is converted into IAA, partially or totally. Even though a fraction of IBA is converted into IAA, it is plausible that both forms of auxin move shootward at long distances through the plant [61], increasing the auxin in the stem, which negatively affects its export from the axillary bud [62,63] and strengthens the AD. In Arabidopsis, it has been shown that exogenous IBA is converted into IAA to induce adventitious root formation [64]. Coherently with this hypothesis, IBA added into the media reduced the proliferation rate.
The polar auxin transport stream is mediated by the combined activities of specialized influx (AUX1) and efflux carriers (PINs and ABCBs) that are sensible to the inhibitors NPA and TIBA, and the subsequent polar auxin transport is strongly reduced or completely inhibited. NPA associates directly with PIN effluxes and inhibits their activity in plant membranes [65], whereas, as demonstrated by Dhonukshe and colleagues (2008), TIBA interferes with the dynamics of PIN-containing vesicles and reduces their levels at the plasma membrane [66,67]. However, PCIB does not work as an auxin transport inhibitor, but it mainly affects the auxin-mediated Aux/IAA protein degradation pathway acting on the signalling of the hormone [68]. All of these actions alter various cellular auxin-related processes which are PIN-transport dependent. In our research, their addition into the culture medium is effective even at a small concentration, indicating that the molecules can be absorbed by the basal cut end of plantlets and might move acropetally and diffuse into all plantlet organs, contrasting auxin distribution. Although we do not have biochemical data on the molecules’ distribution inside the plantlets, we have observed a plethora of effects on physiological and development events, such as a strong reduction in AD, increase in proliferation/branching rate, and development of new, longer LSs.
However, the reduction in the growth of the stem leader, indicated as shoot elongation, is attributable to the action of these inhibitors, that overall influenced the development of new nodes. In fact, the total number of new nodes decreased, although the value of the density node parameter increased (Supplementary Figure S3). The use of these auxin inhibitors may become a largely adopted practice in multiplication procedures during micropropagation, as an alternative to the cut end of shoot tip explants, with the aim of obtaining explants derived from branches. The branching of plantlets (rate of proliferation) and their development in shoots is inhibited by the IBA present in the medium. The inhibitory effect was more effective in Colt-wt, but when the medium was supplemented with auxin inhibitors, the inhibition was partially suppressed. Since the outgrowth of LBs is regulated by IAA, the addition of inhibitors in the culture medium resulted in the almost complete outgrowth of the LBs into new shoots from the lowest amounts of inhibitors used. The phyA-transgenic Colt-PO1, Colt-PO2, and Colt-PA lines showed marked inclinations towards branching. They cannot be attributed to the modification of the fresh mass of the cluster, since, as worth noting, in the presence of inhibitors, the plantlets grew less.
The obtained results clearly indicate that the Colt plantlets of the phyA-transgenic lines have different physiological behaviours than the Colt-wt plantlets. The behaviour of Colt-PD3 indicates that structurally, physiological differences occurred compared to those observable in the other three phyA-transgenic lines, and to those in Colt-wt for some development parameters. On the other hand, the Colt-PO2 and Colt-PA lines behave similarly between themselves for all of the behaviour traits analysed by MRPP. All three auxin inhibitors, in our experimental conditions, are thought to counteract the action of endogenous auxin. This is supported by the appearance of the youngest sprouts closer to the shoot apex of the stem leader, as indicated by the values of the distance from the apex, when the inhibitor concentration increases. In comparison to Colt-wt, the untreated phyA-transgenic cherry lines displayed very few nodes interposed between the apex of the stem leader and the first sprout detected down along the stem from the top. These results indicate that the alien chromoprotein PHYA has an inhibitory effect on AD, probably due to a different sensitivity to light. At the molecular level, the interaction between PHYA and AUX/IAAs may be responsible for the failed degradation of AUX/IAAs, that in turn repress transcription of auxin response factors (ARFs) [69], with a reduction in AD. The positive action of the phytochrome on the outgrowth of the lateral sprouts has already been observed in Colt-wt [70], attributing a complex role of the regulation of AD to the phytochrome. In Prunus plantlets [41] and in apple tree plants [48], the amount of active phytochrome is a prodrome for the development of greater branching and an increase in the number of buds grown in new shoots. Indeed, it is known that the PHYA chromoprotein from monocotyledonous species expressed in tissues of dicotyledonous species is not subject to photodegradation during daylight hours, as is the case with native dicotyledonous PHYA. Therefore, during daylight hours, the ectopic chromoprotein is able to support many physiological activities regulated by endogenous PHYB [71,72].
Factors other than hormones are indicated to regulate branching, and among the signal-generating factors should be included sucrose and light [73,74,75]. Studies on roses showed that light has a regulatory effect on sugar resources in the proximity of the node [76], which in turn activate cytokinin synthesis in in vitro-grown nodes [77]. Mason et al. (2014) [8] demonstrated that AD is correlated with sugar availability. The basipetal movement of auxin supports the acropetal movement of sugars to the shoot apex to meet its high demand for energy to ensure active growth by limiting sugar availability to the axillary buds. Under our experimental condition, sucrose availability is not limited due to its presence in the medium. The endogenous auxin can act through the rootward flux, and IBA likely acts through acropetal movement after its uptake from the medium. It is also possible that due to diverse sensitivities to the light, the actions of both type of auxins are modified at the physiological and structural level; this is a fascinating idea still to be explored. In this context, phytochromes play a central role in branching, indeed, through the R:FR ratio regulating the shade-avoidance growth strategy to compete for light [78]. PHYA affects lateral branching in a plant-specific manner: phyA mutants of rice did not show any difference in terms of bud outgrowth capacity [79], whereas phyA pea mutations brought increased branching [80]. In Arabidopsis plants expressing the rice phyA gene, it was demonstrated that the efficacy of the transgene was strictly related to the stage of development of the plant, suggesting a stage-dependent modulation of the downstream signals [81]. In addition to the action of the phytochrome, Finlayson and colleagues (2010) [82] reported the negative effects of the phyB mutation on branching in A. thaliana. PHYB, indeed, by suppressing auxin signalling, promoted bud outgrowth [83]. Recent studies on hybrid aspen showed that both phyB1 and phyB2 negatively regulated the elongation of the leader stem and induced a shade-avoidance syndrome when they were downregulated [84].
Our observations, analysed by CDA, show that a wide range of morphological parameters are under the control of light perception, auxin, and signalling in plantlets. Overall, this study illustrates how the phenotype of the in vitro plantlets of cherry is severely affected by three different auxin inhibitors that have different mechanisms of action and exert effects on four phyA-transformed lines. The role of PHYA in auxin response is widely studied, however, here we show how the transgene of rice enhances the rate of proliferation and negatively affects the AD, conferring to plantlets a bushy shape in the Colt-PO1, Colt-PO2, and Colt-PA lines. The results obtained represent a starting point for future studies to explore at the molecular and genetic level: (i) the role of photoreceptors in regulating AD and PHYA regulation in crop woody plants, and (ii) the role of auxin inhibitors in interaction with light perception by plants.
The pharmacological treatments showed a complex interaction between endogenous auxin and the sensitivity of the lines to light, which interact to regulate the development of the plant. The newly acquired light sensitivity may change the physiological background of the plant, such as pathways of auxin receptors and responses. The interaction shows how a reduction in vigour is associated with a reduction in AD and induces an increase in branching and proliferation of clusters, which play a relevant economic role in nursery farms.

5. Conclusions

The results presented in this paper can represent a step forward in deciphering the role of light signalling by plants in facing auxin’s role in AD and canopy architecture in a woody crop plant and can show how transgenic genotypes can be used as tool for the study of the plant architecture and branching. This knowledge is useful in plant nurseries where micropropagation is used for the multiplication phase of in vitro agamic propagation of woody crops. Moreover, it provides clues to the mechanisms and signalling networks that regulate the branching and architecture model in response to light and the involvement of auxin signals in mediating this response. Predictive phenotypic behaviour in in vitro systems could be a powerful tool to help predict the in vivo behaviour of modified genotypes and understand the plasticity of plant responses to improve architecture and manage production systems. In fact, powerful and complex research infrastructures are needed to analyse woody plant development and to identify subjects that have promising phenotypic behaviour. All phyA-transgenic lines responded similarly to IBA treatment in terms of internode extension and stem elongation. Colt-PD3 and Colt-wt exhibited similar adaptive responses for cluster growth, apical dominance, and shoot branching to pharmacological stimuli, even at the highest concentrations. This contrasts with Colt-PA, Colt-PO1, and Colt-PO2, as evidenced by their lack of growth at the two highest concentrations of auxin inhibitor products. The MRPP analysis and CDA highlight the different development patterns exhibited by the genotypes in response to the pharmacological treatments, except for Colt-PA and Colt-PO2. Based on these plant responses, we might classify them into two groups: the first being shade-avoiding, and the second showing shade tolerance.

Supplementary Materials

The following supporting information can be downloaded at: https://www.mdpi.com/article/10.3390/agronomy13082018/s1, Figure S1: Cluster shape and architecture; Figure S2: Fresh weight; Figure S3: Node density; Figure S4: Stable insertion of PHYA rice gene; Figure S5: Ectopic expression of PHYA rice gene.

Author Contributions

R.M. (Rosario Muleo), C.I., I.F. and B.T. designed the research. I.F. and G.M. performed the DNA extraction and molecular analysis. I.F., R.M. (Roberto Mancinelli) and E.R. performed the statistical analyses. R.R. and G.D. provided Colt wild type plants and drew the basic culture media. C.I. and G.M. performed the in vitro work. C.I., R.M. (Rosario Muleo), I.F. and B.T. drafted the paper. R.M. (Roberto Mancinelli), E.R., R.R., G.D. and B.T. helped to revise the manuscript, with all authors contributing to the discussion of the data. R.M. (Rosario Muleo) provided funds for the research. All authors have read and agreed to the published version of the manuscript.

Funding

This project was partially supported by the internal fund of Tuscia University (U.P.B.: DAFNE.EBRIMUL), and by the framework of the Ministry for Education, University, and Research (MIUR) initiative “Department of Excellence” (Law 232/2016) DAFNE Project 2023-27 “Digital, Intelligent, Green and Sustainable (acronym: D.I.Ver.So)”.

Data Availability Statement

Data are available upon request.

Conflicts of Interest

The authors declare that the research was conducted in the absence of any commercial or financial relationships that could be construed as potential conflicts of interest.

Abbreviations

ADApical dominance
ARF Auxin response factors
Aux/IAA Auxin/Indoleacetic acid
IAA Indole-3-acetic acid
IBAIndole-3-Butyric Acid
LBLateral bud
LSLateral shoot
NPA 1-N-naphthylphthalamic acid
PCIB p-Chlorophenoxyisobutyric acid
PIN PIN-FORMED
PHYAPHYTOCHROME A (protein)
phyAphytochrome A (gene)
TIBA2,3,5,-triiodobenzoic acid

Appendix A

DNA and RNA Extraction and Southern Blotting

Nucleic acids were extracted from 100 mg of leafy shoot tissues collected from 3-week-old putative transgenic and wild-type control Colt lines, previously ground to a fine powder in liquid nitrogen, lysed at 55 °C in the lysis buffer, and used for a phenol–chloroform (2:1) extraction. For DNA isolation, the supernatant obtained was precipitated with ethanol, pelleted, and resuspended in a TE buffer (100 mM Tris-HCl, pH 8; 1 mM EDTA) supplemented with RNaseA (Qiagen, Milan, Italy) as described in Forgione et al. (2019) [85]. Total RNA was treated using Invitrogen™ TURBO DNA-free™ Kit (Thermo Fisher Scientific, Waltham, MA, USA) to remove DNA contamination. DNA and RNA quantifications were conducted using a PERKIN ELMER UV spectrophotometer, according to Sambrook et al. (1989) [86], and the quality was assessed by agarose gel electrophoresis. Total RNA was retro-transcripted by oligo-d(T) and Invitrogen™ Super-Script™ III Reverse Transcriptase (Thermo Fisher Scientific, Waltham, MA, USA) according to the manufacturer’s instructions. cDNA was used as template for RT-PCR by using the following primer sequences for the selective amplification of a 380 bp fragment of the phyA gene of rice: GTGCTCGAGATTATCGAAGATGAGTCGCT and GCATGTCAGAGAGCATTG. For each line, the amplicon obtained of 380 bp was used as a template for blot hybridization. By using the same primer pair, a digoxigenin-labelled probe was synthesized. The transfer of the amplicon to a nylon membrane, the synthesis of the probe with digoxigenin, the hybridization, and detection were carried out according to Glenn and Andreou (2013) [87].

References

  1. Beveridge, C.A.; Rameau, C.; Wijerathna-Yapa, A. Lessons from a Century of Apical Dominance Research. J. Exp. Bot. 2023, erad137. [Google Scholar] [CrossRef]
  2. Cline, M. Concepts and Terminology of Apical Dominance. Am. J. Bot. 1997, 84, 1064. [Google Scholar] [CrossRef] [Green Version]
  3. Petrášek, J.; Friml, J. Auxin Transport Routes in Plant Development. Development 2009, 136, 2675–2688. [Google Scholar] [CrossRef] [Green Version]
  4. Ljung, K.; Hull, A.K.; Celenza, J.; Yamada, M.; Estelle, M.; Normanly, J.; Sandberg, G. Sites and Regulation of Auxin Biosynthesis in Arabidopsis Roots. Plant Cell 2005, 17, 1090–1104. [Google Scholar] [CrossRef]
  5. Ljung, K.; Nemhauser, J.L.; Perata, P. New Mechanistic Links between Sugar and Hormone Signalling Networks. Curr. Opin. Plant Biol. 2015, 25, 130–137. [Google Scholar] [CrossRef]
  6. Di, D.-W.; Zhang, C.; Luo, P.; An, C.-W.; Guo, G.-Q. The Biosynthesis of Auxin: How Many Paths Truly Lead to IAA? Plant Growth Regul 2016, 78, 275–285. [Google Scholar] [CrossRef]
  7. Baluska, F. Polar Transport of Auxin: Carrier-Mediated Flux across the Plasma Membrane or Neurotransmitter-like Secretion? Trends Cell Biol. 2003, 13, 282–285. [Google Scholar] [CrossRef]
  8. Mason, M.G.; Ross, J.J.; Babst, B.A.; Wienclaw, B.N.; Beveridge, C.A. Sugar Demand, Not Auxin, Is the Initial Regulator of Apical Dominance. Proc. Natl. Acad. Sci. USA 2014, 111, 6092–6097. [Google Scholar] [CrossRef]
  9. Peer, W.A.; Murphy, A.S. Flavonoids and Auxin Transport: Modulators or Regulators? Trends Plant Sci. 2007, 12, 556–563. [Google Scholar] [CrossRef]
  10. Teale, W.D.; Paponov, I.A.; Palme, K. Auxin in Action: Signalling, Transport and the Control of Plant Growth and Development. Nat. Rev. Mol. Cell Biol. 2006, 7, 847–859. [Google Scholar] [CrossRef]
  11. Peer, W.A.; Blakeslee, J.J.; Yang, H.; Murphy, A.S. Seven Things We Think We Know about Auxin Transport. Mol. Plant 2011, 4, 487–504. [Google Scholar] [CrossRef]
  12. Blakeslee, J.J.; Peer, W.A.; Murphy, A.S. Auxin Transport. Curr. Opin. Plant Biol. 2005, 8, 494–500. [Google Scholar] [CrossRef] [PubMed]
  13. Verrier, P.J.; Bird, D.; Burla, B.; Dassa, E.; Forestier, C.; Geisler, M.; Klein, M.; Kolukisaoglu, U.; Lee, Y.; Martinoia, E.; et al. Plant ABC Proteins--a Unified Nomenclature and Updated Inventory. Trends Plant Sci. 2008, 13, 151–159. [Google Scholar] [CrossRef] [Green Version]
  14. Barbier, F.F.; Dun, E.A.; Beveridge, C.A. Apical Dominance. Curr. Biol. 2017, 27, R864–R865. [Google Scholar] [CrossRef] [Green Version]
  15. Tiwari, S.B.; Wang, X.-J.; Hagen, G.; Guilfoyle, T.J. AUX/IAA Proteins Are Active Repressors, and Their Stability and Activity Are Modulated by Auxin. Plant Cell 2001, 13, 2809–2822. [Google Scholar] [CrossRef] [Green Version]
  16. Li, S.-B.; Xie, Z.-Z.; Hu, C.-G.; Zhang, J.-Z. A Review of Auxin Response Factors (ARFs) in Plants. Front. Plant Sci. 2016, 7, 47. [Google Scholar] [CrossRef] [Green Version]
  17. Zazimalova, E.; Murphy, A.S.; Yang, H.; Hoyerova, K.; Hosek, P. Auxin Transporters—Why So Many? Cold Spring Harb. Perspect. Biol. 2010, 2, a001552. [Google Scholar] [CrossRef] [Green Version]
  18. Balla, J.; Medveďová, Z.; Kalousek, P.; Matiješčuková, N.; Friml, J.; Reinöhl, V.; Procházka, S. Auxin Flow-Mediated Competition between Axillary Buds to Restore Apical Dominance. Sci. Rep. 2016, 6, 35955. [Google Scholar] [CrossRef] [Green Version]
  19. Leonel, L.V.; De Oliveira Reis, F.; De Assis Figueiredo, F.A.M.M.; Ferraz, T.M.; De Oliveira Maia Júnior, S.; Silva, P.C.; De Andrade, J.R. Light Intensity and Hydrogel Soil Amendment Differentially Affect Growth and Photosynthesis of Successional Tree Species. J. For. Res. 2023, 34, 257–268. [Google Scholar] [CrossRef]
  20. Kazemi, D.; Dehestani-Ardakani, M.; Hatami, M.; Ghorbanpour, M. Research on the Differences in Phenotypic and Photosynthetic Biophysical Parameters of Begonias (Begonia Rex) Cultivars Under Various Light Spectral Compositions. J. Plant Growth Regul. 2023. [Google Scholar] [CrossRef]
  21. Croce, J.; Badano, E.I.; Trigo, C.B.; Martinez-Galvez, F.; Tálamo, A. Experimental Approaches to Select Tree Species for Forest Restoration: Effects of Light, Water Availability and Interspecific Competition in Degraded Areas. J. For. Res. 2022, 33, 1197–1207. [Google Scholar] [CrossRef]
  22. Morini, S.; Muleo, R. Effects of Light Quality on Micropropagation of Woody Species. In Micropropagation of Woody Trees and Fruits; Mohan Jain, S., Ishii, K., Eds.; Kluwer Academic Publisher: Dordrecht, The Netherlands; Boston, MA, USA; London, UK; pp. 3–35.
  23. Cirvilleri, G.; Spina, S.; Iacona, C.; Catara, A.; Muleo, R. Study of Rhizosphere and Phyllosphere Bacterial Community and Resistance to Bacterial Canker in Genetically Engineered Phytochrome A Cherry Plants. J. Plant Physiol. 2008, 165, 1107–1119. [Google Scholar] [CrossRef]
  24. Lau, O.S.; Deng, X.W. Plant Hormone Signaling Lightens up: Integrators of Light and Hormones. Curr. Opin. Plant Biol. 2010, 13, 571–577. [Google Scholar] [CrossRef] [PubMed]
  25. van Gelderen, K.; Kang, C.; Pierik, R. Light Signaling, Root Development, and Plasticity. Plant Physiol. 2018, 176, 1049–1060. [Google Scholar] [CrossRef] [Green Version]
  26. Muleo, R.; Iacona, C.; Nicese, F.; Intrieri, M.; Boscherini, G.; Loreti, F.; Buiatti, B.; Thomas, B. Overexpressing PhyA Changes the Cherry Plant Sensibility to the Proximity of Light Signal. In Proceedings of the XLVII Italian Society of Agricoltural Genetics Annual Congress, Barcelona, Spain, 23 June 2003. [Google Scholar]
  27. Muleo, R.; Iacona, C. Light Perception and Timekeeping Systems in Plants: The Biological Value of the Domain of Time. Riv. Biol. 2007, 100, 16–21. [Google Scholar]
  28. Sgamma, T.; Forgione, I.; Luziatelli, F.; Iacona, C.; Mancinelli, R.; Thomas, B.; Ruzzi, M.; Muleo, R. Monochromic Radiations Provided by Light Emitted Diode (LED) Modulate Infection and Defense Response to Fire Blight in Pear Trees. Plants 2021, 10, 1886. [Google Scholar] [CrossRef] [PubMed]
  29. Franklin, K.A.; Whitelam, G.C. Phytochromes and Shade-Avoidance Responses in Plants. Ann. Bot. 2005, 96, 169–175. [Google Scholar] [CrossRef] [PubMed] [Green Version]
  30. Childs, K.L.; Cordonnier-Pratt, M.-M.; Pratt, L.H.; Morgan, P.W. Genetic Regulation of Development in Sorghum Bicolor: VII. ma(3) Flowering Mutant Lacks a Phytochrome That Predominates in Green Tissue. Plant Physiol. 1992, 99, 765–770. [Google Scholar] [CrossRef] [PubMed] [Green Version]
  31. Childs, K.L.; Miller, F.R.; Cordonnier-Pratt, M.M.; Pratt, L.H.; Morgan, P.W.; Mullet, J.E. The Sorghum Photoperiod Sensitivity Gene, Ma3, Encodes a Phytochrome B. Plant Physiol. 1997, 113, 611–619. [Google Scholar] [CrossRef] [Green Version]
  32. Reed, J.W.; Nagpal, P.; Poole, D.S.; Furuya, M.; Chory, J. Mutations in the Gene for the Red/Far-Red Light Receptor Phytochrome B Alter Cell Elongation and Physiological Responses throughout Arabidopsis Development. Plant Cell 1993, 5, 147–157. [Google Scholar] [CrossRef] [Green Version]
  33. Yanovsky, M.J.; Casal, J.J.; Whitelam, G.C. Phytochrome A, Phytochrome B and HY4 Are Involved in Hypocotyl Growth Responses to Natural Radiation in Arabidopsis: Weak de-Etiolation of the PhyA Mutant under Dense Canopies. Plant Cell Environ. 1995, 18, 788–794. [Google Scholar] [CrossRef]
  34. Smith, H.; Xu, Y.; Quail, P.H. Antagonistic but Complementary Actions of Phytochromes A and B Allow Optimum Seedling De-Etiolation. Plant Physiol. 1997, 114, 637–641. [Google Scholar] [CrossRef] [PubMed] [Green Version]
  35. Lin, C. Plant Blue-Light Receptors. Trends Plant Sci. 2000, 5, 337–342. [Google Scholar] [CrossRef]
  36. Ballaré, C.L. Keeping up with the Neighbours: Phytochrome Sensing and Other Signalling Mechanisms. Trends Plant Sci. 1999, 4, 97–102. [Google Scholar] [CrossRef]
  37. Gilbert, I.R.; Jarvis, P.G.; Smith, H. Proximity Signal and Shade Avoidance Differences between Early and Late Successional Trees. Nature 2001, 411, 792–795. [Google Scholar] [CrossRef] [PubMed] [Green Version]
  38. Muleo, R.; Thomas, B. Effects of Light Quality on Shoot Proliferation of Prunus Cerasifera In Vitro Are the Result of Differential Effects on Bud Induction and Apical Dominance. J. Hortic. Sci. 1997, 72, 483–499. [Google Scholar] [CrossRef]
  39. Stirk, W.A.; Bálint, P.; Tarkowská, D.; Novák, O.; Maróti, G.; Ljung, K.; Turečková, V.; Strnad, M.; Ördög, V.; van Staden, J. Effect of Light on Growth and Endogenous Hormones in Chlorella Minutissima (Trebouxiophyceae). Plant Physiol. Biochem. 2014, 79, 66–76. [Google Scholar] [CrossRef]
  40. Roman, H.; Girault, T.; Barbier, F.; Péron, T.; Brouard, N.; Pěnčík, A.; Novák, O.; Vian, A.; Sakr, S.; Lothier, J.; et al. Cytokinins Are Initial Targets of Light in the Control of Bud Outgrowth. Plant Physiol. 2016, 172, 489–509. [Google Scholar] [CrossRef] [Green Version]
  41. Muleo, R.; Morini, S.; Casano, S. Photoregulation of Growth and Branching of Plum Shoots: Physiological Action of Two Photosystems. In Vitro Cell. Dev. Biol.-Plant 2001, 37, 609–617. [Google Scholar] [CrossRef]
  42. Muleo, R.; Morini, S. Light Quality Regulates Shoot Cluster Growth and Development of MM106 Apple Genotype in In Vitro Culture. Sci. Hortic. 2006, 108, 364–370. [Google Scholar] [CrossRef]
  43. Blythe, E.K.; Sibley, J.L.; Tilt, K.M.; Ruter, J.M. Methods of Auxin Application in Cutting Propagation: A Review of 70 Years of Scientific Discovery and Commercial Practice. J. Environ. Hortic. 2007, 25, 166–185. [Google Scholar] [CrossRef]
  44. Strader, L.C.; Bartel, B. Transport and Metabolism of the Endogenous Auxin Precursor Indole-3-Butyric Acid. Mol. Plant 2011, 4, 477–486. [Google Scholar] [CrossRef] [Green Version]
  45. Cavallaro, V.; Pellegrino, A.; Muleo, R.; Forgione, I. Light and Plant Growth Regulators on In Vitro Proliferation. Plants 2022, 11, 844. [Google Scholar] [CrossRef]
  46. Driver, J.A.; Kuniyuki, A. In Vitro Propagation of Paradox Walnut Root Stock. HortScience 1984, 19, 507–509. [Google Scholar] [CrossRef]
  47. Onofri, A. DSAASTAT a New Excel VBA Macro to Perform Basic Statistical Analyses of Field Trials; Department of Agriculture and Environmental Sciences, University of Perugia: Perugia, Italy, 2010. [Google Scholar]
  48. Muleo, R.; Morini, S. Physiological Dissection of Blue and Red Light Regulation of Apical Dominance and Branching in M9 Apple Rootstock Growing In Vitro. J. Plant Physiol. 2008, 165, 1838–1846. [Google Scholar] [CrossRef] [PubMed]
  49. Marcelis-van Acker, C.A.M.; Scholten, H.J. Development of Axillary Buds of Rose In Vitro. Sci. Hortic. 1995, 63, 47–55. [Google Scholar] [CrossRef]
  50. Dobránszki, J.; Teixeira da Silva, J.A. Micropropagation of Apple—A Review. Biotechnol. Adv. 2010, 28, 462–488. [Google Scholar] [CrossRef] [PubMed]
  51. Pati, P.K.; Rath, S.P.; Sharma, M.; Sood, A.; Ahuja, P.S. In Vitro Propagation of Rose—A Review. Biotechnol. Adv. 2006, 24, 94–114. [Google Scholar] [CrossRef]
  52. Kumar, N.; Reddy, M. In Vitro Plant Propagation: A Review. J. Forest Environ. Sci. 2011, 27, 61–72. [Google Scholar]
  53. Nacheva, L.; Dimitrova, N.; Koleva-Valkova, L.; Stefanova, M.; Ganeva, T.; Nesheva, M.; Tarakanov, I.; Vassilev, A. In Vitro Multiplication and Rooting of Plum Rootstock ‘Saint Julien’ (Prunus domestica Subsp. Insititia) under Fluorescent Light and Different LED Spectra. Plants 2023, 12, 2125. [Google Scholar] [CrossRef]
  54. Cavallaro, V.; Avola, G.; Fascella, G.; Pellegrino, A.; Ierna, A. Effects of Spectral Quality and Light Quantity of LEDs on In Vitro Shoot Development and Proliferation of Ananas comosus L. Merr. Agronomy 2023, 13, 1072. [Google Scholar] [CrossRef]
  55. Abdouli, D.; Soufi, S.; Bettaieb, T.; Werbrouck, S.P.O. Effects of Monochromatic Light on Growth and Quality of Pistacia vera L. Plants 2023, 12, 1546. [Google Scholar] [CrossRef] [PubMed]
  56. Aygun, A.; Dumanoglu, H. In Vitro Shoot Proliferation and In Vitro and Ex Vitro Root Formation of Pyrus elaeagrifolia Pallas. Front. Plant Sci. 2015, 6, 225. [Google Scholar] [CrossRef]
  57. Sadeghi, F.; Yadollahi, A.; Kermani, M.J.; Eftekhari, M. Optimizing Culture Media for In Vitro Proliferation and Rooting of Tetra (Prunus empyrean 3) Rootstock. J. Genet. Eng. Biotechnol. 2015, 13, 19–23. [Google Scholar] [CrossRef] [PubMed] [Green Version]
  58. Geng, F.; Moran, R.; Day, M.; Halteman, W.; Zhang, D. In Vitro Shoot Proliferation of Apple Rootstocks ‘B.9′, ‘G.30′, and ‘G.41′ Grown under Red and Blue Light. Horts 2015, 50, 430–433. [Google Scholar] [CrossRef]
  59. Müller, D.; Leyser, O. Auxin, Cytokinin and the Control of Shoot Branching. Ann. Bot. 2011, 107, 1203–1212. [Google Scholar] [CrossRef] [Green Version]
  60. Balla, J.; Kalousek, P.; Reinöhl, V.; Friml, J.; Procházka, S. Competitive Canalization of PIN-Dependent Auxin Flow from Axillary Buds Controls Pea Bud Outgrowth: Competitive Canalization of Auxin Flow. Plant J. 2011, 65, 571–577. [Google Scholar] [CrossRef]
  61. Frick, E.M.; Strader, L.C. Roles for IBA-Derived Auxin in Plant Development. J. Exp. Bot. 2018, 69, 169–177. [Google Scholar] [CrossRef] [Green Version]
  62. Tan, M.; Li, G.; Chen, X.; Xing, L.; Ma, J.; Zhang, D.; Ge, H.; Han, M.; Sha, G.; An, N. Role of Cytokinin, Strigolactone, and Auxin Export on Outgrowth of Axillary Buds in Apple. Front. Plant Sci. 2019, 10, 616. [Google Scholar] [CrossRef] [Green Version]
  63. Luo, Z.; Janssen, B.J.; Snowden, K.C. The Molecular and Genetic Regulation of Shoot Branching. Plant Physiol. 2021, 187, 1033–1044. [Google Scholar] [CrossRef]
  64. Fattorini, L.; Veloccia, A.; Della Rovere, F.; D’Angeli, S.; Falasca, G.; Altamura, M.M. Indole-3-Butyric Acid Promotes Adventitious Rooting in Arabidopsis Thaliana Thin Cell Layers by Conversion into Indole-3-Acetic Acid and Stimulation of Anthranilate Synthase Activity. BMC Plant Biol. 2017, 17, 121. [Google Scholar] [CrossRef] [PubMed] [Green Version]
  65. Abas, L.; Kolb, M.; Stadlmann, J.; Janacek, D.P.; Lukic, K.; Schwechheimer, C.; Sazanov, L.A.; Mach, L.; Friml, J.; Hammes, U.Z. Naphthylphthalamic Acid Associates with and Inhibits PIN Auxin Transporters. Proc. Natl. Acad. Sci. USA 2021, 118, e2020857118. [Google Scholar] [CrossRef] [PubMed]
  66. Dhonukshe, P.; Grigoriev, I.; Fischer, R.; Tominaga, M.; Robinson, D.G.; Hašek, J.; Paciorek, T.; Petrášek, J.; Seifertová, D.; Tejos, R.; et al. Auxin Transport Inhibitors Impair Vesicle Motility and Actin Cytoskeleton Dynamics in Diverse Eukaryotes. Proc. Natl. Acad. Sci. USA 2008, 105, 4489–4494. [Google Scholar] [CrossRef]
  67. Zou, M.; Ren, H.; Li, J. An Auxin Transport Inhibitor Targets Villin-Mediated Actin Dynamics to Regulate Polar Auxin Transport. Plant Physiol. 2019, 181, 161–178. [Google Scholar] [CrossRef] [PubMed] [Green Version]
  68. Oono, Y.; Ooura, C.; Rahman, A.; Aspuria, E.T.; Hayashi, K.; Tanaka, A.; Uchimiya, H. P-Chlorophenoxyisobutyric Acid Impairs Auxin Response in Arabidopsis Root. Plant Physiol. 2003, 133, 1135–1147. [Google Scholar] [CrossRef] [Green Version]
  69. Yang, C.; Xie, F.; Jiang, Y.; Li, Z.; Huang, X.; Li, L. Phytochrome A Negatively Regulates the Shade Avoidance Response by Increasing Auxin/Indole Acidic Acid Protein Stability. Dev. Cell 2018, 44, 29–41.e4. [Google Scholar] [CrossRef] [Green Version]
  70. Iacona, C.; Muleo, R. L’azione Della Qualità Della Luce Nei Diversi Stadi Della Propagazione In Vitro e Post Vitro Del Portinnesto Colt. Italus Hortus 2012, 19, 37–49. [Google Scholar]
  71. Kay, S.A.; Nagatani, A.; Keith, B.; Deak, M.; Furuya, M.; Chua, N.H. Rice Phytochrome Is Biologically Active in Transgenic Tobacco. Plant Cell 1989, 1, 775–782. [Google Scholar] [CrossRef] [Green Version]
  72. McCormac, A.C.; Cherry, J.R.; Hershey, H.P.; Vierstra, R.D.; Smith, H. Photoresponses of Transgenic Tobacco Plants Expressing an Oat Phytochrome Gene. Planta 1991, 185, 162–170. [Google Scholar] [CrossRef]
  73. González-Grandío, E.; Poza-Carrión, C.; Sorzano, C.O.S.; Cubas, P. BRANCHED1 Promotes Axillary Bud Dormancy in Response to Shade in Arabidopsis. Plant Cell 2013, 25, 834–850. [Google Scholar] [CrossRef] [Green Version]
  74. Rameau, C.; Bertheloot, J.; Leduc, N.; Andrieu, B.; Foucher, F.; Sakr, S. Multiple Pathways Regulate Shoot Branching. Front. Plant Sci. 2015, 5, 741. [Google Scholar] [CrossRef] [PubMed] [Green Version]
  75. Barbier, F.F.; Dun, E.A.; Kerr, S.C.; Chabikwa, T.G.; Beveridge, C.A. An Update on the Signals Controlling Shoot Branching. Trends Plant Sci. 2019, 24, 220–236. [Google Scholar] [CrossRef]
  76. Girault, T.; Abidi, F.; Sigogne, M.; Pelleschi-Travier, S.; Boumaza, R.; Sakr, S.; Leduc, N. Sugars Are under Light Control during Bud Burst in Rosa Sp.: Photocontrol of Sugars during Bud Burst. Plant Cell Environ. 2010, 33, 1339–1350. [Google Scholar] [CrossRef]
  77. Barbier, F.; Péron, T.; Lecerf, M.; Perez-Garcia, M.-D.; Barrière, Q.; Rolčík, J.; Boutet-Mercey, S.; Citerne, S.; Lemoine, R.; Porcheron, B.; et al. Sucrose Is an Early Modulator of the Key Hormonal Mechanisms Controlling Bud Outgrowth in Rosa Hybrida. J. Exp. Bot. 2015, 66, 2569–2582. [Google Scholar] [CrossRef] [PubMed] [Green Version]
  78. Franklin, K.A. Shade Avoidance. New Phytol. 2008, 179, 930–944. [Google Scholar] [CrossRef] [PubMed]
  79. Takano, M.; Kanegae, H.; Shinomura, T.; Miyao, A.; Hirochika, H.; Furuya, M. Isolation and Characterization of Rice Phytochrome A Mutants. Plant Cell 2001, 13, 521–534. [Google Scholar] [CrossRef] [Green Version]
  80. Weller, J.L.; Murfet, I.C.; Reid, J.B. Pea Mutants with Reduced Sensitivity to Far-Red Light Define an Important Role for Phytochrome A in Day-Length Detection. Plant Physiol. 1997, 114, 1225–1236. [Google Scholar] [CrossRef] [Green Version]
  81. Kneissl, J.; Shinomura, T.; Furuya, M.; Bolle, C. A Rice Phytochrome A in Arabidopsis: The Role of the N-Terminus under Red and Far-Red Light. Mol. Plant 2008, 1, 84–102. [Google Scholar] [CrossRef]
  82. Finlayson, S.A.; Krishnareddy, S.R.; Kebrom, T.H.; Casal, J.J. Phytochrome Regulation of Branching in Arabidopsis. Plant Physiol. 2010, 152, 1914–1927. [Google Scholar] [CrossRef] [Green Version]
  83. Krishna Reddy, S.; Finlayson, S.A. Phytochrome B Promotes Branching in Arabidopsis by Suppressing Auxin Signaling. Plant Physiol. 2014, 164, 1542–1550. [Google Scholar] [CrossRef] [Green Version]
  84. Ding, J.; Zhang, B.; Li, Y.; André, D.; Nilsson, O. Phytochrome B and PHYTOCHROME INTERACTING FACTOR8 Modulate Seasonal Growth in Trees. New Phytol. 2021, 232, 2339–2352. [Google Scholar] [CrossRef] [PubMed]
  85. Forgione, I.; Wołoszyńska, M.; Pacenza, M.; Chiappetta, A.; Greco, M.; Araniti, F.; Abenavoli, M.R.; Van Lijsebettens, M.; Bitonti, M.B.; Bruno, L. Hypomethylated Drm1 Drm2 Cmt3 Mutant Phenotype of Arabidopsis Thaliana Is Related to Auxin Pathway Impairment. Plant Sci. 2019, 280, 383–396. [Google Scholar] [CrossRef] [PubMed]
  86. Sambrook, J.; Fritsch, E.; Maniatis, T. Molecular Cloning: A Laboratory Manual, 2nd ed.; CSHL Press: Cold Spring Harbor, NY, USA, 1989; Volume 2, ISBN 978-0-87969-309-1. [Google Scholar]
  87. Glenn, G.; Andreou, L.-V. Analysis of DNA by Southern Blotting. Methods Enzymol. 2013, 529, 47–63. [Google Scholar] [CrossRef] [PubMed]
Figure 1. Stem leader elongation (mm) of plantlets of Colt-wt and phyA-transgenic lines Colt-PD3, Colt-PO1, Colt-PO2, and Colt-PA treated with IBA 0.1 mg L−1 (0.5 µM), (A) NPA 0.01, 0.1, 0.5, and 1 mg L−1 (0.034, 0.34, 1.7, and 3.4 µM), (B) PCIB 0.01, 0.1, 0.5, and 1 mg L−1 (0.046, 0.46, 2.3, and 4.6 µM), and (C) TIBA 0.01, 0.1, 1, and 2 mg L−1 (0.02, 0.2, 2, and 4 µM). Data indicate the mean values ± standard error. Plants grown without IBA were used as a control. Different letters indicate significant differences among treatments and genotypes at p < 0.05, according to Tukey’s test.
Agronomy 13 02018 g001
Figure 2. Internode elongation (mm) of plantlets of Colt-wt and phyA-transgenic lines Colt-PD3, Colt-PO1, Colt-PO2, and Colt-PA treated with IBA 0.1 mg L−1 (0.5 µM), (A) NPA 0.01, 0.1, 0.5, and 1 mg L−1 (0.034, 0.34, 1.7, and 3.4 µM), (B) PCIB 0.01, 0.1, 0.5, and 1 mg L−1 (0.046, 0.46, 2.3, and 4.6 µM), and (C) TIBA 0.01, 0.1, 1, and 2 mg L−1 (0.02, 0.2, 2, and 4 µM). Data indicate the mean values ± standard error. Plants grown without IBA were used as a control. Different letters indicate significant differences among treatments and genotypes at p < 0.05, according to Tukey’s test.
Agronomy 13 02018 g002
Figure 3. Neo-formed nodes (LBs) developed in the stem leader of plantlets of Colt-wt and phyA-transgenic lines Colt-PD3, Colt-PO1, Colt-PO2, and Colt-PA treated with IBA 0.1 mg L−1 (0.5 µM), (A) NPA 0.01, 0.1, 0.5, and 1 mg L−1 (0.034, 0.34, 1.7, and 3.4 µM), (B) PCIB 0.01, 0.1, 0.5, and 1 mg L−1 (0.046, 0.46, 2.3, and 4.6 µM), and (C) TIBA 0.01, 0.1, 1, and 2 mg L−1 (0.02, 0.2, 2, and 4 µM). Data indicate the mean values ± standard error. Plants grown without IBA were used as a control. Different letters indicate significant differences among treatments and genotypes at p < 0.05, according to Tukey’s test.
Agronomy 13 02018 g003
Figure 4. Number of silent nodes interposed from the apex leader shoot to the youngest lateral shoot of Colt-wt and phyA-transgenic lines Colt-PD3, Colt-PO1, Colt-PO2, and Colt-PA treated with IBA 0.1 mg L−1 (0.5 µM), (A) NPA 0.01, 0.1, 0.5, and 1 mg L−1 (0.034, 0.34, 1.7, and 3.4 µM), (B) PCIB 0.01, 0.1, 0.5, and 1 mg L−1 (0.046, 0.46, 2.3, and 4.6 µM), and (C) TIBA 0.01, 0.1, 1, and 2 mg L−1 (0.02, 0.2, 2, and 4 µM). Values indicate the mean values ± standard error. Plants grown without IBA were used as a control. Different letters indicate significant differences among treatments and genotypes at p < 0.05, according to Tukey’s test.
Agronomy 13 02018 g004
Figure 5. Total number of new LSs developed from the stem leader of Colt-wt and phyA-transgenic lines Colt-PD3, Colt-PO1, Colt-PO2, and Colt-PA treated with IBA 0.1 mg L−1 (0.5 µM), (A) NPA 0.01, 0.1, 0.5, and 1 mg L−1 (0.034, 0.34, 1.7, and 3.4 µM), (B) PCIB 0.01, 0.1, 0.5, and 1 mg L−1 (0.046, 0.46, 2.3, and 4.6 µM), and (C) TIBA 0.01, 0.1, 1, and 2 mg L−1 (0.02, 0.2, 2, and 4 µM). Data indicate the mean values ± standard error. Plants grown without IBA were used as a control. Different letters indicate significant differences among treatments and genotypes at p < 0.05, according to Tukey’s test.
Agronomy 13 02018 g005
Figure 6. Degree of branching or proliferation rate expressed as the percentage of LSs developed from the total lateral buds on the stem leader of Colt-wt and phyA-transgenic lines Colt-PD3, Colt-PO1, Colt-PO2, and Colt-PA treated with IBA 0.1 mg L−1 (0.5 µM), (A) NPA 0.01, 0.1, 0.5, and 1 mg L−1 (0.034, 0.34, 1.7, and 3.4 µM), (B) PCIB 0.01, 0.1, 0.5, and 1 mg L−1 (0.046, 0.46, 2.3, and 4.6 µM), and (C) TIBA 0.01, 0.1, 1, and 2 mg L−1 (0.02, 0.2, 2, and 4 µM). Data indicate the mean values ± standard error. Plants grown without IBA were used as a control. Different letters indicate significant differences among treatments and genotypes at p < 0.05, according to Tukey’s test.
Agronomy 13 02018 g006
Figure 7. Canonical discriminant analyses (CDA) of the different Colt cherry rootstock lines subjected to different inhibitor treatments. (A) Colt-PO1, (B) Colt-PO2, (C) Colt-PA, (D) Colt-PD3, and (E) Colt-wt. Abbreviation definitions: Prol. Rate = proliferation rate; Int. Elon. = internode elongation; Max. 10 mm = developed lateral shoots longer than 10 mm; Out Buds = number of newformed buds’ outgrowth; between = developed lateral shoots between 5 and 10 mm; Neo Node = New nodes developed in the main stem; mg x outgrowth = mg of fresh weight of cluster per new lateral developed shoot; Apic. Dis. = number of silent nodes interspersed between first lateral outgrowth shoot and apical bud; Nod cm = number of nodes developed per cm of elongated stem; Min. 5 mm = developed lateral shoots shorter than 5 mm.
Agronomy 13 02018 g007
Table 1. Newly formed lateral shoots detected at the end of the culture period and classified in three dimensional categories (<5 mm, 5~10 mm, and >10 mm) of Colt-wt and phyA-transgenic lines Colt-PD3, Colt-PO1, Colt-PO2, and Colt-PA treated with IBA 0.1 mg L−1 (0.5 µM) and NPA 0.01, 0.1, 0.5, and 1 mg L−1 (0.034, 0.34, 1.7, and 3.4 µM). Plants grown without IBA were used as a control. Data indicate the mean values [%] ± standard error.
Size Classification of Lateral Shoots
<5 mm5~10 mm>10 mm
Mean [%] ± SDMean [%] ± SDMean [%] ± SD
WT IBA 074 ± 16.226 ± 16.20 ± 0
WT IBA 0.1100 ± 00 ± 00 ± 0
WT NPA 0.01100 ± 00 ± 00 ± 0
WT NPA 0.1100 ± 00 ± 00 ± 0
WT NPA 0.5100 ± 00 ± 00 ± 0
WT NPA 1100 ± 00 ± 00 ± 0
PD3 IBA 062 ± 10.338 ± 10.30 ± 0
PD3 IBA 0.168.3 ± 12.731.7 ± 12.70 ± 0
PD3 NPA 0.01100 ± 00 ± 00 ± 0
PD3 NPA 0.1100 ± 00 ± 00 ± 0
PD3 NPA 0.5100 ± 00 ± 00 ± 0
PD3 NPA 1100 ± 00 ± 00 ± 0
PO1 IBA 010 ± 7.789.3 ± 90 ± 0
PO1 IBA 0.119.4 ± 14.963.6 ± 13.216.3 ± 12.3
PO1 NPA 0.0155 ± 7.536.2 ± 14.48.8 ± 8.4
PO1 NPA 0.193.2 ± 10.36.8 ± 10.30 ± 0
PO1 NPA 0.5n.d.n.d.n.d.
PO1 NPA 1n.d.n.d.n.d.
PO2 IBA 00 ± 011.2 ± 9.990.2 ± 10
PO2 IBA 0.151.8 ± 14.945.1 ± 17.23.1 ± 5.1
PO2 NPA 0.0164.7 ± 14.335.3 ± 14.30 ± 0
PO2 NPA 0.191.1 ± 10.28.9 ± 10.20 ± 0
PO2 NPA 0.5n.d.n.d.n.d.
PO2 NPA 1n.d.n.d.n.d.
PA IBA 00 ± 013.4 ± 7.986.6 ± 7.9
PA IBA 0.122.2 ± 1056.8 ± 13.721 ± 10
PA NPA 0.0181.4 ± 11.118.6 ± 11.10 ± 0
PA NPA 0.193.4 ± 8.56.6 ± 8.50 ± 0
PA NPA 0.5n.d.n.d.n.d.
PA NPA 1n.d.n.d.n.d.
Table 2. Newly formed lateral shoots detected at the end of the culture period and classified in three dimensional categories (<5 mm, 5~10 mm, and >10 mm) of Colt-wt and phyA-transgenic lines Colt-PD3, Colt-PO1, Colt-PO2, and Colt-PA treated with IBA 0.1 mg L−1 (0.5 µM) and PCIB 0.01, 0.1, 0.5, and 1 mg L−1 (0.046, 0.46, 2.3, and 4.6 µM). Plants grown without IBA were used as a control. Data indicate the mean values [%] ± standard error.
Size Classification of Lateral Shoots
<5 mm5~10 mm>10 mm
Mean [%] ± SDMean [%] ± SDMean [%] ± SD
WT IBA 074 ± 16.226 ± 16.20 ± 0
WT IBA 0.1100 ± 00 ± 00 ± 0
WT PCIB 0.0160 ± 12.829.5 ± 13.210.6 ± 7.6
WT PCIB 0.137.9 ± 17.444.4 ± 13.717.7 ± 10.5
WT PCIB 0.5100 ± 00 ± 00 ± 0
WT PCIB 1100 ± 00 ± 00 ± 0
PD3 IBA 062 ± 10.338 ± 10.30 ± 0
PD3 IBA 0.168.3 ± 12.731.7 ± 12.70 ± 0
PD3 PCIB 0.0142.2 ± 13.340.2 ± 11.717.7 ± 8.5
PD3 PCIB 0.166.8 ± 14.133.2 ± 14.10 ± 0
PD3 PCIB 0.591.6 ± 9.48.4 ± 9.40 ± 0
PD3 PCIB 1100 ± 00 ± 00 ± 0
PO1 IBA 010 ± 7.789.3 ± 90 ± 0
PO1 IBA 0.119.4 ± 14.963.6 ± 13.216.3 ± 12.3
PO1 PCIB 0.0126.5 ± 1248.9 ± 1124.7 ± 17.7
PO1 PCIB 0.173.6 ± 15.526.4 ± 15.50 ± 0
PO1 PCIB 0.5n.d.n.d.n.d.
PO1 PCIB 1n.d.n.d.n.d.
PO2 IBA 00 ± 011.2 ± 9.990.2 ± 10
PO2 IBA 0.151.8 ± 14.945.1 ± 17.23.1 ± 5.1
PO2 PCIB 0.0127.1 ± 13.259 ± 14.213.9 ± 10.9
PO2 PCIB 0.170.3 ± 10.829.7 ± 10.80 ± 0
PO2 PCIB 0.5n.d.n.d.n.d.
PO2 PCIB 1n.d.n.d.n.d.
PA IBA 00 ± 013.4 ± 7.986.6 ± 7.9
PA IBA 0.122.2 ± 1056.8 ± 13.721 ± 10
PA PCIB 0.0123.3 ± 12.953.6 ± 1123.2 ± 16.6
PA PCIB 0.168.8 ± 13.431.3 ± 13.40 ± 0
PA PCIB 0.5n.d.n.d.n.d.
PA PCIB 1n.d.n.d.n.d.
Table 3. Newly formed lateral shoots detected at the end of the culture period and classified in three dimensional categories (<5 mm, 5~10 mm, and >10 mm) of Colt-wt and phyA-transgenic lines Colt-PD3, Colt-PO1, Colt-PO2, and Colt-PA treated with IBA 0.1 mg L−1 (0.5 µM) and TIBA 0.01, 0.1, 1, and 2 mg L−1 (0.02, 0.2, 2, and 4 µM). Plants grown without IBA were used as a control. Data indicate the mean values [%] ± standard error.
Size Classification of Lateral Shoots
<5 mm5~10 mm>10 mm
Mean [%] ± SDMean [%] ± SDMean [%] ± SD
WT IBA 074 ± 16.226 ± 16.20 ± 0
WT IBA 0.1100 ± 00 ± 00 ± 0
WT TIBA 0.0191.9 ± 8.88.1 ± 8.80 ± 0
WT TIBA 0.1100 ± 00 ± 00 ± 0
WT TIBA 1100 ± 00 ± 00 ± 0
WT TIBA 2100 ± 00 ± 00 ± 0
PD3 IBA 062 ± 10.338 ± 10.30 ± 0
PD3 IBA 0.168.3 ± 12.731.7 ± 12.70 ± 0
PD3 TIBA 0.0171.9 ± 16.128.1 ± 16.10 ± 0
PD3 TIBA 0.155.7 ± 10.330.7 ± 12.413.7 ± 9.5
PD3 TIBA 1100 ± 00 ± 00 ± 0
PD3 TIBA 2100 ± 00 ± 00 ± 0
PO1 IBA 010 ± 7.789.3 ± 90 ± 0
PO1 IBA 0.119.4 ± 14.963.6 ± 13.216.3 ± 12.3
PO1 TIBA 0.0165.6 ± 12.530.3 ± 12.514.3 ± 41.6
PO1 TIBA 0.186.2 ± 1213.8 ± 120 ± 0
PO1 TIBA 1n.d.n.d.n.d.
PO1 TIBA 2n.d.n.d.n.d.
PO2 IBA 00 ± 011.2 ± 9.990.2 ± 10
PO2 IBA 0.151.8 ± 14.945.1 ± 17.23.1 ± 5.1
PO2 TIBA 0.0174.7 ± 13.425.3 ± 13.40 ± 0
PO2 TIBA 0.1100 ± 00 ± 00 ± 0
PO2 TIBA 1n.d.n.d.n.d.
PO2 TIBA 2n.d.n.d.n.d.
PA IBA 00 ± 013.4 ± 7.986.6 ± 7.9
PA IBA 0.122.2 ± 1056.8 ± 13.721 ± 10
PA TIBA 0.0175.9 ± 11.424.1 ± 11.40 ± 0
PA TIBA 0.1100 ± 00 ± 00 ± 0
PA TIBA1n.d.n.d.n.d.
PA TIBA 2n.d.n.d.n.d.
Table 4. Ratio between fresh weight (mg) of cluster and developed lateral shoots of Colt-wt and phyA-transgenic lines Colt-PD3, Colt-PO1, Colt-PO2, and Colt-PA treated with IBA 0.1 mg L−1 (0.5 µM); NPA 0.01, 0.1, 0.5, and 1 mg L−1 (0.034, 0.34, 1.7, and 3.4 µM); PCIB 0.01, 0.1, 0.5, and 1 mg L−1 (0.046, 0.46, 2.3, and 4.6 µM); and TIBA 0.01, 0.1, 1, and 2 mg L−1 (0.02, 0.2, 2, and 4 µM). Plants grown without IBA were used as a control. Data indicate the mean values ± standard error. Different letters indicate significant differences among treatments and genotypes at p < 0.05, according to Tukey’s test.
Fresh Weight of Growth Cluster Per Neo-Formed Lateral Shoot (mg/Shoot)
Mean ± SE Mean ± SE Mean ± SE
WT IBA 094.1 ± 1.9 bWT IBA 094.1 ± 1.9 bWT IBA 094.1 ± 1.9 b
WT IBA 0.1106 ± 3.2 aWT IBA 0.1106 ± 3.2 aWT IBA 0.1106 ± 3.2 a
WT NPA 0.0158.7 ± 1.7 gWT PCIB 0.0176.8 ± 1.7 cdWT TIBA 0.0176.6 ± 2.3 def
WT NPA 0.164.9 ± 1.2 efWT PCIB 0.170.8 ± 1.1 efgWT TIBA 0.179.9 ± 2.5 de
WT NPA 0.541.4 ± 0.7 iWT PCIB 0.559.1 ± 1 jWT TIBA 154.2 ± 1.1 kl
WT NPA 145.7 ± 1.4 hiWT PCIB 148.9 ± 0.6 kWT TIBA 248.1 ± 0.9 mn
PD3 IBA 079.7 ± 1.9 cPD3 IBA 079.7 ± 1.9 cPD3 IBA 079.7 ± 1.9 d
PD3 IBA 0.193.7 ± 2.3 bPD3 IBA 0.193.7 ± 2.3 bPD3 IBA 0.193.7 ± 2.3 b
PD3 NPA 0.0163.5 ± 0.9 fPD3 PCIB 0.0175.1 ± 1.5 cdePD3 TIBA 0.0185.8 ± 2 c
PD3 NPA 0.167.4 ± 1.4 defPD3 PCIB 0.167 ± 1.3 ghPD3 TIBA 0.177.3 ± 1.1 de
PD3 NPA 0.547.5 ± 0.7 hPD3 PCIB 0.550.1 ± 1 kPD3 TIBA 146 ± 1.1 n
PD3 NPA 147.9 ± 0.9 hPD3 PCIB 146.8 ± 0.9 kPD3 TIBA 246.2 ± 1.1 n
PO1 IBA 079.7 ± 2.1 cPO1 IBA 079.7 ± 2.1 cPO1 IBA 079.7 ± 2.1 d
PO1 IBA 0.158.3 ± 1.3 gPO1 IBA 0.158.3 ± 1.3 jPO1 IBA 0.158.3 ± 1.3 jk
PO1 NPA 0.0178.6 ± 1.6 cPO1 PCIB 0.0173.8 ± 1.7 dePO1 TIBA 0.0174.7 ± 1.7 ef
PO1 NPA 0.155.1 ± 0.6 gPO1 PCIB 0.170.9 ± 1.7 efgPO1 TIBA 0.160.9 ± 0.8 ij
PO1 NPA 0.5n.d.PO1 PCIB 0.5n.d.PO1 TIBA 1n.d.
PO1 NPA 1n.d.PO1 PCIB 1n.d.PO1 TIBA 2n.d.
PO2 IBA 077.7 ± 1.6 cPO2 IBA 077.7 ± 1.6 cdPO2 IBA 077.7 ± 1.6 de
PO2 IBA 0.165.2 ± 1.8 efPO2 IBA 0.165.2 ± 1.8 hiPO2 IBA 0.165.2 ± 1.8 hi
PO2 NPA 0.0170.8 ± 1.5 dPO2 PCIB 0.0174.3 ± 2.1 dePO2 TIBA 0.0163.8 ± 1.8 hi
PO2 NPA 0.146.8 ± 0.7 hPO2 PCIB 0.166.6 ± 1.5 ghPO2 TIBA 0.154.2 ± 1 kl
PO2 NPA 0.5n.d.PO2 PCIB 0.5n.d.PO2 TIBA 1n.d.
PO2 NPA 1n.d.PO2 PCIB 1n.d.PO2 TIBA 2n.d.
PA IBA 076.9 ± 1.7 cPA IBA 076.9 ± 1.7 cdPA IBA 076.9 ± 1.7 d
PA IBA 0.168 ± 1.6 dePA IBA 0.168 ± 1.6 fghPA IBA 0.168 ± 1.6 gh
PA NPA 0.0164.5 ± 1.1 efPA PCIB 0.0172 ± 2 efPA TIBA 0.0171.9 ± 2 fg
PA NPA 0.145.5 ± 0.8 hiPA PCIB 0.161.4 ± 0.9 ijPA TIBA 0.152.3 ± 0.9 lm
PA NPA 0.5n.d.PA PCIB 0.5n.d.PA TIBA1n.d.
PA NPA 1n.d. PA PCIB 1n.d.PA TIBA 2n.d.
Table 5. Test statistics from the multi-response permutation procedure (MRPP) for multiple paired comparisons to evaluate the main effects of genotypes. The value of p is the probability of significant differences among selected groups. t is the t-statistic.
Genotypes Comparisonstp
Colt-PO1 vs. Colt-PO2−3.2940.0140
Colt-PO1 vs. Colt-PA−8.335<0.0001
Colt-PO1 vs. Colt-PD3−25.213<0.0001
Colt-PO1 vs. Colt-wt−40.297<0.0001
Colt-PO2 vs. Colt-PA−1.6150.0728
Colt-PO2 vs. Colt-PD3−15.076<0.0001
Colt-PO2 vs. Colt-wt−32.704<0.0001
Colt-PA vs. Colt-PD3−14.607<0.0001
Colt-PA vs. Colt-wt−32.960<0.0001
Colt-PD3 vs. Colt-wt−220.98<0.0001
Table 6. Test statistics from the multi-response permutation procedure (MRPP) for multiple paired comparisons to evaluate the main effects of treatments. The value of p is the probability of significant differences among selected groups. The value of t is the t-statistic.
IBA0IBA 0.1NPA0.01NPA0.1NPA0.5NPA1PCIB0.01PCIB0.1PCIB0.5PCIB1TIBA0.01TIBA0.1TIBA1TIBA2
IBA0-
IBA0.1t: −8.52
p < 0.001
-
NPA0.01t: −54.52
p < 0.001
t: −39.60
p < 0.001
-
NPA0.1t: −74.44
p < 0.001
−62.77
p < 0.001
−23.84
p < 0.001
-
NPA0.5t: −53.00
p < 0.001
t: −44.88
p < 0.001
t: −30.11
p < 0.001
t: −12.45
p < 0.001
-
NPA1t: −56.98
p < 0.001
t: −48.11
p < 0.001
t: −35.14
p < 0.001
t: −16.48
p < 0.001
t: −8.82
p = 0.001
-
PCIB0.01t: −23.20
p < 0.001
t: −16.34
p < 0.001
t: −39.33
p < 0.001
t: −67.29
p < 0.001
t: −52.36
p < 0.001
t: −55.90
p < 0.001
-
PCIB0.1t: −44.78
p < 0.001
t: −33.02
p < 0.001
t: −12.55
p < 0.001
t: −32.60
p < 0.001
t: −24.51
p < 0.001
t: −27.86
p < 0.001
t: −32.64
p < 0.001
-
PCIB0.5T: −49.60
p < 0.001
T: −36.78
p < 0.001
T: −17.03
p < 0.001
T: −2.07
p = 0.046
T: −13.01
p < 0.001
T: −20.65
p < 0.001
T: −44.81
p < 0.001
T: −19.98
p < 0.001
-
PCIB1t: −60.13
p < 0.001
t: −52.08
p < 0.001
t: −42.36
p < 0.001
t: −23.93
p < 0.001
t: −25.67
p < 0.001
t: −16.07
p < 0.001
t: −57.42
p < 0.001
t: −38.33
p < 0.001
t: −24.91
p < 0.001
-
TIBA0.01t: −41.44
p < 0.001
t: −26.45
p < 0.001
t: −8.32
p < 0.001
t: −42.99
p < 0.001
t: −40.07
p < 0.001
t: −44.64
p < 0.001
t: −22.96
p < 0.001
t: −21.30
p < 0.001
t: −26.65
p < 0.001
t: −46.89
p < 0.001
-
TIBA0.1t: −56.71
p < 0.001
t: −46.41
p < 0.001
t: −8.01
p < 0.001
t: −5.14
p = 0.002
t: −12.02
p < 0.001
t: −15.88
p < 0.001
t: −47.31
p < 0.001
t: −14.70
p < 0.001
t: −2.68
p = 0.025
t: −22.27
p < 0.001
t: −20.65
p < 0.001
-
TIBA1t: −53.21
p < 0.001
t: −42.43
p < 0.001
t: −26.99
p < 0.001
t: −6.82
p = 0.001
t: −7.28
p = 0.001
t: −4.18
p = 0.004
t: −51.77
p < 0.001
t: −24.05
p < 0.001
t: −13.09
p < 0.001
t: −16.73
p < 0.001
t: −38.10
p < 0.001
t: −8.80
p < 0.001
-
TIBA2t: −58.10
p < 0.001
t: −47.62
p < 0.001
t: −36.95
p < 0.001
t: −18.32
p < 0.001
t: −20.22
p < 0.001
t: −9.72
p < 0.001
t: −56.89
p < 0.001
t: −32.58
p < 0.001
t: −22.70
p < 0.001
t: −4.81
p = 0.003
t: −44.41
p < 0.001
t: −15.62
p < 0.001
t: −11.69
p < 0.001
-
Disclaimer/Publisher’s Note: The statements, opinions and data contained in all publications are solely those of the individual author(s) and contributor(s) and not of MDPI and/or the editor(s). MDPI and/or the editor(s) disclaim responsibility for any injury to people or property resulting from any ideas, methods, instructions or products referred to in the content.

