Article

Morphological and Ecogeographical Diversity of the Andean Lupine (Lupinus mutabilis Sweet) in the High Andean Region of Ecuador

by
Doris Chalampuente-Flores
1,2,
María Rosa Mosquera-Losada
3,
Antonio M. De Ron
4,
César Tapia Bastidas
5 and
Marten Sørensen
6,*
1
Universidad Santiago de Compostela, 15705 Santiago de Compostela, Spain
2
Universidad Técnica del Norte, Ibarra 100105, Ecuador
3
Departamento de Producción Vegetal y Proyectos de Ingeniería, Agrupación Estratégica de Bioredes, Universidad de Santiago de Compostela, Campus de Lugo, 27002 Lugo, Spain
4
Misión Biológica de Galicia, Spanish National Research Council (MBG-CSIC), 36143 Pontevedra, Spain
5
Instituto Nacional de Investigaciones Agropecuarias (INIAP), Estación Experimental Santa Catalina, Panamericana sur Km 1, Quito 170201, Ecuador
6
Department of Plant and Environmental Sciences, Faculty of Science, University of Copenhagen, Sobi/Plen-KU, Thorvaldsensvej 40, 3, DK-1871 Frederiksberg, Denmark
*
Author to whom correspondence should be addressed.
Agronomy 2023, 13(8), 2064; https://doi.org/10.3390/agronomy13082064
Submission received: 27 June 2023 / Revised: 19 July 2023 / Accepted: 2 August 2023 / Published: 4 August 2023
(This article belongs to the Special Issue Analysis of Complex Traits and Molecular Selection in Annual Crops)

Abstract

:
Promoting food security is one of the 17 Sustainable Development Goals (SDGs) proposed by the United Nations General Assembly, with a target date of 2030. Human nutrition based on legume consumption is essential to ensuring food security while reducing greenhouse gas emissions associated with nitrogen fertilizer use. Moreover, preserving legume biodiversity is critical to increasing agricultural resilience against climate change. The Andean lupine or “tarwi” (Lupinus mutabilis Sweet) is a legume native to the Andean region with high nutritional importance. Morphological characterization processes allow the determination of local agro-biodiversity and the identification of promising materials for genetic improvement programs. In the present investigation, 173 accessions of Andean lupine from the Germplasm Bank of INIAP, Ecuador, were evaluated. Thirteen quantitative and fifteen qualitative descriptors were used in the characterization. The results revealed that the genetic variability of the Andean lupine is represented by the conformation of four groups of accessions. Among those groups, two accessions stand out for having small plants and high yields, factors that could be used for genetic improvement processes or be reintroduced into farmers’ fields as they represent an option for the production, consumption, and marketing of the local germplasm of this relevant ancient crop. A phenotypic diversity map of the cultivated tarwi explained that areas with high morphological diversity are not completely identical to areas with high ecogeographic diversity. The distribution of the genetic variability of species appears to be more related to cultural aspects than environmental conditions.

1. Introduction

The genus Lupinus comprises between 300 and 400 species worldwide with different centers of diversity, but few species are of agricultural importance [1]. From all the Lupinus genera, the species L. mutabilis Sweet—the Andean lupine locally known as “tarwi”—is the unique species of this genus that is domesticated and cultivated in this region, showing a high agronomic interest [2,3]. Tarwi is a both self-pollinated and cross-pollinated species; it can reach up to 40% of allogamy [4]. It is a species native to South America with a distribution area spanning from northern Colombia to northern Argentina; the great adaptability of the crop suggests the presence of two or three subspecies, with larger-sized and later-maturing plants in the north: tarwi in the central highlands of Peru and tarwi with the earliest varieties in southern Peru and the highlands of Bolivia [5,6,7].
Tarwi is considered one of the legumes with the highest capacity to be adapted to different soils and extreme climatic conditions in the area, allowing it to remain in the high-altitude Andean production systems [8]. This species has high plasticity, being cultivated between 2800 and 3600 m a.s.l. [9]. Other authors mention that tarwi is distributed between 2000 and 3800 m above sea level, the larger values in the range being where the earliest “tauris” are found [7], and grows in unfavorable environments such as dry areas, sandy and poor soils. It is resistant to temperature changes and frost and requires little water supply [3,7,10,11]. Furthermore, as a legume, it has an extraordinarily positive impact on the soil as it enriches the soil nitrogen content via symbiotic N fixation, accounting for 120–160 kg N ha−1 year−1. Other authors mention that through tarwi it is possible to fix nitrogen in an amount of up to 400 kg ha−1 year−1 [12]. In addition, phosphorus availability increases to 120 kg in one year of tarwi cultivation [7], a trait that makes it very interesting to be included as part of a crop rotation [9] and makes it an integral part of the high-Andean production systems [9,10,11,12,13,14].
The effect of tarwi crop residue incorporation in soil, under the traditional crop rotation system and in the recovery of soils, increases potato productivity by 51% and quinoa productivity by 58%. In both crops, the combination of tarwi stubble with animal guano increases its performance even more [15].
Among the Lupinus spp. of American origin, tarwi is the only one that has large seeds, a desirable characteristic for the agroindustrial sector; in Ecuador, there are only two improved varieties developed from Peruvian germplasm introduced in 1992, the INIAP-450-Andino variety and the INIAP-451-Guaranguito variety, with an average yield of between 1300 and 1500 kg ha−1 [16,17,18,19,20,21,22,23,24,25,26]. The tarwi yield is, however, relatively low (789 kg ha−1 year−1) even though improved genera have been with yields of 1500 kg ha−1 [19,20], due to the small area planted and the low yields associated with phytosanitary problems.
Therefore, the current consumption of tarwi per capita is approx. 4 kg year−1 person−1 [21,22]. This rate of consumption is higher than that of current production, reaching a global deficit of approximately 6000 t year−1 in the Ecuadorian market, which is partially covered by imports from Peru and Bolivia, where 2000 t is imported annually [22]. The interest in this legume lies in the high protein value of the seeds, which ranges between 40 and 50% with around 20% of essential fatty acids (linoleic and oleic) and minerals (phosphorus, iron and potassium), 7.6% of crude fiber, 4.14% of ash and 35.77% of carbohydrates [3,23,24]. Tarwi is also a very versatile product that can be used in the preparation of various foods for both humans and animals, and tarwi has furthermore been shown to be an alternative supporting the fight against child malnutrition [25]; however, direct consumption is affected by the presence of alkaloids (lupinine, lupanidine and sparteine) that give it a bitter taste, which is harmful to health and the main disadvantage for its consumption [26]. The content of alkaloids in tarwi can present some variations depending on the climatic seasons or localities where the crop is grown [27].
Knowledge of morphological variation and geographic distribution patterns allows us to understand the evolution of plant species and strengthen their conservation [16]. Environmental factors play an important role in the domestication of plants and crops, allowing them to adapt to a wide range of environments. Through allele diversity, genes that have developed features of diversity can be accumulated. The specific selection pressure that prevails at a site reflects the distribution patterns of the species (Hawtin et al., 1996, cited by Tapia [7]).
The bioclimatic, geophysical, and edaphic characteristics of the collection sites combined with the morphological characteristics of the species can help to obtain a better representation of the genetic diversity present in a certain area. In addition, spatial analysis combined with morphological and ecogeographic characterization data and using geographic information systems (GIS) allows an improvement in diversity monitoring and the formulation and implementation of more effective conservation strategies [7,17,18].
The plant’s nutritional qualities make the evaluation of its varieties of high interest. Based on an assessment of 173 accessions of tarwi conducted to identify the qualitative and quantitative characteristics with high discriminating capacities, i.e., characteristics that allow the recognition of patterns of the phenotypic variation of the accessions. Finally, the classification of tarwi genotypes based on their quantitative and qualitative characteristics into groups was completed [27,28,29,30,31,32,33].
The objectives of this research were (a) to determine the level of morphological diversity present in 173 accessions of tarwi from Ecuador; (b) to classify these accession groups based on their quantitative and qualitative morphological characteristics; (c) to identify the qualitative and quantitative characteristics with the greatest discriminating capacity that allow the recognition of the infraspecific relationships between groups of accessions; (d) to identify the morphological and ecogeographical diversity in the tarwi collection.

2. Materials and Methods

2.1. Site Features

The experiment was conducted in the Imbabura province, Ecuador (0°12′ N, 78°08′ W, 3069 m a.s.l.). The soil texture was sandy loam, the average temperature ranged from 4 to 19 °C during the day and 11 to 13 °C at night, and the annual precipitation varied from 750 to 1000 mm. This area is dedicated to the production of various Andean crops, including tarwi. Moreover, according to MAG [34], the province of Imbabura is classified as a potentially high-altitude area for the agroecological production and marketing of tarwi.

2.2. Genetic Material

This experiment evaluated 173 tarwi accessions representing collections from 1975–1999 and 2014–2015 in Ecuador. The collection sites were defined based on passport data registered in the INIAP Germplasm Bank, located at the Santa Catalina Experimental Station in Quito, Ecuador. Germplasms may be available through Material Transfer Agreement (MTA), a mechanism regulated through Ministerial Agreement 34, in force since 2015, which establishes a standard for subscriptions to contracts for access to genetic resources [35].
In total, germplasms were collected from 89 sites corresponding to nine provinces of the Ecuadorian Sierra, at altitudes ranging from 1900 to 3600 m a.s.l. (Table 1); the germplasm collection sites respective to the ecoregions in the Andean region of Ecuador are shown (Figure 1).

2.3. Experimental Design

Under field conditions, the 173 accessions were planted in a complete randomized experimental design with 15 plants per accession for morphological characterization. However, only ten plants were evaluated to avoid the border effect.

2.4. Agronomic Management

The tarwi accessions were planted in November 2015, and the harvesting period ended in July 2016; for the management of the crop, the agricultural manual of Andean crops by Peralta et al. [17] was used as a reference. Soil preparation consisted of a harrow and furrow pass; the planting distance between rows was 1 m, with plants 1 m apart (the plants have a predominant central axis with branches from the middle of the plant and can reach a height of up to 2 m, which means that more space is required for its development). A weeding was performed 15 days after sowing, and three rounds of hilling (an agricultural technique that consists of accumulating soil at the base of the trunk or stem of a plant) were performed at 50, 90 and 120 days after sowing. The harvesting of seeds of the central axis of the tarwi began 178 days after sowing, concluding the process at 276 days. Since planting was carried out during the rainy season in the Andean region, there was no need for irrigation, and pests and diseases were monitored for phytosanitary control.
The samples were stored in the INIAP Germplasm Bank, Santa Catalina Experimental Station, Pichincha, Ecuador, at a temperature of −15 °C.

2.5. Variables Evaluated

Tarwi accessions were characterized according to 13 quantitative and 15 qualitative variables (Table 2). The descriptors were ranked according to the scales of the standard systems for the evaluation of tarwi germplasms proposed by the International Board for Plant Genetic Resources [IBPGR] [36], and color registration was carried out according to the Munsell color chart.
The field evaluation began when 50% of the plants in an accession had flowers on the main axis. Characterization was based on the different organs of the tarwi linked to the plant, leaf, flower and inflorescence, pods, and seeds, as follows.
In the field:
(a)
plant: stem formation, procumbence resistance, plant vigor, number of pods per main axis, days to flowering, days to maturity (50% of dry pods in the main axis) and height of the plant measured at the time of harvest.
(b)
leaf: pubescence of the upper part and underside of the leaf.
(c)
flower and inflorescence: length of the peduncle of the main axis, length of the inflorescence of the main axis, color of the flower bud, and color of the wings, keel, and flower banner.
(d)
young pod: pubescence of the pod.
(e)
dry pod: pod dehiscence and number of pods in the main axis.
In the laboratory:
(f)
pod: length and width of the pod, and number of seeds per pod.
(g)
seed: seed shape, primary and secondary color of the seed, length and width of the seed, weight of 100 seeds (humidity of 12%), and yield per plant.

2.6. Morphological and Ecogeographic Agro-Biodiversity

The map of optimal zones of the spatial representation of the agro-biodiversity of tarwi in Ecuador was generated by superimposing a grid of square cells measuring 5 × 5 km on the maps of phenotypic and ecogeographic diversity that were generated via the morphological and ecogeographic characterization using the DIV Maps tool of the CAPFITOGEN program [14], which allows the obtention of maps that show areas of high variability (hot spots) at an intraspecific level. The maps were processed in ArGIS version 2019 to facilitate interpretation; they were added to the location layer of the accessions to later calculate the total number of morphotypes for the cells that presented high values.

2.7. Statistical Analysis

The data obtained from the morpho-agronomic characterization were analyzed using the InfoStat/Professional program, version 2017 [37]. The database was generated with qualitative and quantitative variables, considering the mean and mode of 10 experimental units, i.e., 10 plants, per accession.
To analyze the qualitative descriptors, a descriptive analysis was performed via frequency analysis. In the case of quantitative descriptors, summary measures such as the mean, coefficient of variation, minimum value, and maximum value were used. Subsequently, principal component analysis (PCA) was performed for quantitative variables. Qualitative variables were transformed into binary variables (0 and 1) (CFB, CKP, CMB, PP, SS, PSC, SSC, and DSC) and quantitative variables were used for multivariable analysis. A cluster analysis was carried out with Ward’s [38] hierarchical grouping method and Gower’s [39] similarity coefficient. Finally, to determine the variables that contributed most to the formation of groups, analyses of variance were conducted with Fisher’s [40] LSD test, contingency tables using the Chi2 statistic, Cramer’s V, the association coefficient (P) and the p-value [41,42].
To identify the internal variation of the groups, the coefficient of variation (CV) generated in the analysis of variance was used. For the qualitative variables, the absolute frequencies of each category and the mode variation index (DM) were calculated, as proposed by Wilcox [43]. The formula used was 1 − ( i = 1 k ( fm − fi)/N(K − 1)), where fi is the frequency of each i category, fm is the frequency of the modal category, K is the number of categories, and N is the number of cases.

3. Results

3.1. Genetic Variability in the Ecuadorian Tarwi Collection

3.1.1. Quantitative Variables

The present research was based on the study of 13 quantitative variables, of which four variables showed the most significant variation. Thus, the following variables stand out: the average length of inflorescence (CV = 19.7%), presenting ranges between 9.00 and 29.30 cm; plant height (CV = 20.89%), presenting ranges between 61.60 and 190.00 cm; the number of pods in the main axis from 3 to 18 pods (CV = 31.32%) the average yield was 103.78 (g plant−1) (CV = 78.42%) with a minimum value of 12.75 and a maximum value close to 500 g plant−1. The variable with a CV of <20% showed less variability, mainly in relation to the length and width of the seed (CV = 4.00 and CV = 3.97) as well as the days to flowering and days to maturity (CV = 2.45 and CV = 4.72) (Table 3).
The results suggest that there may be relevant differences among the evaluated characteristics in their contribution to the variability of the species. Within the collection, there are accessions with a plant height between 61 and 190 cm, with an inflorescence size that borders 9 and 29 cm. Regarding the size of the pod, maximum values for the width of the pod of 1.35 cm were recorded, with a maximum length of 17 cm; however, this characteristic was found to be present only in one accession (Ecu-669).
The variable number of pods per plant in the main axis of the plant is one of the characteristics with the greatest variation, with a germplasm that produces approx. 3 to 18 pods per plant, which can contain around 3 and 6 seeds, the average being 5.05 seeds per pod. Regarding the size of the seed, although there is little variability, it is possible to find accessions of an average of 0.81 cm wide and 0.99 cm long.
The maximum and minimum values that mark the most extensive range of variability indicate different degrees of adaptation. Thus, the variable with the highest standard deviation (81.38) and coefficients of variation was yield (expressed as g plant−1), revealing accessions that produce about 12 g plant−1, with a maximum of approx. 500 g plant−1, and there are seven accessions that present a yield of above 300 g plant−1 (Ecu-645, Ecu-666, Ecu-670, Ecu-672, Ecu-674, Ecu-27506 and Ecu-27514), the average being 103.78 g plant−1. Regarding the weight of 100 seeds, there are accessions with seed weights ranging from 12 g 100 seed−1 to 33 g 100 seed−1.

3.1.2. Qualitative Variables

Within the tarwi collection characterized, 92% of accessions present plants with a prominent stem shape; in addition, 53% of the collection showed little procumbence (stem inclination). Regarding the plants’ vigor, 89% were vigorous plants. For the descriptors related to the leaf, 98% presented an absence of leaf pubescence on the adaxial side and 86% presented this on the abaxial side (Table 4).
Regarding the color of the flower, 100% of the accessions presented green flower buds, and at the level of the flower structure, the color of the keel was white throughout the collection; regarding two other flower structures (wings and banner), 81% of the accessions presented purple flowers, 17% were blue, and only 2% of the collection (4 accessions) presented completely white flowers (Table 4).
Regarding the pod characteristics, only one accession (Ecu-22500) presented dehiscent pods and 100% developed pods with pubescence. The form of seed showed that around 69% were of a flattened oval type, 24% showed oval-type shapes, and less than 3% had spherical, lenticular, square and flattened square shapes. Seed colors were 100% white, while only 7% of the population presented a secondary color of the seed coat. The black color stood out in 4% of the seeds, and as to the distribution pattern of the secondary color, the crescent shape stood out in 6% (Table 5).

3.2. Multivariate Analysis

3.2.1. Principal Component Analysis

Table 6 shows the selection of four components (with eigenvalues above one). Note that the first four components explain 72% of the total variability.
Component 1, which explains 34% of the variation, represents earliness and productivity, including days to flowering, days to maturity, number of pods on the main axis and yield. Component 2 explains 17% of variation and is related to the seed length and width and the weight of 100 seeds. Component 3 explains 11% of the variation and is associated with characteristics such as plant height, peduncle length and inflorescence length. Finally, the contribution of the fourth component (9%) is also considered since it is represented by variables related to the pod, such as width, length and number of grains per pod, i.e., variables that could be relevant for the identification of promising materials, and also, displays outliers, that sometimes should be considered unusual forms of variation or observations that are numerically distant from the rest of the data, with possible breeding potential for particular quantitative traits.

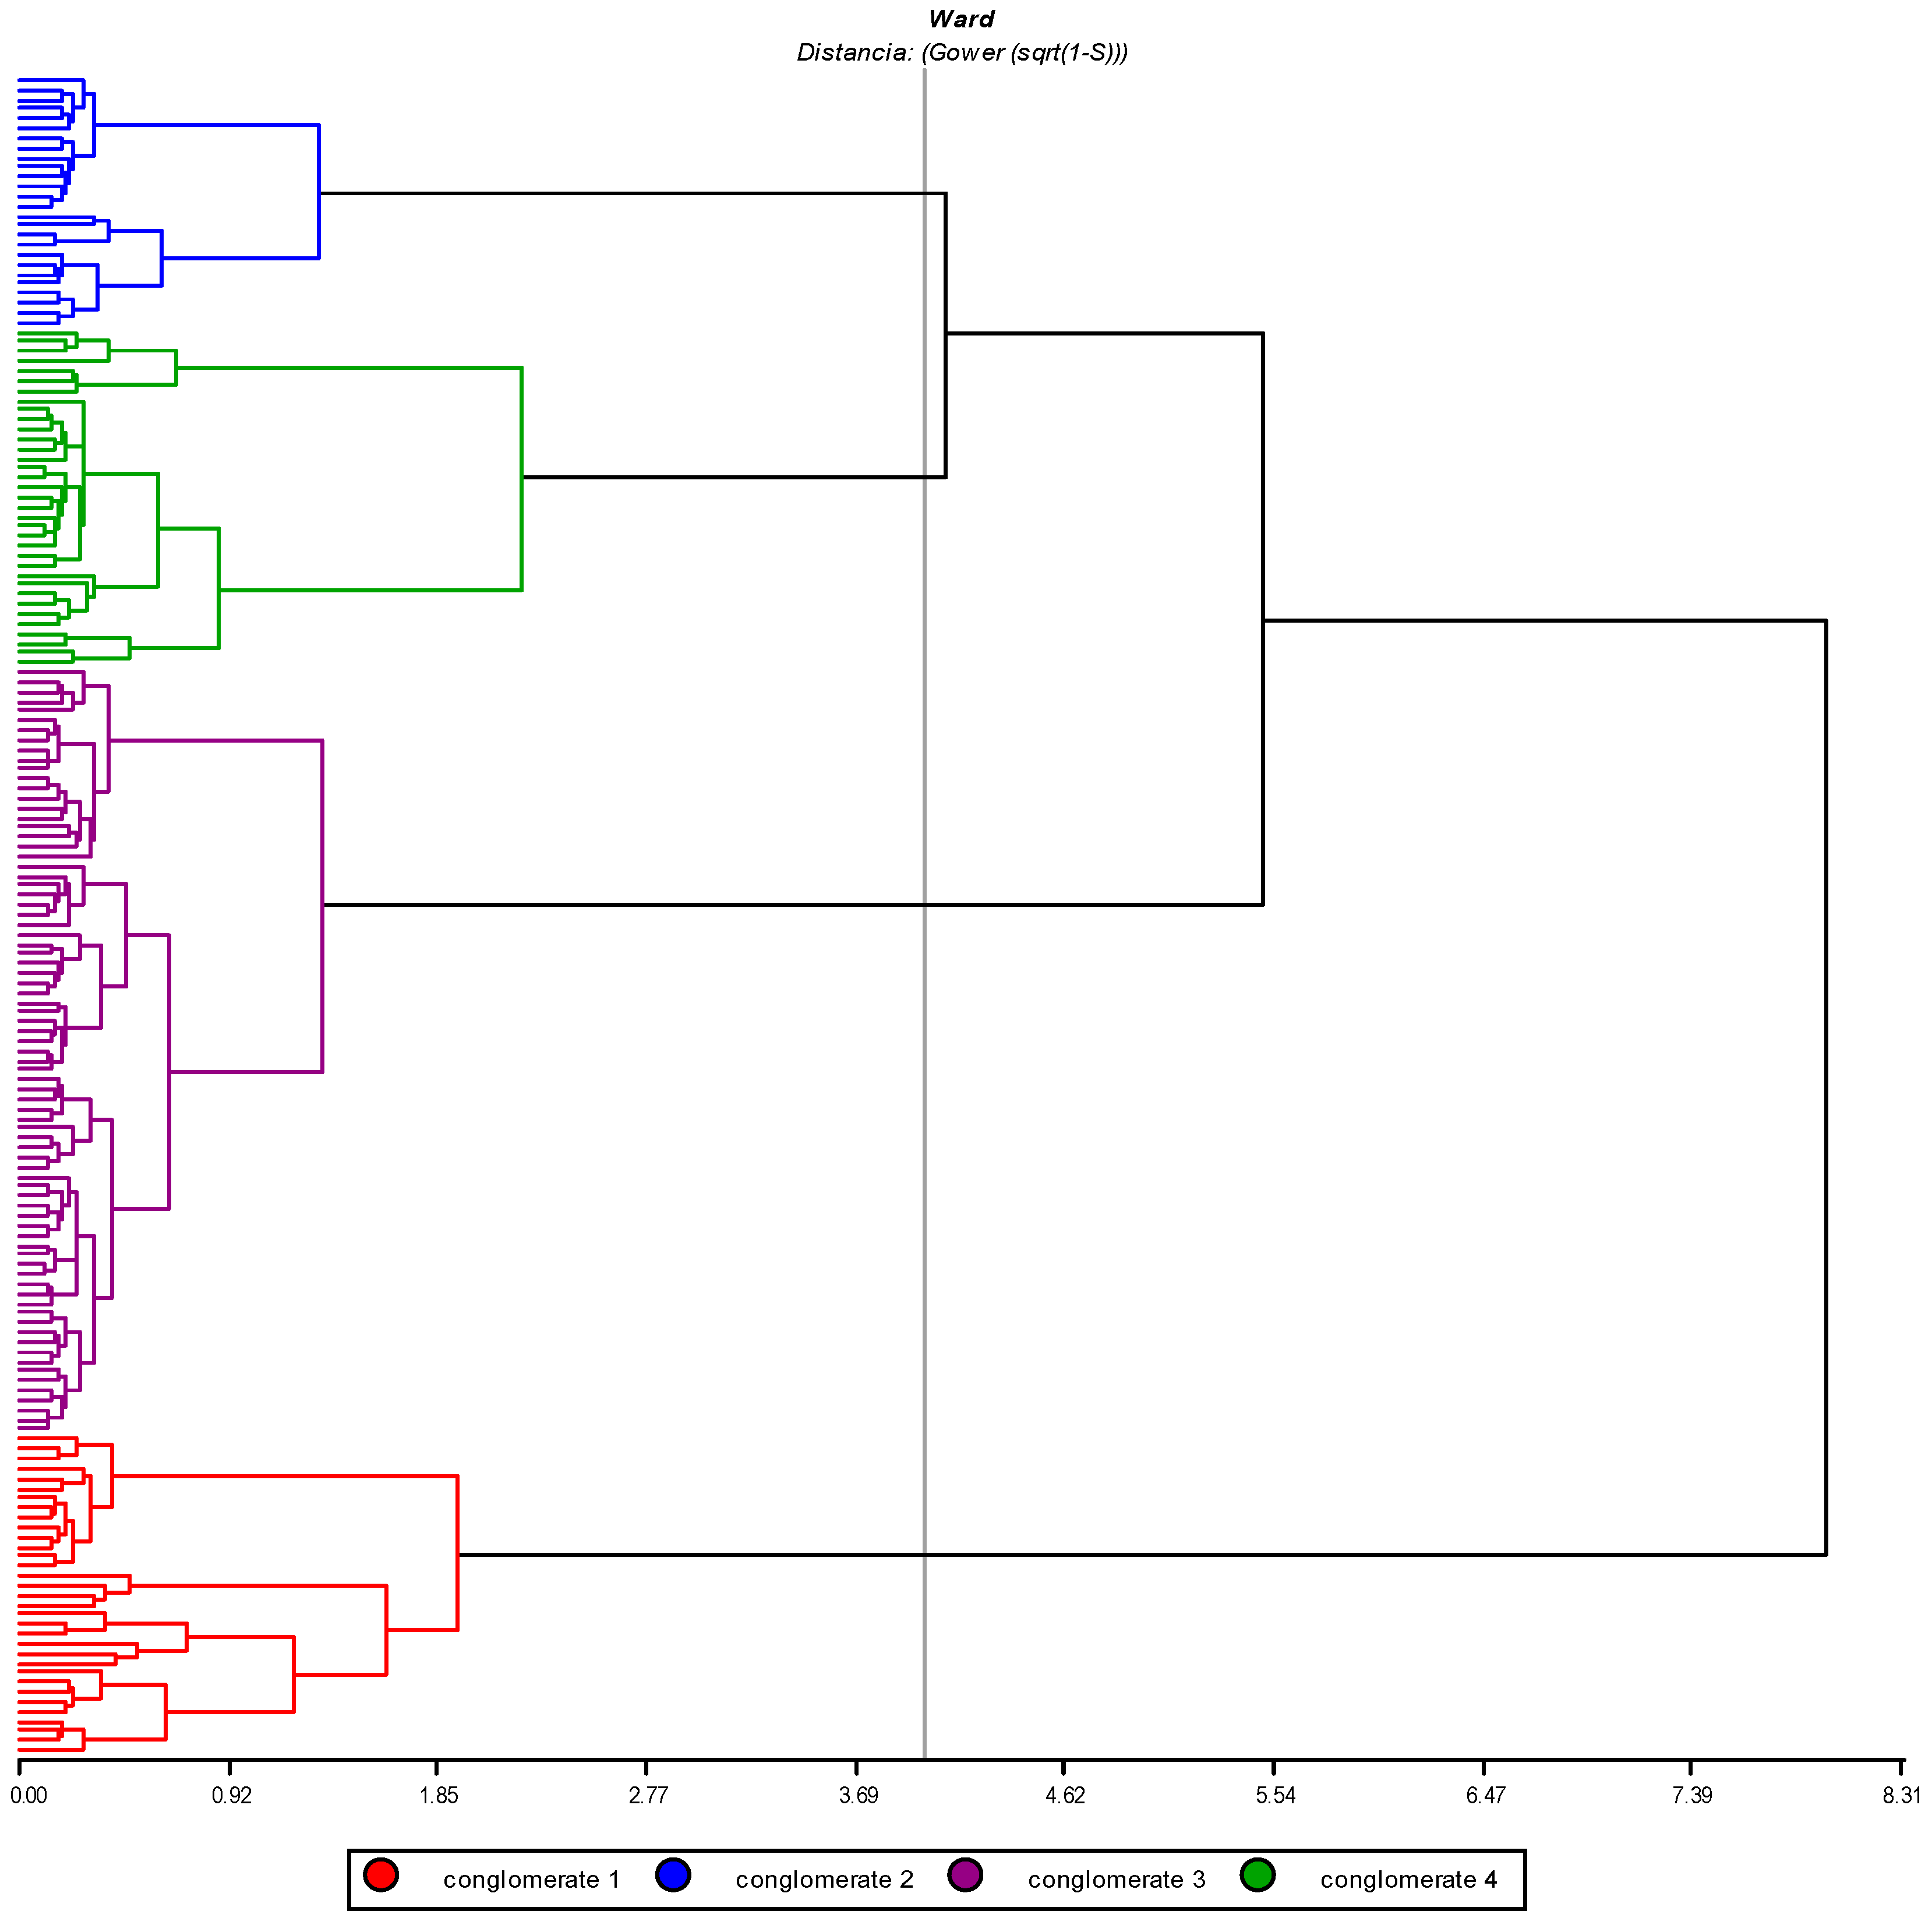
3.2.2. Group Analysis

The previous analyses selected descriptors with a higher discriminating power (5 qualitative and 13 quantitative ones). Through group analysis, four groups were identified, that were defined by a similarity coefficient of four and a maximum distance of 8.1. No accession presented a genetic distance equal to zero, which means that no duplicates were included within the collection. However, 27 pairs of accessions were identified that share greater similarity at distances between 0.10 and 0.14 (Figure 2).
Regarding the structure of the groups, G1 integrates 33 accessions (19.07%), and they are grouped at a distance of 1.9. This is characterized plants with an average height of 120 cm; they have approx. ten pods per main stem, with an average yield per plant of 127.41 g. G2 with 26 accessions (15%) is grouped at a distance of 1.3. This group presents plants with heights of 94.12 cm, being the smallest within the collection, and, at the same time, is the one with the highest rate of production (203.52 g plant−1) (Table 7).
G3 represents the highest number of accessions (79), grouping 45.6% of the collection, the distance to which they cluster being close to 1.35; this group presents taller plants (average of 147.11 cm) with low production (72.42 g plant−1), as can be expected when assimilates are allocated to vegetative rather than reproductive growth. Finally, G4 presents tall plants of an average of 144.59 cm, with a low production rate of 78.20 g plant−1; this group is made up of 35 accessions (20.2%) at a maximum distance of approx. 2.2 (Table 7).

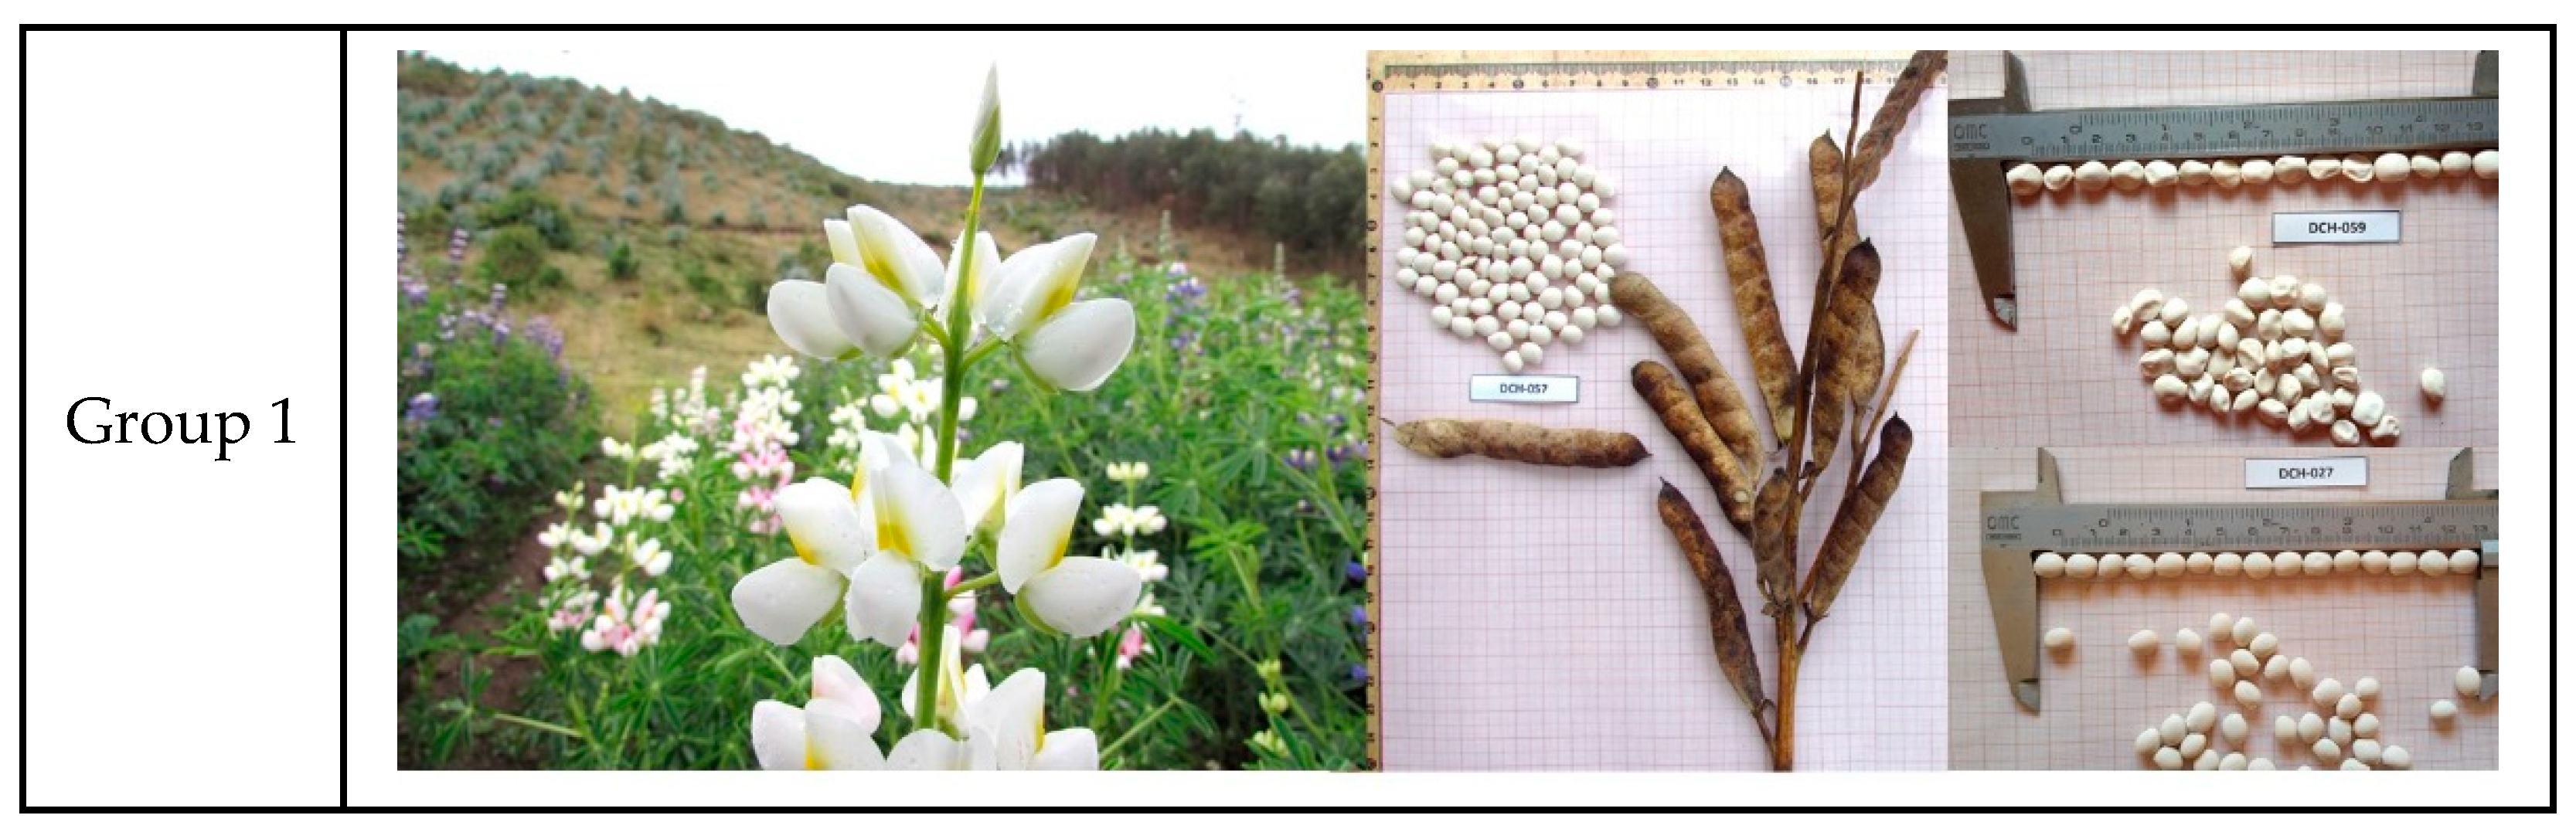
3.2.3. Morphological Variability of Quantitative Variables at the Group Level

In the analysis of variance, seven variables (PL, ALI, PH, NPS, DFF, DM, and YGP) had significant differences (p-value < 0.0001) for differentiation between groups. According to the average coefficient of variation, the yield (CV = 64.68%) and the number of pods on the main axis (CV = 22.85%) were the variables with the greatest dispersion. In comparison, the variables days to flowering (CV = 1.33%) and days to harvest maturity (CV = 3.47%) were the most homogeneous. However, they were found to be significant (p-value = 0.0001) for differentiation between groups (Table 7).

3.2.4. Morphological Variability of Qualitative Variables at the Group Level

The contingency tables were used to determine if the association between the categories of each categorical variable and the groups is significant (p-value ≤ 0.0001). The contingency analysis allowed the determination that the five qualitative variables used in the group analysis turned out to be the characteristics with the highest discriminant value (173) (CWP, CMBS). Meanwhile, those with the lowest coefficients of association, the secondary seed color, and the distribution pattern of the secondary color, presented a Chi2 value of 41.76 and 28.77, respectively (Table 8).
The morphological variability observed allowed us to determine that 88% of the accessions in G1 presented blue flowers (wings and standard). Only 12% (four accessions) had completely white flowers, according to the index of deviation from the mode (DM). These characteristics presented a value of 0.18; however, in G2, G3 and G4, this value is 0 because the accessions have a single flower color state (violet wings and banners) (Table 9, Figure 3).
Seed shape was one of the variables with the most significant variation, so G2 presented a DM value of 0.55; this group houses accessions with flattened oval (54%), oval (31%), and lenticular (8%) seeds, and 4% correspond to spherical and flattened square shapes. G1 presented a DM value of 0.36. In this group, accessions with four seed shapes are conglomerated: flattened oval (70%), oval (21%), lenticular (3%) and spherical (6%). G4 presented a DM index of 0.27, four seed shapes were registered as a part of the index, lenticular (6%), oval (77%), and flattened oval (11%), and it is the only group that presents the square-type seed shape. Finally, G3 presented a DM = 0 index; the accessions that make up this group have a single seed shape (flattened oval) (Table 9, Figure 3).
The variability found in the secondary color characteristics of the seed was DM = 0.24 and DM = 0.23 for G1 and G4, respectively. In G1, three secondary colors were present in the seeds (9% were dark brown, 6% were light brown and 3% were black), while in G4, 17% of the accessions had a secondary black color. Therefore, G2 and G3 did not present a secondary color in their seeds. Regarding the secondary color’s distribution variability, G1 and G4 showed a DM of 0.27 and 0.26, respectively; this is how the crescent shape was present in 12 and 20% of the mentioned groups. However, G1 presented an additional form: the sprinkled type (6%) (Table 9, Figure 3 and Figure 4).

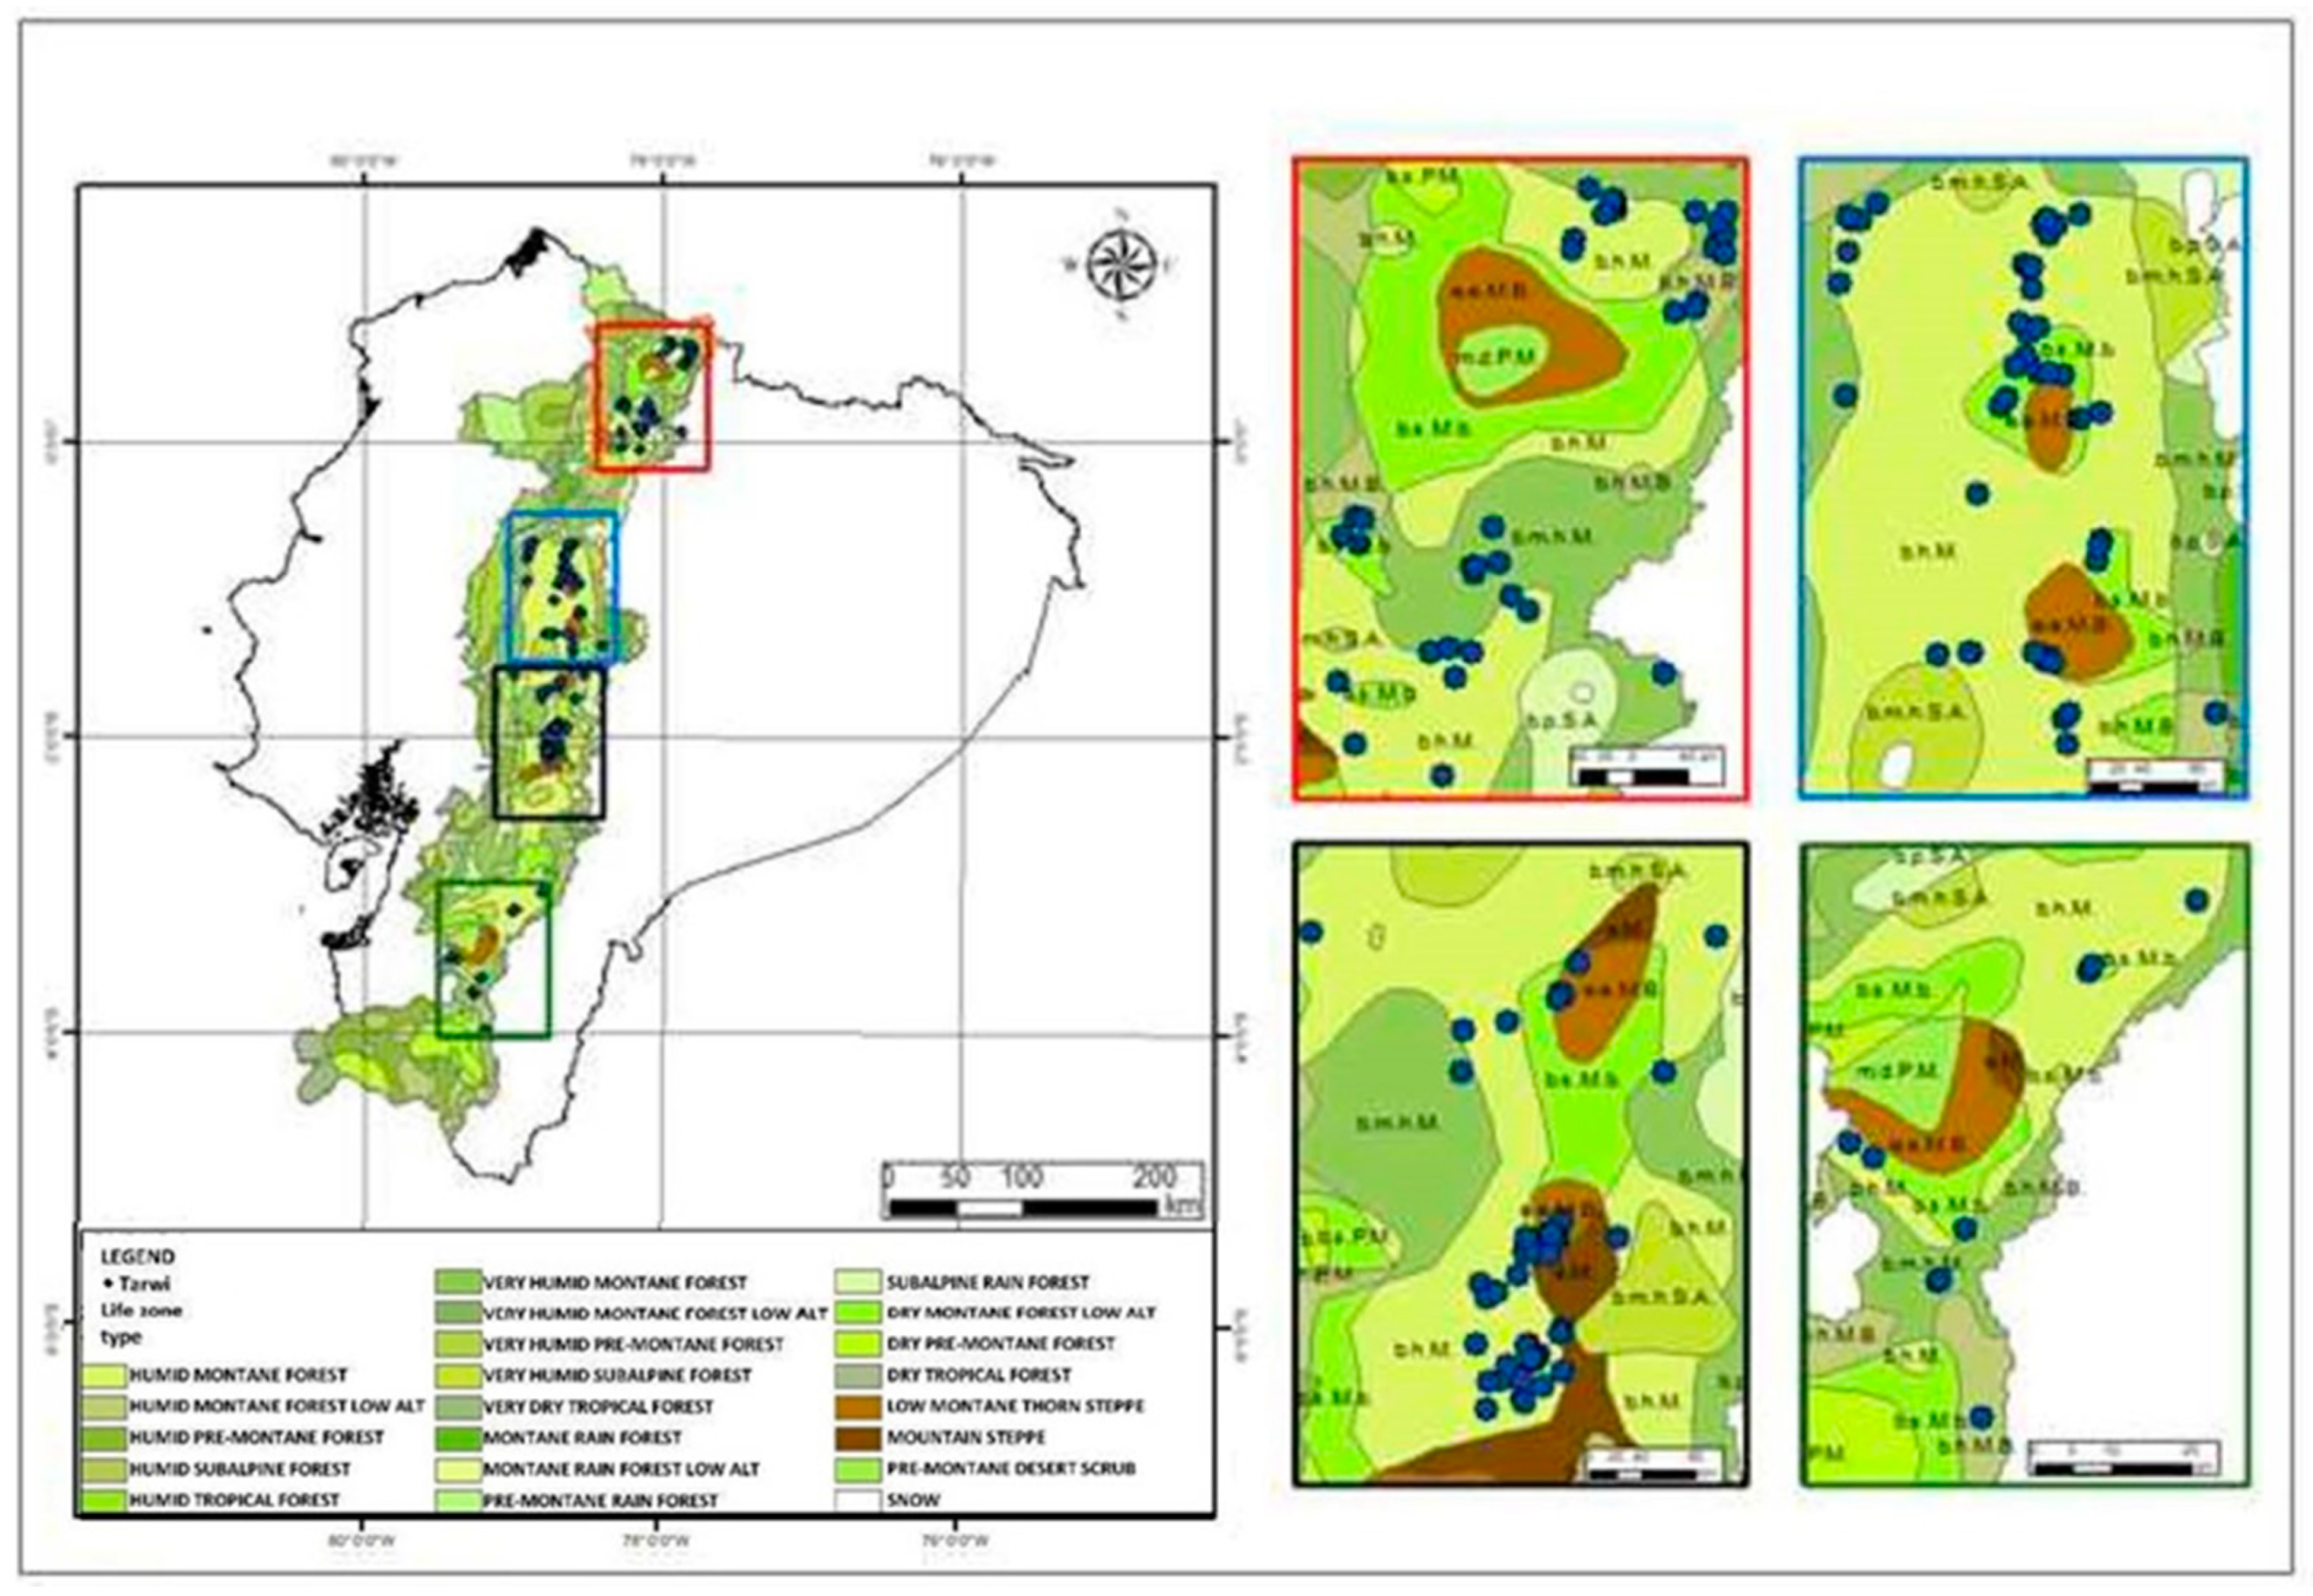
3.3. Ecogeographic Diversity Maps for Tarwi

Bioclimatic, geophysical, and edaphic variability are represented by variables such as precipitation, temperature and elevation, among others, which give reference to the ranges of adaptation or geographic distribution of tarwi in Ecuador.
Twelve cantons with ecogeographic areas with very high ranges of ecogeographic diversity (9.3–10.58) located in six provinces (Carchi, Imbabura, Pichincha, Cotopaxi, Chimborazo and Bolívar) were identified. The geographical area with the maximum ecogeographic diversity (10.58) corresponds to sectors of the province of Chimborazo, the cantons of Guamote, Riobamba and Colta.
Regarding the category of medium ecogeographic diversity (8.2–9.2), 15 cantons were identified in six provinces of the Sierra (Carchi, Imbabura, Pichincha, Cotopaxi, Chimborazo and Azuay). The areas of low ecogeographic diversity (6.9–8.1) and very low or zero ecogeographic diversity (0.0–6.8) are distributed in all the provinces of the inter-Andean alley (Figure 5).

3.4. Tarwi Phenotypic Diversity Map

In the Andean zone, 16 cantons belonging to seven provinces that present high phenotypic diversity were identified, present in the provinces of Cotopaxi, Sigchos, Latacunga, Salcedo, Pujilí cantons; the province of Azuay, in the cantons of Cuenca, Sigsig, Girón and Nabón; and the provinces Carchi, Imbabura, Pichincha, Chimborazo and Loja, where between one and two cantons within this range were identified. Regarding the average morphological diversity (0.41–0.52), 21 cantons were detected in seven provinces, and 23 cantons with low morphological distances (of 0.31–0.40) were distributed in the provinces of Carchi, Imbabura, Pichincha, Cotopaxi, Tungurahua and Chimborazo. In addition, throughout the Ecuadorian highlands, you can find sites with very low or no morphological diversity (0.0–0.30) (Figure 6).

4. Discussion

The variability of the tarwi collection is related to the (i) flower color, (ii) secondary seed color, and (iii) seed shape. Note that in addition to color and shape, there are more aspects of variability in the collection, although they are not included in the MCA. According to Leakey [44], characteristics that are not influenced by the environment but by simple inheritance can be used in characterization and genetic improvement processes.
The PCA determined that PC1 represents earliness and productivity, PC2 refers to the quality of the grain, PC3 is related to the vigor of the plant and PC4 indicates the quality of the pod. All these characteristics are relevant for the use of the tarwi accessions studied in the improvement of the crop, so all the PCs and their combinations must be considered to understand the available variation and for improvement purposes. Other studies explain that the total variance found in the characterization of tarwi was expressed in two dimensions, with a variance of 95.5% being reported by Quispe, 1997, cited by Blanco [5], while in the morphological characterization of local ecotypes in Bolivia, it was found that variability was expressed in six dimensions, with 70.17% of the total variation, these pertaining to the variables related to stem and leaf characteristics that give greater weight to CP1 and that can help to explain the agronomic variability of the tarwi crop [5]; however, these variables were not considered in the present investigation, and could be considered for future research.
To visualize the relationships between samples, a cluster analysis (CA) was carried out with Ward’s [38] hierarchical grouping method and Gower’s [39] similarity coefficient. Regarding the grouping of the tarwi accessions arising from the CA, in G1 are located the accessions with greater variability regarding the shape and color of the flower and seed. Also, in G2 and G4, it is possible to find all forms of seed described by IBGRI [36], as demonstrated by the existing inter-accession variability, except for that of G3 which presents accessions with the same flower and seed shape and color. With regard to this, Tapia [9] mentions that in Andean tarwi, there is wide genetic diversity, and he proposes the presence of three groups of tarwi at the regional level, proposing the hypothesis that they could be recognized as subspecies.
The existence of genetically diverse germplasms can be included in breeding programs through the selection of characteristics of interest. González and Bosland [32] indicated that collection and characterization are necessary to obtain and find additional genetic resources that are not known. The morphological analyses led to the identification of different levels of variability facilitating the identification of materials with desirable characteristics such as high yield rates and other useful traits such as the plant vigor, growth habits, and other relevant aspects for breeding programs. Evaluating the genetic variability of the tarwi collection from Ecuador allowed the identification of four groups of similar genotypes for all the characteristics. No accession presented a genetic distance equal to zero; that is, there are no duplicates within the collection.
Among the group of quantitative variables, the inflorescence size, plant height, number of pods per plant (main axis), number of grains per pod, yield, weight of 100 seeds, and days to flowering and physiological maturity stand out. Studies by Galek et al. [45] showed that 78% of the variability of the Lupinus genus was expressed in three components, i.e., the number of pods of the main axis, height of the plant, and weight of 100 seeds, as well as variables related to the phenological phases, which allowed the clarification of the generic diversity. Other diversity studies in L. albus [46] and L. hispanicus Boiss. & Reut [47] showed that in addition to the variables mentioned above, seed and pod size are essential attributes that allow the classification of observed diversity.
Within the germplasm collection, variability in plant size can be found; differences in plant height may be due to genotypic characteristics in response to environmental conditions and the fertilization effect. However, a plant with a good height does not necessarily respond with good performance, as observed in groups 1, 3 and 4. Otherwise, it is appreciated that the yield rate in G2 is approximately 60% greater than that of groups 3 and 4 and 38% greater than that of G1; it should be emphasized that the height values are within the ranges identified in germplasms of Andean origin [4,9].
Compared to that of improved varieties from Ecuador (INIAP-450 Andino and INIAP-451 Guaranguito), the yield is like the optimal production ranges [48,49,50]. At the group level, native materials from G2 stand out (Ecu-674, Ecu-672, Ecu-645, Ecu-27502, Ecu-27547 and Ecu-27556) that present productive potential and could be used for genetic improvement or encourage the production of this germplasm according to the place of origin [51,52].
In the present study, variability in plant size can be found, as corroborated by Almeida Cuastumal [53], who evaluated germplasms reporting plants with heights greater than two meters which could become a limitation for plant breeding processes. However, tall plants are advantageous for farmers because they can be used as a live fence or to separate plots of different crops [54]. According to interviews with farmers at the collection sites, it became apparent that the general cropping system for tarwi is monoculture; however, 42% use an association system involving either intercropping with other crops such as quinoa, potato, and bean or along the borders of the production plots, but also even as scattered plants or as part of their gardens. In Andean forestry, this is one more element of the productive landscape that is in agreement with the peasant agro-centric vision [55].
Anastasova [56] mentions that the potential of a genotype depends on the number of pods, seeds per plant, and weight of the seeds, which are factors determining productivity. However, Velásquez [28], and Guaytarilla and Falconí [31] consider that the environment strongly influences these characteristics, so they may or may not express their maximum potential, allowing discrimination between accessions and between groups. Thus, the products of G2 stand out for having a greater number of pods in the central axis, followed by those of G1; although the variation in the number of grains per pod is low, the G2 materials develop less than five seeds per pod in contrast to the other groups.
Timmerman-Vaughan et al. [57] and Ligarreto [58] indicate that the ideal scenario would be to have a number equal to or greater than six grains per pod, as shown by the accession Ecu-675. However, genetic improvement becomes complex when the number of seeds per pod increases because it can decrease the number of pods per plant. In Ecuador, the INIAP 450 Andino variety has between six and eight seeds per pod; however, the germplasm is of Peruvian origin [20].
In the case of the germplasm from Ecuador, 33% of the accessions of the tarwi collection presented a weight of 100 seeds within the optimal ranges of the improved varieties (28–30 g), and only 5% showed values higher than those already mentioned in the study by Velásquez [28]; the seeds of L. mutabilis also turned out to be the heaviest (26–30 g). There was a low variability for the length and width of the seed when comparing tarwi with other legumes such as beans (Phaseolus vulgaris) and peas (Pisum sativum L.).The size of the seeds of tarwi is intermediate and compared to beans, peas, and soybean (Glycine max (L.) Merr.) tarwi has a 17% wider diameter, which may be an indicator of its nutrient storage capacity [27,59]. However, seed size is a relative indicator of nutrient storage capacity because it depends on which nutrient we are talking about. In the case of proteins, for example, tarwi and soybeans are far ahead of peas and beans (e.g., in Spain there are extra-large beans with a size of 100 g 100 seeds−1).
Velasquez [28] suggests that this variable also depends on the size of the seed; for the present study, these variables turned out to be non-significant in the differentiation between groups, which implies that there are relatively homogeneous seeds within the tarwi collection. In addition, the registered values are like the characteristics of the improved varieties [22].
In the national collection of tarwi, all seeds presented a white primary color and a low percentage of then showed a secondary color, which also registered high yields; this coincides with the findings of De la Cruz [60], who identified two Peruvian ecotypes with desirable characteristics related to production and adaptation. For Velásquez [28], this descriptor deserves attention, as it guides the selection of phenotypes for breeding purposes.
According to Chirinos-Arias [61], the number of polymorphism bands found in the species can be explained by the color of the testa since it is an indication of cross-pollination (allogamy). Also, other researchers suggest that variations in alkaloid content may result from the presence of transposable elements, which is also the case for maize (Zea mays L.) [62].
Blanco [5] reports that the most common flower colors in tarwi are blue, violet, and white, while cream, pink and yellow are less frequent. Also, according to Gross [11], this color variation is due to anthocyanins and flavonoids. In the tarwi accessions studied, three colors were identified, the most dominant ones being violet, blue, and white. For Peralta [29], the presence of white-flowered tarwi is linked to a cultural aspect since it is mainly used as a floral ornament for churches and not for consumption; one of the reasons is the lack of knowledge about its culinary uses. In the national collection, this type of germplasm is found in the south of the country (i.e., the Azuay and Loja provinces).
In the tarwi collection, 100% of the accessions corresponded to white seeds, and only 6.9% presented secondary color, G3 being the one with the greatest diversity of secondary colors at the seed level, followed by G2. Gross [11] points out that seed color is a genetic characteristic of complex inheritance, finding genes for color and their combinations. Aniszewski et al. [63] suggest that in Lupinus, the testa’s color variation and the seed shape is related to the inter-specific hybridization that occurs.
Clements et al. [64] and Ochoa-Zavala et al. [65] argue that domestication directed by consumer-friendly morphological characteristics has led to the selection of germplasms with larger seeds and uniform colors. This possibly has caused farmers to select their seeds before sowing to guarantee an opportunity for sale and consumption. Martínez-Castillo et al. [48] consider that this selection obeys colonization patterns, incorporating small producers in the market and obtaining better prices. However, according to Dugje et al. [49], this process influences the selection of genotypes placing the species at risk of genetic erosion because it causes some genotypes to become lost or displaced by materials with desirable attributes.
The challenge for breeders is to develop pure lines with uniform and heritable colors, combined desirable agronomic traits and with high-yielding genes [44]. Within the collection, it is possible to find germplasms that present these characteristics. However, there are also accessions with secondary colors of G1 that present high yields (Ecu-27508, Ecu-670 and Ecu-751) and plant heights of less than 1 m, which coincides with the findings of De la Cruz [60], who identified two Peruvian ecotypes with desirable characteristics related to production and adaptation, the most prominent characteristic being the presence of a secondary color in the seed.
Based on the discussion above, there is a need to revalue this type of germplasm and promote changes in food preferences since color does not affect nutritional quality, as demonstrated by Gross et al. [50], who evaluated more than 300 genotypes, identifying that the protein range varies from 41 to 51% and that the oil range varies from 14 to 24%, which are high values compared to those of other pulses of mass consumption.
Finally, in Ecuador, the improved tarwi varieties originate from Peruvian parents characterized by being early varieties, i.e., being 167 to 225 days old at harvest, depending on the conditions in which they are developed [33,51,52]. Such characteristics can also be found in the national collection of tarwi. However, the harvest of these materials is progressive as the lateral branches reach maturity last, i.e., a limiting factor in the mechanization of the harvesting process until further breeding improves this trait. According to Peralta [29,33], 100% of producers prefer early varieties, i.e., those that are less than 7 months old at harvest. However, some farmers would like to continue maintaining local or traditional heirloom landraces since they are part of their culture and food heritage.
The maps generated from the ecogeographic and morphological data of 173 tarwi accessions allowed us to determine that the areas where there is high ecogeographic diversity do not necessarily possess high morphological diversity. According to Parra-Quijano et al. [17], the ecogeographic diversity map represents the adaptive scenarios where the accessions or collection sites come from, which implies the use of abiotic-type environmental characteristics.
The cells with high ecogeographic diversity are sites that present a variety of ecosystems because of the influence of the Andes Mountain Range, hydrographic basins, inter-Andean valleys, and life zones. What is interesting about these territories is that at the Cotopaxi level there are few cells with high eco-geographical diversity, but also a greater number of cells with high morphological diversity, contrary to what occurs at the Chimborazo level. According to Tapia [7], these climatic, edaphic and geophysical conditions contribute to the development over time of significant variability and diversity.
Loja is one of the provinces with an extraordinary diversity of ecosystems (22) and a variety of taxonomic groups between flora and fauna, with wild genetic diversity present in forests as part of its agrobiodiversity [12,33]. This variability of ecosystems supports the existence of areas with a high morphological variability of tarwi, which would be a response to the presence of tarwi with distinctive characteristics, such as flower color. For example, the presence of white-flowered tarwi (unique within the national territory) stands out, which is not necessarily linked to grain consumption, but rather to cultural roots, since the flowers are used as ornaments for churches [23].
At the south-central level of the country, the production of the Andino 450 variety prevails and in a few territories the native varieties [21] prevail where the producers allocate about one hectare to the production of tarwi, of which 82% is destined for sale, 8% is for consumption and the rest is grown for sowing seeds; however, this does not supply the national market [66], so the identification of these microcenters of ecogeographic diversity could respond to the adaptation processes of the species and the possibility of establishing strategies for both production and conservation in situ, as well as the establishment of public policies that would allow for better planning of the country’s production.

5. Conclusions

  • Tarwi variability is represented by productivity-related characteristics such as plant size and yield, which is related to the number of pods per plant, seeds per pod and seed weight. Furthermore, although the percentage of seeds with secondary colors is low, this characteristic also suggests the presence of genetic variability, which can be explained by the degree of cross-pollination, the genetic flow and the management by farmers of their seeds.
  • The present study successfully identified promising materials for genetic improvement purposes. The productive and nutritional potential of the crop are options for strengthening the food security and sovereignty of the Andean peoples. Hence, it is necessary to continue work on germplasm evaluation, crop management, traditional uses and innovation, and improving productivity levels and quality while meeting national and international demands.
  • The development of research that leads to knowledge of the variability between and within a population is vital to strengthen in situ and ex situ conservation processes and promote regional strategies that encourage the consumption of lupine with its different shapes and colors.
  • There is a positive correlation between morphological and ecogeographic data but there is a low association, which implies that the morphological diversity of tarwi may or may not be present in homogeneous or heterogeneous agro-ecosystems. This is also related to the fact that tarwi, being a rustic crop, can adapt to different environmental conditions.

Author Contributions

Conceptualization, D.C.-F. and C.T.B.; design of the study and supervision, D.C.-F., M.R.M.-L., A.M.D.R. and C.T.B.; collection of materials and maintenance of the field experiment, D.C.-F. and C.T.B.; data acquisition, D.C.-F.; data curation and statistical analysis, D.C.-F. and C.T.B.; interpretation of results and drafting of the first manuscript, D.C.-F., M.R.M.-L., A.M.D.R. and C.T.B.; writing, review and final editing, D.C.-F., M.R.M.-L., A.M.D.R., C.T.B. and M.S. All authors have read and agreed to the published version of the manuscript.

Funding

Field experiments etc. in Ecuador—own funds. Publication finding provided by the Spanish National Research Council (CSIC) and Galician Innovation Agency (GAIN) grant IN607A2021/03.

Institutional Review Board Statement

Not applicable.

Informed Consent Statement

Not applicable.

Data Availability Statement

Not applicable; a review of research from the scientific literature has been conducted.

Acknowledgments

Acknowledgements go to INIAP and the Santiago de Compostela University for technical advice, as well as to Universidad Técnica del Norte for the academic support.

Conflicts of Interest

The authors declare no conflict of interest.

References

  1. Hondelmann, W. The lupin ancient and modern crop plant. Theor. Appl. Genet. 1984, 68, 1–9. [Google Scholar] [CrossRef]
  2. Mujica, A. Investigación y Producción del Tarwi (Lupinus mutabilis Sweet.) en el Perú; INIAA, PICA: Puno, Peru, 1990. [Google Scholar]
  3. Jacobsen, S.-E.; Mujica, A. Chapter 28. El tarwi (Lupinus mutabilis Sweet) y sus parientes silvestres. In Botánica Económica de los Andes Centrales; Moraes, R.M., Øllgaard, B., Kvist, L.P., Borchsenius, F., Balslev, H., Eds.; Universidad Mayor de San Andrés: La Paz, Bolivia, 2006; pp. 458–482. [Google Scholar]
  4. Caicedo, V.C.; Peralta, I.E. Zonificación potencial, sistemas de producción y procesamiento artesanal del chocho (Lupinus mutabilis Sweet) en Ecuador. Quito, Ecuador: INIAP, Estación Experimental Santa Catalina. Programa Nacional de Leguminosas. Boletín Técnico 2000, 89, 134p. Available online: https://repositorio.iniap.gob.ec/bitstream/41000/441/4/iniapscbt89.pdf (accessed on 24 March 2019).
  5. Blanco, G.O. Genetic variability of tarwi (Lupinus mutabilis). In Agricultural and Nutritional Aspects of Lupines, Proceedings of the 1st International Lupine Workshop, Lima-Cuzco, Peru, 12–21 April 1980; Gross, R., Bunting, E.S., Eds.; Deutsche Gesellschaft für Technische Zusammenarbeit (GTZ): Eschborn, Germany, 1982; pp. 33–49. [Google Scholar]
  6. Jacobsen, S.-E.; Mujica, A. Geographical distribution of the Andean lupin (Lupinus mutabilis Sweet). Plant Genet. Resour. Newsl. 2008, 155, 1–8. [Google Scholar]
  7. Tapia, M.E. El Tarwi, Lupino Andino. Tarwi, Tauri o Chocho (Lupinus mutabilis Sweet), 1st ed.; Corporación Gráfica Universal SAC: Lima, Peru, 2015; 108p, Available online: http://fadvamerica.org/wp-content/uploads/2017/04/TARWI-espanol.pdf (accessed on 12 February 2018).
  8. Mamani, P.; Calisaya, J.; Vallejos, J.; Gandarillas, A. Revalorizando el Tarwi. Una alternativa para promover la resiliencia de los sistemas productivos andinos y la mejora de la seguridad alimentaria y la economía local. In Fundación PROINPA. Informe Compendio 2011–2014; PROINPA: Cochabamba, Bolivia, 2015; pp. 12–19. Available online: https://www.proinpa.org/publico/Informe_compendio_2011_2014/tarwi.pdf (accessed on 12 February 2018).
  9. Tapia, M.E.; Fries, A.M. Guía de Campo de los Cultivos Andinos. FAO: ANPE-Peru. 2007. Available online: https://d1wqtxts1xzle7.cloudfront.net/55761746/Guia_de_campo_de_los_cultivos_andinos-with-cover-page-v2.pdf?Expires=1635346281&Signature=RxY1BunsygvL6wUdTPqcFq0UVsjdmKHdN2VjDOR6vOlTkZETi8z8R9pWIGAaFzuWlbLd-eGPIE60AqubsKfUnLd7pSaSHIFTsD5m4GiwWYHMHAfFSlQytbgDNdN5DZliMvhC1GR7lRH42mhR8~8mJSCWA2TvEnnQkk3TXaJKybtXW68FD1py3dlbE8ley3aPe1C0GU1C5MtCpS79V27Wf99Y7Qg8ZKO5Bj2vGJbXdWFEFfgaw72xR70BWxIvYw5nImPiYSLuPcFv77pi-2yxWgXPTjp~iPPXML1oHd8-RLm5DddIazCak16YGfsK5D-elTW~UNG7iAl8aiJxk6vo2g__&Key-Pair-Id=APKAJLOHF5GGSLRBV4ZA (accessed on 24 March 2019).
  10. Aquino, V.; Camarena, F.; Julca, A.; Jiménez, J. Caracterización multivariada de fincas productoras de tarwi (Lupinus mutabilis Sweet) del Valle del Mantaro, Perú. Sci. Agropecu. 2018, 9, 269–279. [Google Scholar] [CrossRef]
  11. Gross, R. El cultivo y la utilización del tarwi. In Producción y Protección Vegetal; Estudio FAO: Rome, Italy, 1982; Volume 36, ISBN 9253011971. [Google Scholar]
  12. Aguirre, A.; Aguirre, N.; Muñoz, J. Biodiversidad de la provincia de Loja, Ecuador. Arnaldoa 2017, 24, 523–542. Available online: http://www.scielo.org.pe/pdf/arnal/v24n2/a06v24n2.pdf (accessed on 24 March 2019). [CrossRef] [Green Version]
  13. Lezcano Rivero, J.L. Genetica y mejoramiento de cultivos Altoandinos: Quinua, kañihua, tarwi, kiwicha, papa amarga, olluco, ashua y oca. In Programa Interinstitucional de Waru Waru. Convenio: INADE/PELT-COTESU; Convenio, INADE/PELT-COTESU, Producciones CIMA, PIWA: Puno, Peru, 1994; 459p. [Google Scholar]
  14. Rivera, M.; Pinzón, J.; Caicedo, C.; Murillo, A.; Mazón, N.; Peralta, E. Catálogo del banco de germoplasma del chocho (Lupinus mutabilis Sweet) y otras especies de Lupinus; INIAP: Quito, Ecuador, 1998; 111p, Available online: https://repositorio.iniap.gob.ec/bitstream/41000/511/1/iniapsci160.pdf (accessed on 12 February 2018).
  15. Rojas, P.M. Efecto de la Incorporación de Residuos de Cosecha de tarwi (Lupinus mutabilis Sweet) en Sistemas Marginales de Producción de Papa de Regiones Andinas Semiáridas de Cochapamba, Bolivia. Revista Latinoamericana de la Papa. 2018, Volume 22, pp. 55–65. Available online: https://dialnet.unirioja.es/servlet/articulo?codigo=7350075 (accessed on 24 March 2019).
  16. Solís-Neffa, V.G. Geographic patterns of morphological variation in Turnera sidoides subsp. pinnatifi (Turneraceae). Plant Syst. Evol. 2010, 284, 231–253. [Google Scholar] [CrossRef]
  17. Parra-Quijano, M.; Torres, E.; Iriondo, J.; López, F. Manual de Usuario Herramientas CAPFITOGEN. In Tratado Internacional de Recursos Fitogenéticos para la Alimentación y la Agricultura; FAO: Rome, Italy, 2015. [Google Scholar]
  18. Monteros-Altamirano, A.; Tacán, M.; Peña, G.; Tapia, C.; Paredes, N.; Lima, L. Guía Para el Manejo de los Recursos Fitogenéticos en Ecuador: Protocolos; Publicación Miscelánea No. 432; INIAP: Mejía, Ecuador, 2018; ISBN 978-9942-22-262-6. Available online: http://repositorio.iniap.gob.ec/handle/41000/4889 (accessed on 12 February 2018).
  19. Instituto Nacional de Estadísticas y Censos (INEC). III Censo Nacional Agropecuario. Resultados Nacionales. Ecuador. 2020. Available online: https://www.ecuadorencifras.gob.ec/documentos/web-inec/Estadisticas_agropecuarias/CNA/Tomo_CNA.pdf (accessed on 24 March 2019).
  20. Peralta, E.; Mazón, N.; Murillo, A.; Rivera, M.; Rodríguez, D.; Lomas, L.; Monar, C. Manual agríCola de Granos Andinos: Chocho, Quinua, Amaranto y Ataco. Cultivos, Variedades y Costos de Producción, 3rd ed.; INIAP: Quito, Ecuador, 2012; Volume 69, pp. 1–78. Available online: https://es.slideshare.net/yinath/manual-agricolagranosandinos2012 (accessed on 24 March 2019).
  21. Marquez, C. La siembra de chocho es más rentable. Rev. Líderes. 2016, 25. Available online: https://www.revistalideres.ec/lideres/siembra-chocho-produccion-chimborazo.html (accessed on 13 September 2018).
  22. Mazón, N. El chocho o Tarwi Como Recurso genéTico de la Región Andina [Online Seminar]; Interaprendizaje-IPDRS: Quito, Ecuador, 29 October 2018; Available online: https://www.sudamericarural.org/images/2018/Documentos2018/MEMORIA_CAMINOS_DEL_TARWI_14.12.18_web.pdf (accessed on 27 December 2019).
  23. Ortega-David, E.; Rodríguez, A.; David, A.; Zamora-Burbano, A. Caracterización de semillas de Lupinus mutabilis sembrado en los andes de Colombia. Acta Agron. 2010, 59, 111–118. Available online: https://revistas.unal.edu.co/index.php/acta_agronomica/article/view/14094 (accessed on 24 March 2019).
  24. Villacrés, E.; Navarrete, M.; Lucero, O.; Espín, S.; García, E. Evaluación del rendimiento, características físico-químicas y nutraceúticas del aceite de chocho (Lupinus mutabilis Sweet). Rev. Tecnol.-ESPOL 2010, 23, 57–62. Available online: https://revistas.unitru.edu.pe/index.php/scientiaagrop/article/view/2313/2200 (accessed on 13 September 2018).
  25. Garay, O. El Tarwi Alternative Para la Lucha Contra al Desnutrición Infantil. Serie Manual N°1. Instituto Nacional de Innovación Agraria—INIA. Perú. 2015. Available online: https://repositorio.inia.gob.pe/handle/20.500.12955/731 (accessed on 26 June 2023).
  26. Carhuallanqui, S.; Ccora, A.; Vilcapoma, L.; Casas, J. Caracterización del tarwi (Lupinus mutabilis) y diseño de un prototipo de desamargado para la reducción de alcaloides. J. Agric. Food Sci. 2022, 1, 53–60. Available online: https://revistas.uncp.edu.pe/index.php/jafs/article/view/1441 (accessed on 12 February 2018).
  27. Cowling, W.; Tarr, A. Effect of genotype and environment on seed quality in sweet narrow-leafed lupin (Lupinus angustifolius L.). Aust. J. Agric. Res. 2004, 55, 745–751. [Google Scholar] [CrossRef]
  28. Velásquez, J. Evaluación Agronómica y Morfológica de 283 Entradas de Lupinos (Lupinus spp.) del Banco de Germoplasma del INIAP-Ecuador. Ing. Agr. Pregrade Thesis, Facultad de Ciencias Agropecuarias, Universidad de Cuenca, Cuenca, Ecuador, 1993; 100p. [Google Scholar]
  29. Peralta, E. El Chocho en Ecuador. “Estado de Arte”. PRONALEG-GA; INIAP: Quito, Ecuador, 2016; 50p, Available online: http://repositorio.iniap.gob.ec/bitstream/41000/3938/1/iniapscdpCD99.pdf (accessed on 12 February 2018).
  30. Villacrés, E.; Peralta, I.; Cuadrado, L.; Revelo, J.; Addo, S.; Aldaz Berrones, R. Propiedades y Aplicaciones de los Alcaloides del Chocho (Lupinus mutabilis Sweet). INIAP ESPOCH SENACYT. Editorial Grafistas, Quito, Ecuador. 2009; 20p, Available online: https://repositorio.iniap.gob.ec/bitstream/41000/453/4/iniapscbt133.pdf (accessed on 24 March 2019).
  31. Guaytarilla, P.; Falconí, C. Selección por arquitectura de la planta y resistencia a la Antracnosis de 7 genotipos de chocho (Lupinus mutabilis). IX Congreso de Ciencia y Tecnología ESPE. 2014, pp. 63–70. Available online: http://ciencia.espe.edu.ec/wp-content/uploads/2014/04/MEMORIA-CONGRESO-CT-2014.pdf (accessed on 24 March 2019).
  32. González, M.; Bosland, P. Strategies for stemming genetc erosion of Capsicum germoplas, in the Americas. Diversity 1991, 7, 52–53. Available online: http://www.redalyc.org/articulo.oa?id=231125817001 (accessed on 12 February 2018).
  33. Peralta, E.; Mazón, N.; Murillo, A.; Villacrés, E.; Rivera, M. Catálogo de Variedades Mejoradas de Granos Andinos: Chocho, Quinua, Amaranto y Sangorache, Para la Sierra Ecuatoriana, 3rd ed.; Programa de Leguminosas y Granos Andinos. Estación Experimental Santa Catalina, INIAP: Quito, Ecuador, 2013; Volume 151, 28p, Available online: https://repositorio.iniap.gob.ec/bitstream/41000/2713/1/iniapscpm151%283%29.pdf (accessed on 13 September 2018).
  34. Ministerio de Agricultura, Ganadería, Acuacultura y Pesca [MAG]. Zonificación Agroecológica econóMica del Cultivo de Chocho (Lupinus mutabilis) en Ecuador Continental. Quito, Ecuador. 2014; 12p, Available online: https://fliphtml5.com/ijia/ligk/basic (accessed on 13 September 2018).
  35. Blanco, F. Caracterización Morfológica del Ecotipo Local de Tarwi (Lupinus mutabilis) en el Municipio de Carabuco del Departamento de la Paz. Ing. Agr. Pregade Thesis. Facultad de Agronomía. Universidad San Andrés. La Paz-Bolivia. 2011. Available online: https://repositorio.umsa.bo/bitstream/handle/123456789/10245/TD-1541.pdf?sequence=1&isAllowed=y (accessed on 12 February 2018).
  36. International Board for Plant Genetic Resources [IBPGR]. Descriptores de Lupinos. Roma. Available online: https://www.bioversityinternational.org/fileadmin/bioversity/publications/Web_version/103/ch1.htm (accessed on 15 May 2017).
  37. Di Rienzo, J.A.; Casanoves, F.; Balzarini, M.G.; Gonzalez, L.; Tablada, M.; Robledo, C.W. InfoStat. Available online: http://www.infostat.com.ar/ (accessed on 20 June 2018).
  38. Ward, J.H., Jr. Hierarchical grouping to optimize an objective function. J. Am. Stat. Assoc. 1963, 58, 236–244. [Google Scholar] [CrossRef]
  39. Gower, J. A comparison of some methods of cluster analysis. Biometrics 1967, 23, 623–627. [Google Scholar] [CrossRef] [PubMed]
  40. Fisher, R.A. The Use of Multiple Measurements in Taxonomic Problems. Ann. Eugenic. 1936, 7, 179–188. Available online: https://onlinelibrary.wiley.com/doi/pdf/10.1111/j.1469-1809.1936.tb02137.x (accessed on 13 September 2018). [CrossRef]
  41. Franco, T.L.; Hidalgo, R. Análisis Estadístico de Datos de Caracterización Morfológica de Recursos Fitogenéticos; Instituto Internacional de Recursos Fitogenéticos (IPGRI): Cali, Colombia, 2003; Volume 8, 92p, ISBN 92-9043-543-7. Available online: https://www.bioversityinternational.org/fileadmin/_migrated/uploads/tx_news/An%C3%A1lisis_estad%C3%ADstico_de_datos_de_caracterizaci%C3%B3n_morfol%C3%B3gica_de_recursos_fitogen%C3%A9ticos_894.pdf (accessed on 12 February 2018).
  42. Balzarini, M.G.; González, L.; Tablada, M.; Casanoves, F.; Di Rienzo, J.A.; Robledo, C.W. Infostat Manual del Usuario; Editorial Brujas: Córdoba, Argentina, 2008; 335p, Available online: https://www.researchgate.net/profile/Fernando-Casanoves/publication/319875343_Manual_del_usuario/links/5e2ee26992851c9af7280cfa/Manual-del-usuario.pdf (accessed on 12 February 2018).
  43. Wilcox, A.R. Indices of qualitative variation and political measurement. Western. Polit. Quart. 1973, 26, 325–343. Available online: https://digital.library.unt.edu/ark:/67531/metadc864459/m2/1/high_res_d/4167340.pdf (accessed on 12 February 2018). [CrossRef]
  44. Leakey, C.L.A. Genotypic and phenotypic markers in common bean. In Genetic Resources of Phaseolus Beans; Gepts, P., Ed.; Kluwer: Dordrecht, The Netherlands, 1988; pp. 245–327. [Google Scholar] [CrossRef]
  45. Galek, R.G.; Zalewski, D.; Kozak, B.; Sawicka-Sienkiewicz, E. Pheno-morphological and agronomic diversity in a collection of wild and domesticated species of the genus Lupinus. Turk. J. Field Crops 2015, 20, 43–48. [Google Scholar] [CrossRef] [Green Version]
  46. Martín, L.; López, R.; Haro, A. Análisis de las relaciones entre caracteres de interés agronómico en Lupinus albus L. Rev. Pastos 1985, 15, 75–85. Available online: http://polired.upm.es/index.php/pastos/article/view/497/1043 (accessed on 13 September 2018).
  47. Lema, M.; Lindner, R. Caracterización y evaluación de poblaciones de Lupinus hispanicus de Galicia. Congreso de mejora genética de plantas. Almería. Actas Hortic. 2002, 34, 365–369. Available online: https://digital.csic.es/bitstream/10261/163757/1/Lema_Caracterizacion_evaluacion...pdf (accessed on 20 June 2018).
  48. Martínez-Castillo, J.; May-Pa, F.; Zizumbo-Villareal, D.; García-Martín, P. Diversidad intraespecífica del ib (Phaseolus lunatus L.) en la agricultura tradicional de la península de Yucatán, México. In Manejo de la Diversidad de los Cultivos en los Agroecosistemas Tradicionales; Chávez-Servia, J.L., Tuxill, J., Jarvis, D.I., Eds.; Instituto Internacional de Recursos Fitogenéticos: Cali, Colombia; IPGRI: Rome Italy, 2004; pp. 26–35. ISBN 92-9043-519-4. Available online: https://www.bioversityinternational.org/fileadmin/_migrated/uploads/tx_news/Manejo_de_la_diversidad_cultivada_en_los_agroecosistemas_tradicionales___Managing_crop_diversity_in_traditional_agroecosystems_785.pdf (accessed on 24 March 2019).
  49. Dugje, I.; Omoigui, L.; Ekeleme, F.; Kamara, A.; Ajeigbe, H. Farmers Guide to Cowpea Production in West Africa; International Institute of Tropical Agriculture [IITA]: Ibadan, Nigeria, 2009; 19p, ISBN 978-131-332-3. Available online: https://citeseerx.ist.psu.edu/viewdoc/download?doi=10.1.1.433.2839&rep=rep1&type=pdf (accessed on 13 September 2018).
  50. Gross, R.; Von Baer, E.; Koch, F.; Marquard, R.; Trugo, L.; Wink, M. Chemical composition of a new variety of the Andean Lupin (Lupinus mutabilis cv. Inti) with low-alkaloid content. J. Food Compost. Anal. 1998, 1, 353–361. [Google Scholar] [CrossRef]
  51. Caicedo, C.; Murillo, A.; Pinzón, J.; Peralta, E.; Rivera, M. INIAP 450 Andino. Variedad de chocho (Lupinus mutabilis Sweet) FUNDACYT P-BID-206. Quito, Ecuador. Pleg. Divulg. 2010, 169, 1–65. Available online: https://repositorio.iniap.gob.ec/bitstream/41000/2584/1/iniapscpd169.pdf (accessed on 24 March 2019).
  52. Peralta, E.; Rivera, M.; Murillo, A.; Mazón, N.; Monar, C. INIAP 451 Guaranguito. Nueva variedad de chocho para la provincia de Bolívar. Programa Nacional de Leguminosas y Granos Andinos. Estación Experimental Santa Catalina. Quito-Ecuador. Bol. Divulg. 2010, 382, 1–4. Available online: https://repositorio.iniap.gob.ec/jspui/bitstream/41000/330/4/iniapscbd382.pdf (accessed on 24 March 2019).
  53. Almeida Cuastumal, J.L. Evaluación del Rendimiento de Cuatro Ecotipos de Chocho (Lupinus mutabilis) en el Centro Experimental San Francisco, en Huaca-Carchi. Ing. Agr. Pregrade Thesis. Universidad Politécnica Estatal del Carchi. Tulcán-Ecuador. 2015. Available online: http://repositorio.upec.edu.ec/bitstream/123456789/355/1/252%20Evaluaci%c3%b3n%20del%20rendimiento%20de%20cuatro%20ecotipos%20de%20chocho%20%28Lupinus%20mutabilis%29%2c%20en%20el%20Centro%20Experimental%20San%20Francisco.pdf (accessed on 20 June 2018).
  54. Estrella, E. El Plan de América. In Etnohistoria de los Alimentos Borígenes del Ecuador, 3rd ed.; FUNDACYT: Quito, Ecuador, 1998; 257p. [Google Scholar]
  55. Padilla, S. Manejo Agroforestal Andino. In Proyecto FAO-Holanda “Desarrollo Forestal Participativo de los Andes”; E. P. Centro de Impresión: Quito, Ecuador, 1995; 262p, Available online: http://www.asocam.org/sites/default/files/publicaciones/files/acac259f389f9bab78ffd1e9dc063fb0.pdf (accessed on 13 September 2018).
  56. Anastasova, N.; Ivanov, V.; Gevov, N.; Butnariu, M. Morphological and biological characteristics of white lupine cultivars (Lupinus albus L.). Rom. Agric. Res. 2018, 35, 109–123. Available online: https://www.incda-fundulea.ro/rar/nr35/rar35.15.pdf (accessed on 20 June 2018).
  57. Timmerman-Vaughan, G.; Mills, A.; Frew, T.J.; Butler, R.C.; McCallum, J.A.; Murray, S.; Whitfield, C.P.; Russell, A.C.; Wilson, D.R. Linkage Mapping of QTL for Seed Yield, Yield Components, and Developmental Traits in Pea. Crop Sci. 2005, 45, 1336–1344. [Google Scholar] [CrossRef]
  58. Ligarreto, G.A. Caracterización morfológica de germoplasma. Estudios de casos. Caso 2: Análisis de la variabilidad genética en frijol. In Análisis Estadístico de Datos de Caracterización Morfológica de Recursos Fitogenéticos; Franco, T., Hidalgo, R., Eds.; IPGRI: Roma, Italy, 2003; Volume 8, pp. 40–49. [Google Scholar]
  59. Santalla, M.; González, A.M.; Lema, M.; Rodiño, A.P.; Monteagudo, A.B.; De Ron, A.M. Improvement of large-seeded common bean cultivars under sustainable cropping systems in Spain. Euphytica 2005, 142, 85–95. [Google Scholar] [CrossRef]
  60. De la Cruz, N. Caracterización fenolÓgica y de Rendimiento Preliminar de Ecotipos de Tarwi (Lupinus mutabilis Sweet), Bajo Condiciones del Callejón de Haylas-Ancash. Ing. Agr. Pregade Thesis, Facultad de Agronomía. Universidad Nacional Agraria La Molina. Lima, Peru. 2018. Available online: http://repositorio.lamolina.edu.pe/handle/UNALM/3727 (accessed on 20 June 2018).
  61. Chirinos-Arias, M.; Jiménez, J.; Vilca-Machaca, L. Análisis de la variabilidad genética entre treinta accesiones de tarwi (Lupinus mutabilis Sweet) usando marcadores moleculares ISSR. Sci. Agropecu. 2015, 6, 17–30. [Google Scholar] [CrossRef] [Green Version]
  62. Gulisano, A.; Alves, S.; Martins, J.N.; Trindade, L.M. Genetics and breeding of Lupinus mutabilis: An emerging protein crop. Front. Plant Sci. 2019, 10, 1–13. [Google Scholar] [CrossRef] [PubMed]
  63. Aniszewski, T.; Kupari, M.H.; Leinonen, A.J. Seed number, seed size and seed diversity in Washington lupin (Lupins polyphyllus Lind). Ann. Bot. 2001, 87, 77–82. [Google Scholar] [CrossRef] [Green Version]
  64. Clements, J.C.; Sweetingham, M.S.; Smith, L.; Francis, G.; Thomas, G.; Sipsas, S. Crop improvement in Lupinus mutabilis for Australian agriculture—progress and prospects. In Lupins for Health and Wealth, Proceedings of the 12th International Lupin Conference, Canterbury, New Zealand, 14–18 September 2008; Palta, J.A., Berger, J.B., Eds.; International Lupin Association: Fremantle, Australia, 2008; pp. 244–250. ISBN 0864761538. [Google Scholar]
  65. Ochoa-Zavala, M.; Suárez-Montes, P.; Chávez-Pesqueira, M.; López-Cobos, D.; Figueredo, C.; David, A.; Raquel, H.; Lazo, Y.; Sibile, S.; Villanueva, R.; et al. Diferencias en morfología y visitantes florales entre Lupinus multabilis y Lupinus aff. Ballianus en la microcuenca de Warmiraga, Perú. In Manejo de Biodiversidad y Evolución Dirigida por las Culturas del Nuevo Mundo. Domesticación en el Continente Americano; Appendix 3; Universidad Nacional Agraria la Molina (UNALM) del Perú: Lima, Perú, 2016; Volume 1, pp. 463–479. ISBN 978-612-4147-59-3. [Google Scholar]
  66. Mazón, N. El chocho o tarwi como recurso genético de la región andina [Seminario online]. In Los Caminos del tarwi y la Integración Andina: Bolivia, Perú y Ecuador; Mercado, G., Ed.; Ipdrs, HIVOS y Cipca Altiplano: La Paz, Bolivia, 2018; Available online: https://www.researchgate.net/publication/329842526_Los_caminos_del_tarwi_y_la_integracion_andina_Bolivia_Peru_y_Ecuador (accessed on 13 September 2018).
Figure 1. Distribution of 173 tarwi accessions collected in several ecoregions in the Andean zone of Ecuador.
Agronomy 13 02064 g001
Figure 2. Dendrogram obtained via analysis of hierarchical clusters (Ward’s method [38] and Gower’s similarity distance [39]) for qualitative and quantitative variables in 173 accessions of tarwi (Lupinus mutabilis).
Agronomy 13 02064 g002
Figure 3. Frequencies of the accessions of the tarwi collection, according to the status of the qualitative characteristics with the highest discriminating power between the groups formed.
Agronomy 13 02064 g003
Figure 4. Phenotypic variability of tarwi in the national collection of the INIAP Germplasm Bank.
Agronomy 13 02064 g004aAgronomy 13 02064 g004b
Figure 5. Map of the ecogeographic diversity of tarwi within Ecuador.
Agronomy 13 02064 g005
Figure 6. Phenotypic diversity map of tarwi cultivation.
Agronomy 13 02064 g006
Table 1. Tarwi accessions conserved and collected in the INIAP Germplasm Bank.
ProvinceNo. of Accessions in the Germplasm Bank *No. of Accessions in the Germplasm Bank **TotalPercentageAltitudinal
Range
(m a.s.l.)
Carchi8142212.712597–3172
Imbabura4595.202204–3057
Pichincha74116.352690–3500
Cotopaxi12203218.492538–3507
Tungurahua7111810.402600–3390
Chimborazo 40307040.462380–3600
Bolívar 1-10.572460–2837
Azuay-221.152450–2918
Loja5384.621900–2900
Total8489173100.00
Germplasm collection * period: 1975–1999; ** 2014–2015.
Table 2. Qualitative and quantitative descriptors used to characterize the 173 accessions of tarwi studied.
Qualitative DescriptorsQuantitative Descriptors
CodeCharacterStateCodeCharacter
SFStem formation0. Main stem not prominent
1. Prominent main stem
PHPlant height (main axis) (cm)
PRProcumbence resistance3. Little
5. Medium
7. Considerable
DFFDays to first flower
PVPlant vigor 3. Poor
5. Not vigorous
7. Vigorous
DMDays to maturity
PAdLPubescence of adaxial side of leaflet 0. Absent
1. Present
PLPeduncle length (cm)
PAbLPubescence of abaxial side of leaflet 0. Absent
1. Present
ALIAverage length of inflorescence (cm)
CFBColor of flower bud1. White
2. Yellow
3. Orange
4. Rosa
5. Red
6. Green
7. Blue
8. Violet
9. Brown
PdLPod length (cm)
CWPColor of wing petalsPdWPod width (cm)
CKPColor of keel petalsNPSNo. of pods main stem−1
CMBColor of the marginal band on the standard petalNSPNo. of seeds pod−1 (on main stem)
PPPod pubescence0. Absent
3. Little
5. Medium
7. Abundant
SLSeed length (cm)
DPDehiscence of pod0. Indehiscent
1. Dehiscent
SWSeed width (cm)
SSSeed shape1. Spherical
2. Flattened or lenticular spherical
3. Oval
4. Oval flattened
5. Square
6. Square flattened
W100Weight of 100 seeds (g plant−1)
PSCPredominant seed color1. White
2. Yellow
3. Cream
4. Light brown
5. Black
6. Brown
7. Grey
8. Dark brown
9. Other
YGPYield (g plant−1)
SSCSecondary seed color
DSCDistribution of the secondary seed color0. Absent
1. Crescent
2. Brow-shaped
3. On flattened side
4. Dotted
5. Streaked
6. Mottled
7. Spotted crescent
8. Streaked brows
9. Absent
10. Stained
11. Dots on flattened side
Table 3. Average, standard deviation (SD), coefficient of variation (CV), and minimum and maximum of 13 quantitative characteristics evaluated in the national collection of 173 tarwi accessions.
CodeCharacterAverageSDCV (%)Minimum ValueMaximum Value
YGPYield of 100 seeds (g plant−1)103.7881.3878.4212.75499.50
NPSNo. of pods main stem−19.512.9831.323.5018.40
PHPlant height (main axis) (cm)133.5027.8920.8961.60190.00
ALIAverage length of inflorescence (cm)18.423.6219.679.0029.30
PLPeduncle length (cm)10.371.6215.604.0015.75
PdWPod width (cm)1.610.2515.411.353.30
W100Seed weight (g 100 seed−1)26.033.4313.1812.0033.00
NSPNr. of seeds pod−1 (on main stem)5.050.509.853.336.50
PdLPod length (cm)9.650.919.428.2117.13
DMDays to maturity192.739.094.72178.00206.00
DFFDays to first flower121.662.992.45120.00127.00
SLSeed length (cm)0.990.044.000.771.09
SWSeed width (cm)0.810.033.970.630.89
Table 4. Frequency analysis of the qualitative characteristics of stems, leaves, and flowers in 173 accessions of tarwi.
CodeCharacterCategoryStateOverall
Frequency
Relative Frequency
SFStem formation0Main stem not prominent 148%
1Prominent main stem15992%
PVPlant vigor5Not vigorous1911%
7Vigorous15489%
PRProcumbence resistance3Little9152%
5Medium6739%
7Considerable159%
PAdLPubescence of adaxial side of leaflet 0Absent17098%
1Present32%
PAbLPubescence of abaxial side of leaflet0Absent14886%
1Present2514%
CFBColor of flower bud6Green173100%
CWPColor of wing petals1White42%
7Blue2917%
8Violet14081%
CKPColor of keel petals1White173100%
CMBSColor of the marginal band on the standard petal1White42%
7Blue2917%
8Violet14081%
Table 5. Frequency analysis of the qualitative characteristics of pods and seeds in 173 tarwi accessions.
CodeCharacterClassStateOverall
Frequency
Relative Frequency
DPDehiscence of pod0Indehiscent17299%
1Dehiscent11%
PPPod pubescence7Abundant173100%
SSSeed shape1Spherical32%
2Flattened or lenticular spherical53%
3Oval4224%
4Oval flattened12069%
5Square21%
6Square flattened11%
PSCPredominant seed color1White173100%
SSCSecondary seed color0Absent16093%
4Light brown21%
5Black74%
8Dark brown32%
DSCDistribution of the secondary seed color9Absent 16093%
1Crescent116%
4Dotted21%
Table 6. Number of principal components from criteria of eigenvalues and percentage.
ComponentsEigenvaluePercentage of
Variance
Cumulative
Percentage
14.463434
22.261752
31.371162
41.230972
Table 7. Average values for quantitative characteristics in four groups formed in the tarwi accessions studied.
VariableCV%Group (no. Accessions)p-Value
G1 (33)G2 (26)G3 (79)G4 (35)
PL (cm) 14.09010.60 ± 0.25 b011.96 ± 0.29 c009.95 ± 0.16 a009.90 ± 0.25 a0.0001
ALI (cm)18.52018.42 ± 0.59 a021.42 ± 0.67 b017.98 ± 0.38 a017.35 ± 0.58 a0.0001
PdL (cm)9.42009.57 ± 0.16 a009.92 ± 0.18 a009.59 ± 0.10 a009.66 ± 0.15 a0.4812
PW (cm)15.53001.62 ± 0.04 a001.60 ± 0.05 a001.61 ± 0.03 a001.60 ± 0.04 a0.9825
SL (cm)3.96000.98 ± 0.01 ab000.99 ± 0.01 ab011.00 ± 4.4 b000.98 ± 0.01 a0.1009
SW (cm)3.95000.81 ± 0.01 ab000.81 ± 0.01 ab000.82 ± 3.6 × 10⁻³ b000.80 ± 0.01 a0.1505
PH (cm)15.10120.17 ± 3.51b094.12 ± 3.95 a147.11 ± 2.27 c144.59 ± 3.41 c0.0001
NPS22.85010.53 ± 0.38 b013.90 ± 0.43 c008.17 ± 0.24 a008.31 ± 0.37 a0.0001
NSP9.52005.04 ± 0.08 b004.72 ± 0.09 a005.11 ± 0.05 b005.15 ± 0.08 b0.0021
DFF 1.33122.97 ± 0.28 b127.00 ± 0.32 c120.09 ± 0.18 a120.00 ± 0.27 a0.0001
DM3.47195.82 ± 1.16 b206.00 ± 1.31 c188.63 ± 0.73 a189.20 ± 1.13 a0.0001
YGP (g plant−1)64.68127.41 ± 11.68 b203.52 ± 13.16 c072.42 ± 7.55 a078.20 ± 11.35 a0.0001
W100 (g)13.01025.94 ± 0.59 ab027.58 ± 0.66 b025.91 ± 0.38 a025.26 ± 0.57 a0.0649
Different letters (a, b, c, ab) indicate statistically significant differences (p ≤ 0.005) in Fisher’s test; for variable codes see Table 2.
Table 8. Qualitative characteristics with the highest discriminant value between groups of entries in the tarwi accessions studied.
VariableChi2Coef. (P)Cramer (V)p-Value
CWP173.000.710.58<0.0001
CMBS173.000.710.58<0.0001
SS113.650.630.41<0.0001
SSC41.760.440.25<0.0001
DSC28.770.380.24<0.0001
Variable codes; see Table 2.
Table 9. Wilcox deviation of mode index (MD).
VariableDM Index
G1G2G3G4
CWP0.180.000.000.00
CMBS0.180.000.000.00
SS0.360.550.000.27
SSC0.240.000.000.23
DSC0.270.000.000.26
Variable codes see Table 2.
Disclaimer/Publisher’s Note: The statements, opinions and data contained in all publications are solely those of the individual author(s) and contributor(s) and not of MDPI and/or the editor(s). MDPI and/or the editor(s) disclaim responsibility for any injury to people or property resulting from any ideas, methods, instructions or products referred to in the content.

