
The Impact of Data Envelopment Analysis on Effective Management of Inputs: The Case of Farms Located in the Regional Unit of Pieria
 , , , ,
  ,
, 
Abstract
:1. Introduction
- What is the technical efficiency level of farms cultivating annual plants located in the regional unit of Pieria?
- What are the ways of of effective input management that can be suggested to Pieria’s farmers by interpreting the results of the data envelopment analysis method?
2. Literature Review
3. Materials and Methods
3.1. Technical Efficiency
3.2. Data Envelopment Analysis
Subject to −y i + Υ λ ≥ 0
θ xi − Χ λ ≥ 0
λ ≥ 0
Subject to −yi + Yλ ≥ 0
θxi − Χλ ≥ 0
N1′λ = 1
λ ≥ 0
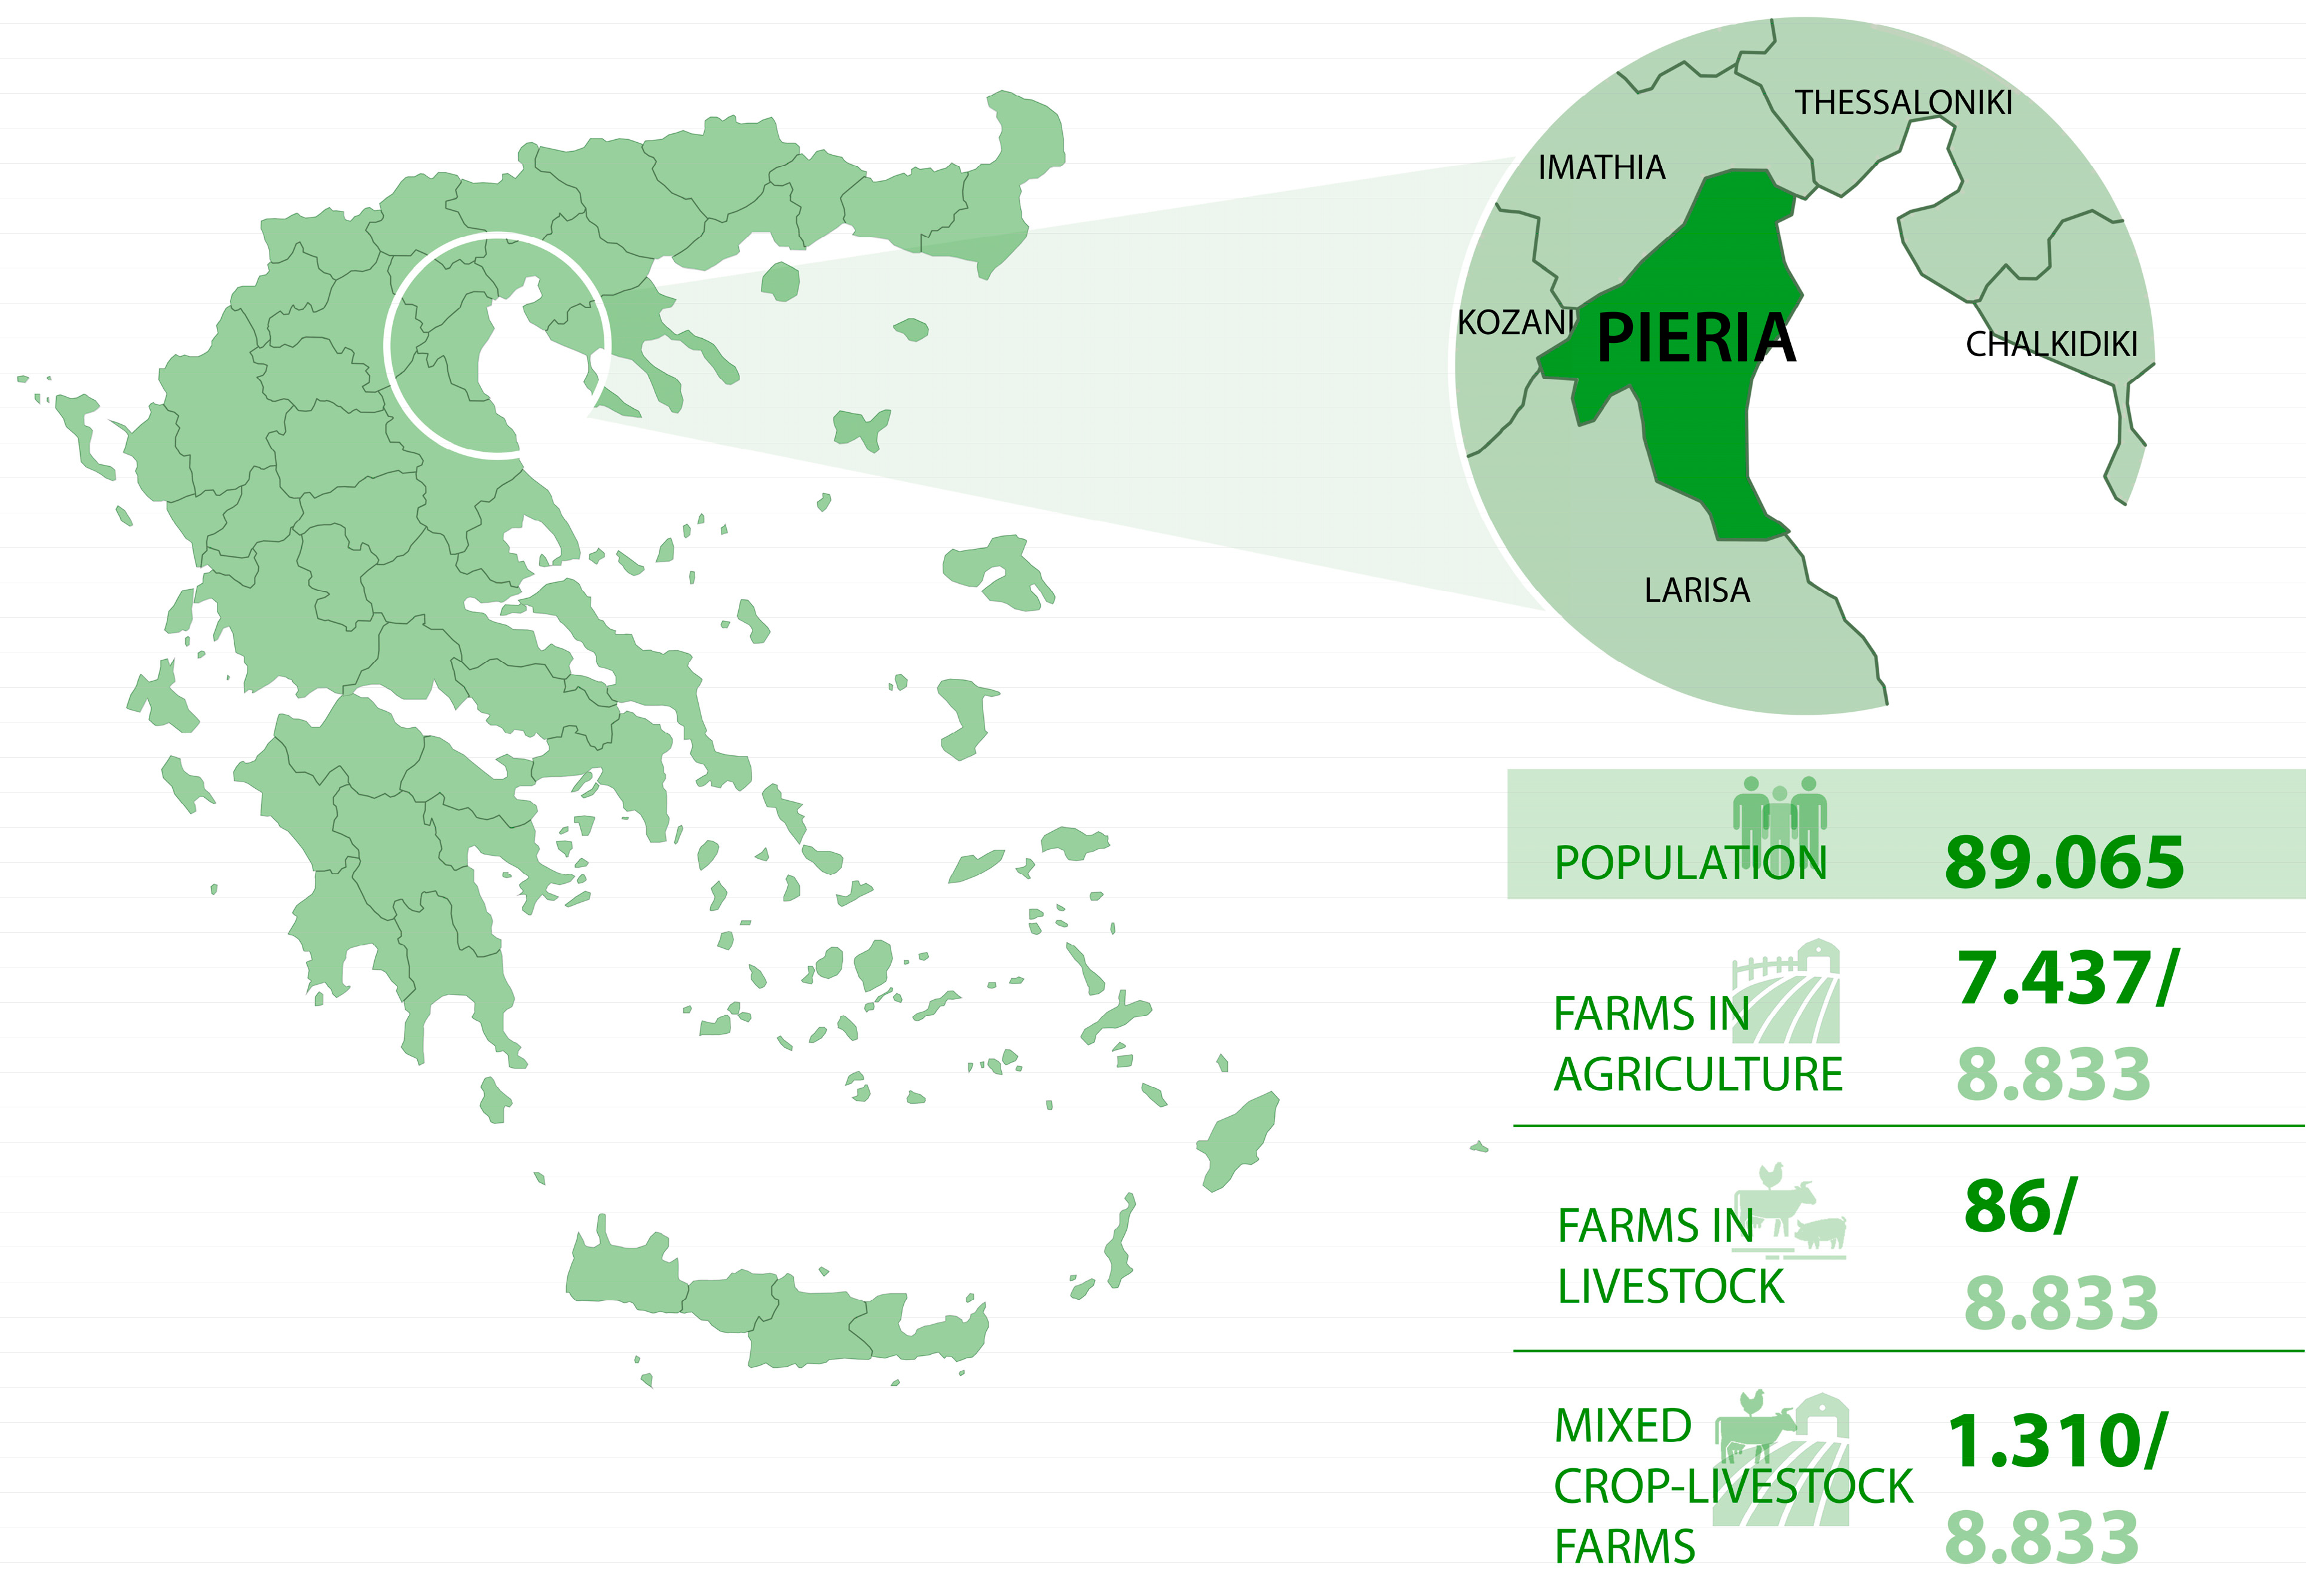
3.3. Study Area
3.4. Farms’ Cultivation Type and Data Access
3.5. Data
4. Results
5. Discussion
6. Conclusions
Author Contributions
Funding
Data Availability Statement
Acknowledgments
Conflicts of Interest
Appendix A

| Firm | Crste | Vrste | Scale | Type of Returns to Scale |
|---|---|---|---|---|
| 1 | 0.982 | 1.000 | 0.982 | irs |
| 2 | 0.716 | 0.732 | 0.978 | irs |
| 3 | 0.566 | 0.61 | 0.927 | drs |
| 4 | 0.228 | 0.422 | 0.54 | irs |
| 5 | 1.000 | 1.000 | 1.000 | - |
| 6 | 0.387 | 1.000 | 0.387 | irs |
| 7 | 0.598 | 0.598 | 0.999 | - |
| 8 | 0.811 | 1.000 | 0.811 | drs |
| 9 | 0.543 | 0.546 | 0.994 | irs |
| 10 | 0.349 | 0.497 | 0.703 | irs |
| 11 | 0.962 | 0.978 | 0.983 | irs |
| 12 | 0.057 | 1.000 | 0.057 | irs |
| 13 | 0.778 | 0.832 | 0.936 | irs |
| 14 | 0.598 | 0.669 | 0.894 | irs |
| 15 | 0.826 | 0.852 | 0.969 | irs |
| 16 | 0.638 | 1.000 | 0.638 | irs |
| 17 | 0.668 | 0.711 | 0.94 | irs |
| 18 | 0.672 | 0.701 | 0.96 | irs |
| 19 | 0.732 | 1.000 | 0.732 | drs |
| 20 | 0.904 | 0.917 | 0.986 | drs |
| 21 | 0.171 | 0.991 | 0.172 | irs |
| 22 | 0.578 | 0.579 | 0.999 | irs |
| 23 | 0.012 | 0.351 | 0.033 | irs |
| 24 | 0.33 | 0.798 | 0.414 | irs |
| 25 | 0.908 | 0.937 | 0.969 | irs |
| 26 | 0.813 | 1.000 | 0.813 | irs |
| 27 | 1.000 | 1.000 | 1.000 | - |
| 28 | 1.000 | 1.000 | 1.000 | - |
| 29 | 0.832 | 0.916 | 0.908 | irs |
| 30 | 0.717 | 0.765 | 0.937 | irs |
| 31 | 0.777 | 0.784 | 0.991 | drs |
| 32 | 0.446 | 0.468 | 0.952 | irs |
| 33 | 0.563 | 0.593 | 0.949 | irs |
| 34 | 1.000 | 1.000 | 1.000 | - |
| 35 | 0.541 | 0.624 | 0.867 | irs |
| 36 | 1.000 | 1.000 | 1.000 | - |
| 37 | 0.309 | 0.51 | 0.607 | irs |
| 38 | 0.278 | 0.872 | 0.318 | irs |
| 39 | 1.000 | 1.000 | 1.000 | - |
| 40 | 0.882 | 0.893 | 0.988 | irs |
| Μean | 0.654 | 0.804 | 0.808 |
References
- Lovell, C.A.K. Production Frontiers and Productive Efficiency. Meas. Product. Effic. Tech. Appl. 1993, 3, 67. [Google Scholar]
- Fried, H.O.; Knox Lovell, C.A.; Schmidt, S.S. The Measurement of Productive Efficiency and Productivity growth; Oxford University Press: Oxford, UK, 2008. [Google Scholar] [CrossRef]
- Kaur, S.; Gupta, P.K. Productive Efficiency Mapping of the Indian Banking System Using Data Envelopment Analysis. Procedia Econ. Financ. 2015, 25, 227–238. [Google Scholar] [CrossRef]
- Theodoridis, A.; Psychoudakis, A. Efficiency measurement in Greek dairy farms: Stochastic frontier vs. data envelopment analysis. Int. J. Econ. Sci. Appl. Res. 2008, 1, 53–67. [Google Scholar]
- Dube, L.; Guveya, E. Technical Efficiency of Smallholder Out-grower Tea (Camellia Sinensis) Farming in Chipinge District of Zimbabwe. Greener J. Agric. Sci. 2014, 4, 368–377. [Google Scholar] [CrossRef] [Green Version]
- Ng’ombe, J.; Kalinda, T. A Stochastic Frontier Analysis of Technical Efficiency of Maize Production Under Minimum Tillage in Zambia. Sustain. Agric. Res. 2015, 4, 31. [Google Scholar] [CrossRef] [Green Version]
- Galluzzo, N. Technical and economic efficiency in some Italian farms: An analysis in two Italian islands. Agric. Econ. Rev. 2017, 18, 30–39. [Google Scholar]
- Bournaris, T.; Vlontzos, G.; Moulogianni, C. Efficiency of vegetables produced in Glasshouses: The Impact of Data Envelopment Analysis (DEA) in land management decision making. Land 2019, 8, 17. [Google Scholar] [CrossRef] [Green Version]
- Batzios, A.; Theodoridis, A.; Semos, A.; Bournaris, T. Assessing efficiency of dairy goat farms by performance evaluation and benchmarking. J. Hell. Vet. Med. Soc. 2022, 73, 4389–4398. [Google Scholar] [CrossRef]
- Prentzas, A.; Nastis, S.A.; Moulogianni, C.; Kouriati, A. Technical and economic analysis of farms cultivating cereals and legumes: A Greek case study. Int. J. Sustain. Agric. Manag. Inform. 2022, 8, 446. [Google Scholar] [CrossRef]
- Vidoli, F.; Fusco, E. Level of services, spatial dependence and allocative efficiency in local governments. Local Gov. Stud. 2018, 44, 848–873. [Google Scholar] [CrossRef]
- Hadian, E.; Shabani, Z.D.; Farmanbar, F. Impact of energy carriers’ price distortions on energy allocative efficiency: The case study of Iranian provinces. Environ. Sci. Pollut. Res. 2022, 29, 88725–88736. [Google Scholar] [CrossRef]
- Chebil, A.; Frija, A.; Thabet, C. Economic efficiency measures and its determinants for irrigated wheat farms in Tunisia: A DEA approach. New Medit 2015, 14, 32–38. [Google Scholar]
- Vidal-Tomás, D.; Ibáñez, A.M.; Farinós, J.E. The effect of the launch of bitcoin futures on the cryptocurrency market: An economic efficiency approach. Mathematics 2021, 9, 413. [Google Scholar] [CrossRef]
- Fumbwe, F.; Lihawa, R.; Andrew, F.; Kinyanjui, G.; Mkuna, E. Examination on level of scale efficiency in public hospitals in Tanzania. Cost Eff. Resour. Alloc. 2021, 19, 1–10. [Google Scholar] [CrossRef]
- Mangili, P.V.; Santos, L.S.; Prata, D.M. A Systematic Methodology for Comparing the Sustainability of Process Systems Based on Weighted Performance Indicators. Comput. Chem. Eng. 2019, 130, 106558. [Google Scholar]
- Azapagic, A.; Stamford, L.; Youds, L.; Barteczko-Hibbert, C. Towards Sustainable Production and Consumption: A Novel DEcision-Support Framework IntegRating Economic, Environmental and Social Sustainability (DESIRES). Comput. Chem. Eng. 2016, 91, 93–103. [Google Scholar]
- Mangili, P.V.; Prata, D.M. Preliminary design of sustainable industrial process alternatives based on eco-efficiency approaches: The maleic anhydride case study. Chem. Eng. Sci. 2020, 212, 115313. [Google Scholar] [CrossRef]
- Ruiz-Mercado, G.J.; Smith, R.L.; Gonzalez, M.A. Gonzalez. Sustainability Indicators for Chemical Processes: II. Data Needs. Ind. Eng. Chem. Res. 2012, 51, 2329–2353. [Google Scholar]
- Hyvärinen, H.; Skyttä, A.; Jernberg, S.; Meissner, K.; Kuosa, H.; Uusitalo, L. Cost-efficiency assessments of marine monitoring methods lack rigor—A systematic mapping of literature and an end-user view on optimal cost-efficiency analysis. Environ. Monit. Assess. 2021, 193, 1–13. [Google Scholar] [CrossRef]
- Nguyen, M.A.T.; Yu, M.M.; Lirn, T.C. Revenue efficiency and its drivers in the cruise industry. Marit. Policy Manag. 2022, 49, 1010–1026. [Google Scholar] [CrossRef]
- Pilar, P.G.; Marta, A.P.; Antonio, A. Profit efficiency and its determinants in small and medium-sized enterprises in Spain. BRQ Bus. Res. Q. 2018, 21, 238–250. [Google Scholar] [CrossRef]
- Rezitis, A.; Mygdakos, E.; Zaverda, Μ. Study of the Effect of the “THEOFRASTOS” System on the Technical Efficiency of Greenhouse Crops: A Comparative Analysis. Hellenic Statistical Institute. In Proceedings of the 17th Panhellenic Statistics Conference (2004), Lefkada, Greece, 17–19 June 2004; pp. 375–382. (In Greek). [Google Scholar]
- Galanopoulos, Κ.; Kamenidou, Ε.; Tziakas, Β.; Mitsopoulos, A. Technological progress in agricultural production: Analysis of Improvement Plans in Central Macedonia. In Proceedings of the 8th Panhellenic Agricultural Economy Conference, Thessaloniki, Greece, 25–27 November 2004. (In Greek). [Google Scholar]
- Tsiouni, M.; Gourdouvelis, D.; Aggelopoulos, S.; Vrontis, D.; Galati, A. Measuring Technical Efficiency of Greek Red Suckler Cow Breed’s Farms in Central Macedonia Region Using a Data Envelopment Analysis Model. J. Int. Bus. Entrep. Dev. 2022, 14, 329–348. [Google Scholar]
- Manos, B.; Psychoudakis, A. Investigation of the relative efficiency of dairy farms using data envelopment analysis. Q. J. Int. Agric. 1997, 36, 188–197. [Google Scholar]
- Sultana, S.; Hossain, M.M.; Haque, M.N. Estimating the potato farming efficiency: A comparative study between stochastic frontier analysis and data envelopment analysis. PLoS ONE 2023, 18, e0284391. [Google Scholar] [CrossRef]
- De Koeijer, T.J.; Wossink, G.A.A.; Struik, P.C.; Renkema, J.A. Measuring agricultural sustainability in terms of efficiency: The case of Dutch sugar beet growers. J. Environ. Manag. 2002, 66, 9–17. [Google Scholar]
- Aigner, D.; Lovell, C.A.K.; Schmidt, P. Formulation and estimation of stochastic frontier production function models. J. Econom. 1977, 6, 21–37. [Google Scholar] [CrossRef]
- Jote, A.; Feleke, S.; Tufa, A.; Manyoung, V.; Lemma, T. Assessing the Efficiency of Sweet Potato Producers in the Southern Region of Ethiopia. Exp. Agric. 2018, 54, 491–506. [Google Scholar] [CrossRef] [Green Version]
- Callens, I.; Tyteca, D. Towards indicators of sustainable development for firms: A productive efficiency perspective. Ecol. Econ. 1999, 28, 41–53. [Google Scholar] [CrossRef]
- Coelli, T.J.; Prasada Rao, D.S.; O’Donnell, C.J.; Battese, G.E. An Introduction to Efficiency and Productivity Analysis; Springer Science & Business Media: Berlin/Heidelberg, Germany, 2005. [Google Scholar] [CrossRef]
- Kitsopanidis, G.; Kamenidis, C. Agricultural Economics, 3rd ed.; ZHTH: Thessaloniki, Greece, 2003. (In Greek) [Google Scholar]
- Kouriati, A.; Dimitriadou, E.; Bournaris, T. Farm accounting for farm decision making: A case study in Greece. Int. J. Sustain. Agric. Manag. Inform. 2021, 7, 77. [Google Scholar] [CrossRef]
- Coelli, T. A Guide to DEAP Version 2.1: A Data Envelopment Analysis (Computer) Program. CEPA Working Paper 96/08 ABSTRACT. 1996. Available online: https://www.owlnet.rice.edu/~econ380/DEAP.PDF (accessed on 22 March 2023).
- Bojnec, Š.; Latruffe, L. Measures of farm business efficiency. Ind. Manag. Data Syst. 2008, 108, 258–270. [Google Scholar]
- Farrell, M.J. The Measurement of Productive Efficiency. J. R. Stat. Soc. Ser. A Gen. 1957, 120, 253–290. [Google Scholar] [CrossRef]
- Kumar, S.; Gulati, R. An Examination of Technical, Pure Technical, and Scale Efficiencies in Indian Public Sector Banks using Data Envelopment Analysis. Eurasian J. Bus. Econ. 2008, 1, 33–69. [Google Scholar]
- Banker, R.D.; Charnes, A.; Cooper, W.W. Some Models for Estimating Technical and Scale Inefficiencies in Data Envelopment Analysis. Manag. Sci. 1984, 30, 1078–1092. [Google Scholar] [CrossRef] [Green Version]
- Sharma, K.R.; Leung, P.S.; Zaleski, H.M. Technical, allocative and economic efficiencies in swine production in Hawaii: A comparison of parametric and nonparametric approaches. Agric. Econ. 1999, 20, 23–35. [Google Scholar] [CrossRef]
- Rodrigues, A.; Silveira Gontijo, T.; De Muylder, C. Measuring the technical and scale efficiency of Rio de Janeiro samba schools: A DEA approach Mensuração da eficiência técnica e de escala das escolas de samba do Rio de Janeiro: Uma abordagem DEA. Exacta 2019, 17, 201. [Google Scholar] [CrossRef]
- Regional unit of Pieria. 2022. Available online: https://pieria.pkm.gov.gr/ (accessed on 24 December 2022).
- Hellenic Statistical Authority. Demographic Characteristics/2011. Available online: https://www.statistics.gr/el/statistics/-/publication/SAM03/ (accessed on 8 August 2023).
- Hellenic Statistical Authority. Economic Characteristics/2011. Available online: https://www.statistics.gr/el/statistics/-/publication/SAM04/ (accessed on 5 March 2023).
- Hellenic Statistical Authority. Farms and Lands/2016. Available online: https://www.statistics.gr/el/statistics/-/publication/SPG32/ (accessed on 5 March 2023).
- Cooper, W.W.; Seiford, L.M.; Tone, K. Data Envelopment Analysis: A Comprehensive Text with Models, Applications, References and DEA-Solver Software, 2nd ed.; Springer: New York, NY, USA, 2007. [Google Scholar] [CrossRef] [Green Version]
- Haas, D.A.; Murphy, F.H. Compensating for non-homogeneity in decision-making units in data envelopment analysis. Eur. J. Oper. Res. 2003, 144, 530–544. [Google Scholar] [CrossRef]
- Dyson, R.G.; Allen, R.; Camanho, A.S.; Podinovski, V.V.; Sarrico, C.S.; Shale, E.A. Pitfalls and protocols in DEA. Eur. J. Oper. Res. 2001, 132, 245–259. [Google Scholar] [CrossRef]
- Theodoridis, A.; Batzios, C.; Ragkos, A.; Angelidis, P. Technical efficiency measurement of mussel aquaculture in Greece. Aquac. Int. 2017, 25, 1025–1037. [Google Scholar] [CrossRef]
- Kyrgiakos, L.S.; Kleftodimos, G.; Vlontzos, G.; Pardalos, P.M. A systematic literature review of data envelopment analysis implementation in agriculture under the prism of sustainability. Oper. Res. Int. J. 2023, 23, 7. [Google Scholar] [CrossRef]
- Candemir, M.; Koyubenbe, N. Efficiency analysis of dairy farms in the province of Izmir (Turkey): Data envelopment analysis (DEA). J. Appl. Anim. Res. 2006, 29, 61–64. [Google Scholar] [CrossRef]
- Mukhtar, U.; Mohamed, Z.; Shamsuddin, M.N.; Sharifuddin, J.; Iliyasu, A. Application of data envelopment analysis for technical efficiency of smallholder pearl millet farmers in Kano state, Nigeria. Bulg. J. Agric. Sci. 2018, 24, 213–222. [Google Scholar]
- Vlontzos, G. Measuring Efficiency of the Greek Flourmill Firms Using Data Envelopment Analysis. Int. J. Sustain. Agric. Manag. Inform. 2015, 1, 61. [Google Scholar]
- Iráizoz, B.; Rapún, M.; Zabaleta, I. Assessing the Technical Efficiency of Horticultural Production in Navarra, Spain. Agric. Syst. 2003, 78, 387–403. [Google Scholar]
- Świtłyk, M.; Sompolska-Rzechuła, A.; Kurdyś-Kujawska, A. Measurement and Evaluation of the Efficiency and Total Productivity of Dairy Farms in Poland. Agronomy 2021, 11, 2095. [Google Scholar] [CrossRef]
- Wang, L.; Chang, W. Total Factor Productivity and Its Differences of Family Farms in China. J. South China Agric. Univ. 2017, 6, 20–31. [Google Scholar]
- Guo, X.; Gong, G. Can Adoption of New Technologies Raise Economic Efficiency of Family Farms? From the Perspective of Realization of New Technological Demand. J. Huazhong Agric. Univ. 2021, 1, 33–42, discussion 174–175. [Google Scholar]
- Chen, Z.; Meng, Q.; Yan, K.; Xu, R. The Analysis of Family Farm Efficiency and Its Influencing Factors: Evidence from Rural China. Land 2022, 11, 487. [Google Scholar] [CrossRef]
- Bai, W.; Sun, Z.; Zheng, J.; Du, G.; Feng, L.; Cai, Q.; Yang, N.; Feng, C.; Zhang, Z.; Evers, J.B.; et al. Mixing Trees and Crops Increases Land and Water Use Efficiencies in a Semi-Arid Area. Agric. Water Manag. 2016, 178, 281–290. [Google Scholar]
- Papadopoulou, A.; Ragkos, A.; Theodoridis, A.; Skordos, D.; Parissi, Z.; Abraham, E. Evaluation of the Contribution of Pastures on the Economic Sustainability of Small Ruminant Farms in a Typical Greek Area. Agronomy 2021, 11, 63. [Google Scholar] [CrossRef]
- Gollin, D.; Parente, S.L.; Rogerson, R. Farm work, home work and international productivity differences. Rev. Econ. Dyn. 2004, 7, 827–850. [Google Scholar]
- Assaf, A.; Knežević, C.L. The performance of the Slovenian hotel industry: Evaluation post-privatisation. Int. J. Tour. Res. 2010, 12, 462–471. [Google Scholar]
- Cheng, H.; Lu, Y.C.; Chung, J.T. Improved slack-based context-dependent DEA—A study of international tourist hotels in Taiwan. Expert Syst. Appl. 2010, 37, 6452–6458. [Google Scholar]
- Gaviglio, A.; Filippini, R.; Madau, F.A.; Marescotti, M.E.; Demartini, E. Technical efficiency and productivity of farms: A periurban case study analysis. Agric. Econ. 2021, 9, 11. [Google Scholar] [CrossRef]
- Poldrugovac, K.; Tekavcic, M.; Jankovic, S. Efficiency in the Hotel Industry: An Empirical Examination of the Most Influential Factors. Econ. Res.-Ekon. Istraz. 2016, 29, 583–597. [Google Scholar]
| Descriptive Measures | Gross Output (€) | Land (acres) | Labor (h) | Variable Costs (€) |
|---|---|---|---|---|
| Average | 13,348.83 | 51.29 | 3940.85 | 8961.03 |
| Min | 180.00 | 5.70 | 250.00 | 900.00 |
| Max | 34,260.00 | 467.00 | 8560.00 | 64,464.00 |
| St. Dev | 9073.75 | 80.19 | 2141.83 | 11,790.67 |
| Model | CRS | VRS | SE |
|---|---|---|---|
| Average | 0.654 | 0.804 | 0.808 |
| Min | 0.012 | 0.351 | 0.033 |
| Max | 1.000 | 1.000 | 1.000 |
| St. dev | 361 | 474 | 361 |
| Number of efficient farms | 6 | 13 | 6 |
| Percentage (%) of efficient farms | 15.00 | 32.50 | 15.00 |
| Farms | Gross Output (€) | Land (acres) | Labor (h) | Variable Capital (€) |
|---|---|---|---|---|
| 5 | 28,700.00 | 467.00 | 2100.00 | 24,174.00 |
| 27 | 17,325.00 | 17.00 | 8500.00 | 9000.00 |
| 28 | 9750.00 | 13.00 | 3100.00 | 2450.00 |
| 34 | 22,360.00 | 43.00 | 3000.00 | 2990.00 |
| 36 | 34,260.00 | 27.00 | 5080.00 | 38,660.00 |
| 39 | 22,800.00 | 25.00 | 4100.00 | 7300.00 |
| Efficiency Class | 0.1–0.599 | 0.6–0.799 | 0.8–0.999 | ||||||
|---|---|---|---|---|---|---|---|---|---|
| Actual | Optimal | Var. (%) | Actual | Optimal | Var. (%) | Actual | Optimal | Var. (%) | |
| Land (acres) | 80.6 | 40.2 | −54.0% | 39.1 | 27.7 | −27.7% | 19.7 | 16.49 | −15.2% |
| Labor (hours) | 3817.5 | 1937.6 | −50.2% | 4057.9 | 2792.9 | −29.4% | 4013.7 | 2879.8 | −22.8% |
| Variable Capital (€) | 14,631.5 | 3089.9 | −63.8% | 7609.5 | 5398.3 | −30.6% | 4078.5 | 2520.0 | −21.2% |
| Gross Output (€) | 12,580.9 | 12,580.9 | 0.0% | 13,249.9 | 13,249.9 | 0.0% | 10,467.2 | 10,467.2 | 0.00% |
Disclaimer/Publisher’s Note: The statements, opinions and data contained in all publications are solely those of the individual author(s) and contributor(s) and not of MDPI and/or the editor(s). MDPI and/or the editor(s) disclaim responsibility for any injury to people or property resulting from any ideas, methods, instructions or products referred to in the content. |
© 2023 by the authors. Licensee MDPI, Basel, Switzerland. This article is an open access article distributed under the terms and conditions of the Creative Commons Attribution (CC BY) license (https://creativecommons.org/licenses/by/4.0/).
Share and Cite
Kouriati, A.; Tafidou, A.; Lialia, E.; Prentzas, A.; Moulogianni, C.; Dimitriadou, E.; Bournaris, T. The Impact of Data Envelopment Analysis on Effective Management of Inputs: The Case of Farms Located in the Regional Unit of Pieria. Agronomy 2023, 13, 2109. https://doi.org/10.3390/agronomy13082109
Kouriati A, Tafidou A, Lialia E, Prentzas A, Moulogianni C, Dimitriadou E, Bournaris T. The Impact of Data Envelopment Analysis on Effective Management of Inputs: The Case of Farms Located in the Regional Unit of Pieria. Agronomy. 2023; 13(8):2109. https://doi.org/10.3390/agronomy13082109
Chicago/Turabian StyleKouriati, Asimina, Anna Tafidou, Evgenia Lialia, Angelos Prentzas, Christina Moulogianni, Eleni Dimitriadou, and Thomas Bournaris. 2023. "The Impact of Data Envelopment Analysis on Effective Management of Inputs: The Case of Farms Located in the Regional Unit of Pieria" Agronomy 13, no. 8: 2109. https://doi.org/10.3390/agronomy13082109
APA StyleKouriati, A., Tafidou, A., Lialia, E., Prentzas, A., Moulogianni, C., Dimitriadou, E., & Bournaris, T. (2023). The Impact of Data Envelopment Analysis on Effective Management of Inputs: The Case of Farms Located in the Regional Unit of Pieria. Agronomy, 13(8), 2109. https://doi.org/10.3390/agronomy13082109