Article

Characterization and Trait Association Analysis of 27 Pearl Millet Landraces in Southern Tunisia

1
Dry Land Farming and Oases Cropping Laboratory (LR16IRA02), Arid Land Institute of Médenine (IRA), Médenine 4119, Tunisia
2
Faculty of Sciences of Tunis (FST), Campus Universitaire El-Manar, Tunis 2092, Tunisia
*
Author to whom correspondence should be addressed.
Agronomy 2023, 13(8), 2128; https://doi.org/10.3390/agronomy13082128
Submission received: 13 June 2023 / Revised: 17 July 2023 / Accepted: 18 July 2023 / Published: 14 August 2023
(This article belongs to the Section Crop Breeding and Genetics)

Abstract

:
Pearl millet (Pennisetum glaucum (L.) R. Br., 2n = 2x = 14, Poaceae), is a cross-pollinated, warm-season crop grown worldwide. To select genotypes for breeding pearl millet cultivars that adapt to drought condition in southern Tunisia, we evaluated the grain yield (GY) and yield-related traits using a set of 27 landraces at two locations in southern Tunisia for two grown seasons (2019 and 2020). The genetic variability, phenotypic and genotypic association, and path coefficient (PC), based on grain yield (GY) and different yield-related agronomic traits, were evaluated. Analysis of variance and BLUPs value revealed a wide range of variability and the possibility of genetic selection for traits that are advantageous. Broad sense heritability (H) for all the traits ranged from 24.10% for grain yield (GY) to 57.11% for spike length (SL), indicating low to moderate inheritability. Genetic advance as a percentage of the mean (GAM) ranged from high (29.56%) for principal panicle weight (PPW) to moderate for all the traits except from plant high (PH) (7.31%). For all the traits, the phenotypic coefficient of variation (PCV) was higher than genotypic coefficient of variation (GCV), indicating the magnitude of environmental conditions. GY was significantly correlated with all the traits at the genotypic and phenotypic level. According to the path coefficient, the traits PPW and SL displayed the highest direct effects on GY. Heatmap analysis demonstrated a clear segregation between the early and late genotypes based on their geographic origin. Based on the cluster analysis and FAI-BLUPS analysis, genotypes G11, G13, G12, G17 and G18 were selected as the best-performing genotypes with the shortest cycle.

1. Introduction

Pearl millet (Pennisetum glaucum (L.) R. Br., 2n = 2x = 14, Poaceae), is a cross-pollinated, warm-season crop. It is the 6th most produced cereal grown worldwide [1,2,3] Pearl millet shows great adaptability to marginal conditions such as high temperature (up to 42 °C) and water scarcity, which make it an appreciable cereal for local farmers in drought-prone areas [4]. Flowering time is the trait that breeders make great efforts to ensure during cultivar development. The earliness is usually considered a drought escape mechanism since the post-flowering drought stress is more damaging than the pre-flowering stage, according to previous studies, and early-flowering genotypes could be more adapted to enhance the tolerance to terminal drought [5,6,7]. However, late-flowering genotypes are usually have better production under favorite growing conditions [8].
In Tunisia, pearl millet cultivation started in the 8th century and is scattered from the northern to southern area of the country [9]. Its production is limited to small farmers for the local market, and it is mainly used for traditional dishes or feed [10]. Moreover, pearl millet farmers in Tunisia are still using their local and traditional landraces, which are adapted to poor conditions [11], especially in the southern region, characterized by arid conditions where average annual precipitation ranges between 100 and 200 mm and temperatures that could reach 42 °C in summer. However, despite the uniqueness of the Tunisian gene pool and its usefulness in breeding programs, it is facing the danger of genetic erosion caused by poor conservation practices and climatic changes [12], and limited research has been dedicated to Tunisian pearl millet germplasm. Thus, the collection, selection, breeding and conversion of Tunisian pearl millet landraces are of paramount importance, and improving its productivity under natural stress conditions such as drought is highly recommended. However, due to the polygenetic nature of grain yield, it is difficult to obtain results using only this. Hence, it is fundamental to understand how yield is related to other characteristics and the magnitude of the environmental effects on their inheritance [5,13,14]. Therefore, the study of genetic parameters, such as phenotypic (PCV) and genotypic coefficients of variation (GCV) and heritability (H) estimates, coupled with genetic advance (GA), is favored [15,16,17]. Studies of correlation can also be helpful in breeding programs, although they do not provide enough information about and understanding of the interrelationships of heritable traits. Consequently, this can lead to incorrect information. A combined approach of correlation studies and path coefficient analysis allows for the identification of significant traits with an influence on yield. Path coefficient analysis assesses the direct and indirect effects of one trait on another, revealing qualities that can be used to select yield, either directly or indirectly [18].
In this context, the aims of this exploratory work are: (1) To assess the local phenotypic variation of 27 genotypes of Pearl millet collected from two regions in south Tunisia (Djerba and Medenine) and grown for two consecutive years (2019–2020). (2) Taking the highest yield and shortest flowering period as selection criteria, test degree of divergence between genotypes based on principal component analysis (PCA) and cluster analysis (3). Use the multi-trait approach FAI-BLUP to select the desired genotypes. (4) Estimate the genetic parameters for yield and yield components. (5) Determine the relationship between yield and the other evaluated traits through correlation and path coefficient.
To the best of our knowledge, this is the first attempt to explore the genetic variability and path analysis of South Tunisian Pearl millet. This work will provide the foundation for future research aiming to uncover stronger genotypes to improve desirable features.

2. Materials and Methods

2.1. Plant Material and Experimental Design

Twenty-seven Pearl millet (Pennisetum glaucum (L.) R. Br) genotypes were originally collected and assembled by Arid Lands Institute researchers from Southern Tunisian farmers located in the region of Medenine and Djerba (Table S1). These populations were grown in the experimental field of the Arid Lands Institute of Medenine (33°29′57.80″ N, 10°38′32.96″ E, Altitude 16 m), characterized by an arid climate with extreme daily temperatures of from 6.2 to 38 °C and low precipitation ranging from 50 to 150 mm per year. The trial was conducted in a randomized complete block design (RCBD) with three replications. Seeds of Pearl millet were planted in paired rows of 5 m of length, with a 15 cm inter-plant distance. Each of the 27 landraces was represented by a total of from 25 to 30 plants on each block. The border around each block was used to reduce experimental error during sampling and measurement. Sowing was performed for two years (23 May 2019 and 12 May 2020). The soil of the experimental research station is loamy sand with low organic matter. The plots were immediately irrigated after sowing with tap water and then subsequently irrigated twice weekly with equal quantities during the trial period.

2.2. Agro-Morphological Traits

With a focus on characterizing the plant diversity, various traits were investigated. Data were assembled from the morpho-phenological variability of the local pearl millet landraces and followed from seeding to the end of the generative cycle (seed maturity). A total of 10 morpho-phenological parameters were evaluated. Initiation date: date of emergence of the spike (IN), 50% of initiation (50%IN), flowering date (FLO) and 50% of flowering (50%FLO) were recorded from visual observations of each planted row (genotype). At maturity, 6 randomly selected plants from each genotype (6 samples per population for each block) were used to quantify agro-morphological traits on the basis of individual plants: PH: plant height (m), Lnbr: number of leaves per plant, Nnbr: numbers of nods per plant, PPW: principal panicle weight (g), SL: spike length (cm) and GY: grain yield (kg/h). Climatic conditions of the two years of study are presented in Table S2 and Figure S1.

2.3. Statistical Analysis

2.3.1. Analysis of Variance and BLUPs

Based on the RCBD model, the effects of genotype, replication, block, year, and genotype by year interaction were examined for all the traits using analysis of variance (ANOVA), utilizing the (aov) function of the Stats package (R Core Team, (V0.1.0, 2019)) based on the following model:
Pijk = μ + τi + πj + bk + ξijk
where: stat
Pijk: The phenotypic value of ith genotype;
jth: The replication and kth is the block, respectively;
τi: is the effect of genotypes, πj is the effect of replication, bk is the effect of block and ξijk is residual error.
The best linear unbiased predictions (BLUPSs) can eliminate environmental variance and estimate the true individual breeding value, and these are increasingly used by plant breeders to accurately estimate genotypic values. BLUPs were calculated based on the following model using the ‘lme4’ package:
y = X + Zu + e
where y is the vector of the studied trait, u is the vector for random effects, e is the vector of residuals, Z is the matrix of random effects and X is the intercept.

2.3.2. Genetic Variability Estimation

The heritability was calculated as broad-sense heritability based on the formula proposed by [19], where σ2g and σ2p are genotypic and phenotypic variance, σ2G×E is the genotype–environment variance, σ2e is the residual variance, l is the number of environments, and r is the number of replications.
H = σ2G/(σ2G + σ2G×E/l + σ2e/rl)
Accuracy of selection was calculated according to the following formula:
Aclinh = (H)1/2
The phenotypic and genotypic coefficients of variation (PCV and GCV) were estimated according to the formula presented by [20], and genetic advance as a percentage of the mean (GA) was calculated according to [21].
  • Genotypic coefficient of variation: GCV% = σg/x × 100;
  • Phenotypic coefficient of variation: PCV% = σpx × 100;
  • Genetic advance: GA = σ2g2p× k × σp [22];
  • Genetic advance as percentage of mean: G e n e t i c   a d v a n c e P o p u l a t i o n   m e a n × 100.

2.3.3. Phenotypic, Genotypic Correlation and Path Analysis

Phenotypic and Genotypic correlation coefficient were calculated according to [21,23]. Phenotypic correlation coefficients were further divided into direct and indirect effects for path coefficient analysis [23].

2.3.4. Correlation, Principal Component Analysis and Hierarchical Cluster

Principal components’ analysis and hierarchical clustering were used in multivariate analysis to verify the differences between the genotypes. Using the Ward approach, we performed a hierarchical cluster analysis of the matrix of correlations among the phenotypic data for each year separately. We used the R package pvclust to determine whether clusters are broadly supported, following a multiscale bootstrap approach (1000 pseudo-replicates with a 95% confidence interval). The BLUP values were used for the heatmap analysis to decipher the effect of each variable on genotype clustering to identify superior genotypes. Correlation analysis, PCA and Hierarchical cluster were conducted, respectively, following the Pearson’s correlation coefficient method, using “corrplot (V0.92, 2021)”, “factoextra (V1.0.7, 2020), and “METAN (V1.18.0, 2023)” packages in R.

2.3.5. Multi-Traits Selection Model

The FAI-BLUPS Index

The multi-trait index based on the FAI-BLUPS index [24] and desired ideotype (selected genotypes with desired traits to be increased or decreased) (DI) was calculated with package “METAN” (V1.18.0, 2023). The predicted selection gains for each trait were calculated from the FAI-BLUPS index for each trait, considering 20% selection intensity, as follows: Xs is the mean of the chosen genotypes within the selection intensity, Xo is the mean of the starting population before selection and H is the heritability.

3. Results

3.1. Analysis of Variance, Heritably and Phenotypic Variation

In our study, the data set of 27 Pearl millet accessions from two consecutive years of field experiments were subjected to combined ANOVA analysis and the morphological variations among genotypes were confirmed by BLUPs (Table 1).
The result of combined ANOVA (Table 2) revealed highly significant variation (p < 0.001) between genotype, year, and (GxY) interaction for all the tested traits (IN, 50%IN, FLO, 50%FLO, PH, Lnbr, Nnbr, SL, and GY), except for PPW, where no observed variation was reported between years.
In order to further explore the phenotypic variation in the Pearl millet germplasm, the multi-year mean for each trait was expressed as the best linear unbiased prediction (BLUPS) (Figure 1) to avoid environmental effects [25]. Descriptive statistics based on the BLUPs and the mean of each trait for the two years of study are provided in the Supplementary Material.
Significant phenotypic variation was observed for all the traits, indicating (Figure 1) the broader diversity in the Pearl millet panel. The genotype G22 showed greater precocity for the traits IN, 50%IN, FLO, and 50%FLO, with an overall 10 days’ difference to G1, G5, G16, and G6, which were characterized by longer cycles (Table S3). In this study, the genotype G12 was characterized by the highest yield (900 kg·h−1). However, the genotype G21 was the least productive (440 kg·h−1) (Table S3). Taking into consideration the weight (PPW) and the length (SL), the genotype G22 was identified as having the smallest principal panicle. However, genotypes G12 and G3 were characterized by the largest principal panicle (Table S3). Another economically important trait for Pearl millet is PH, which is influenced by environmental factors [26]. In our case, a significant variation was observed between the genotypes, where the genotype G22 scored as having the the highest genotype (1.67 m) in contrary to genotype G7 (2.17 m) (Table S3).

3.2. Genetic Variability Analysis

The results of the genetic variability analysis are presented in Table 1. The estimates of genotypic and phenotypic variances were the highest for SL (PV = 65.88; GV = 37.62) and the lowest for GY (PV = 0.15; GV = 0.04). In this study, for all the evaluated traits, (PCV) was greater than (GCV). The traits GY and PPW were the only traits with a high magnitude of PCV and GCV. The traits IN, 50%IN, FLO, 50%FLO and PH were characterized by a medium PCV and low GCV. The traits SL and Nnbr demonstrated high PCV and medium GCV, whereas the trait Lnbr manifested medium intensity for both PCV and GCV [27].
The heritability estimates assist in identifying genotypes from a broad genetic pool. Consequently, high heritability benefits from efficient screening for specific traits. In this study, the majority of traits manifested with from moderate (PPW = 33.30–50%FLO = 57.11%) to low heritability (GY = 24.10%–PH = 27.48%). The highest broad-sense heritability value was registered for 50%FLO and the lowest for GY. The robustness of broad-sense heritability results was verified through selective accuracy (Aclinh) [22]. In this study, Aclinh values were very high (IN and PPW) and high for the rest of the traits; in general, estimates above 0.70 are sufficient to explicitly conclude the genetic value of genotypes [28,29].
The genetic advance (GAM) is a helpful measure for a successful and efficacious selection that might be predicted as the outcome of screening the initial population. In the present investigation, a wide variation in genetic advances, from high (>20%) to low (<10), were revealed. The highest GAM was recorded for PPW (29.55%), followed by SL (27.67%), GY (27.37%) and Nnbr (21.40%). The trait PH manifested the lowest GAM (7.89%), whereas the other traits were characterized by a moderate GAM.

3.3. The Correlation Coefficient

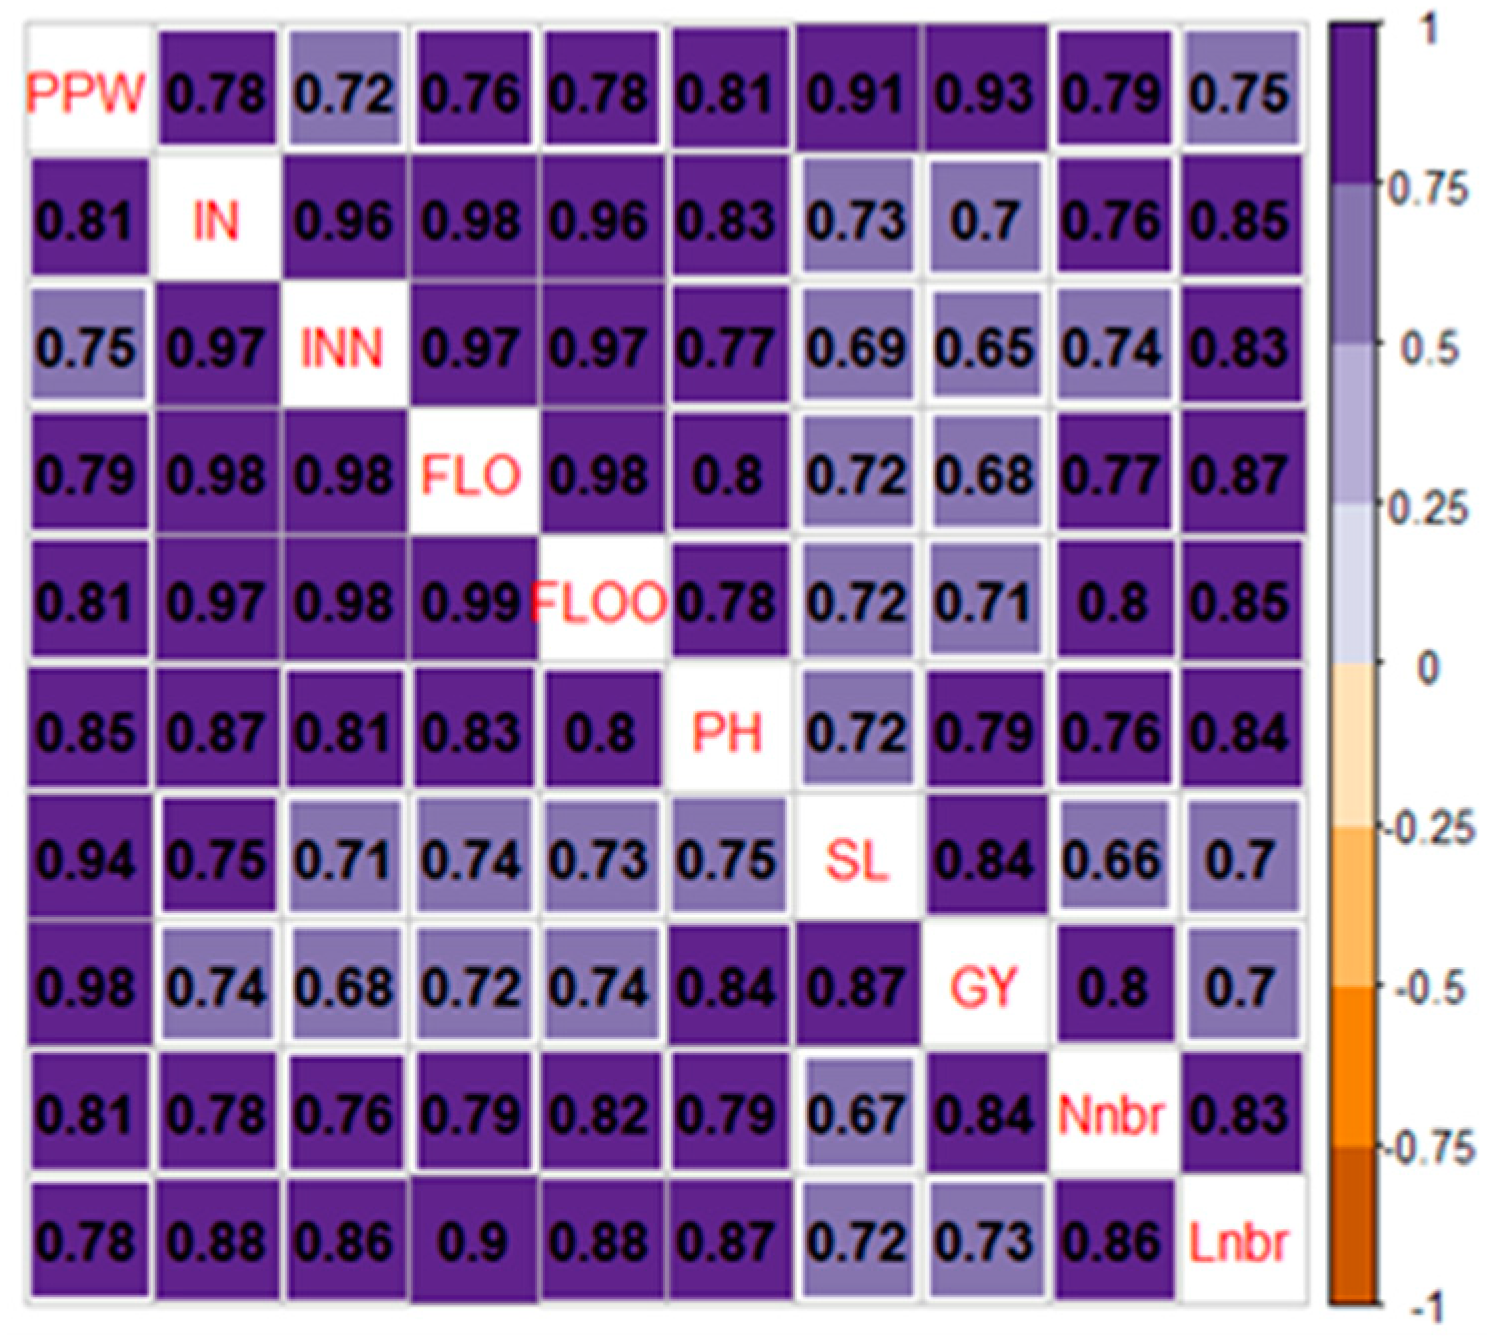
The results of the correlation are of great importance to conclude the suitable selection/breeding methodology for the simultaneous genetic improvement of complex traits such as grain yield, which is controlled by several direct and indirect components [30,31]. The correlation coefficients of each pair of traits revealed the presence of significant and positive (p < 0.05) phenotypic and genotypic correlation within all the traits. Estimates of the phenotypic and genotypic correlation are shown in Figure 2. GY had a significant and positive correlation with all the traits. This trait showed the highest phenotypic and genotypic correlation, with PPW (0.925, 0.97), SL (0.84, 0.86), Nnbr (0.78, 0.84) and PH (0.78, 0.83). However, the lowest lowest association was with 50% IN (0.70, 0.72) and FLO (0.68, 071), which suggests that higher yields are attributed to a longer growth period [32,33]. Furthermore, the high positive correlation coefficient observed with GY was an indication that the studied traits made an equal contribution toward increasing plant productivity [34]. 50%FLO showed a strong correlation at the phenotypic and genotypic level with SL (0.71, 0.73) and PPW (0.8, 0.8), reflecting that late-flowering landraces led to a larger panicle and had a positive impact on GY. The morphological traits PH and NbrN had highly significant and positive correlations with phonology traits at both levels (Figure 2).

3.4. Path Analysis

For a better understanding of the relationship between GY and the other traits, path analysis (PC) was applied. In the present investigation, GY was declared as a dependent variable and PPW, IN, 50%IN, FLO, 50%FLO, PH, SL, Nnbr and Lnbr as independent variables. Using the phenotypic PC analysis, the indirect and direct correlation (bold phase) of nine factors on GY are reported separately based on the results of the years 2019, 2020 and the joining years.
For the first year of study (2019), the highest and the lowest positive direct effect on GY (Supplementary Material) are displayed by the trait SL (0.47) and the trait PPW (0.0019), and the traits, 50% IN (−0.113), FLO (−0.114) and 50% FLO (−0.03) had a negative direct effect. For the second year (2020), the highest and the lowest positive effects (Supplementary Material) are displayed by the traits SL (0.45) and PH (0.036). The traits IN (−0.03), 50%IN (−0.028) and 50%FLO (−0.027) had a direct negative effect on GY. We can observe that the effect traits on GY are influenced by the effect of the environment (year); however, interestingly, the trait SL was the most important in both years.
According to Teya et al. (2020) [35], based on the direct positive effects of a certain trait on GY, this trait might be useful for yield improvement. On the other hand, indirect effects demonstrated that these traits influenced GY via other variables. In this study, the connection between GY and the other traits based on the phenotypic PC of both years (Table 3), suggests that PPW (0.53), SL (0.2) and Nnbr (0.31) had the highest positive direct effect on GY at the phenotypic level. The overall correlation was highly positive (0.92, 0.84 and 0.8, respectively, for PPW, SL and Nnbr); consequently, the grain yield of Pearl millet could be increased by selecting these traits. However, other traits had a direct negative effect on the grain yield (Table 3). The highest direct effect of PPW on GY (Table 3) was followed by the negative indirect PC via IN (−0.084), 50%IN (−0.078), FLO (−0.095) and Lnbr (−0.13), and the positive effect via 50%FLO (0.13), PH (0.20), SL (0.19) and Nnbr (0.25). Lnbr had the lowest direct PC in a negative direction (−0.18) on GY; however, a positive indirect PC was observed via PPW (0.40), 50%FLO (0.14), PH (0.21), SL (0.14) and Nnbr (0.26). The negative indirect PC was registered via IN (−0.09), 50%IN (−0.09), FLO (−0.10) and Lnbr (−0.18), resulting in an overall correlation of 0.7. Interestingly, all the independent variables showed negative indirect effects on GY through IN, 50%IN, FLO and Lnbr.

3.5. Principal Component Analysis (PCA)

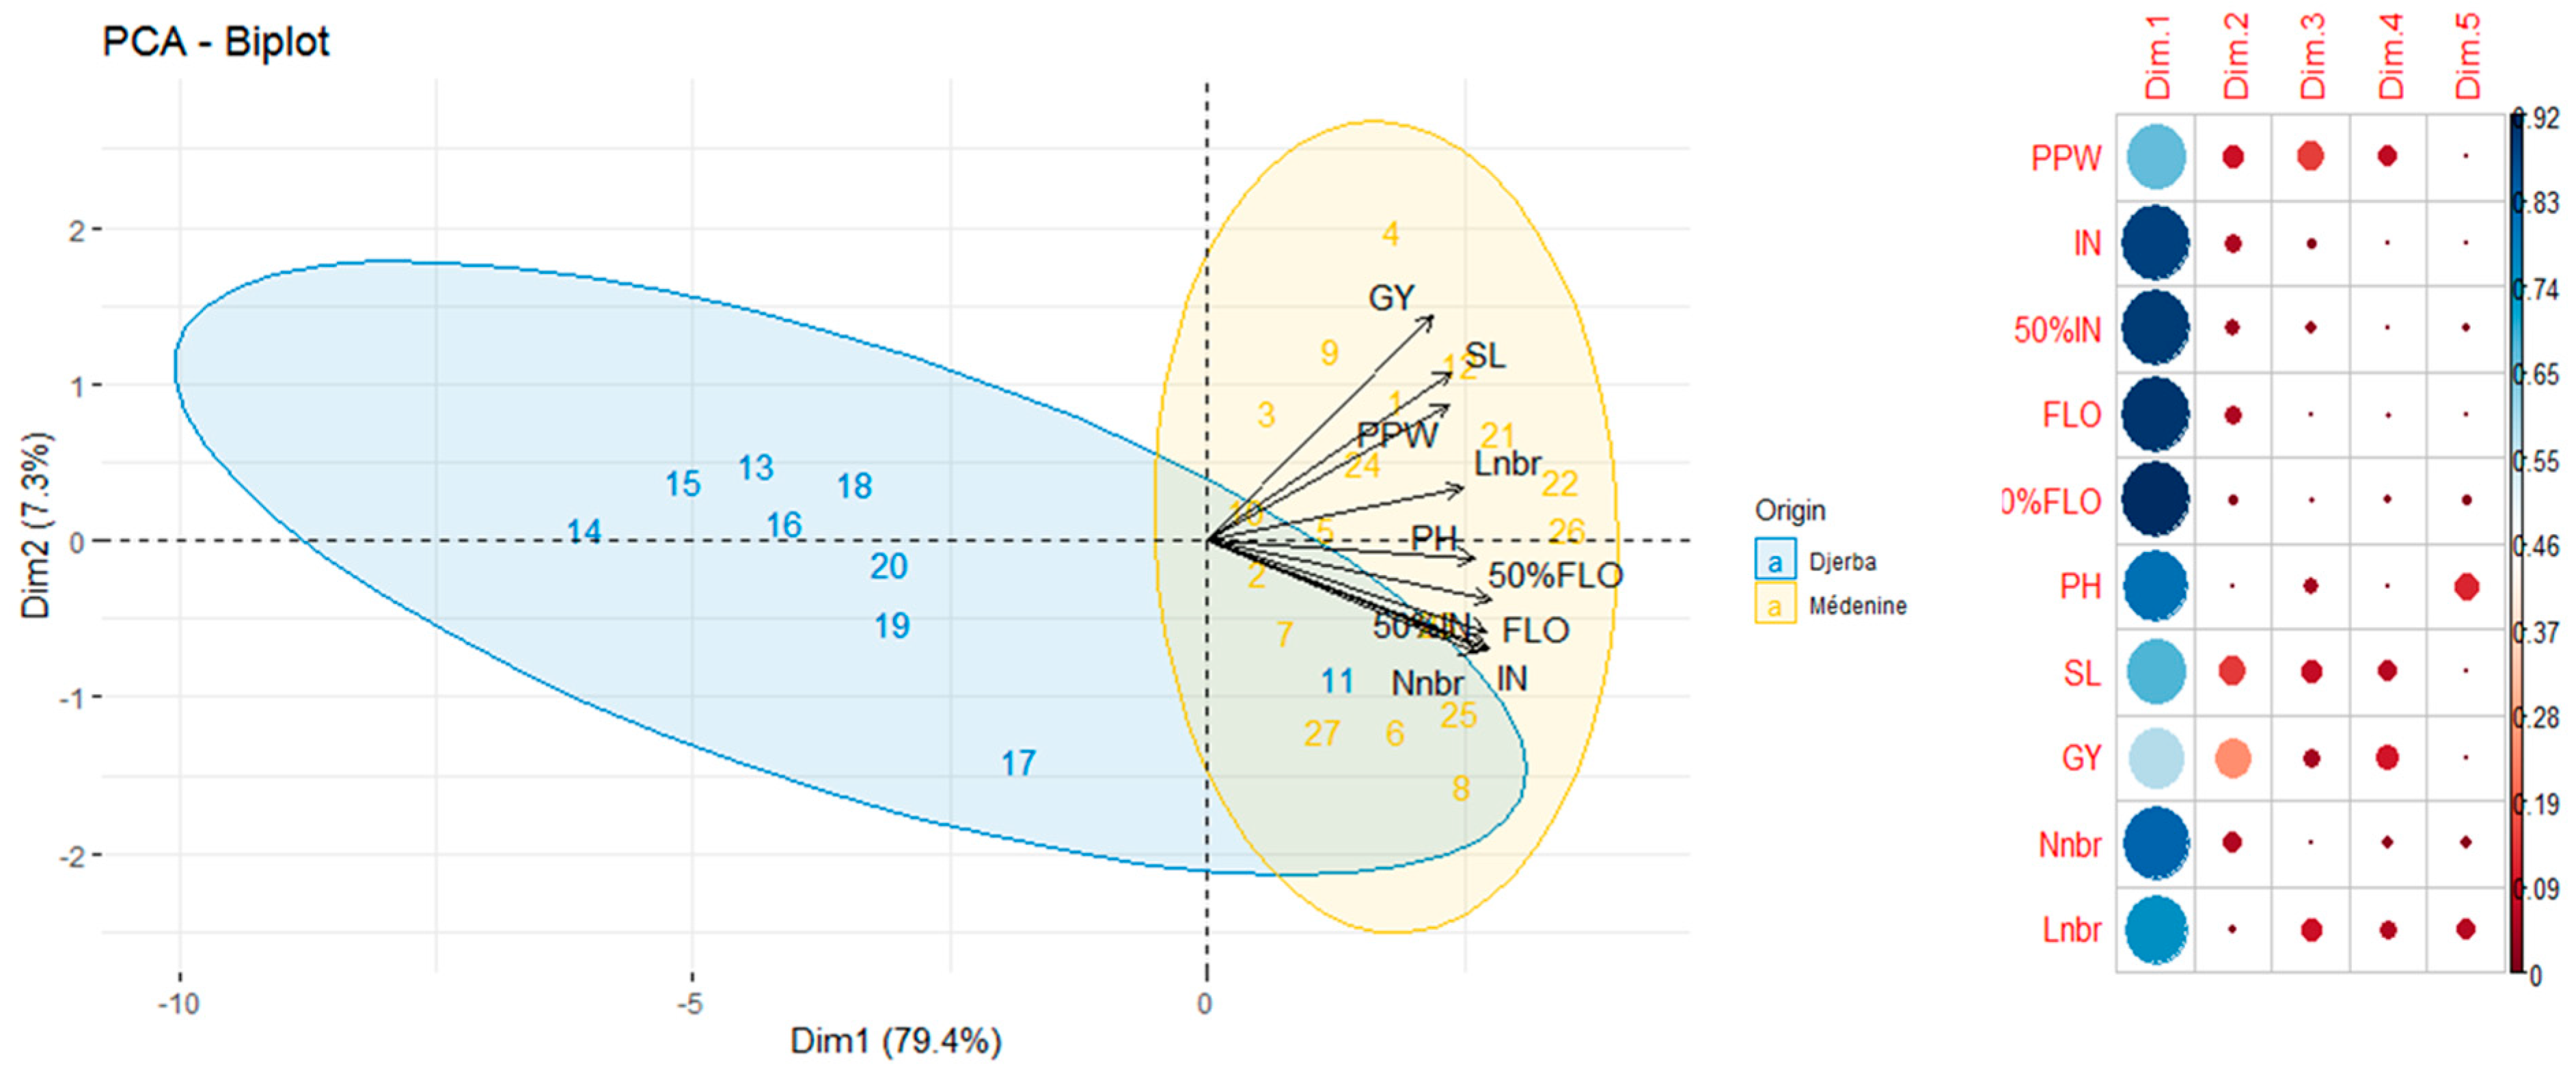
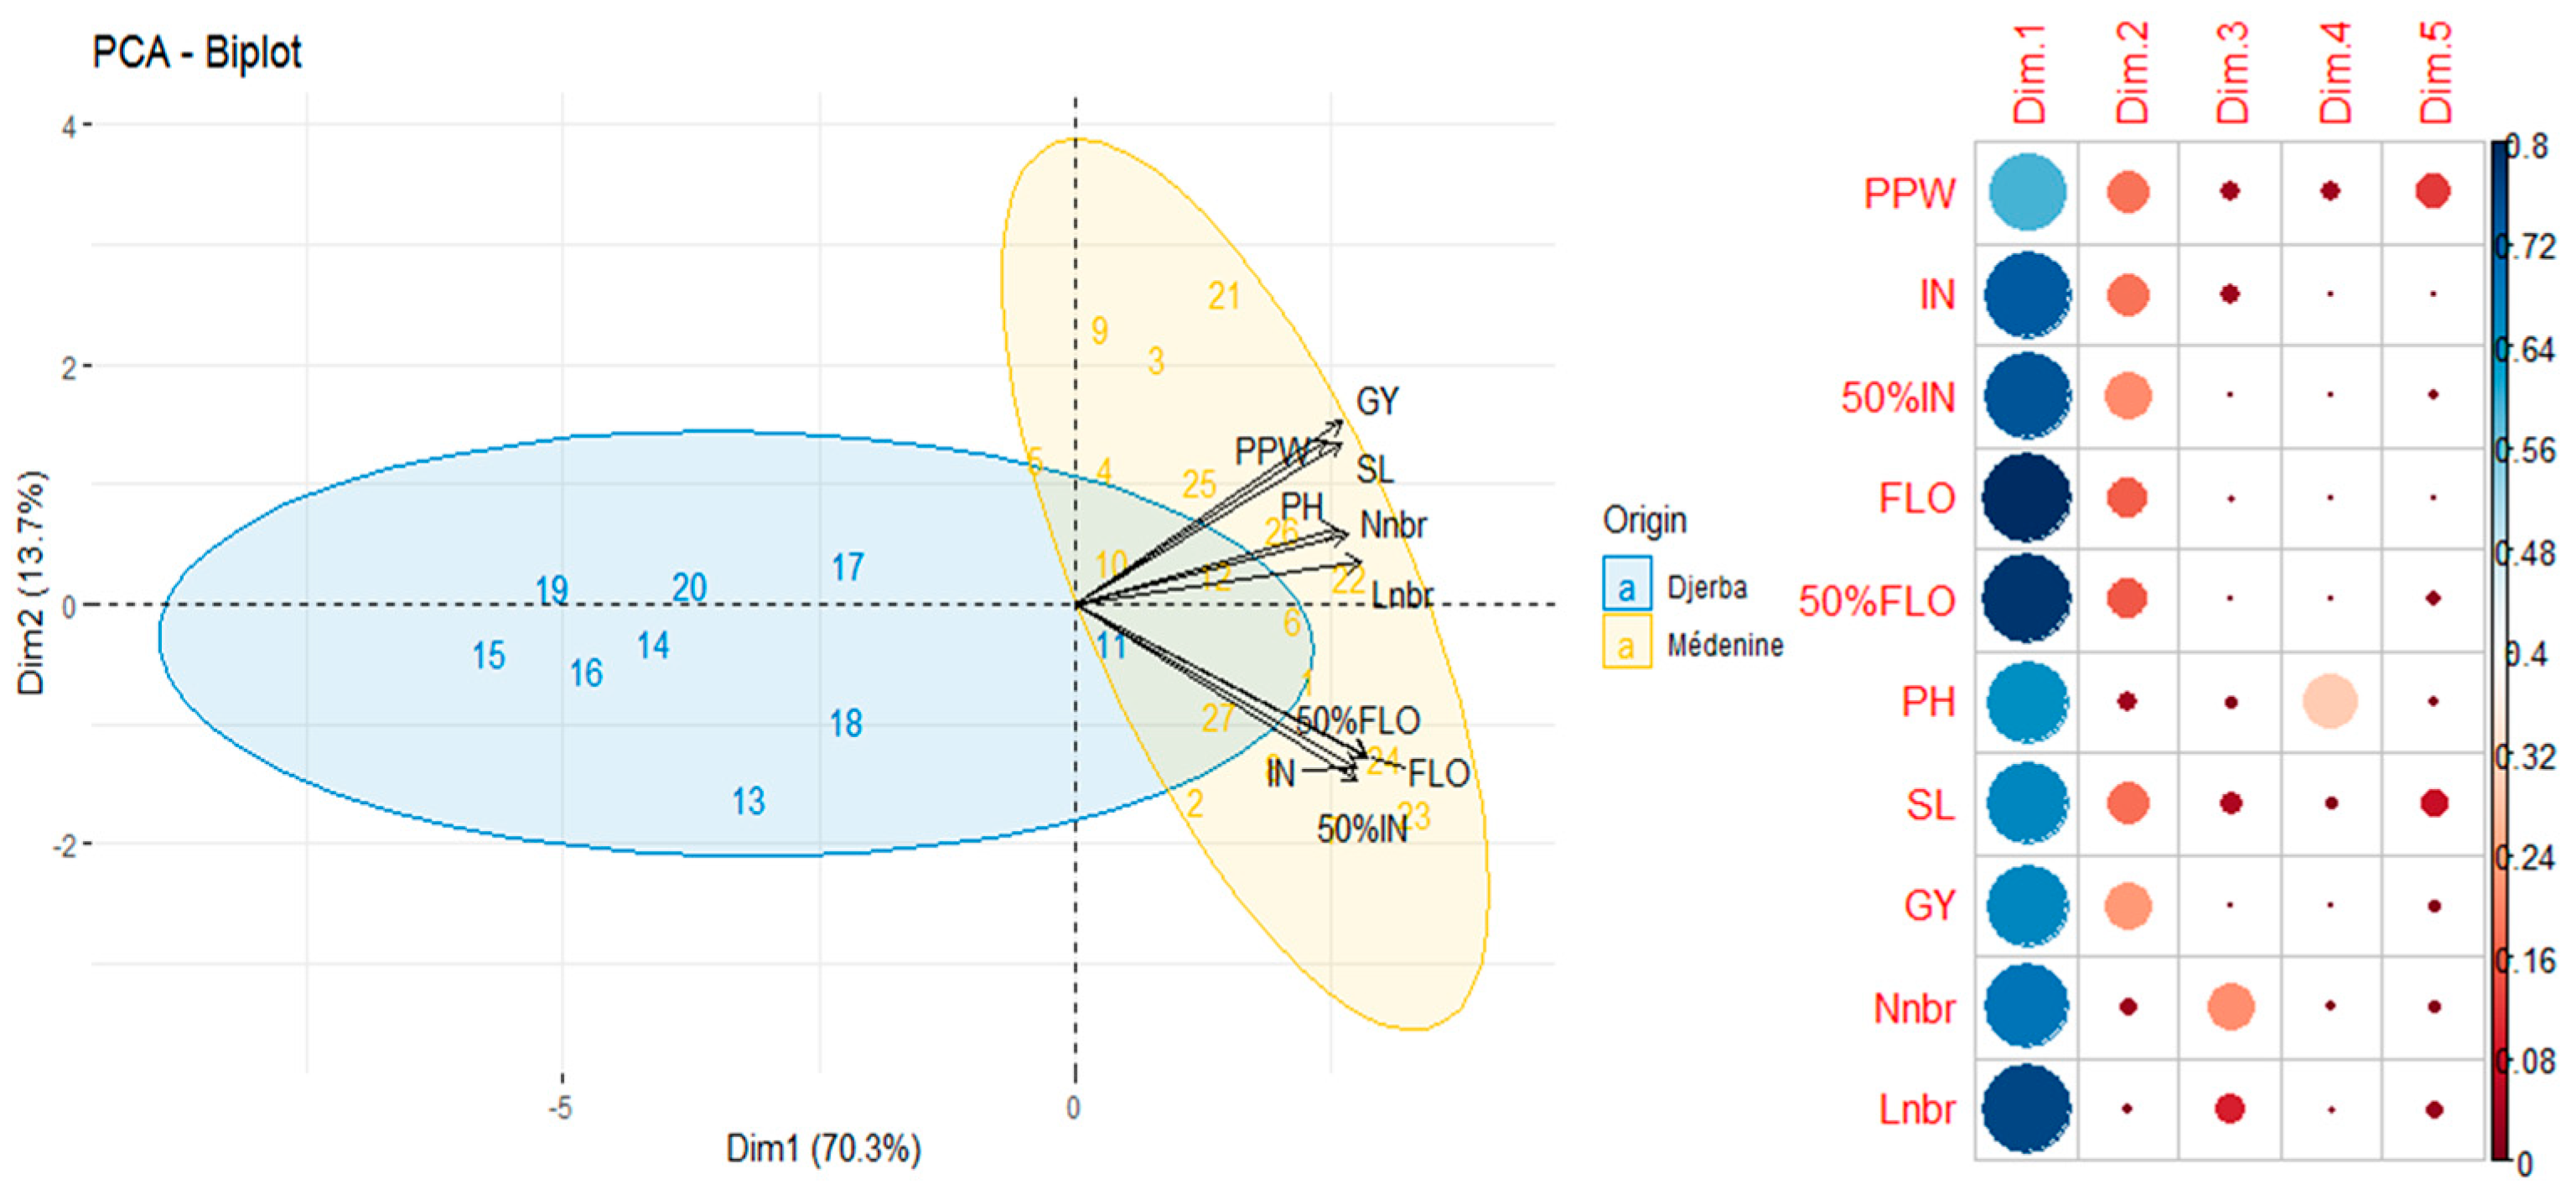
Principal component analysis (PCA) was used to illustrate the correlations and contribution of 10 quality traits and to understand the variation and grouping of the 27 genotypes. For the two years of the experiment, 2019, 2020 and BLUPs, the first two principal components (PCs) explained 86.7% (Figure 3), 84% (Figure 4) and 90.2% (Figure 5), respectively, of the total phenotypic variation among the genotypes. The first principal component (PC1), which explained 79.4% (Figure 3), 70.3% (Figure 4) and 82% (Figure 5), respectively, of the total variation, was positively associated with all the studied traits. For all the PCA, a clear segregation was observed between all the genotypes based on their geographic origin. The loading angle between all the traits, especially GY, SL and PPW across the three PCA, was less than 60°, which is a strong indication of the high correlation between these traits.

3.6. Cluster Analysis and Heatmap Analysis

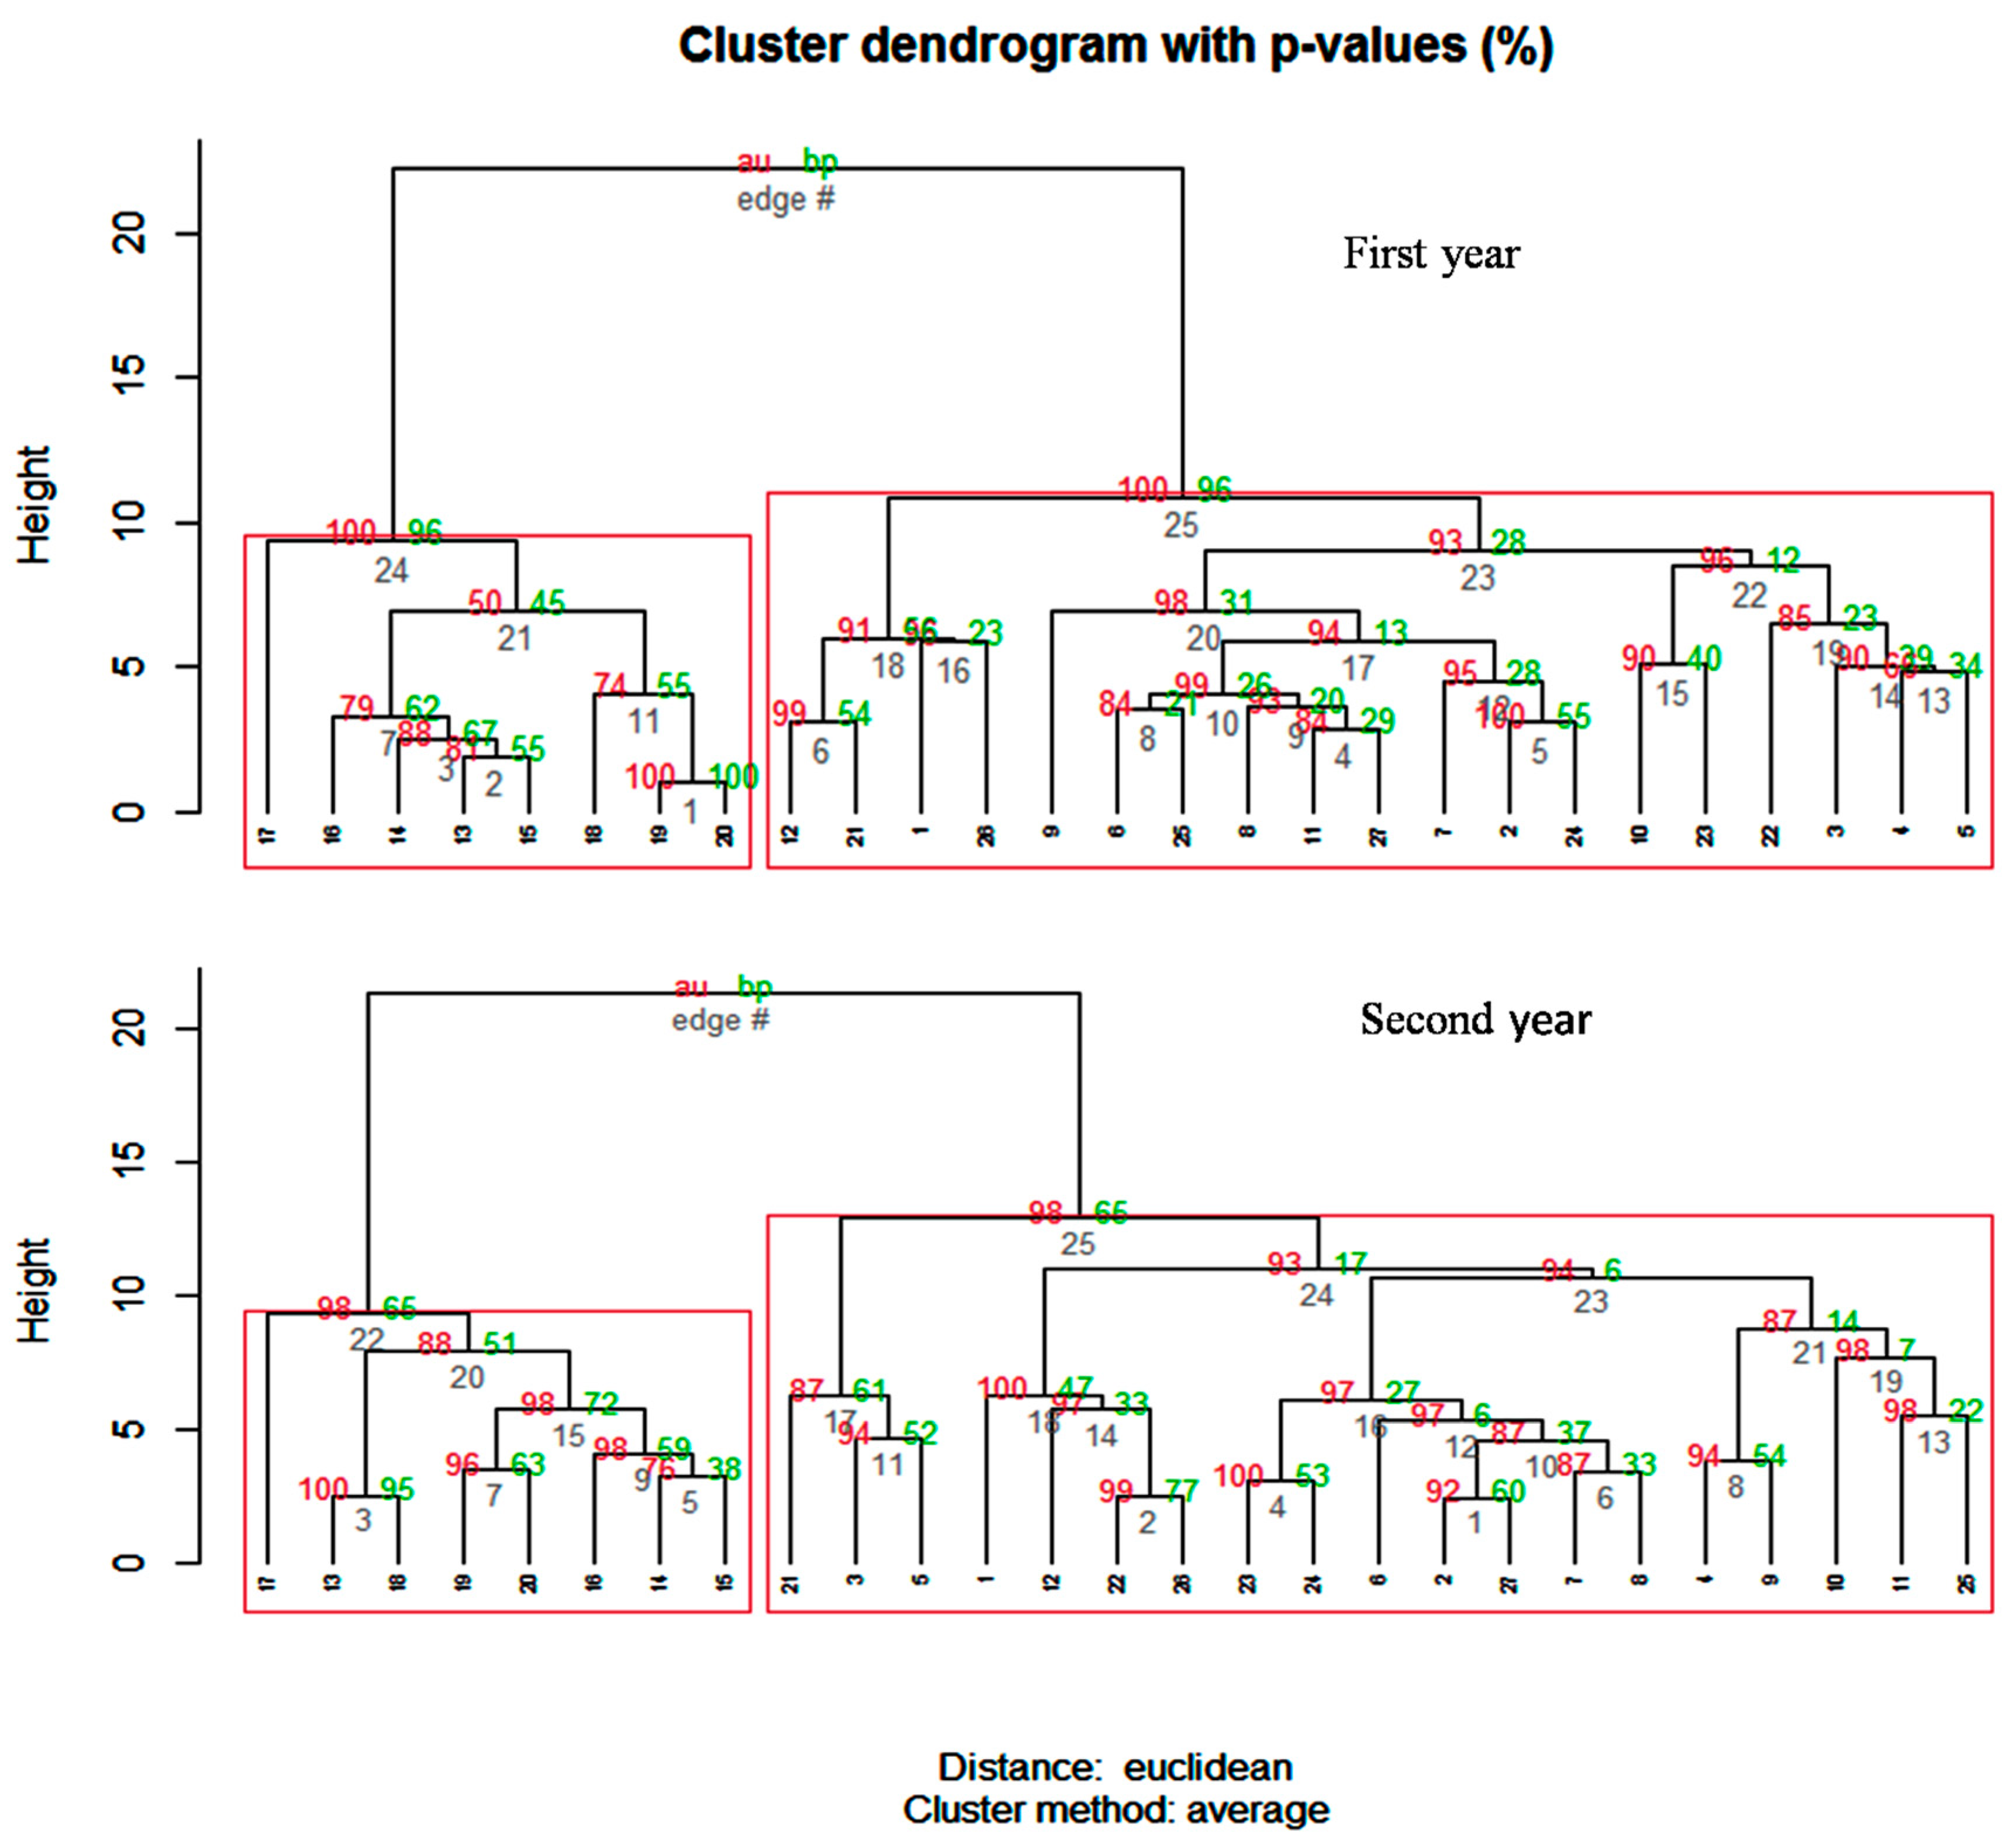
Hiarchical cluster based on 10 agronomic traits for the two years of study presented in Figure 6.
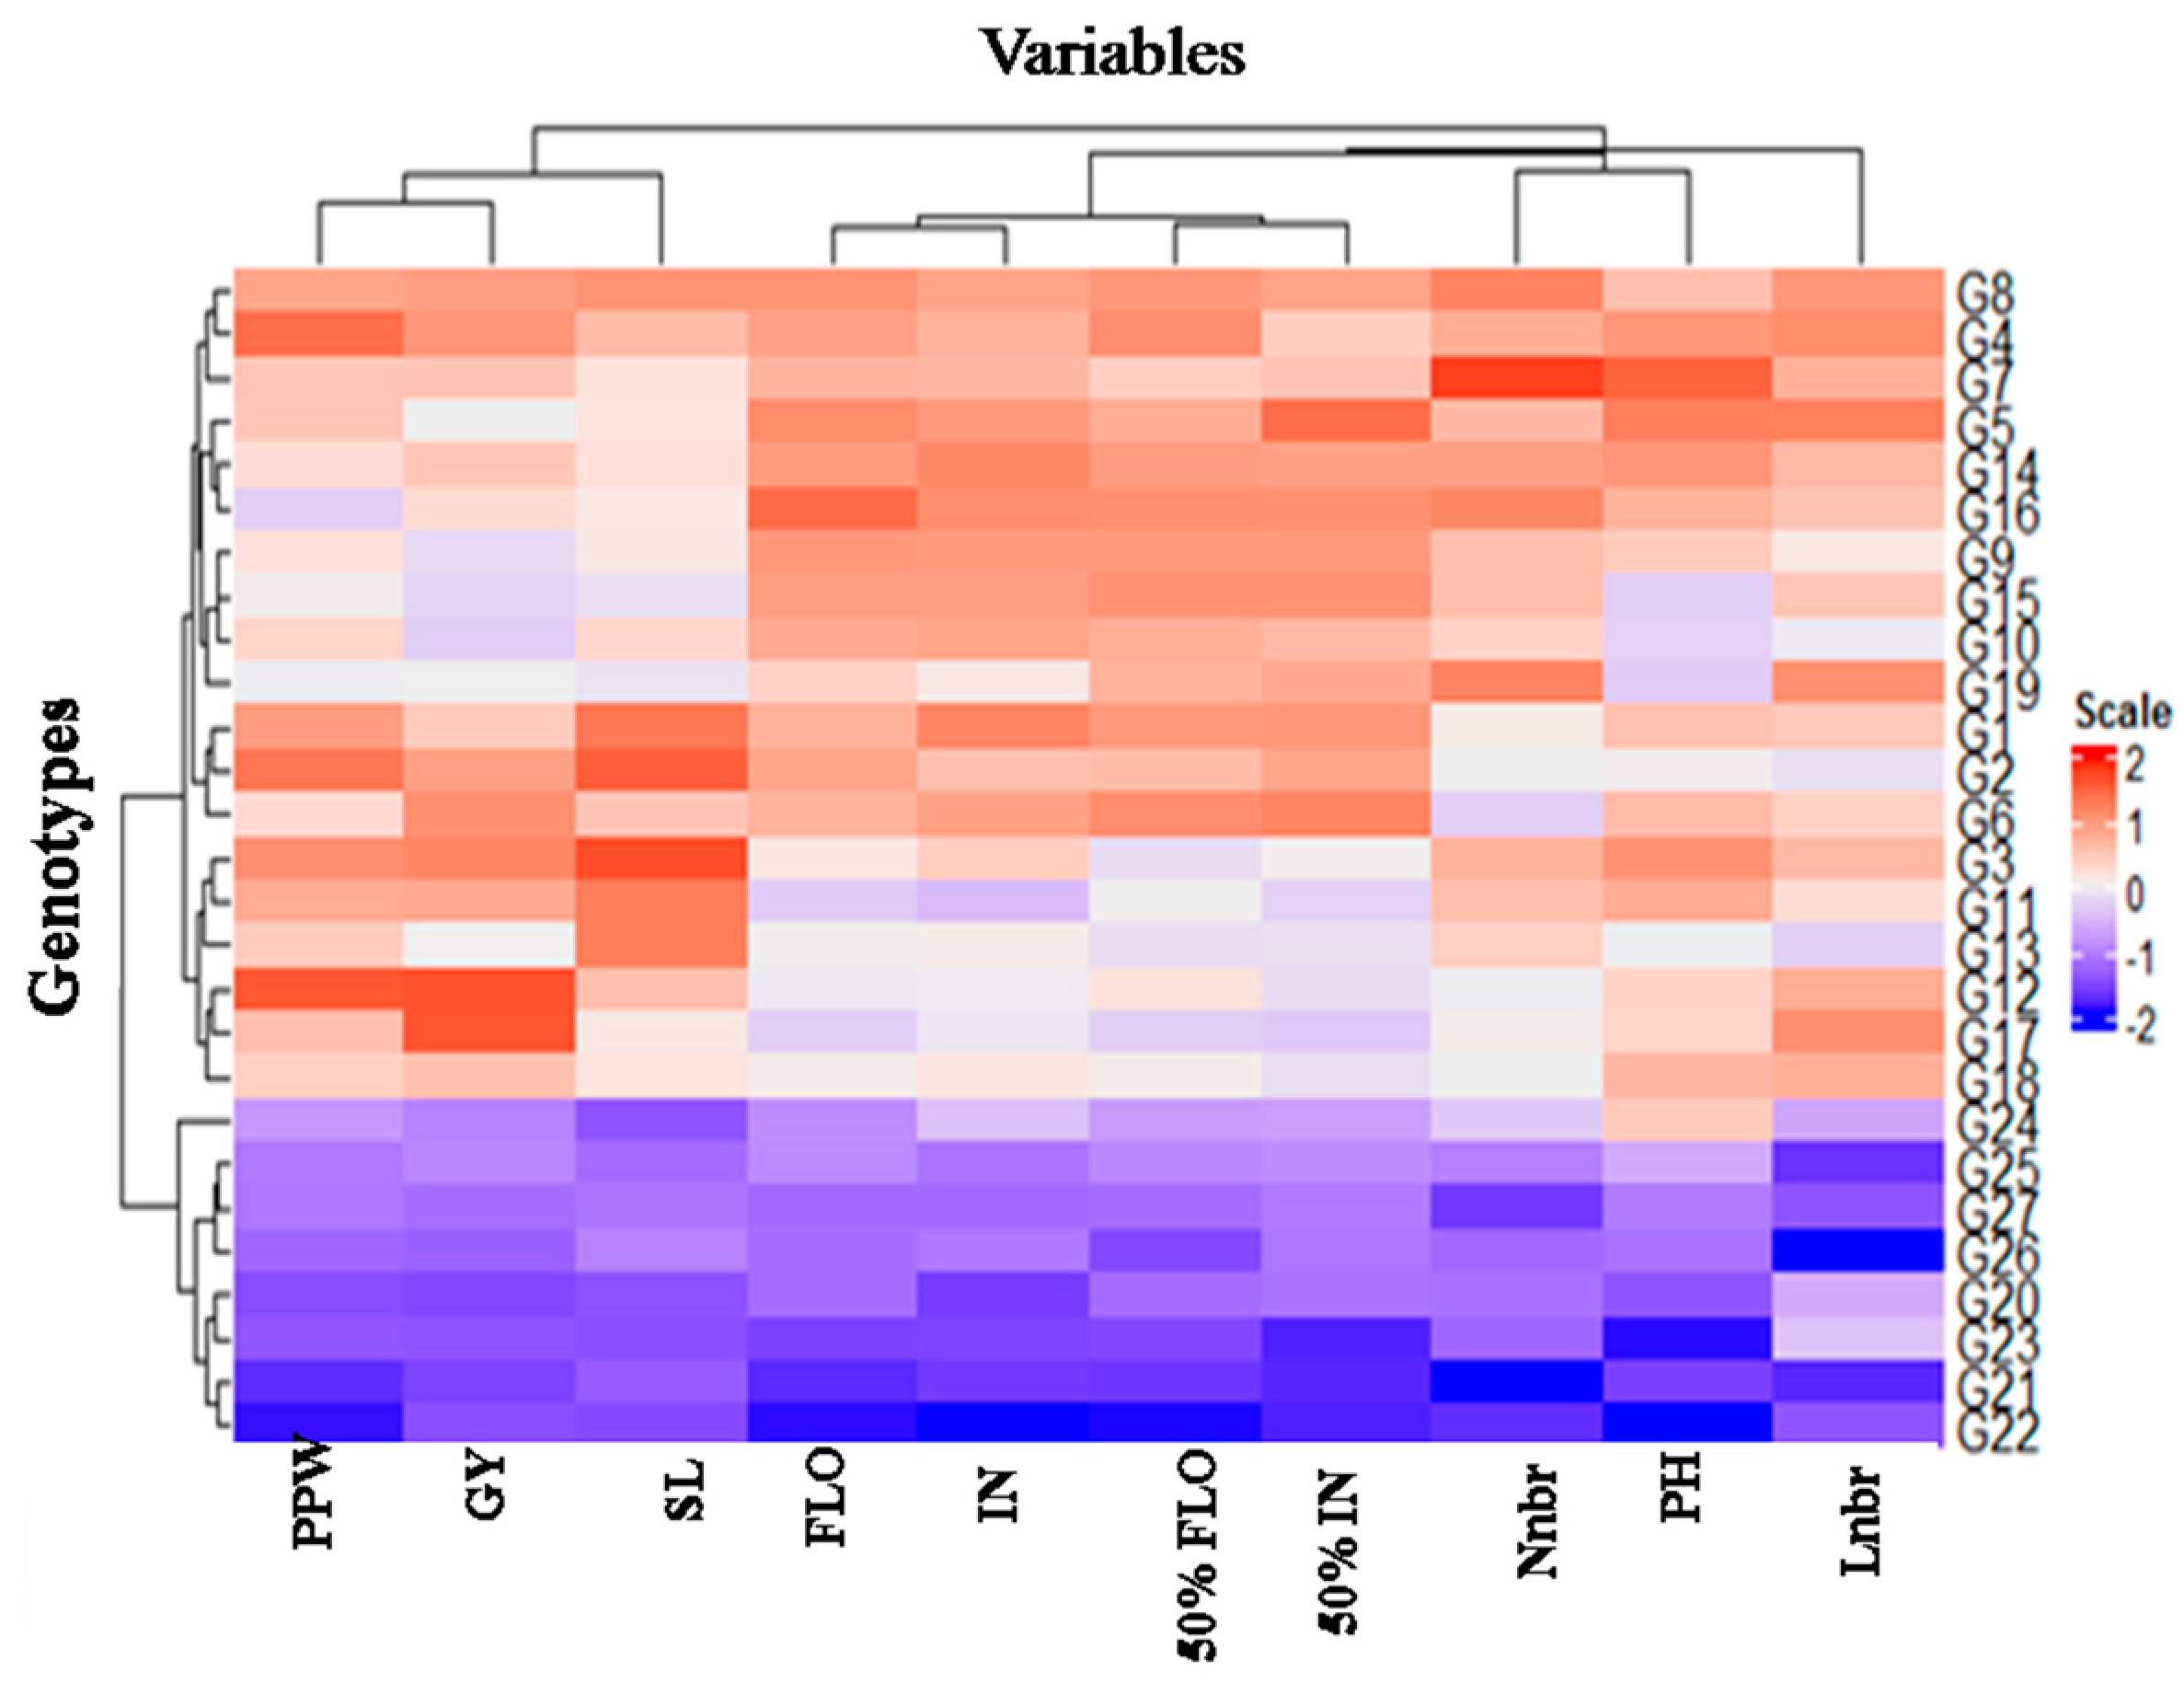
The uncertainty for each cluster was calculated with bootstrap (1000 run) and unbiased p-value. During the two years of experiment, the segregation between the 27 genotypes was translated into two major clusters. For the two years 2019–2020, an interesting similarity was observed; the first major cluster is formed solely with genotypes from the region of Medenine, except G19 and G20. The second major cluster was composed of genotypes from both regions. To further exploit the clustering of genotypes and for a better understanding of this segregation and the impact of each trait, the two-dimensional heatmap (Figure 7) was used.
The heatmap (Figure 7) showed the clustering of the 27 Pearl millet genotypes, based on the BLUPs of their phenotypic value, into two distinct groups. The first group comprises eight genotypes (G20, G21, G22, G23, G24, G25, G26, and G27), originating solely from the zone of Djerba. The majority of genotypes that belong to the second group were collected from the zone of Medenine, except for genotype G19; this group could be further divided into three sub-groups. The first sub-group is composed of ten genotypes (G8, G4, G7, G5, G14, G16, G9, G15, G10 and G16), the second sub-group is formed of three genotypes (G1, G2, G6,), and finally the third sub-group contained four genotypes (G3, G11, G13, G12, G17 and G18). We can observe a clear segregation based on the phenological traits, as all the genotypes that formed the first group originated from Djerba and characterized, according to our study, by a shorter cycle (early initiation and early flowering), in comparison to the second group, which is labeled as containing late genotypes. Our data showed significant phenotypic differences between early- and late-flowering landraces. This precocity is followed by a low performance regarding morphological and grain related traits in comparison to the late genotypes. Interestingly, for the second cluster, the first sub-group is portrayed by genotypes that present with a lower performance, with a late development cycle, the second sub-group in the contrary presented with genotypes with a high performance and prolonged phenological period, and the third subgroup comprises genotypes with a relatively short cycle and high performance, namely G3, G11, G13, G12, G17 and G18, which could be interesting information for Pearl millet breeders.

3.7. Multi-Trait Index Approach (FAI-BLUPS)

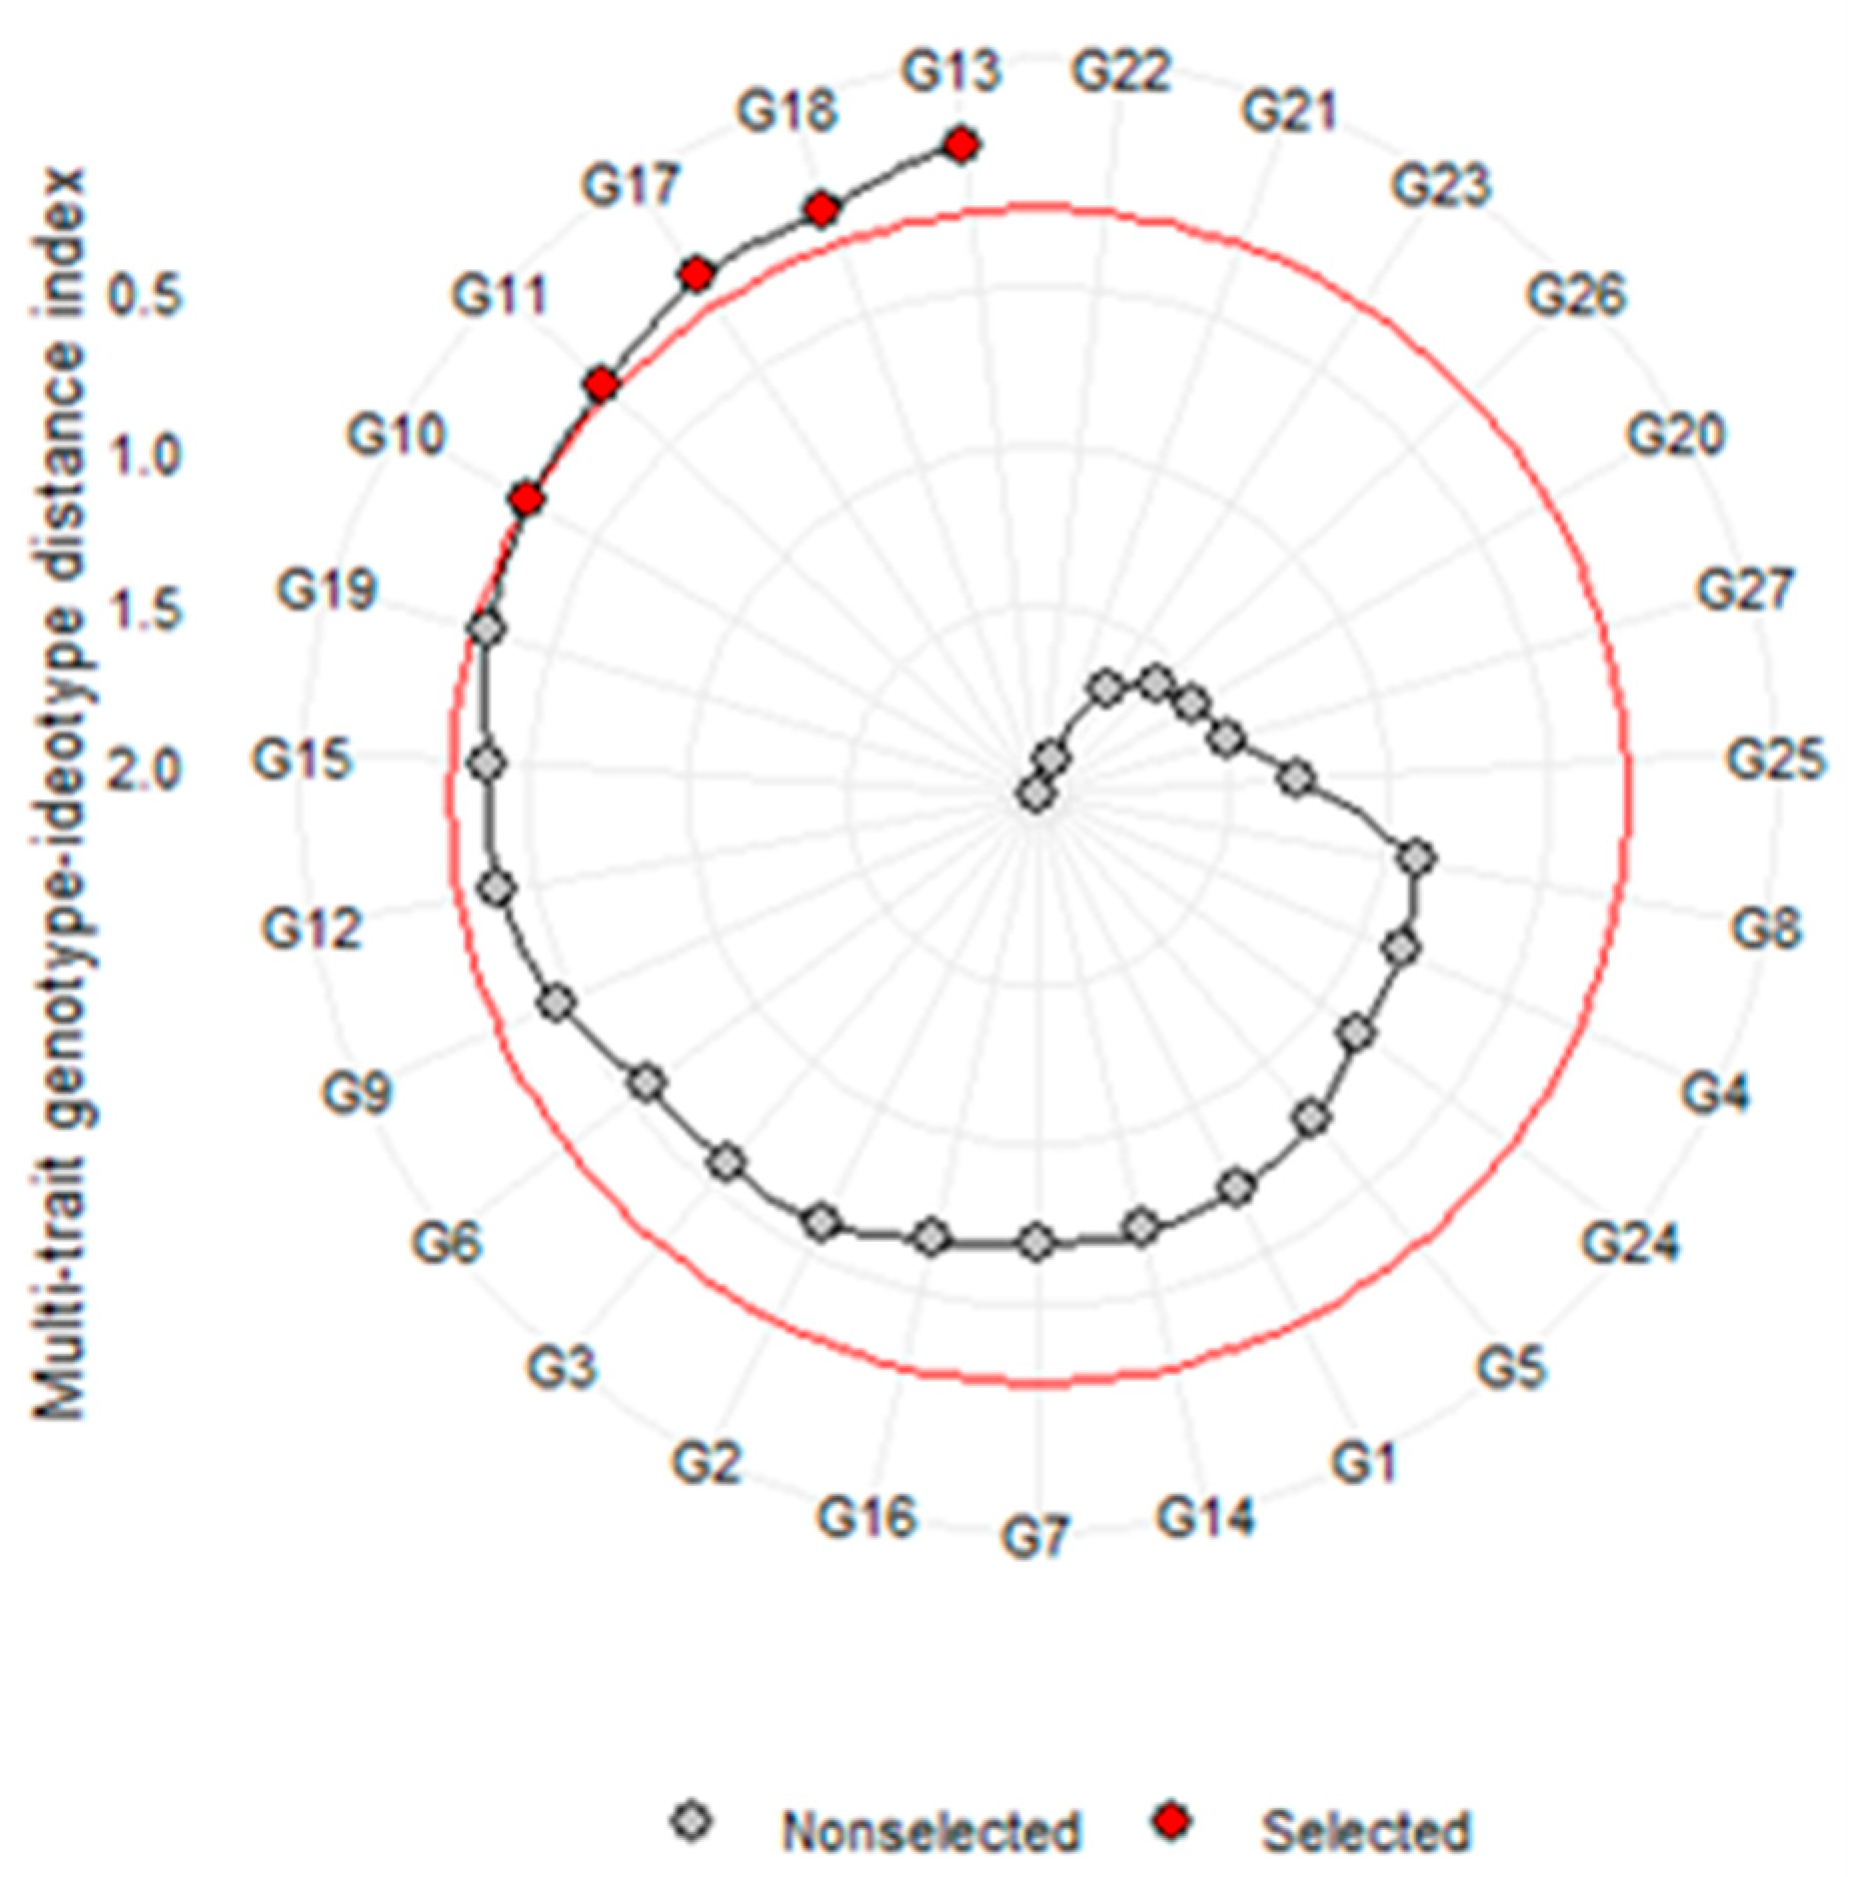
To select potentially high-yielding varieties, superior genotypes must be selected with accuracy. Thus, to account for the multicollinearity problems leading to false conclusions, [28,31,36,37] proposed the FAI-BLUPS, which is a multi-trait selection index based on factor analysis associated with the best linear unbiased prediction. In this study, the selection index FAI- BLUPS [24,31] helped to identify genotypes with traits closer to the desired phenotype, which are a short phenology period (decrease) coupled with a high yield and superior morphological traits (increase) (Figure 8).
In total, four genotypes, namely G13, G18, G17, and G11, showed balanced and desirable genetic gains with equal efficiency to simultaneously improve all the traits [30]. The percentage of selection differentials (SDs), which quantify the fluctuations in the germplasm’s mean traits between pre- and post-selection, presented an increase of 20.7% in GY, with a general decrease of 5% in phenology traits (Table 4).
Furthermore, a total genetic gain of 49.48% was obtained from this selection and distributed between the evaluated traits. All gains were favorable towards the selection criteria, with negative gains for IN (−0.8), 50%IN (−1.97) FLO (−1.07), and 50%FLO (−0.77), and an interesting positive gain for GY (18%), which fits the objective of producing early and high-yielding genotypes. Satisfactory results using this method were reported by several authors [38,39,40,41].

4. Discussion

Plant breeders considered the selection of yield and yield-related agronomic traits as a fundamental step to boost genetic improvements [42,43]. In this study, the significant variation between years and (GxY) could refer to the fluctuations in climatic conditions in the tested site, which remarkably impacted the performance of genotypes. A similar finding was reported by previous studies on Pearl millet and cereals [36,44,45,46]. Our results present considerable phenotypic variations in comparison to other Pearl millet accessions from local germplasm [10,11,38,39,47,48,49,50], which could imply the existence of high genetic diversity among the studied panel. Genotype G22 manifested greater precocity for all the phenological traits, with reduced length, principal panicle and lower productivity in comparison to G12, which is characterized by the most important yield and principal panicle characteristics. According to Singh, Avtar [51,52], grain-yield-related traits are important to inspections of the phenotypic variance and in the selection of genotypes within Pearl millet germplasm. Nevertheless, according to Vesohoski, Marchioro [53] and Casagrande, Mezzomo [42], a bigger panicle does not imply a direct increase in the final yield and, generally, breeders are interested in semi-dwarf and dwarf genotypes to reduce the lodging effect [54,55].
Crop breeding programs’ effectiveness is mostly determined by the availability of genetic variation and the transmission of desirable features. The analysis of genetic variation enables the breeder to determine the best approach to enhance the target qualities. In the current investigation, distinct levels of PCV, GCV, H and MAG were assessed within the evaluated genotypes. For this investigation, higher values of PCV were recorded in comparison to GCV [56,57]. High PCV and GCV values indicate an extensive gene pool that adjusts positively to a favorable environment [58,59].
According to [21,60], all the studied traits were moderately heritable (30–60%), except for GY and PH, which are characterized by low estimates of heritability (<30%). This finding indicates that the observed variation was mainly due to the influence of the environment. The low heritability of GY and PH may be explained by their polygenic nature, where direct and indirect genes have control [61,62]. Additionally, the phenological traits were reported to be under the control of endogenous genes and environmental factors, which could explain the moderate heritability [63]. In contrast to our finding, other works reported high heritability for the studied traits [49,63,64,65]. The difference in heritability magnitude could be due to the selected genotypes, agricultural practices, and environmental conditions [52]. In this context, Ref. [6] mentioned a change in heritability for the same genotypes depending on the cultivation area. In this study, moderate estimates of heritability, coupled with a high GAM, were observed for PPW, SL, GY and Nnbr. According to [66,67], this is the result of the additive gene in trait expression; thus, selection might lead to improvements in the panel. For the traits IN, 50%IN, FLO, 50%FLO moderate heritability was coupled with a low GAM, which suggests the effect that non-additive gene has on these traits. In this case, the majority of the variance is under environmental control; hence, direct selection is not effective. In this case, effective management practices are key to a better performance [56].
In this panel, a clear segregation between early- and late-flowering landraces and their geographical origin was reported by several authors [6,8,68]. In this case, this segregation could be related to genetic differentiation between the two groups of genotypes [24,69]. In arid regions, prioritizing early-flowering genotypes is more rewarding, as a higher temperature is responsible for spikelet sterility and, thus, the decrease in productivity [70]. Consequently, early-flowering Pearl millet genotypes would score higher in arid regions, whereas late-flowering millet would adapt much better in humid ones [23,71,72]. These findings emphasize the need to select varieties within different precocity classes that are appropriate for different agroecological conditions [32,33,41,43]. Based on the heatmap analysis [68], the third subgroup of the second cluster was formed solely of genotypes with a relatively short cycle and high performance, namely, G3, G11, G13, G12, G17 and G18, which could be an interesting future prospect for Pearl millet breeders.
The FAI-BLUPS index was able to select Pearl millet genotypes with above-average production and a flowering period reduced by 50%. Taking these criteria into consideration, this method was able to select the genotypes G13, G18, G17, and G11. An interesting similarity was observed between the results of the heatmap and FAI-BLUPS, which is an indication of the suitability of the selected genotypes for further analysis. The genotypes G3 and G12 were probably not selected by the FAI-BLUPS because the selection intensity was fixed on 20%; an increase in this parameter will generate more suitable genotypes.
Interestingly, with all the studied traits, a positive significant phenotypic and genotypic correlation was observed and associated with grain yield, According to Yuan and Cairns [73], secondary traits with a high correlation with grain yield are likely to be incorporated in the breeding program. This high correlation could be an indication of the co-localization of QTLs within the highly correlated traits [74], especially the significant QTL between flowering time and panicle length that was previously detected in Pearl millet [75]. Similarly, in wheat [76], a QTL for flowering date was discovered to be associated with grain yield. Similarly, other QTL studies suggested that the gene Dwarf8 in maize, which is reportedly responsible for the increase in yield, could also influence plant height and flowering period variation [61,76]. Additionally, our results demonstrated that the productivity of genotypes was positively correlated with Lnbr and PH, probably due to their function in intercepting light, hence increasing the energy efficiency of photosynthesis [77]. PH and Nnbr had significant correlations with phenologycal traits. This strong correlation is the result of the cessation of internodes’ formation at the beginning of the flowering stage, which results in shorter varieties [64]. Similar findings have been reported in earlier Pearl millet studies [78]. In the present study, the PC analysis based on the phenotypic correlation demonstrated the importance of PPW and SL as the main contributing traits for GY. As a result, screening for these features would be beneficial for Pearl millet landraces’ GY improvements. Similarly to our findings, References [79,80,81] reported high direct effects of panicle length on GY.

5. Conclusions

The selection of superior genotypes is needed for cultivation on marginal lands under arid conditions where the environment is unpredictable. In the present investigation, multivariate methods and the multi-trait selection approach FAI-BLUPS were used to characterize local Pearl millet landraces from the south of Tunisia under natural arid conditions. A strong correlation was observed between all the studied traits on the phenotypic and the genotypic level. According to PC, the traits PPW and SL have high direct effects on GY, and thus are an adequate selection criterion to enhance GY. The observed indirect effects were generally low, which suggests that positive correlations were mainly caused by the direct effects. Considering all the parameters, G11, G13, G12, G17, G18 were selected as the best genotypes serving the aim of this study.

Supplementary Materials

The following supporting information can be downloaded at: https://www.mdpi.com/article/10.3390/agronomy13082128/s1, Figure S1: Illustration of the variation in climatic parameters over the two years of study, 2019–2020; Table S1: Selected pearl millet genotypes and origins; Table S2: Climatic conditions for the two years of study 2019–2020; Table S3: Phenotypic variation across 27 pearl millet genotypes based on the BLUPS value of 10 agromorphological traits; Table S3: Phenotypic variation across 27 pearl millet genotypes based on the BLUPS value of 10 agromorphological traits; Table S4. Mean value for the trait PPW for the year 2019 and 2020; Table S5. Mean value for the trait IN for the year 2019 and 2020; Table S6. Mean value for the trait 50%IN for the year 2019 and 2020; Table S7. Mean value for the trait FLO for the year 2019 and 2020; Table S8. Mean value for the trait 50%FLO for the year 2019 and 2020; Table S9. Mean value for the trait P for the year 2019 and 2020; Table S10. Mean value for the trait SL for the year 2019 and 2020; Table S11. Mean value for the trait GYfor the year 2019 and 2020; Table S12. Mean value for the trait Nnbr for the year 2019 and 2020; Table S13. Mean value for the trait Lnbrfor the year 2019 and 2020; Table S14. Phenotypic correlation for 2019; Table S15. Phenotypic correlation for 2020; Table S16. path analysis for 2019; Table S17. path analysis for 2020.

Author Contributions

Conceptualization and methodology: T.T., F.G. and H.Y. Data collection: T.T., F.B., K.B. and H.Y. Data analysis: T.T., L.B. and S.T. Under guidance of F.G. and M.L. Original draft preparation: T.T., L.B. and F.B. Review and editing: T.T., L.B., F.B., S.B.A., S.T., A.G. and F.G. All authors have read and agreed to the published version of the manuscript.

Funding

This work was supported by the Dry Land and Oases Cropping Laboratory in Arid Land Institute of Medenine Tunisia (IRA).

Data Availability Statement

The datasets generated and analysed during the current study are not publicly available because the present research is part of a thesis not yet completed, but are available from the corresponding author on reasonable request.

Acknowledgments

We thank Arid Land Institute of Médenine (IRA) for financing this study and the Tunisian ministry of higher education and scientific research.

Conflicts of Interest

The authors declare no conflict of interest.

References

  1. Srivastava, R.K.; Singh, R.B.; Pujarula, V.L.; Bollam, S.; Pusuluri, M.; Chellapilla, T.S.; Yadav, R.S.; Gupta, R. Genome-wide association studies and genomic selection in Pearl Millet: Advances and prospects. Front. Genet. 2020, 10, 1389. [Google Scholar] [CrossRef] [Green Version]
  2. Yadav, O.; Rai, K. Genetic improvement of pearl millet in India. Agric. Res. 2013, 2, 275–292. [Google Scholar] [CrossRef] [Green Version]
  3. Reddy, V.R.; Jabeen, F.; Sudarshan, M.; Rao, A.S. Studies on genetic variability, heritability, correlation and path analysis in maize (Zea mays L.) over locations. Int. J. Appl. Biol. Pharm. Technol. 2012, 4, 196–199. [Google Scholar]
  4. Nambiar, V.S.; Dhaduk, J.; Sareen, N.; Shahu, T.; Desai, R. Potential functional implications of pearl millet (Pennisetum glaucum) in health and disease. J. Appl. Pharm. Sci. 2011, 1, 62–67. [Google Scholar]
  5. Vigouroux, Y.; Mariac, C.; De Mita, S.; Pham, J.-L.; Gérard, B.; Kapran, I.; Sagnard, F.; Deu, M.; Chantereau, J.; Ali, A. Selection for earlier flowering crop associated with climatic variations in the Sahel. PLoS ONE 2011, 6, e19563. [Google Scholar] [CrossRef] [Green Version]
  6. Anisha, A.; Rajappa, P.; Parashuram, P.; Hemalatha, V.; Dhanyashree, R.; Tonapi, V.A.; Sujatha, K.; Girish, G.; Madhusudhana, R. Selection of post-rainy sorghum landraces combining multi-traits mean performance and stability. Euphytica 2022, 218, 176. [Google Scholar] [CrossRef]
  7. Evenson, R.E.; Gollin, D. Crop Variety Improvement and Its Effect on Productivity: The Impact of International Agricultural Research; Cabi Publishing: Wallingford, England, 2003. [Google Scholar]
  8. Faye, A.; Camara, I.; Diop, M.; OuryDiallo, A.; Sine, B.; Noblet, M.; Faye, B.; Defrance, D.; Sultan, B.; Ndour, N.Y.B. Millet and sorghum yield simulations under climate change scenarios in Senegal. Reg. Environ. Change 2022, 22, 86. [Google Scholar] [CrossRef]
  9. Oumar, B.; Mathieu, A.A.; Brahima, C.; Dossahoua, T. Carbon storage in biomass and soils of four Australian Acacia stands of Anguededou station (South-East of Cote d’Ivoire). Eur. J. Sci. Res. 2007, 19, 25–37. [Google Scholar]
  10. Loumerem, M.; Van Damme, P.; Reheul, D.; Behaeghe, T. Collection and evaluation of pearl millet (Pennisetum glaucum) germplasm from the arid regions of Tunisia. Genet. Resour. Crop Evol. 2008, 55, 1017–1028. [Google Scholar] [CrossRef]
  11. Bouajila, A.; Lamine, M.; Rahali, F.; Melki, I.; Prakash, G.; Ghorbel, A. Pearl millet populations characterized by Fusarium prevalence, morphological traits, phenolic content, and antioxidant potential. J. Sci. Food Agric. 2020, 100, 4172–4181. [Google Scholar] [CrossRef]
  12. Riahi, V.; Momeni, H. Approaches affecting the utilization of agricultural water resources in Central Iran. J. Sustain. Rural. Dev. 2021, 5, 61–72. [Google Scholar]
  13. Varshney, R.K.; Shi, C.; Thudi, M.; Mariac, C.; Wallace, J.; Qi, P.; Zhang, H.; Zhao, Y.; Wang, X.; Rathore, A. Pearl millet genome sequence provides a resource to improve agronomic traits in arid environments. Nat. Biotechnol. 2017, 35, 969–976. [Google Scholar] [CrossRef] [PubMed] [Green Version]
  14. Murty, K.A.; Blackshear, P.L., Jr. Pyrolysis effects in the transfer of heat and mass in thermally decomposing organic solids. In Symposium (International) on Combustion; Elsevier: Amsterdam, The Netherlands, 1967; pp. 517–523. [Google Scholar]
  15. Kumar, R.; Carroll, C.; Hartikainen, A.; Martín, O.A. ArviZ a unified library for exploratory analysis of Bayesian models in Python. J. Open Source Softw. 2019, 4, 1143. [Google Scholar] [CrossRef]
  16. Upadhyay, G.A.; Cherian, T.; Shatz, D.Y.; Beaser, A.D.; Aziz, Z.; Ozcan, C.; Broman, M.T.; Nayak, H.M.; Tung, R. Intracardiac delineation of septal conduction in left bundle-branch block patterns: Mechanistic evidence of left intrahisian block circumvented by His bundle pacing. Circulation 2019, 139, 1876–1888. [Google Scholar] [CrossRef] [PubMed]
  17. Pucher, A.; Sy, O.; Angarawai, I.I.; Gondah, J.; Zangre, R.; Ouedraogo, M.; Sanogo, M.D.; Boureima, S.; Hash, C.T.; Haussmann, B.I. Agro-morphological characterization of west and central African pearl millet accessions. Crop Sci. 2015, 55, 737–748. [Google Scholar] [CrossRef]
  18. Haussmann, B.I.; Fred Rattunde, H.; Weltzien-Rattunde, E.; Traoré, P.S.; Vom Brocke, K.; Parzies, H.K. Breeding strategies for adaptation of pearl millet and sorghum to climate variability and change in West Africa. J. Agron. Crop Sci. 2012, 198, 327–339. [Google Scholar] [CrossRef] [Green Version]
  19. Sukumaran, S.; Dreisigacker, S.; Lopes, M.; Chavez, P.; Reynolds, M.P. Genome-wide association study for grain yield and related traits in an elite spring wheat population grown in temperate irrigated environments. Theor. Appl. Genet. 2015, 128, 353–363. [Google Scholar] [CrossRef]
  20. Singh, R. Biometrical Methods in Quantitative Genetic Analysis; Kalyani Publishing: Ludhiana, India, 1985. [Google Scholar]
  21. Johnson, H.W.; Robinson, H.; Comstock, R. Estimates of genetic and environmental variability in soybeans. Agron. J. 1955, 47, 314–318. [Google Scholar] [CrossRef]
  22. Pimentel, A.J.B.; Guimarães, J.F.R.; Souza, M.A.d.; Resende, M.D.V.; Moura, L.M.; Rocha, J.R.A.S.C.; Ribeiro, G. Estimation of genetic parameters and prediction of additive genetic value for wheat by mixed models. Pesqui. Agropecuária Bras. 2014, 49, 882–890. [Google Scholar] [CrossRef] [Green Version]
  23. Wright, S. The theory of path coefficients a reply to Niles’s criticism. Genetics 1923, 8, 239. [Google Scholar] [CrossRef]
  24. Rocha, J.R.A.S.C.; Machado, J.C.; Carneiro, P.C.S. Multitrait index based on factor analysis and ideotype-design: Proposal and application on elephant grass breeding for bioenergy. GCB Bioenergy 2018, 10, 52–60. [Google Scholar] [CrossRef]
  25. Piepho, H.; Möhring, J.; Melchinger, A.; Büchse, A. BLUP for phenotypic selection in plant breeding and variety testing. Euphytica 2008, 161, 209–228. [Google Scholar] [CrossRef]
  26. Inostroza, L.; del Pozo, A.; Matus, I.; Castillo, D.; Hayes, P.; Machado, S.; Corey, A. Association mapping of plant height, yield, and yield stability in recombinant chromosome substitution lines (RCSLs) using Hordeum vulgare subsp. spontaneum as a source of donor alleles in a Hordeum vulgare subsp. vulgare background. Mol. Breed. 2009, 23, 365–376. [Google Scholar] [CrossRef]
  27. Sivasubramanian, S.; Menon, M. Heterosis and inbreeding depression in rice. Madras Agric. J. 1973, 60, 1139–1140. [Google Scholar]
  28. DeLacy, I.; Basford, K.; Cooper, M.; Bull, J.; McLaren, C. Analysis of multi-environment trials—An historical perspective. Plant Adapt. Crop Improv. 1996, 39124, 39–124. [Google Scholar]
  29. De Resende, M.D.V. Genética Biométrica e Estatística no Melhoramento de Plantas Perenes; Embrapa Informação Tecnológica, Colombo, Embrapa Florestas: Brasília, Brazil, 2002. [Google Scholar]
  30. Olivoto, T.; Lúcio, A.D.; da Silva, J.A.; Marchioro, V.S.; de Souza, V.Q.; Jost, E. Mean performance and stability in multi-environment trials I: Combining features of AMMI and BLUP techniques. Agron. J. 2019, 111, 2949–2960. [Google Scholar] [CrossRef]
  31. Chandra, A.K.; Kumar, A.; Bharati, A.; Joshi, R.; Agrawal, A.; Kumar, S. Microbial-assisted and genomic-assisted breeding: A two way approach for the improvement of nutritional quality traits in agricultural crops. 3 Biotech 2020, 10, 2. [Google Scholar] [CrossRef]
  32. Sood, S.; Khulbe, R.K.; Kumar, A.; Agrawal, P.K.; Upadhyaya, H.D. Barnyard millet global core collection evaluation in the submontane Himalayan region of India using multivariate analysis. Crop J. 2015, 3, 517–525. [Google Scholar] [CrossRef] [Green Version]
  33. Dhanalakshmi, R.; Subramanian, A.; Thirumurugan, T.; Elangovan, M.; Kalaimagal, T. Genetic variability and association studies in barnyard millet (Echinochloa frumentacea (Roxb.) Link) germplasm under sodic soil condition. Electron. J. Plant Breed. 2019, 10, 430–439. [Google Scholar] [CrossRef]
  34. Khan, M.A.; Shaukat, S.S.; Shahzad, A.; Arif, H. Growth and yield responses of pearl millet (Pennisetum glaucum [L.] R. Br.) irrigated with treated effluent from waste stabilization ponds. Pak. J. Bot 2012, 44, 905–910. [Google Scholar]
  35. Teja, D.N.; Lal, G.M.; Krishna, V.S.; Reddy, M.S. Genetic variability and correlation study in chickpea (Cicer aritetinum L.). Int. J. Genet. 2020, 12, 779–783. [Google Scholar]
  36. Al-Otayk, S.M. Evaluation of agronomic traits and assessment of genetic variability in some popular wheat genotypes cultivated in Saudi Arabia. Aust. J. Crop Sci. 2019, 13, 847–856. [Google Scholar] [CrossRef]
  37. Olivoto, T.; Nardino, M. MGIDI: Toward an effective multivariate selection in biological experiments. Bioinformatics 2021, 37, 1383–1389. [Google Scholar] [CrossRef]
  38. Kumar, M.; Rani, K.; Ajay, B.; Patel, M.; Mungra, K.; Patel, M. Multivariate diversity analysis for grain micronutrients concentration, yield and agro-morphological traits in pearl millet (Pennisetum glaucum (L.) R. Br.). Int. J. Curr. Microbiol. Appl. Sci. 2020, 9, 2209–2226. [Google Scholar] [CrossRef]
  39. Bani Hani, N.; Aukour, F.J.; Al-Qinna, M.I. Investigating the Pearl Millet (Pennisetum glaucum) as a Climate-Smart Drought-Tolerant Crop under Jordanian Arid Environments. Sustainability 2022, 14, 12249. [Google Scholar] [CrossRef]
  40. da Silva Junior, A.C.; de Castro Sant’Anna, I.; Peixoto, M.A.; Torres, L.G.; Silva Siqueira, M.J.; da Costa, W.G.; Azevedo, C.F.; Soares, P.C.; Cruz, C.D. Multiple-trait model through Bayesian inference applied to flood-irrigated rice (Oryza sativa L). Euphytica 2022, 218, 124. [Google Scholar] [CrossRef]
  41. Kistner, M.B.; Nazar, L.; Montenegro, L.D.; Cervigni, G.D.L.; Galdeano, E.; Iglesias, J. Detecting sources of resistance to multiple diseases in Argentine maize (Zea mays L.) germplasm. Euphytica 2022, 218, 48. [Google Scholar] [CrossRef]
  42. Casagrande, C.R.; Mezzomo, H.C.; Cruz, C.D.; Borém, A.; Nardino, M. Choosing parent tropical wheat genotypes through genetic dissimilarity based on REML/BLUP. Crop Breed. Appl. Biotechnol. 2020, 20. [Google Scholar] [CrossRef]
  43. Khan, M.H.U.; Wang, S.; Wang, J.; Ahmar, S.; Saeed, S.; Khan, S.U.; Xu, X.; Chen, H.; Bhat, J.A.; Feng, X. Applications of Artificial Intelligence in Climate-Resilient Smart-Crop Breeding. Int. J. Mol. Sci. 2022, 23, 11156. [Google Scholar] [CrossRef]
  44. Hatfield, J.L.; Dold, C. Agroclimatology and wheat production: Coping with climate change. Front. Plant Sci. 2018, 9, 224. [Google Scholar] [CrossRef] [Green Version]
  45. Halilou, O.; Assefa, Y.; Falalou, H.; Abdou, H.; Achirou, B.F.; Karami, S.M.; Jagadish, S.K. Agronomic performance of pearl millet genotypes under variable phosphorus, water, and environmental regimes. Agrosystems Geosci. Environ. 2020, 3, e20131. [Google Scholar] [CrossRef]
  46. Reddy, V.R.P.; Dikshit, H.K.; Mishra, G.P.; Aski, M.; Singh, A.; Bansal, R.; Pandey, R.; Nair, R.M. Comparison of different selection traits for identification of phosphorus use efficient lines in mungbean. PeerJ 2021, 9, e12156. [Google Scholar] [CrossRef] [PubMed]
  47. Mahalakshmi, V.; Bidinger, F.; Raju, D. Effect of timing of water deficit on pearl millet (Pennisetum americanum). Field Crops Res. 1987, 15, 327–339. [Google Scholar] [CrossRef] [Green Version]
  48. Kumar, M.; Xiong, X.; He, M.; Tsang, D.C.; Gupta, J.; Khan, E.; Harrad, S.; Hou, D.; Ok, Y.S.; Bolan, N.S. Microplastics as pollutants in agricultural soils. Environ. Pollut. 2020, 265, 114980. [Google Scholar] [CrossRef]
  49. Govindaraj, M.; Selvi, B.; Rajarathinam, S.; Sumathi, P. Genetic variability and heritability of grain yield components and grain mineral concentration in India’s pearl millet (Pennisetum glaucum (L) R. Br.) accessions. Afr. J. Food Agric. Nutr. Dev. 2011, 11. [Google Scholar] [CrossRef] [Green Version]
  50. Gaudinier, A.; Blackman, B.K. Evolutionary processes from the perspective of flowering time diversity. New Phytol. 2020, 225, 1883–1898. [Google Scholar] [CrossRef] [Green Version]
  51. Singh, M.; Avtar, R.; Kumar, N.; Punia, R.; Pal, A.; Lakra, N.; Kumari, N.; Kumar, D.; Naruka, A.; Bishnoi, M. Genetic Analysis for Resistance to Sclerotinia Stem Rot, Yield and Its Component Traits in Indian Mustard [Brassica juncea (L.) Czern & Coss.]. Plants 2022, 11, 671. [Google Scholar]
  52. Tesfaye, D.; Abakemal, D.; Habte, E. Genetic variability, heritability and genetic advance estimation of highland adapted maize (Zea mays L.) genotypes in Ethiopia. J. Curr. Opin. Crop Sci. 2021, 2, 184–191. [Google Scholar]
  53. Vesohoski, F.; Marchioro, V.S.; Franco, F.d.A.; Cantelle, A. Components of grain yield in wheat and its direct and indirect effects on productivity. Rev. Ceres 2011, 58, 337–341. [Google Scholar] [CrossRef]
  54. Jabbari, M.; Fakheri, B.A.; Aghnoum, R.; Mahdi Nezhad, N.; Ataei, R. GWAS analysis in spring barley (Hordeum vulgare L.) for morphological traits exposed to drought. PLoS ONE 2018, 13, e0204952. [Google Scholar] [CrossRef] [Green Version]
  55. Kumar, S.; Hash, C.T.; Singh, G.; Nepolean, T.; Srivastava, R.K. Mapping QTLs for important agronomic traits in an Iniadi-derived immortal population of pearl millet. Biotechnol. Notes 2021, 2, 26–32. [Google Scholar] [CrossRef]
  56. Vashishtha, A.; Jehan, T.; Lakhanpaul, S. Genetic diversity and population structure of Butea monosperma (Lam.) Taub.—A potential medicinal legume tree. Physiol. Mol. Biol. Plants 2013, 19, 389–397. [Google Scholar] [CrossRef] [PubMed] [Green Version]
  57. Adedugba, A.A.; Adeyemo, O.A.; Adetumbi, A.J.; Amusa, O.D.; Ogunkanmi, L.A. Evaluation of genetic variability for major agro-morphological and stalk sugar traits in African sorghum genotypes. Heliyon 2023, 9, e14622. [Google Scholar] [CrossRef]
  58. Paterson, D.; Whipp, B. Asymmetries of oxygen uptake transients at the on-and offset of heavy exercise in humans. J. Physiol. 1991, 443, 575–586. [Google Scholar] [CrossRef]
  59. de Bello, F.d.; Lepš, J.; Lavorel, S.; Moretti, M. Importance of species abundance for assessment of trait composition: An example based on pollinator communities. Community Ecol. 2007, 8, 163–170. [Google Scholar] [CrossRef]
  60. Bogard, M.; Jourdan, M.; Allard, V.; Martre, P.; Perretant, M.R.; Ravel, C.; Heumez, E.; Orford, S.; Snape, J.; Griffiths, S. Anthesis date mainly explained correlations between post-anthesis leaf senescence, grain yield, and grain protein concentration in a winter wheat population segregating for flowering time QTLs. J. Exp. Bot. 2011, 62, 3621–3636. [Google Scholar] [CrossRef] [PubMed] [Green Version]
  61. Camus-Kulandaivelu, L.; Veyrieras, J.-B.; Madur, D.; Combes, V.; Fourmann, M.; Barraud, S.; Dubreuil, P.; Gouesnard, B.; Manicacci, D.; Charcosset, A. Maize adaptation to temperate climate: Relationship between population structure and polymorphism in the Dwarf8 gene. Genetics 2006, 172, 2449–2463. [Google Scholar] [CrossRef] [Green Version]
  62. Xu, Y.; Wang, X.; Ding, X.; Zheng, X.; Yang, Z.; Xu, C.; Hu, Z. Genomic selection of agronomic traits in hybrid rice using an NCII population. Rice 2018, 11, 32. [Google Scholar] [CrossRef] [Green Version]
  63. Ezeaku, I.; Angarawai, I.; Aladele, S.; Mohammed, S. Genotype by environment interactions and phenotypic stability analysis for yield and yield components in parental lines of pearl millet (Pennisetum glaucum [L.] R. Br). Afr. J. Agric. Res. 2014, 9, 2827–2833. [Google Scholar] [CrossRef] [Green Version]
  64. Troyer, A.; Larkins, J. Selection for early flowering in corn: 10 late synthetics. Crop Sci. 1985, 25, 695–697. [Google Scholar] [CrossRef]
  65. Sharma, D.; Tiwari, A.; Sood, S.; Jamra, G.; Singh, N.; Meher, P.K.; Kumar, A. Genome wide association mapping of agro-morphological traits among a diverse collection of finger millet (Eleusine coracana L.) genotypes using SNP markers. PLoS ONE 2018, 13, e0199444. [Google Scholar] [CrossRef] [Green Version]
  66. Shashibhushan, D.; Kumar, C.S.; Kondi, R.K.R. Principal Component Analysis for Yield and Yield Related Traits in Pearl Millet Cultivars. Ecol. Environ. Conserv. 2022, 28, S104–S107. [Google Scholar]
  67. Parameshwarappa, S.; Salimath, P. Studies on combining ability and heterosis for yield and yield components in sesame, Sesamum indicum L. Green Farming 2010, 3, 91–94. [Google Scholar]
  68. Diack, O.; Kanfany, G.; Gueye, M.C.; Sy, O.; Fofana, A.; Tall, H.; Serba, D.D.; Zekraoui, L.; Berthouly-Salazar, C.; Vigouroux, Y. GWAS unveils features between early-and late-flowering pearl millets. BMC Genom. 2020, 21, 777. [Google Scholar] [CrossRef] [PubMed]
  69. Dussert, Y.; Snirc, A.; Robert, T. Inference of domestication history and differentiation between early-and late-flowering varieties in pearl millet. Mol. Ecol. 2015, 24, 1387–1402. [Google Scholar] [CrossRef]
  70. Shi, W.; Cheng, J.; Wen, X.; Wang, J.; Shi, G.; Yao, J.; Hou, L.; Sun, Q.; Xiang, P.; Yuan, X. Transcriptomic studies reveal a key metabolic pathway contributing to a well-maintained photosynthetic system under drought stress in foxtail millet (Setaria italica L.). PeerJ 2018, 6, e4752. [Google Scholar] [CrossRef] [Green Version]
  71. Rhoné, B.; Defrance, D.; Berthouly-Salazar, C.; Mariac, C.; Cubry, P.; Couderc, M.; Dequincey, A.; Assoumanne, A.; Kane, N.A.; Sultan, B. Pearl millet genomic vulnerability to climate change in West Africa highlights the need for regional collaboration. Nat. Commun. 2020, 11, 5274. [Google Scholar] [CrossRef]
  72. Sultan, B.; Roudier, P.; Quirion, P.; Alhassane, A.; Muller, B.; Dingkuhn, M.; Ciais, P.; Guimberteau, M.; Traore, S.; Baron, C. Assessing climate change impacts on sorghum and millet yields in the Sudanian and Sahelian savannas of West Africa. Environ. Res. Lett. 2013, 8, 014040. [Google Scholar] [CrossRef]
  73. Yuan, Y.; Cairns, J.E.; Babu, R.; Gowda, M.; Makumbi, D.; Magorokosho, C.; Zhang, A.; Liu, Y.; Wang, N.; Hao, Z. Genome-wide association mapping and genomic prediction analyses reveal the genetic architecture of grain yield and flowering time under drought and heat stress conditions in maize. Front. Plant Sci. 2019, 9, 1919. [Google Scholar] [CrossRef] [Green Version]
  74. Paterson, A.H.; Damon, S.; Hewitt, J.D.; Zamir, D.; Rabinowitch, H.D.; Lincoln, S.E.; Lander, E.S.; Tanksley, S. Mendelian factors underlying quantitative traits in tomato: Comparison across species, generations, and environments. Genetics 1991, 127, 181–197. [Google Scholar] [CrossRef] [PubMed]
  75. Saïdou, A.-A.; Mariac, C.; Luong, V.; Pham, J.-L.; Bezançon, G.; Vigouroux, Y. Association studies identify natural variation at PHYC linked to flowering time and morphological variation in pearl millet. Genetics 2009, 182, 899–910. [Google Scholar] [CrossRef] [PubMed] [Green Version]
  76. Peng, S.; Cassman, K.G.; Virmani, S.; Sheehy, J.; Khush, G. Yield potential trends of tropical rice since the release of IR8 and the challenge of increasing rice yield potential. Crop Sci. 1999, 39, 1552–1559. [Google Scholar] [CrossRef] [Green Version]
  77. Calamai, A.; Masoni, A.; Marini, L.; Dell’acqua, M.; Ganugi, P.; Boukail, S.; Benedettelli, S.; Palchetti, E. Evaluation of the agronomic traits of 80 accessions of proso millet (Panicum miliaceum L.) under Mediterranean pedoclimatic conditions. Agriculture 2020, 10, 578. [Google Scholar] [CrossRef]
  78. Kanatti, A.; Rai, K.N.; Radhika, K.; Govindaraj, M.; Sahrawat, K.L.; Rao, A.S. Grain iron and zinc density in pearl millet: Combining ability, heterosis and association with grain yield and grain size. SpringerPlus 2014, 3, 763. [Google Scholar] [CrossRef] [Green Version]
  79. Bhasker, K.; Shashibhushan, D.; Murali Krishna, K.; Bhave, M. Correlation and path analysis for grain yield and it components in pearl millet [Pennisetum glaucum (L). R. Br.]. Bull. Environ. Pharmacol. Life Sci. 2017, 6, 104–106. [Google Scholar]
  80. Rakesh, K.; Srinidhi, R.; Gokulkumar, S.; Nithin, K.; Madhavarao, S.; Sathish, S.; Karthick, A.; Muhibbullah, M.; Osman, S.M. Experimental study on the sound absorption properties of finger millet straw, darbha, and ripe bulrush fibers. Adv. Mater. Sci. Eng. 2021, 2021, 7382044. [Google Scholar] [CrossRef]
  81. Shashibhushan, D.; Kumar, C.S.; Kondi, R.K.R. Genetic Parameters and Association Studies for Yield and Yield Contributing Traits in Pearl Millet Cultivars. Biol. Forum-Int. J. 2022, 14, 416–421. [Google Scholar]
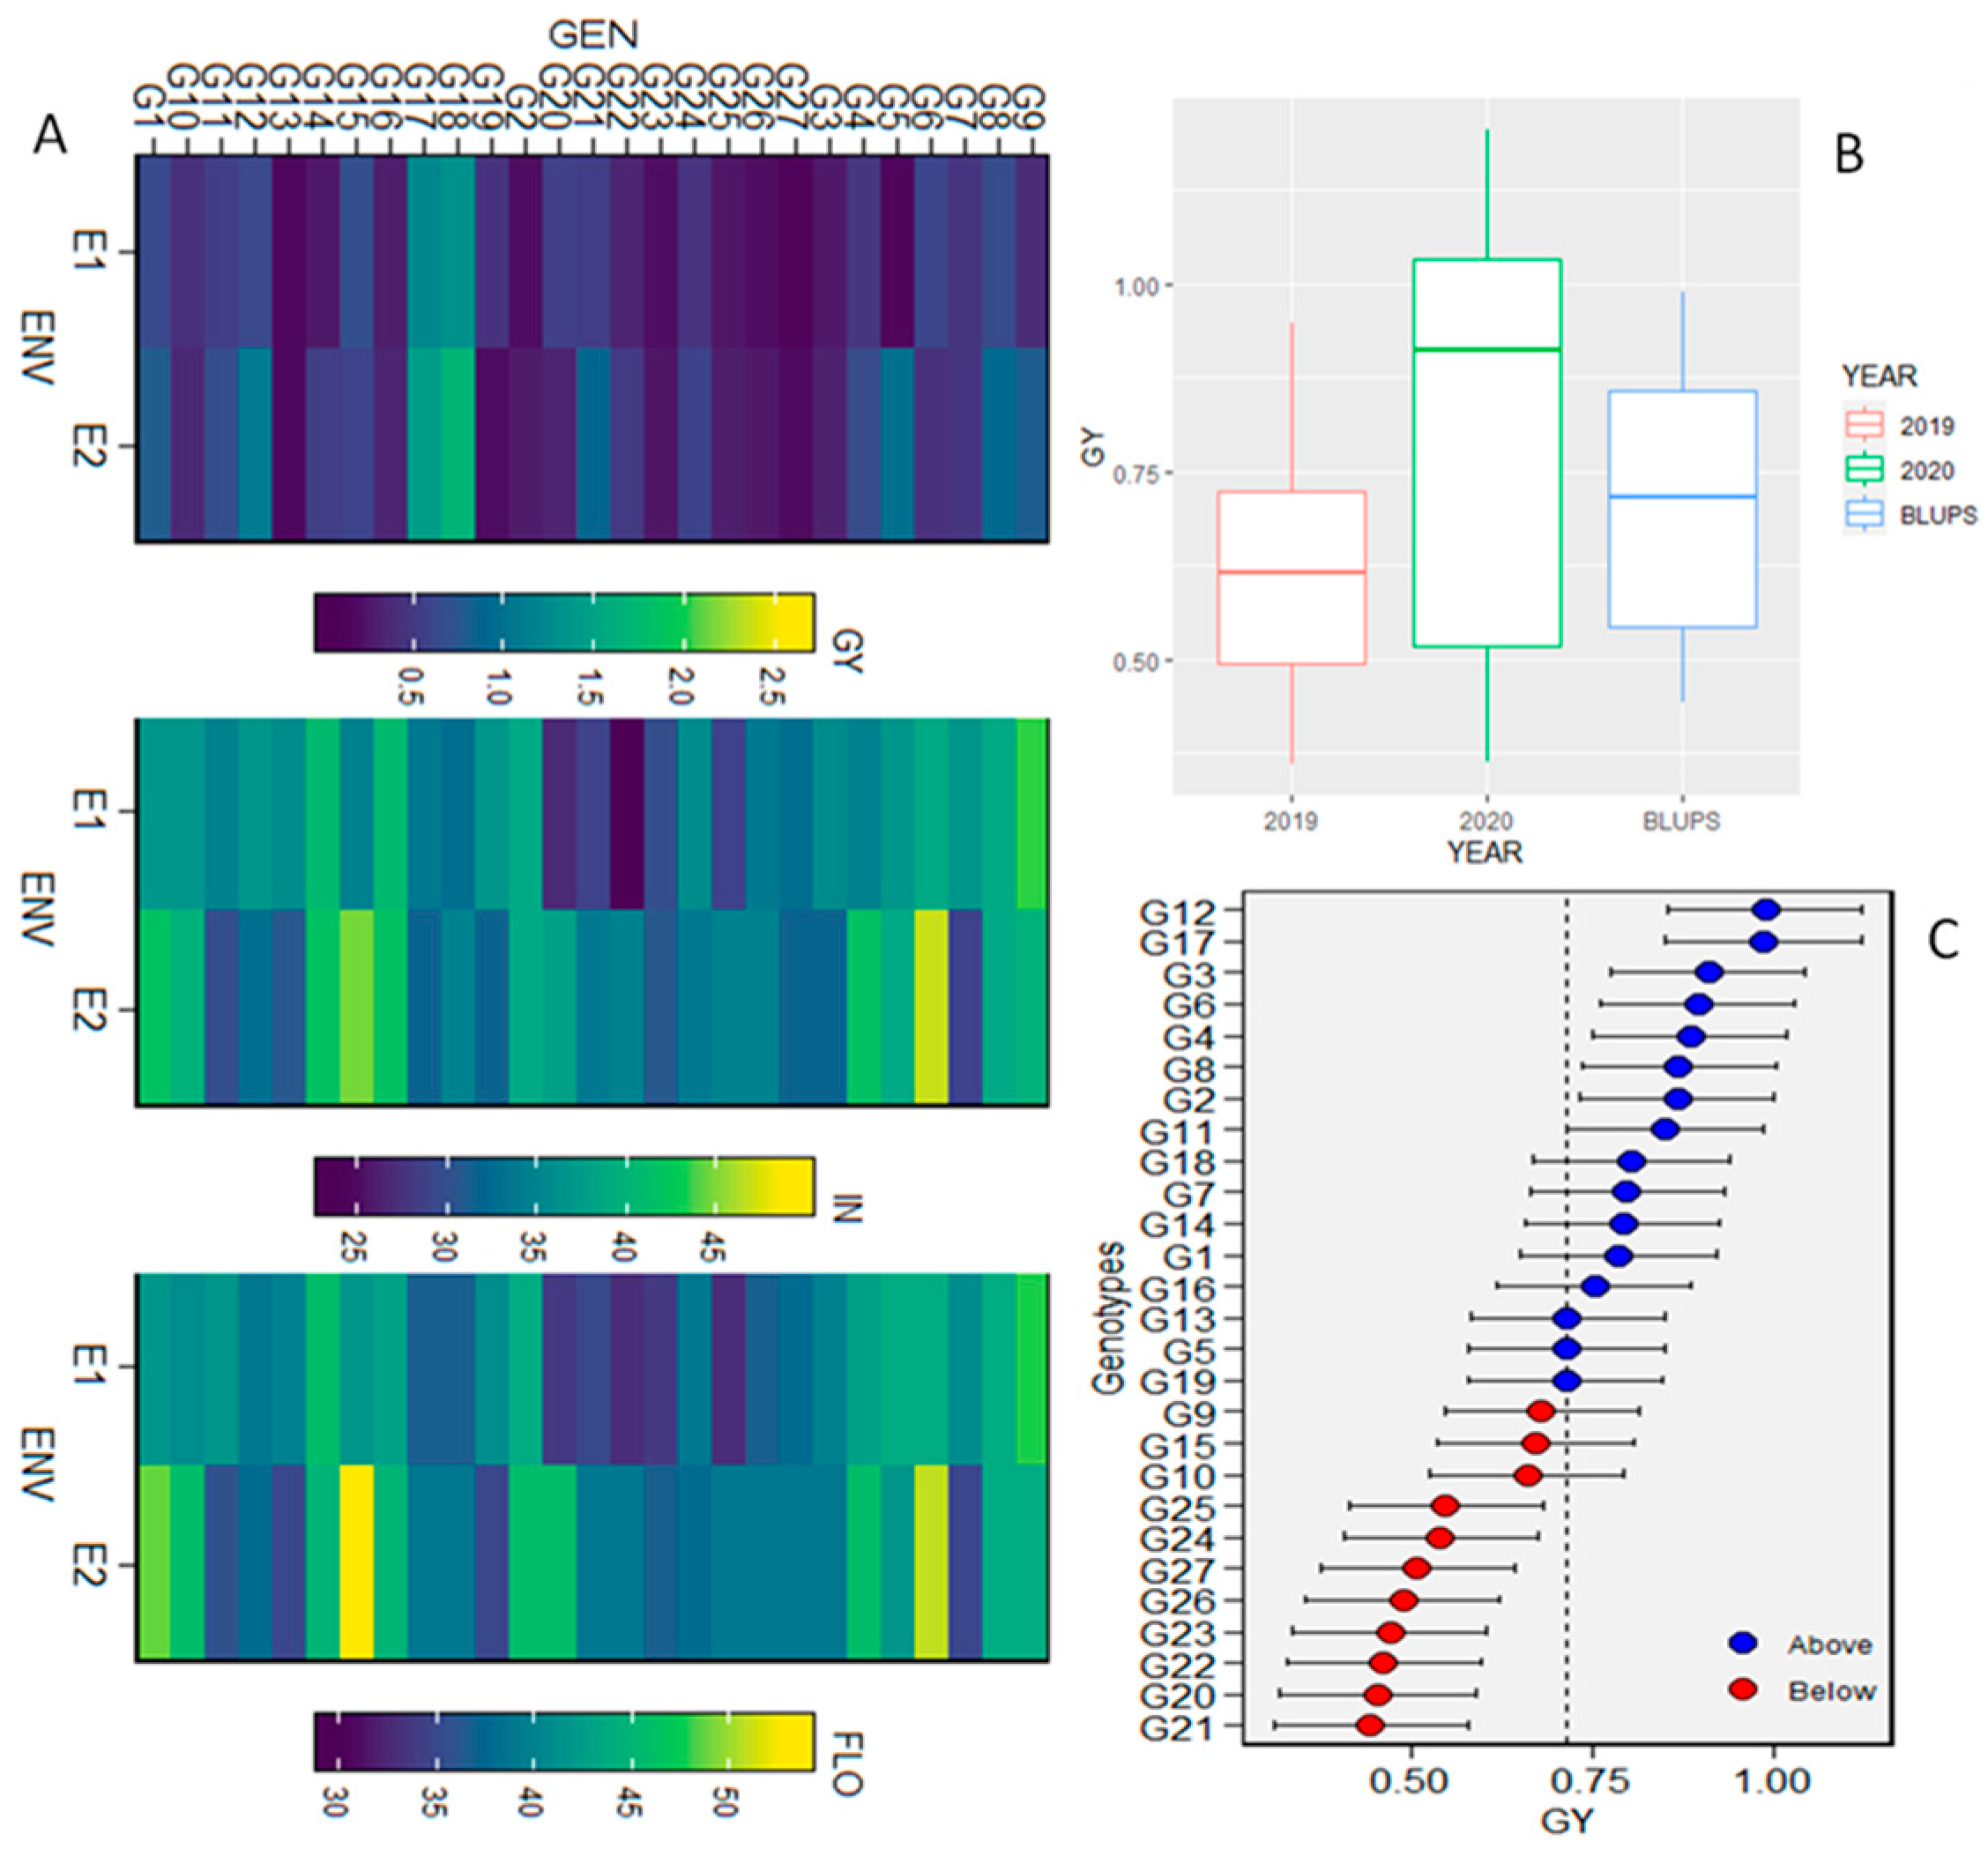
Figure 1. (A). Variation of the traits GY: grain yield, IN: initiation and FLO: floraison across the two years of study. (B). Variation in the trait GY between the years of study 2019–2020 and BLUPs. (C). Variation in the estimated BLUPs values in 27 of Pearl millet landraces. ENV: environment; GEN: genotypes.
Agronomy 13 02128 g001
Figure 2. Phenotypic (upper triangle) and genotypic (lower triangle) correlation coefficients among measured traits in 27 of the evaluated Pearl millet landraces (p < 0.05). Principal panicle weight (PPW); initiation date (IN); 50% of initiation (50%IN); flowering date (FLO); 50% of flowering (50%FLO); plant height (PH); number of leaves per plant (Lnbr); numbers of nods per plant (Nnbr); principal panicle length (SL) and grain yield (GY).
Agronomy 13 02128 g002
Figure 3. Principal component analysis (PCA) of the phenotypic diversity of the investigated 27 pearl millet genotypes during the experimental year of 2019. Principal panicle weight (PPW); initiation date (IN); 50% of initiation (50%IN); flowering date (FLO); 50% of flowering (50%FLO); plant height (PH); number of leaves per plant (Lnbr); numbers of nods per plant (Nnbr); principal panicle length (SL) and grain yield (GY).
Agronomy 13 02128 g003
Figure 4. Principal component analysis (PCA) of the phenotypic diversity of the investigated 27 pearl millet genotypes during the experimental year of 2020. Principal panicle weight (PPW); initiation date (IN); 50% of initiation (50%IN); flowering date (FLO); 50% of flowering (50%FLO); plant height (PH); number of leaves per plant (Lnbr); numbers of nods per plant (Nnbr); principal panicle length (SL) and grain yield (GY).
Agronomy 13 02128 g004
Figure 5. Principal component analysis (PCA) of the phenotypic diversity of the investigated 27 pearl millet genotypes generated from BLUPs value. Principal panicle weight (PPW); initiation date (IN); 50% of initiation (50%IN); flowering date (FLO); 50% of flowering (50%FLO); plant height (PH); number of leaves per plant (Lnbr); numbers of nods per plant (Nnbr); principal panicle length (SL) and grain yield (GY).
Agronomy 13 02128 g005
Figure 6. Hierarchical cluster diagram based on agronomic traits of the 27 pearl millet genotypes based on the experimental years of 2019–2020. The unbiased p-value is presented in red, and the bootstrap probability value is presented in green.
Agronomy 13 02128 g006
Figure 7. Heat map and hierarchical clustering analysis by Euclidian distance using Ward’s method generated from BLUPs value of agro-morphological traits used as variables to segregate 27 pearl millet genotypes. Rows represent the 27 pearl millet genotypes and columns represent the 10 agro-morphological traits presented as variables. The color of the heat map grid indicates the strength of correlation between the traits and genotypes. The level of correlation is indicated by red for positive correlation, blue for negative correlation, and white for the absence of correlation, as demonstrated in the color key at the top left. The package ‘pheatmap’ was used for hierarchical clustering, and Euclidean distances were used to calculate the distance matrix. Principal panicle weight (PPW); initiation date (IN); 50% of initiation (50%IN); flowering date (FLO); 50% of flowering (50%FLO); plant height (PH); number of leaves per plant (Lnbr); numbers of nods per plant (Nnbr); principal panicle length (SL) and grain yield (GY).
Agronomy 13 02128 g007
Figure 8. Pearl millet genotypes’ ranking and genotypes selected using the factor analysis and ideotype-design (FAI-BLUP) index. The selected genotypes are shown in red and the unselected in black circles. The circle represents the cutpoint according to the selection of 20%.
Agronomy 13 02128 g008
Table 1. Estimation of genetic parameters for 10 agronomic traits in 27 of Pearl millet landraces.
PPWIN50%INFLO50%FLOPHSLGYNnbrLnbr
PV64.7320.0121.9318.2921.410.0865.890.152.401.93
GV21.567.8711.628.9911.540.0237.630.041.190.68
H33.3139.3152.9949.1653.9127.4857.1124.1049.4834.99
PCV43.0812.3511.7310.5710.0813.9523.5255.1321.0118.22
GCV24.867.758.547.417.407.3117.7827.0714.7810.78
GA5.523.625.114.335.140.169.550.201.581.00
GAM29.5610.0112.8010.7011.207.9027.6727.3721.4113.13
Accuracy0.8840.8720.9320.9230.9350.9200.9650.8900.9830.969
Mean18.6736.2139.9440.4645.891.9834.510.717.377.63
GV—genotypic variance; PV—phenotypic variance; GCV—genotypic coefficient of variation; PCV—phenotypic coefficient of variation; H—heritability in broad sense; GA—genetic advance; GAM—genetic advance in percent of mean; PPW—principal panicle weight; IN—initiation date; 50%IN—50% of initiation; FLO—flowering date; 50%FLO—50% of flowering; PH—plant height; Lnbr—number of leaves per plant; Nnbr—numbers of nods per plant; SL—principal panicle length and GY—grain yield.
Table 2. Combined analysis of variance, and mean BLUP for 10 morpho-phenological traits of 27 genotypes assessed for two growing seasons.
PPW (g)IN (days)50%INFLO (days)50%FLOPH (m)SL (cm)GYLnbrNnbr
GEN992.2 ***372.0 ***481.5 ***380.2 ***475.7 ***0.8873 ***1453.9 ***1.693 ***25.957 ***44.14 ***
ENV80.1 n.s.661.7 ***613.2 ***523.0 ***2373.8 ***1.4184 ***105.5 ***8.953 ***1.486 ***2.27 ***
GxE216.1 ***88.8 ***63.1 ***56.5 ***60.2 ***0.1365 ***99.3 ***0.353 ***1.586 ***1.46 ***
Residuals 35.77.67.46.57.00.056624.50.1081.2481.19
BLUP-mean18.6736.2039.9440.4645.881.9734.500.717.637.36
BLUP_Range10.91–25.0731.39–39.0334.17–44.3335.17–44.3439.72–49.331.67–2.1725.61–44.220.44–0.996.04–9.024.78–8.67
Principal Panicle Weight (PPW); Initiation Date (IN); 50% of initiation (50%IN); Flowering Date (FLO); 50% of flowering (50%FLO); Plant Height (PH); number of leaves per plant (Lnbr); numbers of nods per plant (Nnbr); principal panicle length (SL) and grain yield (GY). p ≤ 0.0001 (***); while n.s. indicates no significant effect according to two-way anova test.
Table 3. Direct (diagonal) and indirect (off-diagonal) phenotypic effects of contributing traits on GY of 27 Pearl millet landraces.
PPWIN50%INFLO50%FLOPHSLNnbrLnbrPhc
PPW0.538−0.084−0.079−0.0950.1370.2060.1920.251−0.1400.925
IN0.418−0.108−0.105−0.1220.1690.2110.1540.243−0.1580.702
INN0.389−0.104−0.109−0.1220.1700.1960.1460.237−0.1540.647
FLO0.411−0.106−0.106−0.1250.1710.2030.1520.245−0.1620.683
FLOO0.419−0.104−0.106−0.1220.1750.1990.1510.254−0.1580.708
PH0.435−0.090−0.084−0.1000.1370.2540.1510.242−0.1560.790
SL0.492−0.080−0.076−0.0900.1260.1830.2100.210−0.1300.844
Nnbr0.424−0.082−0.081−0.0960.1400.1930.1380.319−0.1550.800
Lnbr0.403−0.092−0.090−0.1090.1480.2130.1470.265−0.1860.699
Principal panicle weight (PPW); initiation date (IN); 50% of initiation (50%IN); flowering date (FLO); 50% of flowering (50%FLO); plant height (PH); number of leaves per plant (Lnbr); numbers of nods per plant (Nnbr); principal panicle length (SL) and Phenotypic correlation (Phc).
Table 4. Predicted genetic gains for the factor analysis and ideotype-design (FAI-BLUP) index.
TraitXoXsSDSDpercHSGSGpercSense
PPW18.721.32.6514.20.9252.4513.1increa
IN36.235.9−0.308−0.8500.945−0.291−0.803decrea
50%IN39.939.1−0.820−2.050.961−0.788−1.97decrea
FLO40.540.0−0.454−1.120.957−0.434−1.07decrea
50%FLO45.945.5−0.372−0.8110.955−0.356−0.775decrea
PH1.972.040.06223.150.8830.05492.78increa
SL34.538.84.2612.40.9654.1111.9increa
GY0.7130.8610.14820.70.8670.12818.0increa
Nnbr7.377.830.4656.310.9470.4405.98increa
Lnbr7.637.830.1972.580.9090.1792.34increa
Xo: mean value before selection; XS: mean value after selection; SD: difference in mean before and after selection; SDperc: difference before and after selection in percentage; H: heritability after selection; SG: selection gain; SGperc: selection gain in percentage; sense: selection ideotype criteria. Principal panicle weight (PPW); initiation date (IN); 50% of initiation (50%IN); flowering date (FLO); 50% of flowering (50%FLO); plant height (PH); number of leaves per plant (Lnbr); numbers of nods per plant (Nnbr); principal panicle length (SL) and grain yield (GY).
Disclaimer/Publisher’s Note: The statements, opinions and data contained in all publications are solely those of the individual author(s) and contributor(s) and not of MDPI and/or the editor(s). MDPI and/or the editor(s) disclaim responsibility for any injury to people or property resulting from any ideas, methods, instructions or products referred to in the content.