Article

The Influence of Climatic Conditions and Agronomic Practices on Greenhouse Gas Emissions in a Conventional Vineyard (DOCa. Rioja, Spain)

by
Estíbaliz Rodrigo García
,
Rebeca Murillo Peña
,
Eva Pilar Pérez Álvarez
,
Teresa Garde Cerdán
and
José María Martínez Vidaurre
*
Instituto de Ciencias de la Vid y del Vino (Gobierno de La Rioja, Universidad de La Rioja, CSIC), Finca La Grajera, Ctra De Burgos km 6, 26007 Logroño, Spain
*
Author to whom correspondence should be addressed.
Agronomy 2023, 13(9), 2199; https://doi.org/10.3390/agronomy13092199
Submission received: 30 July 2023 / Revised: 17 August 2023 / Accepted: 21 August 2023 / Published: 22 August 2023
(This article belongs to the Special Issue Effects of Tillage, Cover Crop and Crop Rotation on Soil)

Abstract

:
Greenhouse gas (GHG) emissions are influenced by physical, chemical, biological, and anthropogenic factors. The objective of the study is to carry out a comprehensive analysis of the emissions of three important agricultural GHGs (CO2, N2O, and CH4) in both rows and alleys of a vineyard (1) and to understand their interactions with the agricultural operations carried out in the experimental plot, namely tillage, inter-row management, application of mineral and organic fertilizers, and irrigation and pruning, as well as the agroclimatic conditions of the plot (2). The study was conducted in a vineyard of Vitis vinifera L. cv. Tempranillo blanco in the DOCa. Rioja grape-growing region, during 2017, 2018, and 2019. Cumulative CO2 emissions were highest in 2018, reaching 934.7 ± 66.5 kg ha−1 day−1 in the alleys and 926.8 ± 76.5 kg ha−1 day−1 in the rows, in agreement with the wetter year and organic matter decomposition at the end of 2017. N2O emissions during the three-year study were mainly affected by mineral fertilizer application, with increases of 41.1 g ha−1 day−1 in the alleys and 49.3 g ha−1 day−1 in the rows during 2018, and 33.1 g ha−1 day−1 in the alleys and 39.6 g ha−1 day−1 in the rows in 2019. Regarding CH4, anaerobic soil conditions in 2018 (the year with the highest rainfall) led to the highest flux of CH4 emissions to the atmosphere, with 215.5 ± 51.0 g ha−1 day−1 in the corridors and 238.4 ± 54.9 g ha−1 day−1 in the rows. This study emphasizes the complex interplay of physical, chemical, biological, and human-related factors affecting GHG emissions in viticultural soils. Understanding these dynamics is essential for developing sustainable vineyard practices that minimize emissions and contribute to climate change mitigation.

1. Introduction

Global warming, caused by the increase in greenhouse gas (GHG) emissions, has become one of the main issues affecting the environment [1]. The Intergovernmental Panel on Climate Change (IPCC) has estimated that human activities have caused global warming of approximately 1.0 °C and recommended limiting it to 1.5 °C to avoid extreme heat events and disruptions in insect and plant phenology [2]. According to the panel, CO2 is responsible for 70–80% of total GHG emissions in agriculture, while CH4 represents 10–12%, and N2O accounts for 5–7%. Deforestation for agricultural expansion also contributes to CO2 emissions by reducing the ecosystem’s ability to absorb and store carbon. However, agriculture can also be part of the climate change solution by adopting sustainable practices and improving organic waste management. For instance, using organic fertilizers instead of synthetic ones can reduce nitrous oxide emissions, and soil management practices can enhance soil carbon sequestration [3].
CO2 is the primary GHG contributing to global warming. Anthropogenic activities not only affect the atmospheric composition but also have a significant impact on the soil system globally. Soils, as major carbon stores, play a crucial role in regulating atmospheric CO2 concentrations [4]. In agricultural activities, CO2 production results from root respiration and organic matter decomposition, influenced by soil temperature and moisture [5]. Studies by Rey et al. [6] on forest respiration in central Italy found that soil temperature and moisture explained over 91% of the annual variation observed. Precipitation and irrigation water also influence gas emissions, as shown by Yu et al. [7], who found correlations of 54.8% to 62.2% between CO2 emissions and soil moisture in different vineyard plots.
Moreover, carbon dioxide release is related to agricultural practices, as soil management influences its organic carbon content [8]. Tilled soils can emit more CO2 than untilled soils, as tillage creates a favorable environment for soil microorganisms to decompose organic residues [9]. Studies like that of Franco-Luesma et al. [10] have linked tillage and irrigation to carbon cycling in the soil, finding significant impacts on soil carbon dynamics. Additionally, the implementation and management of cover crops, along with compost addition, influence soil carbon dynamics, nutrient availability, and microbial activity [11].
N2O is a significant greenhouse gas generated through nitrification–denitrification processes, responsible for ozone layer depletion, increased global warming, and climate change [12]. The excessive use of nitrogen fertilizers contributes to higher atmospheric N2O concentrations [13,14]. Management practices such as irrigation, fertilizer type, soil mineral N content, total organic carbon, dissolved organic carbon in soil water-filled pores, and temperature also influence N2O emissions [15]. Meijide et al. [16] studied the influence of organic and mineral fertilizers on nitrification and denitrification processes in maize cultivation, obtaining emission ranges between 6.0 and 9.3 kg N ha−1.
On the other hand, CH4 is released in soils through the process of methanogenesis under anaerobic conditions. Simultaneously, it is consumed by methanotrophic microorganisms that utilize both oxygen (O2) and methane (CH4) for their metabolism [17]. Along with nitrous oxide, CH4 has increased in concentration due to land use changes and intensified agriculture. Soils can act as weak CH4 sinks or sources, depending mainly on soil moisture differences [18].
Regarding vineyard cultivation, a conventional vineyard has two distinct zones: rows and alleys. Each zone receives different agronomic practices, potentially leading to different GHG emissions. Previous studies by Yu et al. [7] observed that CO2 release is influenced by climatic conditions, with correlations between CO2 emissions and soil moisture ranging from 54.8% to 62.2% in different vineyard plots. For N2O, Garland et al. [19] found that N fertigation in rows had a greater impact on N2O emissions, while alleys were more influenced by cover crop management and precipitation. In vineyard soils, Livesley et al. [18] observed both weak CH4 sinks (−3.0 μg m−2 h−1) and weak CH4 sources (16.0 μg m−2 h−1) depending on soil moisture differences.
Currently, few studies address the relationship between GHG emissions in the rows and alleys of commercial vineyards located in a Mediterranean climate. Therefore, the objective of this study was to measure CO2, CH4, and N2O fluxes over three consecutive years and evaluate their influence based on climatic parameters such as air and soil temperature, as well as atmospheric and soil moisture. The study was conducted under conventional soil management, with cultivator tillage in alleys and inter-row plowing. Additionally, the impact of other agronomic practices, such as nitrogen fertilization and organic amendments, on GHG fluxes in the vineyard ecosystem was analyzed.

2. Materials and Methods

2.1. Plot Description and Experimental Design

This study was conducted during the years 2017, 2018, and 2019 in a commercial vineyard covering 1.11 hectares (Longitude: 2°31′05.0″ W; Latitude: 42°26′27.2″ N; 384 m above sea level) located in the Rioja Alta subzone of the DOCa. Rioja (Figure S1), with an average slope of 1%. The vineyard consisted of Vitis vinifera L. cv. Tempranillo Blanco grafted onto Richter-110 (R-110) rootstock and was in full production. The spacing between the alleys and between the vines within the rows was 3 and 1.1 m, respectively (Figure S1). The 14-year-old vegetative material had row-oriented northwest–southeast and a bilateral Royat cordon training system.
To carry out the study, three nonadjacent subplots were selected, each consisting of one row and two alleys, serving as replicates. Within each row, a total of 50 uniform vines were marked based on their development, growth, general appearance, and health conditions.
Agronomic practices implemented in the vineyard included drip irrigation during the driest years (2017 and 2019) in July, the incorporation of pruning residues into the soil obtained in November, the management of spontaneous cover through cultivation to eliminate weeds throughout the plant’s vegetative period, and N–P–K mineral fertilization applied between March and May of each study year at a rate of 300 kg per hectare. Additionally, in November 2017, semi-composted cow manure was applied at a dose of 15,000 kg per hectare, which was immediately covered by carrying out tillage in the alleys of the vineyard. This facilitated the integration of organic manure with soil aggregates. The different agricultural operations are grouped in Table S1.
Regarding gas emission measurements, they began on April 2017, coinciding with the vine bud break, and concluded in November 2019 with the vineyard’s vegetative dormancy.

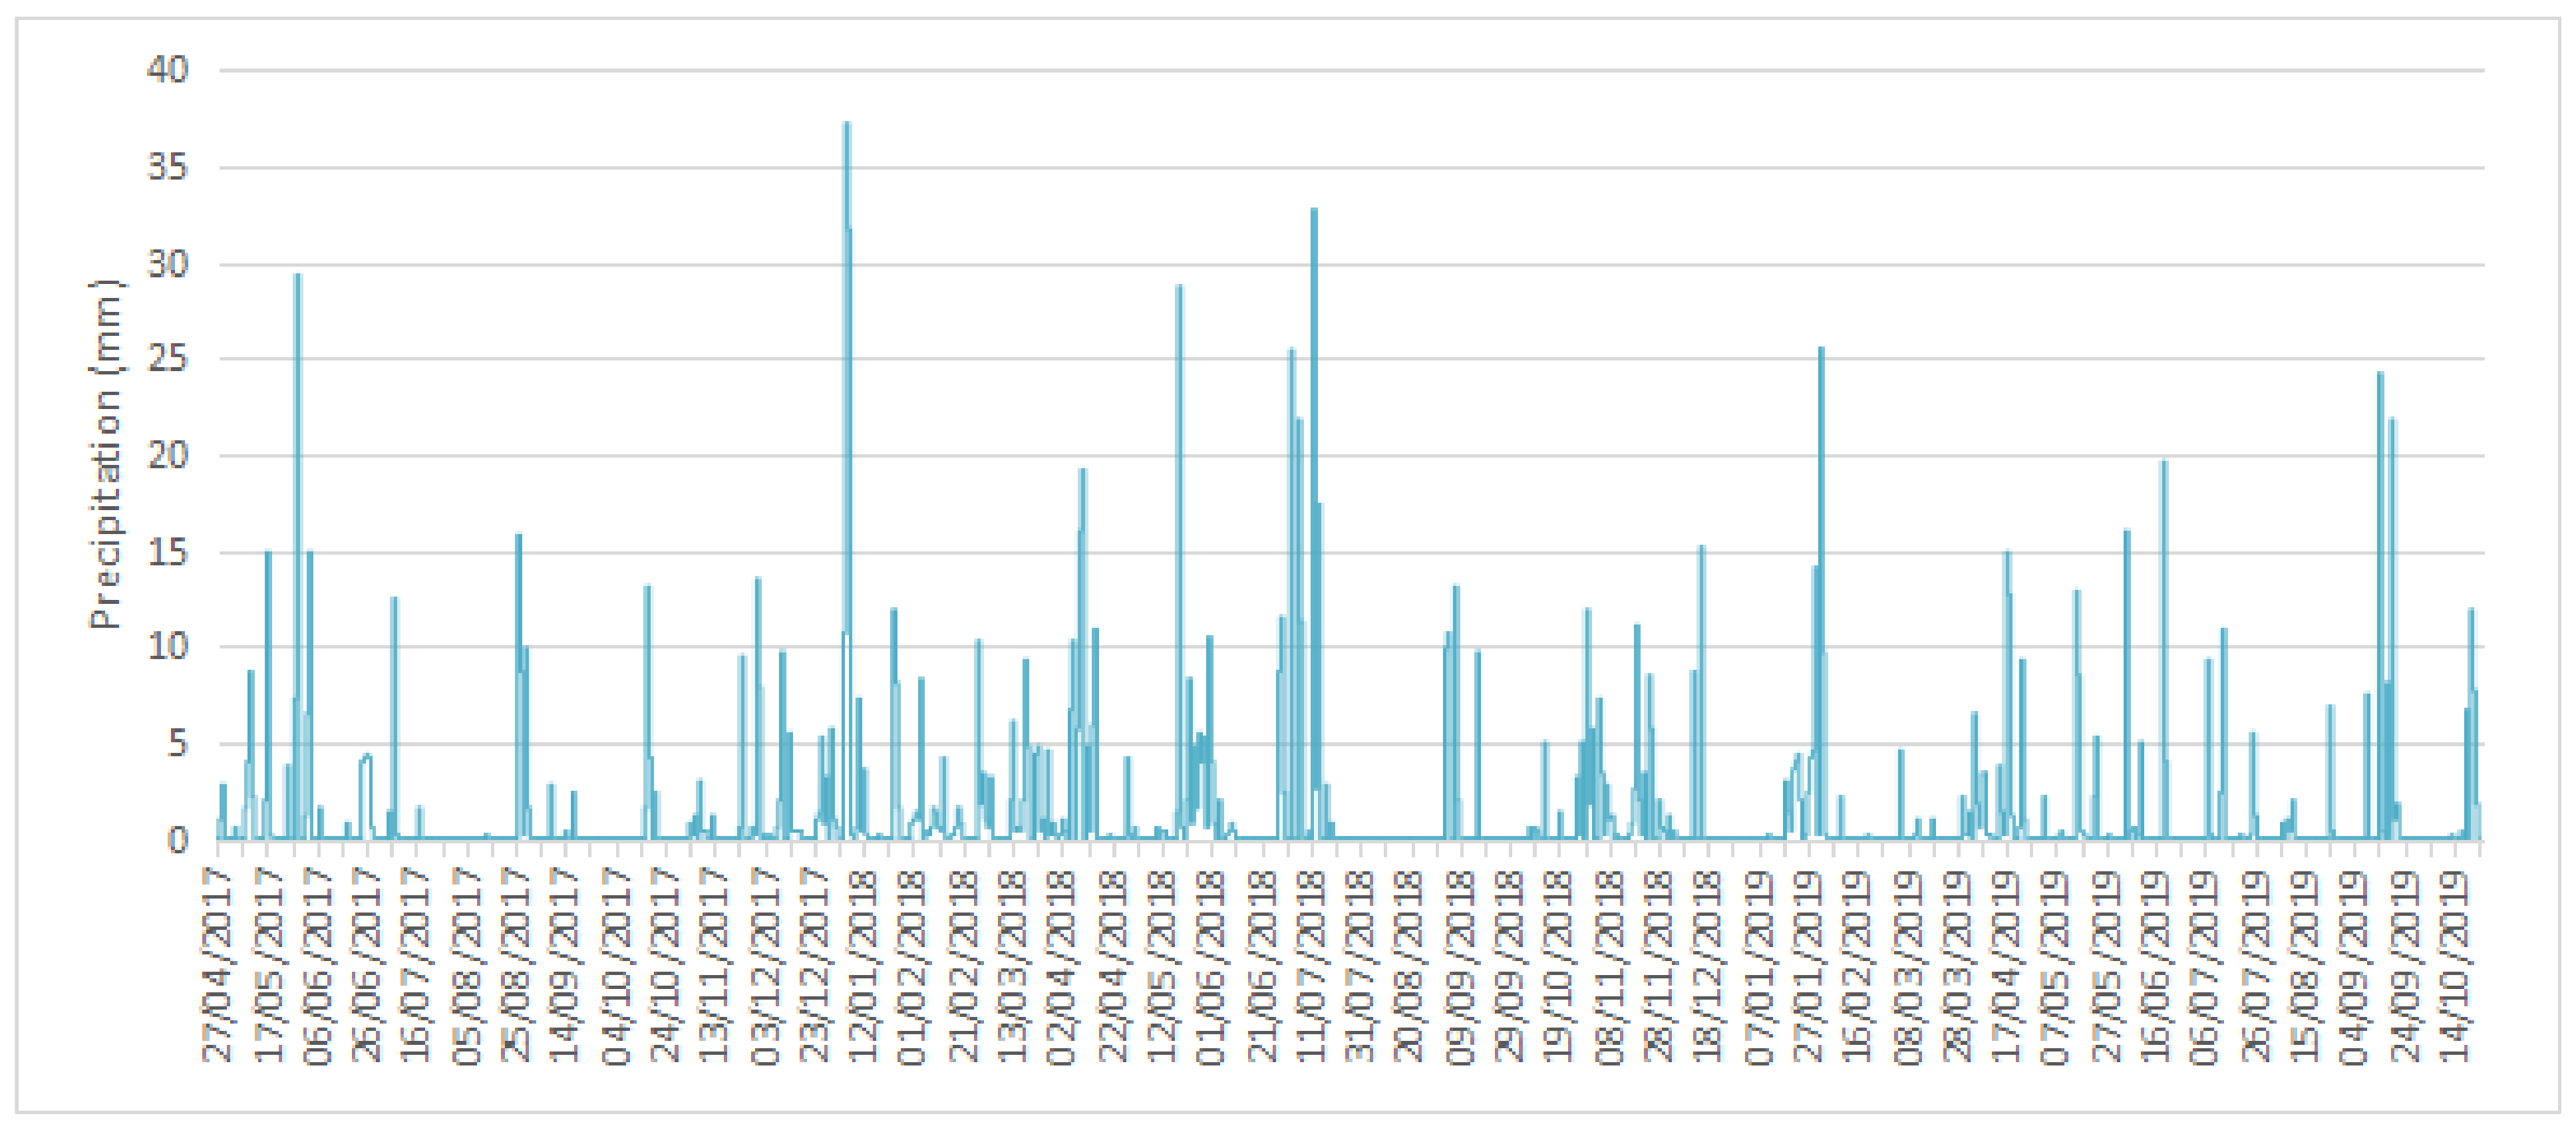
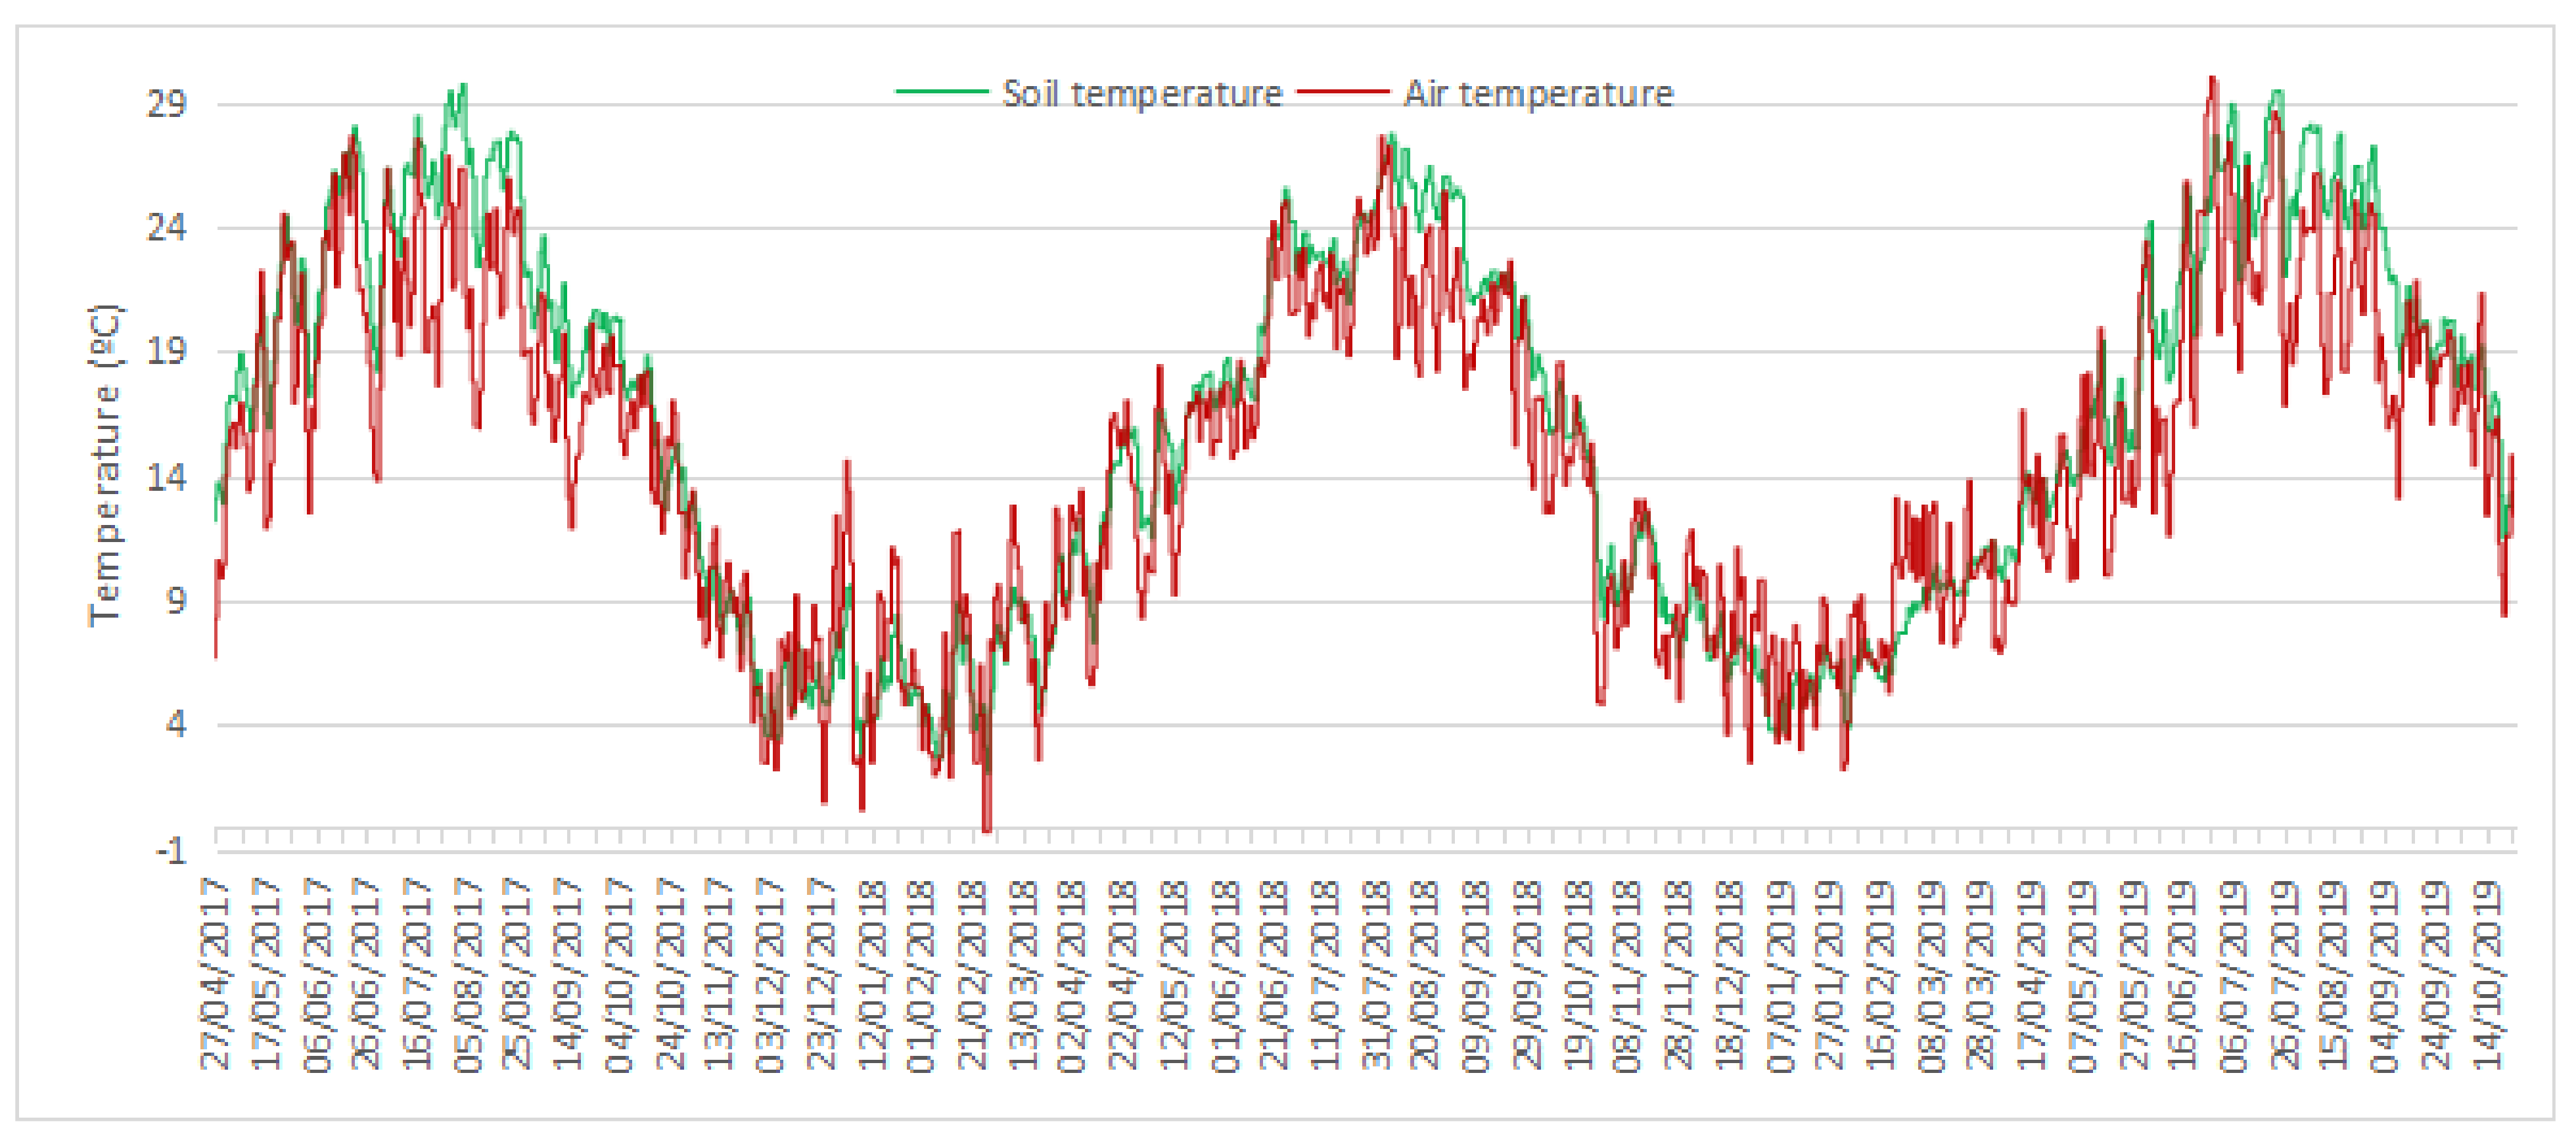
2.2. Climatic Characteristics

For the determination of climatic parameters during the years 2017, 2018, and 2019, records of rainfall and atmospheric and soil temperatures from the agroclimatic station in Logroño were used. The station is in the La Grajera area (Longitude: 2°30′49.0″ W; Latitude: 42°26′22.8″ N; 465 m above sea level), situated 150–200 m from the study area. The soil temperature sensor of the climatic station specifically recorded data at a depth of 10 cm. On the other hand, to determine the temperature used to calculate the GHG emissions of each gas, a digital thermometer was used to measure the temperature at the same time and place where the samples were taken in the experimental plot.
The vineyard plot in the study experienced annual precipitation volumes of 413, 669, and 537 lm−2 (Figure 1), respectively, and an average annual temperature ranging between 14.4 °C and 14.9 °C over the three years of data recording (Figure 2).

2.3. Soil Characterization

For the characterization of the physical environment of the plot, geological and edaphological data were collected by opening a soil pit using an excavator, followed by description and classification according to soil taxonomy [20]. The methodology used for the determination of each of the different physical and chemical parameters was as follows:
  • Particle size analysis: Laser diffraction with a particle size analyzer LS 13320 (Beckman Coulter, Indianapolis, IN, United States), equipped with a universal liquid analysis module and autosampler;
  • Oxidizable organic matter: the Walkley–Black method (MAPA, 1994);
  • Total nitrogen: the Dumas method;
  • Total carbonates: EN 15936:2012 method, with an inorganic carbon analyzer CO-202 (Equilab, Madrid (Spain));
  • Active limestone: Nijelshon method (MAPA, 1994);
  • Electrical conductivity (preliminary salinity test) and pH in soil suspension: water (1:5). pH was determined using the EN 15933:2012 method, and electrical conductivity was determined using the EN 13038:2011 method, with a Metrohm auto-titrator equipped with a pH meter and conductivity meter.
During the year 2019, a soil moisture analysis was carried out in order to validate the observations made in 2017 and 2018, which indicated the influence of precipitation on GHG emissions. Soil moisture was determined using the gravimetric method (Figure 3). The samples were dried in an oven for 72 h at 70 °C, and the percentage of moisture for each sample was calculated using the difference in weights, expressed as % w/w.

2.4. Determination of GHG

For the determination of GHG emissions, a closed chamber monitoring system was used, following the method by Parkin and Venterea [21]. Two chambers were installed in each replicate, one in the rows and another in the alleys of the vineyard, totaling six chambers across the plot’s surface. These chambers consisted of a PVC ring-shaped base (Ø = 31.5 cm and h = 16 cm) inserted 5 cm into the soil [4]. The top part of the chamber was then tightly sealed onto the ring to create a hermetic seal. Gas samples were taken through a septum on the top using a syringe, extracting 20 mL of the gas sample, which was immediately transferred to 12 mL inertized vials (Labco, (Lampeter, UK)) [22,23].
Sampling sessions began early in the morning, coinciding with the first sample collection (t = 0), and subsequent samples were taken at 20 min intervals (t = 20, t = 40, and t = 60 min) following the method employed by Yu et al. [7].
For quantifying the flux of each of the three gases (CO2, N2O, and CH4), a gas chromatography system model 7890A (Agilent, (Santa Clara, CA, United States) was used, equipped with two independent columns (HP-Plot Q, 30 m × 320 mm I.D. × 20 mm film thickness, Agilent), an automatic sample injector Combi Pal RSI120, PAL3 (Agilent, USA), and two different detectors: a mass spectrometer (MS) and a microelectron capture detector (µECD). CO2 and CH4 were determined using mass spectrometry (MS 5975, Agilent) with m/z 44 and m/z 15, respectively. For N2O quantification, a microelectron capture detector µECD 7890 (Agilent, USA) was employed.
The chromatographic separation of the GHGs was carried out isothermally (T = 35 °C), operating in the split mode, with helium (He) as the carrier gas at a flow rate of 0.8 mL min−1.
GHG concentrations in the samples (ppm) were determined based on a calibration curve obtained from three standard gas mixtures with known concentrations. The standard gas mixtures had high concentrations with 800 ± 16 ppm CO2, 1.5 ± 0.07 ppm CH4, and 0.7 ± 0.07 ppm N2O; medium concentrations with 500 ± 10 ppm CO2, 1 ± 0.1 ppm CH4, and 0.5 ± 0.05 ppm N2O; and low concentrations with 300 ± 6 ppm CO2, 0.7 ± 0.07 ppm CH4, and 0.3 ± 0.03 ppm N2O.
Finally, the emission levels for each of the three gases were individually calculated at the end of the identification and quantification procedure. The ppm concentrations (µL l−1) were converted to kg ha−1 day−1 for CO2 and g ha−1 day−1 for CH4 and N2O. These gas concentrations were determined using measurements obtained at t = 0 and t = 60 [24] following the procedure described by Pereira et al. [25] and Fangueiro et al. [26].

2.5. Statistical Analysis

The data were calculated and presented as the mean of the three repetitions conducted per date and location (alleys and rows of the vineyard), along with their standard deviation. This presentation allows for observing the evolution over the three years of the study. The statistical analysis was performed using GraphPad Prism 5.0 software (GraphPad Software Inc., La Jolla, CA, USA). To calculate the annual cumulative fluxes of emissions of each of the gases, the daily fluxes calculated for each year of measurement were added together. Given the small sample size (n = 3), which was insufficient to demonstrate normality, we chose to use the nonparametric Mann–Whitney U test to identify the possible significant differences between emissions in rows and alleys of vineyards. A p-value of less than 0.05 (p < 0.05) was considered statistically significant.

3. Results and Discussion

3.1. Characteristics of the Plot

The soil type of the vineyard plot belongs to the Inceptisols order, subgroup “Typic Haploxerepts”. The effective depth of the soil profile was 138 cm, and its physical and chemical characteristics are detailed in Table 1.
The top 55 cm corresponds to the Ap horizon of the plot, which was subjected to tillage. It exhibited a loamy texture, low organic matter content, basic pH, nonsaline, and a level of carbonates ranging from low to moderate, with low limestone content.
Regarding the soil moisture in 2019, its values are represented in Figure 3, where it can be observed that the water content in the vine rows was higher than that obtained in the alleys of the vineyard. Generally, these differences in moisture between rows and alleys are seasonal, depending on the time of the year. During autumn and winter, soil moisture tended to be above 6% w/w, reaching a maximum of 18% w/w in November. On the other hand, during the summer months, this moisture usually did not exceed 5.5% w/w, except in July. In that month, a precipitation amount of around 13 l m−2 was recorded two days before the measurement, coinciding with the application of drip irrigation. This possibly caused an increase in moisture to around 9% w/w in the rows and 7% w/w in the alleys. It is worth mentioning that, in February 2019, in both the rows and alleys, the moisture content was very similar, as was the case in August.
Regarding the moisture values found throughout the vine cycle (2019), it is possible to assert that the maximum water content in the surface horizon was in spring, autumn, and winter months, with the minimum humidity observed in summer, including August and September (Figure 3).
This may indicate that, with higher water content in the rows, emissions from them will be higher than those from the alleys, especially in months when higher temperatures favor the respiratory activity of soil microorganisms, as will be explained in the following section in the detailed study of the behavior of each gas.
An analysis of the temperatures recorded by the agroclimatic station shows that the soil temperature is dependent on air temperature throughout the year. In the period from May to September, soil temperatures were found to be higher than air temperatures (Figure 2). This phenomenon could be attributed to the influence of solar radiation on the top 10 cm of soil, leading to increased temperatures through irradiation. Additionally, the lack of vegetative cover in the vineyard plot may explain the observed difference in behavior during the months with higher average temperatures.

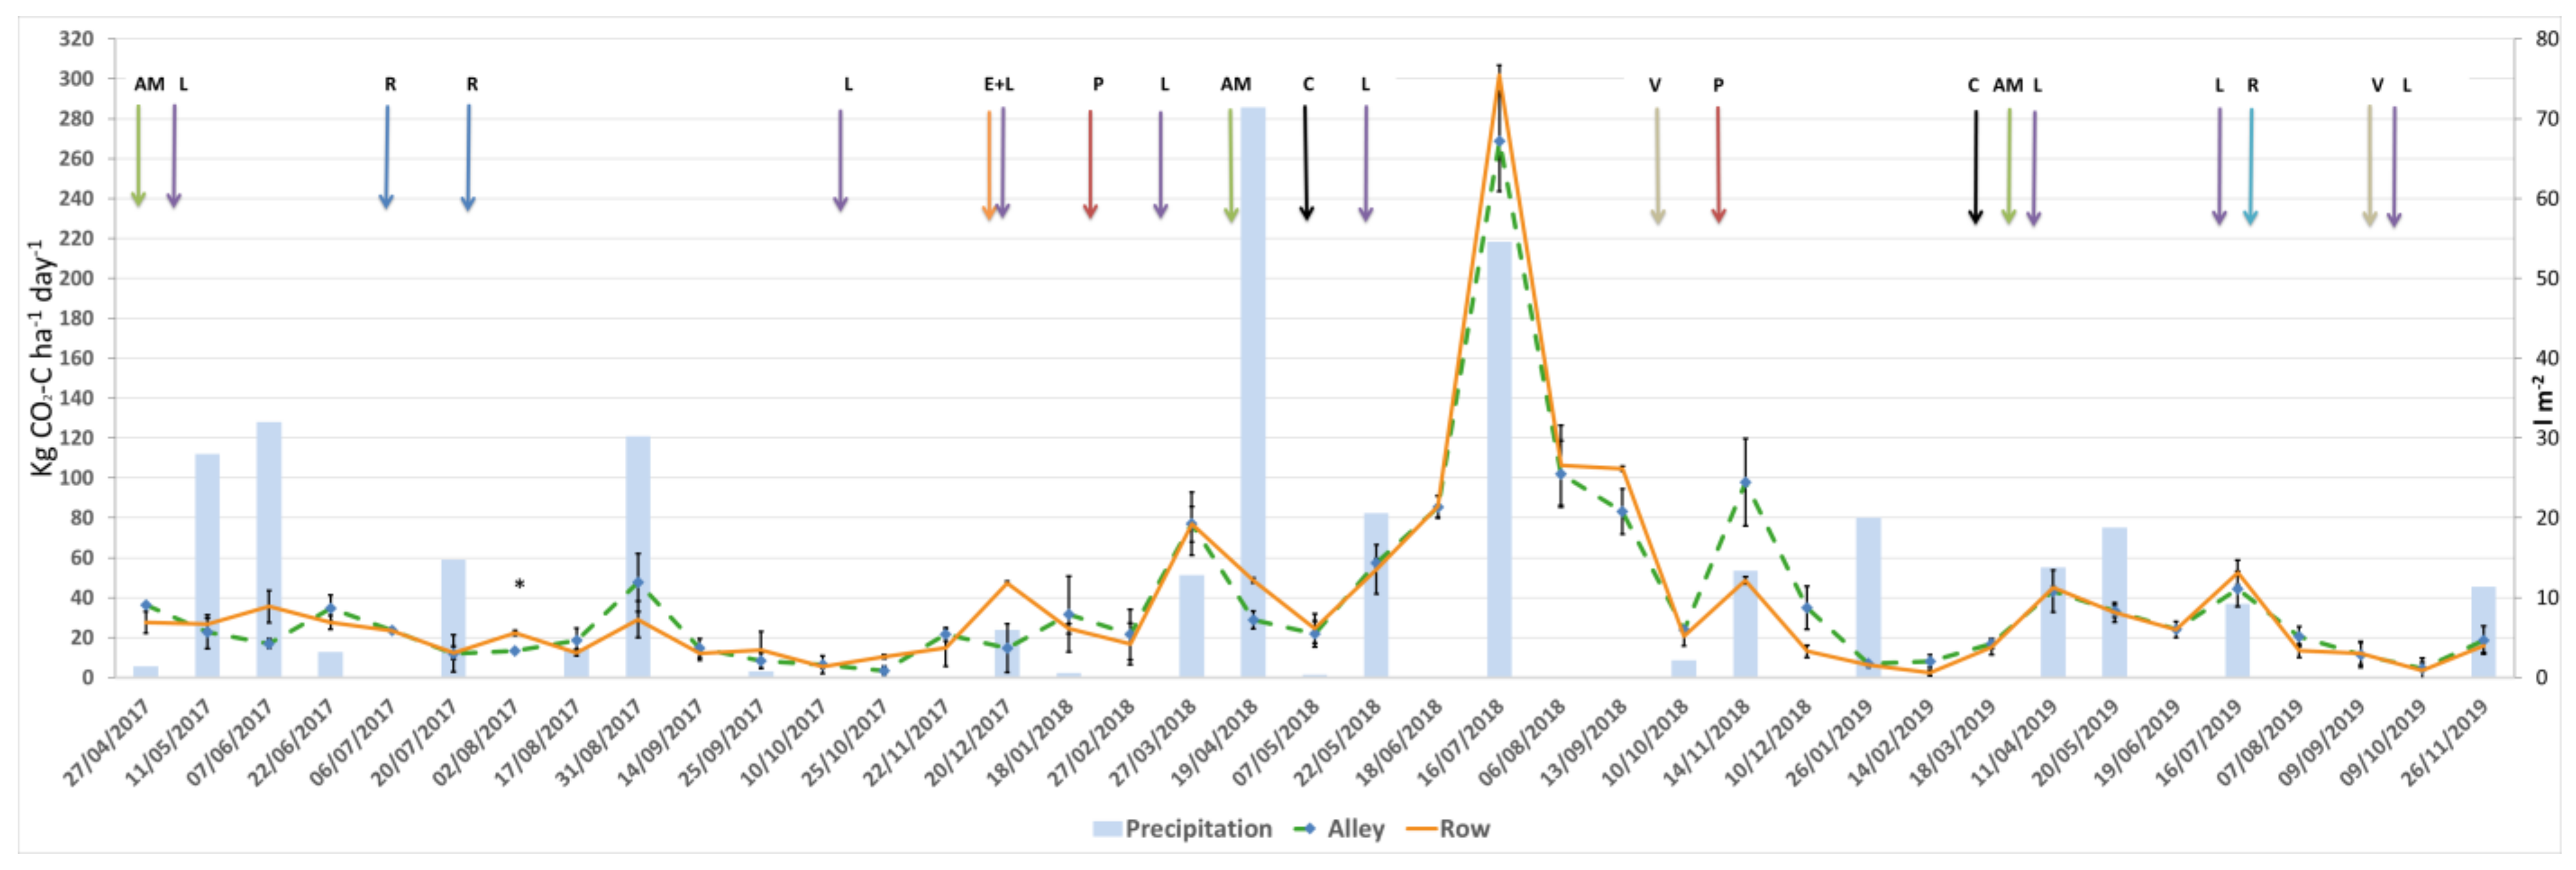
3.2. Carbon Dioxide (CO2)

Figure 4 depicts the levels of CO2 emissions from the soils of a commercial vineyard in the DOCa. Rioja grape-growing region, expressed in kg ha−1 day−1, during the period 2017–2019. Firstly, it can be observed that the dynamics of the measured fluxes did not follow the same pattern throughout the three studied vine cycles. This noncoincident behavior could be attributed to the highly complex nature of the phenomenon, involving numerous physical, chemical, biological, and anthropogenic factors and processes [4,27], affecting the volume of CO2 gas emissions from the soil to the atmosphere.
In general, CO2 emissions in the first year (2017) recorded annual levels of 295.8 ± 12.1 kg CO2 ha−1 in the rows and 322.0 ± 11.2 kg CO2 ha−1 in the alleys, mainly due to their strong dependence on soil moisture, as it was a dry or slightly drier-than-normal year (Figure 1). Considering the vegetative growth phase (spring) and early ripening (summer), the total precipitation of these two seasons amounted to 221 l m−2, representing 46% of the annual precipitation. During these two periods, CO2 emissions were 146.8 kg CO2 ha−1, accounting for 49.6% of the annual emissions, suggesting the influence of precipitation on CO2 emissions.
Between the months of May and July, no significant volumes of CO2 flux from the soils were detected, indicating that these emissions can be considered negligible, not exceeding 35.5 kg CO2 ha−1 day−1 in the alleys or the rows, with an average of 24.5 kg CO2 ha−1 day−1 in the alleys and 25.6 kg CO2 ha−1 day−1 in the rows. The variations observed are closely related to certain agronomic practices such as cultivation (May) [28]. Related to this practice, a decrease in emissions in the alleys (7 June) was observed, where the fluxes decreased from 22.9 kg CO2 ha−1 day−1 (May) to 17.0 kg CO2 ha−1 day−1 (June), while in the rows, emissions increased from 26.8 kg CO2 ha−1 day−1 (May) to 35.6 kg CO2 ha−1 day−1 (June). This decrease observed in the alleys could be due to the degassing of the CO2 dissolved in the soil solution and in the pore space [29,30,31].
During the month of August (summer), in the full ripening cycle, two dynamics differed from the behavior observed during that year. The first one (2 August) was that the emissions in the rows (22.3 kg CO2 ha−1 day−1) were slightly higher than those in the alleys (13.2 kg CO2 ha−1 day−1), with no precipitation events occurring in the days before the measurement. These emissions correspond to the only measurements throughout the study in which fluxes exhibited statistically significant differences between the alleys and rows. However, toward the end of August (31 August), alley emissions (47.6 kg CO2 ha−1 day−1) increased and were slightly higher than those in the rows (29.8 kg CO2 ha−1 day−1), because of continuous rainfall events in which the precipitation accumulated to 36.2 l m−2 (Figure S2). Therefore, it is possible to affirm that when rainfall events occur during the summer, the accumulated moisture in the soil affects alley emissions to a greater extent, resulting in higher values than those in the row. However, for the same temperature conditions, but without previous rainfall, row emissions were higher than those in the alleys. During the vegetative phase, the plant canopy may have diverted the precipitation from the vine row, even more affecting the alley. In the absence of rain, the row, being more shaded, retains moisture better, resulting in higher CO2 gas emissions than the alley.
Regarding the application of organic matter, at the end of the year (December), an organic amendment of animal origin was applied with a dose of 15,000 kg/ha in the alleys using a spreader trailer. However, the levels of CO2 emissions obtained after the addition of manure were not significantly affected. Previous studies, such as the study of Calleja-Cervantes et al. [11], revealed that CO2 emissions in vineyard soils increase and reach their peak between 60 and 120 days after the application of compost, which explains the relatively low levels recorded in this study between 15.0 and 30.0 kg CO2 ha−1 day−1, immediately after the application of the organic matter.
During the second year (2018), the annual precipitation recorded was 669 l m−2, indicating a year with above-average precipitation. The global CO2 emissions during this year were 934.7 ± 66.5 kg CO2 ha−1 day−1 in the alleys and 926.8 ± 76.5 kg CO2 ha−1 day−1 in the rows.
CO2 fluxes at the beginning of the year remained low, not exceeding 31.8 kg CO2 ha−1 in the rows and 24.8 kg CO2 ha−1 in the alleys. Starting from March, with the progressive increase in air temperature and consequently soil temperature, the first peak of GHG emissions occurred in the alleys (77.1 kg CO2 ha−1 day−1) and in the rows (76.9 kg CO2 ha−1 day−1). In terms of precipitation patterns, they occurred frequently with low-to-moderate intensity (less than 15 l m−2). The combination of both meteorological parameters, i.e., increasing humidity and rising temperature, led to an increase in the CO2 emissions (Figure S2) due to the activation of soil respiration processes [32] originating from both microbial activity under aerobic conditions and the respiratory activity of the vine roots. However, from the end of March to early May, CO2 emissions progressively decreased, despite the periodic and abundant rainfall (72.6 l m−2) during the first half of April. These heavy rains may have caused partial soil saturation, creating anaerobic conditions and consequently reducing soil respiration [33].
Between the phenological stages of flowering (June 2018) and advanced veraison (July 2018), which is late in the vine cycle, significantly increased CO2 emissions were observed, reaching emission levels of 270.0 kg CO2 ha−1 day−1 in the alleys and 300.0 kg CO2 ha−1 day−1 in the rows. These abnormally high fluxes occurred under very specific climatic conditions, with average soil temperatures ranging from 20 to 25 °C, coinciding with several precipitation events accumulating to 54.4 l m−2. These gaseous emissions have been described by Rey et al. [34], indicating that warmer and drier soils exhibit a greater response of soil respiration to rehumidification compared with cold and dry soils. Regarding the higher emission fluxes in the rows when large volumes of precipitation occur, it has been observed that these turbulent events modify runoff, forming furrows and channels that carry water from alleys to rows, increasing the soil moisture values in the latter. Furthermore, the reduced emissions in alleys are also facilitated by the formation of a surface crust in the alleys, limiting the infiltration of rainwater and gas exchange [35].
In an advanced stage of vine maturation, in mid-September 2018, a slower decline in CO2 emissions from the soils was observed, noticeable in both the alleys and the rows, which could be associated with higher humidity conditions resulting from a new precipitation event (30.4 l m−2).
In the final phase of the vine cycle, coinciding with leaf fall (14 November), a peak of CO2 emissions was observed in the alleys and rows, differing significantly in the magnitude of the fluxes, with values of 97.7 and 48.6 kg CO2 ha−1 day−1, respectively. This difference may be a consequence of a notable decrease in air and soil temperatures during this phase, affecting the respiratory activities, both microbial and root-system-derived, significantly reducing emissions in the rows. Additionally, the higher emissions in the alleys are attributed to the incorporation of pruning and pre-pruning residues into the soil, which, when fragmented, could release CO2 into the atmosphere as they decompose and mineralize the organic matter. López-Urrea et al. [36] demonstrated that the use of the incorporated pruning residues in the soil could reduce soil evaporation, and this, together with the succession of rainfall events (15 l m−2) on previous dates, explains the higher CO2 emissions in the alleys tan in the rows of the vineyard.
Regarding the third year (2019), the annual precipitation was 537 l m−2, slightly higher than a normal year, and like the first year (2017), it was characterized by low emissions. The global annual CO2 flux sum was 232.7 ± 13.9 kg CO2 ha−1 in the alleys and 223.0 ± 16.7 kg CO2 ha−1 in the rows, with no significant differences observed between the two vineyard areas.
During the vegetative and reproductive phases of the vine (2019), two discrete CO2 emission peaks were observed, both of similar magnitude. The first peak coincided with spring (April), a season characterized by a continuous increase in atmospheric temperature and frequent precipitation events. During this month, the accumulated precipitation reached 63 l m−2, with an average temperature of 11.4 °C. Emissions in April reached 43.3 and 45.1 kg CO2 ha−1 day−1 in the alleys and rows, respectively. These CO2 flux volumes were similar in magnitude to those recorded during the peak summer (July), quantified at 44.3 and 52.5 kg CO2 ha−1 day−1 in the alleys and rows, respectively, measured during a very moderate precipitation event (10 l m−2) occurring two days before the measurement. Furthermore, early in July, a cultivator pass was carried out, which may have favored this release of CO2, as cultivation improves soil aeration and alters the structure of the topsoil, exposing labile organic matter and facilitating its decomposition [37].
In summary, CO2 emissions during the three years of study did not follow cyclical patterns with annual periodicity but do correspond in magnitude with emissions observed in other studies, for example, the values found by Marques et al. [33] in vineyards of Portugal. These authors observed that the first CO2 peaks appeared in the months from March to May, as also observed in this study, where the first peak occurred in March 2018 and in April 2019. Additionally, the highest emissions coincide with the summer months, associated with moderate precipitation events under thermal conditions between 20 and 25 °C.

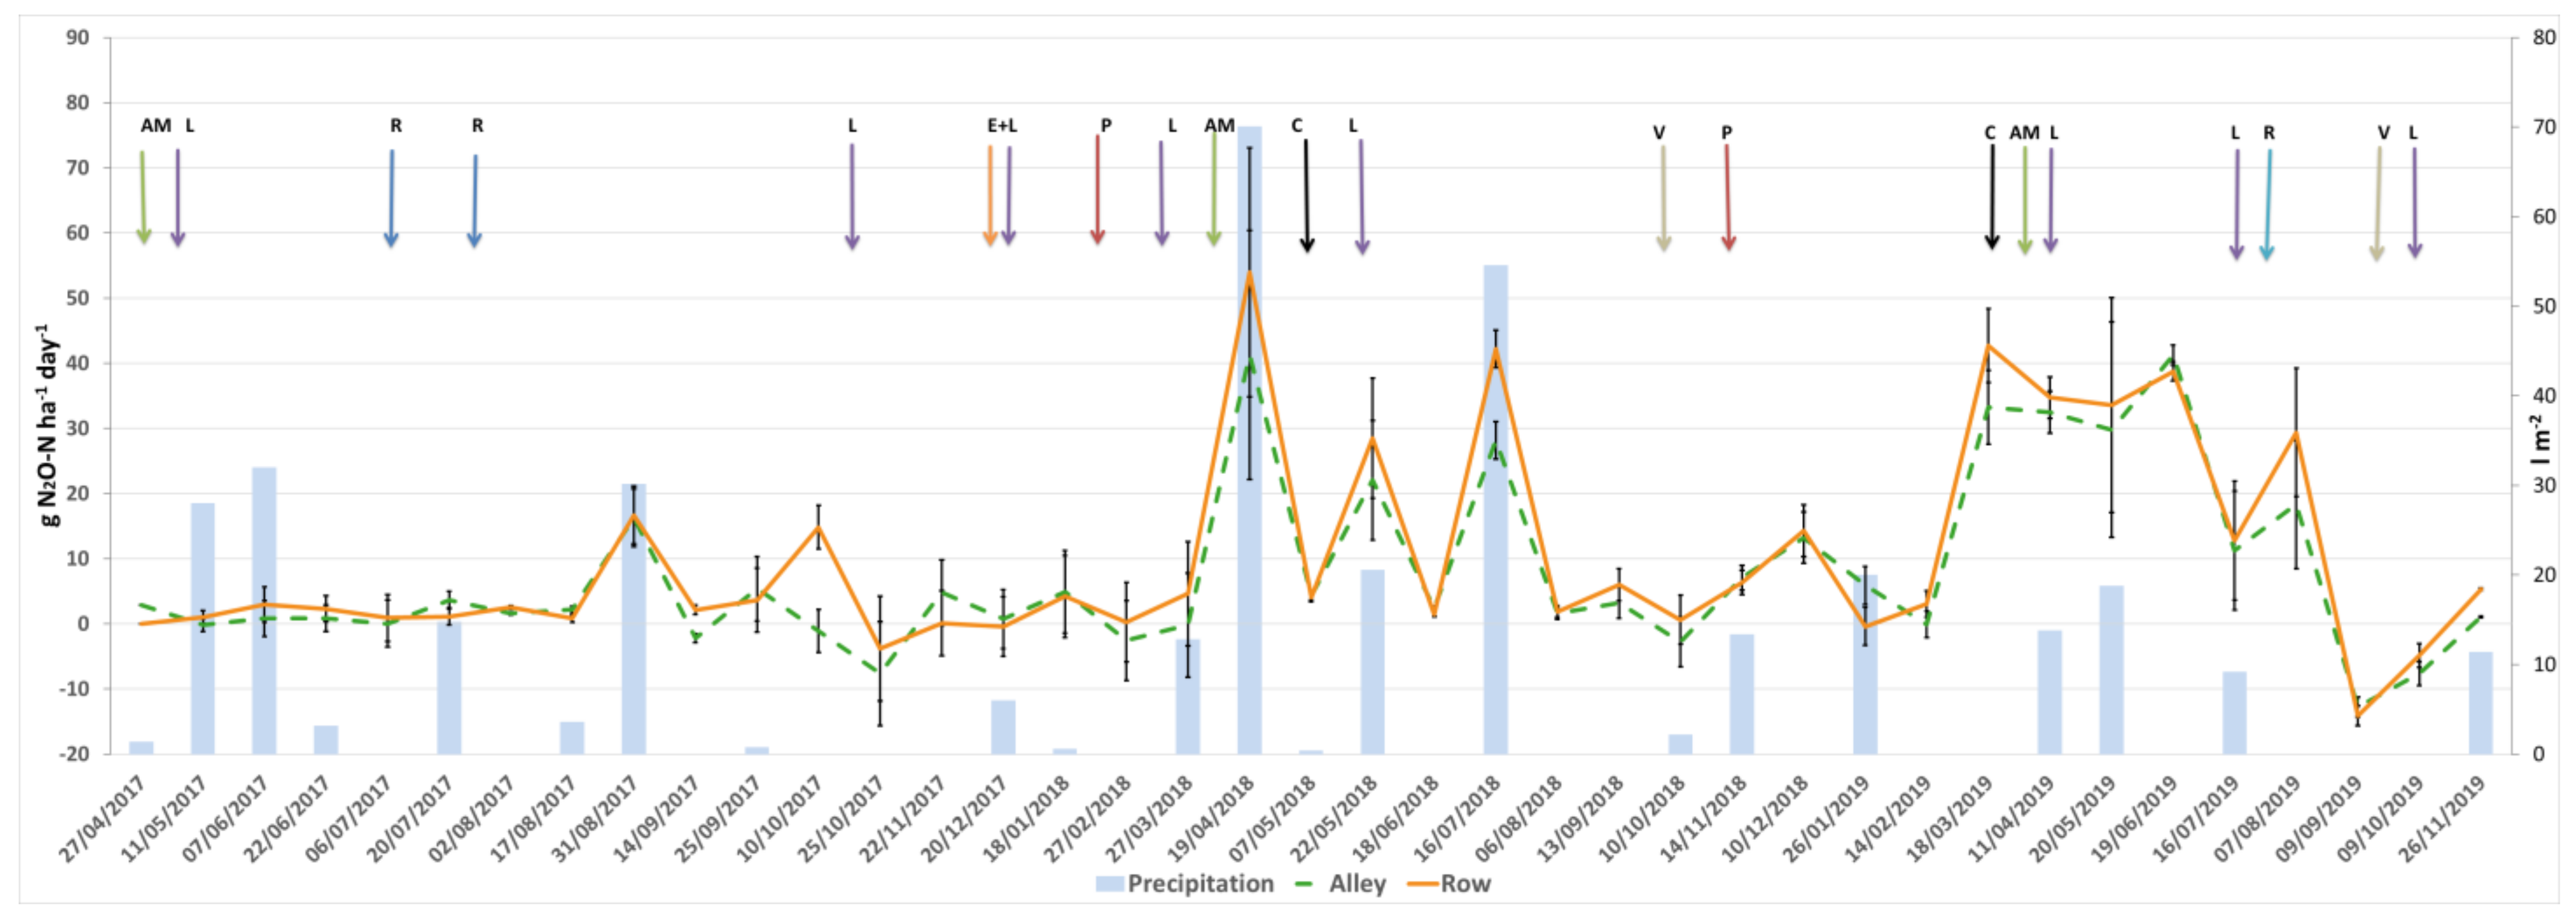
3.3. Nitrous Oxide (N2O)
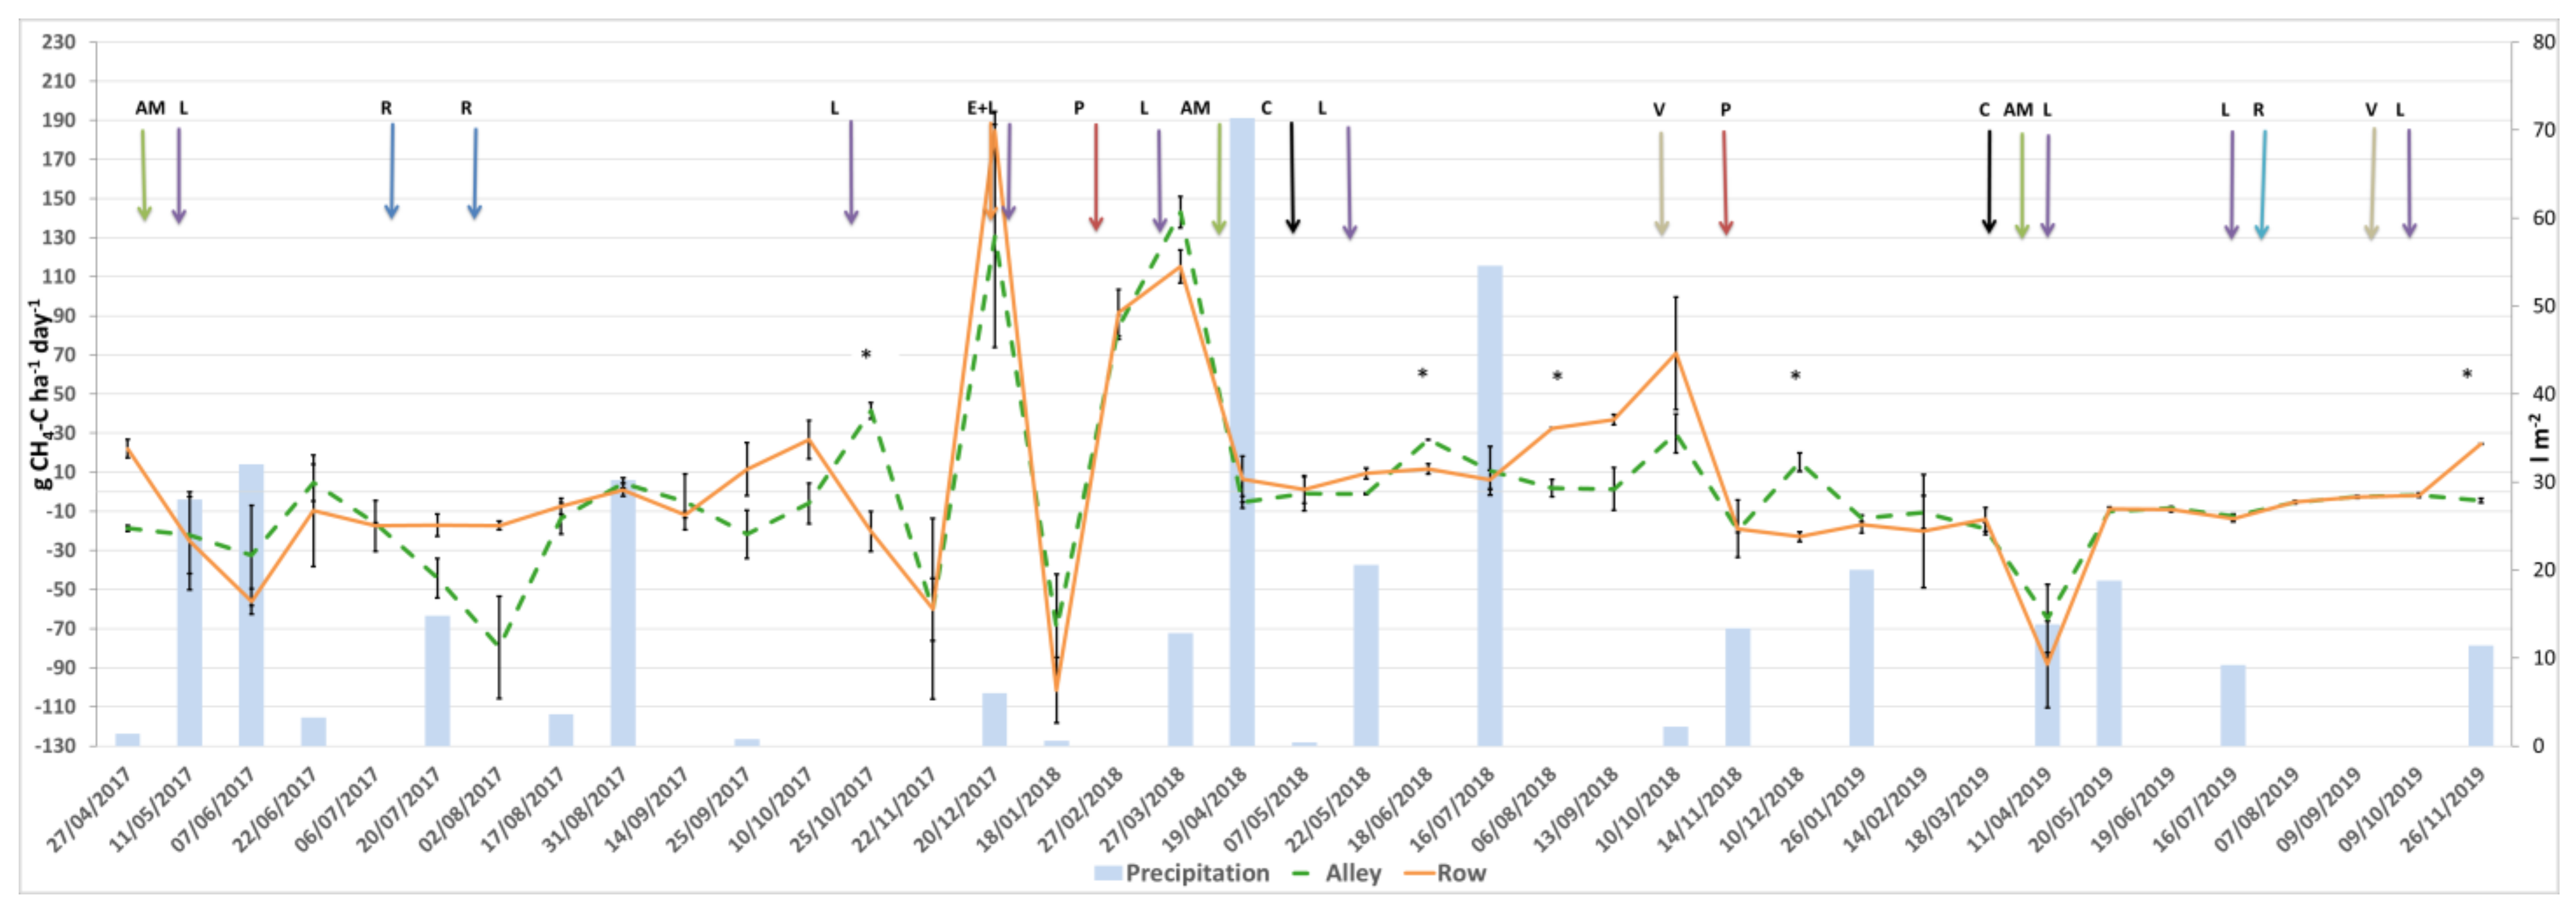
The levels of N2O emissions from the soils of the commercial vineyard in the DOCa. Rioja grape-growing region are presented in Figure 5, expressed as g ha−1 day−1, during the period 2017–2019. In the first year (2017), similar to CO2, the N2O levels remained constant with emissions similar to those obtained by Marques et al. [33], who evaluated the impact of vegetation cover versus tillage in vineyards and obtained emission values between 0 and 10 g N2O ha−1 day−1. In 2017, only two discrete emission peaks were detected. The first peak (31 August) was observed with values of 16.3 g N2O ha−1 day−1 in the alleys and 16.7 g N2O ha−1 day−1 in the rows, both with the same order of magnitude, also coinciding with the maximum values obtained by Marques et al. [33] whose peak flow rates were in the range of 10–30 g N2O ha−1 day−1. This slight increase in emissions in the mentioned peaks is related to several precipitation events, with accumulations of 30 l m−2, that occurred days before the measurement (Figure S2). According to Yu et al. [38], the behavior of nitrous oxide is mainly affected by soil moisture, which directly influences the increase in its emissions. At the end of this year (10 October), a second discrete emission peak occurred in which the alleys showed differences in N2O flux compared with the rows. This uneven behavior may have been caused by the tillage practice carried out in the alleys, where values of −1.1 g N2O ha−1 day−1 were recorded, unlike the rows, where the soil aggregates were not disturbed, and emissions were 14.8 g ha−1 day−1. Fangueiro et al. [26] studied emissions in rice cultivation and did not detect clear trends in N2O behavior when tillage was performed.
Regarding the application of semi-composted manure (November 2017), no significant differences were detected in N2O emissions in the alleys or the rows in the immediate measurement afterward, where values of 4.8 g N2O ha−1 day−1 in the alleys and 0.1 g N2O ha−1 day−1 in the rows were obtained. Fernández-Rodríguez et al. [39] did not obtain significant differences during the first year of study when applying organic amendments, but they observed significant differences in the second year, most likely due to the slower mineralization of organic matter under anaerobic conditions [40]. In this sense, Zhu et al. [41] stated that compost could contribute to higher N2O emissions by reducing the substrate limitations of C and N for microbial activity.
In the second year (2018), N2O diffusion values were low throughout the cycle, not exceeding 7.1 g N2O ha−1 day−1, except for very specific moments, which coincided with abundant precipitation events, such as in April, where persistent rains accumulated to 71.4 l m−2 in the days before the measurement. Marín-Martínez et al. [24] observed that, in a dry period, soil re-wetting caused increases in N2O fluxes, possibly due to the recovery of aerobic nitrifying bacteria activity [42]. These rainfall events, along with agronomic practices such as the application of a mineral N–P–K fertilizer (15-15-15) dosed at a rate of 300 kg ha−1 on 7 April, caused measurements on 19 April to show fluxes of 53.9 g N2O ha−1 day−1 in the rows (Figure 4) and 41.3 g N2O ha−1 day−1 in the alleys, coinciding with the results of Cowan et al. [43]. These authors [43] observed that the highest flux after mineral fertilization occurred in the first 6–7 days after treatment, with a complete decrease in the N2O fluxes after two or three weeks. Similarly, Sander et al. [44] found that most of the N2O emissions occurred after nitrogen fertilization. During the following months, several well-defined peaks were observed, the first one at the end of May and the second one in mid-July. These emission increases are related to short periods of moderate rainfall (20.6 and 54.6 l m−2, respectively), which, together with temperatures of 21.1 °C in May and 24.2 °C in July, caused N2O fluxes to increase from 28.5 to 42.2 g N2O ha−1 day−1 in the rows, and from 22.0 to 28.1 g N2O ha−1 day−1 in the alleys. These values indicate that N2O emissions are highly dependent on soil temperature and moisture [16]. In July, since the temperature was higher, and there were more precipitation events, higher emission fluxes were observed than in May. It should be noted that precipitation volume is the variable that most influenced N2O emissions (r = 0.35 in the alleys; r = 0.27 in the rows), while the relationship with temperature obtained values close to zero.
The third year (2019) was characterized by presenting a period of high emissions between the months of March and August, including the vegetative growth phases of the plant and the beginning of grape ripening. The values of N2O flux remained in a range between 11.2 and 41.2 g N2O ha−1 day−1 in the alleys and between 12.8 and 42.7 g N2O ha−1 day−1 in the rows. During this period, 41% of the annual rainfall was recorded (Figure 1), causing moisture to accumulate mainly in the rows (Figure 3), which could have favored higher N2O fluxes from February to September in the rows than in the alleys. Lazcano et al. [45] also explained this in the same way, as they obtained daily average N2O fluxes that correlated significantly and positively with soil moisture in vineyard rows but not in alleys. There are studies that demonstrate that precipitation events increase N2O emissions from soils, with most associating it with the first precipitation event [22,38] by measuring immediately at the moment of precipitation. This differs from our results, as there was one day between the precipitation and the measurement, during which it did not rain, which, combined with high soil temperatures (24.6 °C), would have caused rapid evaporation of the water in the soil.
In March, mineral fertilization was carried out, which caused N2O emissions for that month to increase from −0.1 g N2O ha−1 day−1 to 33.2 g N2O ha−1 day−1 in the alleys and from 3.1 g N2O ha−1 day−1 to 42.7 g N2O ha−1 day−1 in the rows. This observation matched those results of Garland et al. [19], who obtained higher emissions in the rows after mineral fertilization, through fertigation.
Likewise, in the quantification of both CO2 and N2O emissions carried out after the grape harvest, there was a marked decrease in the fluxes of both gases, which was repeated in the three years of measurements, most likely caused by the onset of the vine’s vegetative rest, leading to a reduction in root and microbial respiratory activity. During October, November, and December of the three years of this study, the mean N2O fluxes oscillated between −0.8 and 5.8 g N2O ha−1 day−1 in the alleys and between −1.4 and 7.1 g N2O ha−1 day−1 in the rows. This observation is corroborated by Heller et al. [46], who studied maize cultivation and also obtained similar seasonal patterns for CO2 and N2O. However, Garland et al. [22] obtained the highest fluxes for vineyard cultivation in October, coinciding with the first precipitation event, which reached a maximum peak of 360 g N2O ha−1 day−1 in the alley.
During the three years of this study, negative N2O emission values were recorded in some measurements. These soil uptakes occurred in February, September, and October of all three cycles, where the emissions found were between −2.1 and −7.6 g N2O ha−1 day−1 in 2017; between −2.5 and −2.7 g N2O ha−1 day−1 in 2018; and between −0.1 and −12.7 g N2O ha−1 day−1 in 2019. The common feature of the months and periods in which these values were obtained is that no precipitation events occurred in the days prior to the measurement, so the soils were dry. Long periods of drought can significantly reduce soil moisture and therefore soil gas emissions. In these conditions, the soil can become a net sink for N2O [47]. Also, Garland et al. [22] obtained similar results of negative emissions when studying N2O fluxes in a vineyard’s alleys and rows. They observed that most of the negative N2O fluxes occurred in dry soils with a water-filled pore space between 15% and 25%.
In summary, N2O emissions remained constant, with fluxes mainly associated with precipitation events and the application of mineral fertilizers. The increase in emissions associated with nitrogen fertilizer application was of a similar order of magnitude in 2018 and 2019. These N2O fluxes increased by 41.1 g N2O ha−1 day−1 in the alleys and 49.3 g N2O ha−1 day−1 in the rows during 2018, and by 33.1 g N2O ha−1 day−1 in the alleys and 39.6 g N2O ha−1 day−1 in the rows in 2019. Therefore, the application of this agronomic practice significantly elevated N2O emissions.

3.4. Methane (CH4)

During the year 2017, regarding methane gas (Figure 6), there were measurements at very specific moments when emissions were positive, so methane flows to the atmosphere were more frequent in the rows, totaling 245.8 g CH4 ha−1 day−1 (April: 22.1 g CH4 ha−1 day−1; August: 1.0 g CH4 ha−1 day−1; September: 11.5 g CH4 ha−1 day−1; October: 26.6 g CH4 ha−1 day−1; and December: 184.6 g CH4 ha−1 day−1) and 181.3 g CH4 ha−1 day−1 in the alleys (June: 5.5 g CH4 ha−1 day−1; August: 4.5 g CH4 ha−1 day−1; October: 41.4 g CH4 ha−1 day−1; and December: 130.8 g CH4 ha−1 day−1). However, when calculating the annual CH4 emissions considering all flow values, including negative ones, the net emissions resulted in −138.9 g CH4 ha−1 day−1 in the alleys and 4.1 g ha−1 day−1 in the rows. These CH4 emission levels matched the results of Wolff et al. [48], who observed that the alleys of a vineyard in California acted as net sinks for CH4, while the rows, with drip irrigation, caused a decrease in methane oxidation and, therefore, an increase in emissions to the atmosphere. Also, Ball et al. [49], in their study on methane oxidation in different soil types in southeastern Scotland, also provided evidence indicating that high soil moisture content can restrict CH4 diffusion to methanotrophic bacteria, reducing methane uptake and oxidation.
In the first year of the study (2017), a clear pattern regarding methane emissions in the vineyard was not established. Throughout the vine’s growth cycle, some negative peaks were observed, with the first one recorded in July (6 July), with CH4 flows of −16.1 g CH4 ha−1 day−1 in the alleys and −17.4 g CH4 ha−1 day−1 in the rows. The second peak was registered in August (2 August), with emissions of −79.6 g CH4 ha−1 day−1 in the alleys and −17.2 g CH4 ha−1 day−1 in the rows. During this period, there were no precipitation events in the days prior to the measurements, and the soil temperatures were high, reaching 25.5 °C and 28.6 °C, respectively. This could indicate that the soil surface horizon was dry, which could explain the negative results found for CH4 emissions. This phenomenon is common in dry Mediterranean climate ecosystems, where soils can play a significant role as sinks for atmospheric CH4 [24,50]. However, in December, with a precipitation accumulation of 49.2 l m−2 and the application of semi-composted cow manure (20 December), a marked increase in CH4 emissions was detected due to the processes of decomposition, mineralization, and humification of organic matter in the soil. Animal manure, in general, contains methanogenic bacteria that can release CH4 because of the anaerobic decomposition of easily degradable carbon compounds [51]. This organic amendment led to an increase in microbial activity, resulting in higher methane emissions during this last month, reaching flows of 184.6 g CH4 ha−1 day−1 in the rows and 130.8 g CH4 ha−1 day−1 in the alleys. Fangueiro et al. [26], in their research on rice cultivation, also observed significant increases in CH4 after the application of the first fertilizer, when microorganisms began to consume carbon to process urea, generating CH4 emissions.
During the second year (2018), positive overall CH4 emissions were recorded in both areas of the vineyard, i.e., the rows (238.4 g CH4 ha−1 day−1) and the alleys (215.5 g CH4 ha−1 day−1). This year stood out for having the highest annual precipitation recorded (669 l m−2). Pu et al. [7] revealed that, in maize cultivation, a high soil water content favors CH4 release. Additionally, CH4 production is strongly linked to anaerobic conditions, showing a positive correlation with soil moisture, according to the studies of Gao et al. [52] and Smith et al. [53]. However, in their study of a vineyard, Lazcano et al. [45] observed a negative correlation between daily CH4 fluxes and %WFPS (percentage of soil moisture relative to field capacity).
At the beginning of this year (January), no emissions were generated, as the soil acted as a methane sink, with values of −70.1 g CH4 ha−1 day−1 recorded in the alleys and −101.4 g CH4 ha−1 day−1 recorded in the rows, but in the following month, emissions rose again to 91.6 g CH4 ha−1 day−1 in the rows and 84.1 g CH4 ha−1 day−1 in the alleys. Emissions in March (27 March) continued to increase, very likely due to shallow soil tillage before the measurement, a practice that favored the CH4 release in the alleys of the plot (142.9 g CH4 ha−1 day−1) compared with the rows (115.1 g CH4 ha−1 day−1). The increase in CH4 emissions could be a consequence of the application of composted organic matter from the amendment applied in late 2017. Additionally, aeration due to shallow soil tillage could have favored CH4 release occluded in the soil pore system, leading to higher methane emissions in the alleys, as observed with CO2 [7]. However, Wolff et al. [48], in the results of their study, also obtained less methane oxidation in the reduced tillage treatment, possibly due to tillage favoring greater aeration in the soils. On the other hand, Franco-Luesma et al. [10] could not establish a relationship between tillage and the release of higher concentrations of methane gas.
In the third year of the study (2019), a pattern like the first year (2017) was observed, with an identical trend in methane capture in the soil, both in the alleys and rows of the vineyard. The overall annual emissions from the alleys were −153.2 g CH4 ha−1 day−1, while those from the rows were very similar, around −155.8 g CH4 ha−1 day−1. In this last year, no noteworthy agronomic practices that may have affected soil microbial communities regarding methane release were carried out, showing a different behavior from the year 2018, when an organic amendment was applied in the alleys (December 2017), and it was the rainiest year. Therefore, by analyzing the gas flows in 2017 and 2019, it is possible to indicate that the soils are CH4 sinks under aerobic conditions [54].
In terms of the emission volume, the estimated CH4 flows were like those found by Lazcano et al. [45] in vine cultivation, registering daily CH4 flows ranging from a maximum of 358 g CH4 ha−1 day−1 to a minimum of −555 g CH4 ha−1 day−1 throughout the study, with most emissions being negative or close to zero. Additionally, as pointed out by Pu et al. [55] for maize cultivation, it can be inferred that soils with low water content release less CH4 due to prevailing aerobic conditions in the soil, favoring methane oxidation.

4. Conclusions

In this study, we investigated greenhouse gas (GHG) emissions in a vineyard, examining the complex associations between these emissions, climatic factors, and agricultural practices. The analysis covered both the alleys and rows of the vineyard, without revealing significant distinctions between these areas. In particular, temperature and precipitation volume were found to be crucial factors contributing to CO2 emissions, with correlation coefficients (rs) of 0.20 and 0.16 for temperature, and 0.44 and 0.30 for precipitation volume, respectively, in the rows and alleys (Figure S2), which support this claim. This fact also reflects that there are other influential factors that potentially moderate these emissions, such as agricultural practices like tillage. Regarding N2O emissions, the findings of this study highlight the dominant role of mineral fertilization and precipitation volume, as shown in Figure S2. In addition, it was also found that N2O fluxes throughout most of the three years of the study were predominant in the vineyard rows. While the soil acted as a methane sink throughout most of the study, with constant negative values, the introduction of organic amendments significantly increased the positive CH4 fluxes, being the most influential agricultural practice on CH4 emissions. However, methane emissions exhibited confusing patterns in the framework of this study, implying contextual influences yet to be identified or characterized comprehensively.
The findings of this study may contribute to a better understanding of the role of soils in Mediterranean climates, serving as sinks or net sources of GHGs, and thus could be of benefit for soil management due to the great complexity of understanding the interactions between the various GHGs studied.

Supplementary Materials

The following supporting information can be downloaded at: https://www.mdpi.com/article/10.3390/agronomy13092199/s1, Figure S1: Location of the study plot and experimental design based on rings placed both in the vineyard alleys and rows.; Figure S2: Spearman’s rank correlation coefficients (rs) of the analysis between precipitation volumes before measurement and temperatures for CO2, N2O, and CH4 in 2017, 2018, and 2019.; Table S1: Agricultural operations carried out in 2017, 2018, and 2019 in the experimental plot.; Table S2: Cumulative emissions and minimum and maximum ranges of CO2 (kg ha−1), N2O (g ha−1), and CH4 (g ha−1) for the 2017, 2018, and 2019 measurement years in the alleys and rows.

Author Contributions

T.G.C., E.P.P.Á. and J.M.M.V. designed the experiments and methodology. T.G.C., E.P.P.Á., J.M.M.V., R.M.P. and E.R.G. performed the experiments. E.R.G., J.M.M.V. and R.M.P. analyzed the data. E.R.G. and J.M.M.V. wrote the manuscript. All authors have read and agreed to the published version of the manuscript.

Funding

This research was supported by the FEDER funds and the Regional Government of La Rioja (Regional Project: PR-03-19).

Data Availability Statement

All data generated or analyzed during this study are included in the published paper.

Acknowledgments

E.R.G. thanks the government of La Rioja for her industrial doctorate contract.

Conflicts of Interest

The authors declare no conflict of interest.

References

  1. Ahmed, M. Introduction to Modern Climate Change. Andrew E. Dessler: Cambridge University Press, 2011, 252 pp, ISBN-10: 0521173159. Sci. Total Environ. 2020, 734, 139397. [Google Scholar] [CrossRef]
  2. Intergovernmental Panel on Climate Change. In Global Warming of 1.5 °C; Cambridge University Press: Cambridge, UK, 2019; ISBN 9781009157940. Available online: https://www.ipcc.ch/site/assets/uploads/sites/2/2022/06/SR15_Full_Report_HR.pdf (accessed on 20 August 2023).
  3. FAO-IPCC. Estimación de Emisiones de Gases de Efecto Invernadero En La Agricultura Un Manual Para Abordar Los Requisitos; FAO-IPCC: Rome, Italy, 2015; ISBN 9789253086740. [Google Scholar]
  4. Horel, Á.; Tóth, E.; Gelybó, G.; Dencso, M.; Potyó, I. Soil CO2 and N2O Emission Drivers in a Vineyard (Vitis Vinifera) under Different Soil Management Systems and Amendments. Sustainability 2018, 10, 1811. [Google Scholar] [CrossRef]
  5. Davidson, E.A.; Janssens, I.A. Temperature Sensitivity of Soil Carbon Decomposition and Feedbacks to Climate Change. Nature 2006, 440, 165–173. [Google Scholar] [CrossRef]
  6. Rey, A.; Pegoraro, E.; Tedeschi, V.; De Parri, I.; Jarvis, P.G.; Valentini, R. Annual Variation in Soil Respiration and Its Components in a Coppice Oak Forest in Central Italy. Glob. Chang. Biol. 2002, 8, 851–866. [Google Scholar] [CrossRef]
  7. Yu, O.T.; Greenhut, R.F.; O’Geen, A.T.; Mackey, B.; Horwath, W.R.; Steenwerth, K.L. Precipitation Events, Soil Type, and Vineyard Management Practices Influence Soil Carbon Dynamics in a Mediterranean Climate (Lodi, California). Soil Sci. Soc. Am. J. 2019, 83, 772–779. [Google Scholar] [CrossRef]
  8. Zamora-Morales, B.P.; Mendoza-Cariño, M.; Sangerman-Jarquín, D.M.; Quevedo Nolasco, A.; Navarro Bravo, A. El Manejo Del Suelo En La Conservación de Carbono Orgánico. Rev. Mex. Cienc. Agrícolas 2018, 9, 1787–1799. [Google Scholar] [CrossRef]
  9. Kessavalou, A.; Mosier, A.R.; Doran, J.W.; Drijber, R.A.; Lyon, D.J.; Heinemeyer, O. Fluxes of Carbon Dioxide, Nitrous Oxide, and Methane in Grass Sod and Winter Wheat-Fallow Tillage Management. J. Environ. Qual. 1998, 27, 1094–1104. [Google Scholar] [CrossRef]
  10. Franco-Luesma, S.; Cavero, J.; Plaza-Bonilla, D.; Cantero-Martínez, C.; Arrúe, J.L.; Álvaro-Fuentes, J. Tillage and Irrigation System Effects on Soil Carbon Dioxide (CO2) and Methane (CH4) Emissions in a Maize Monoculture under Mediterranean Conditions. Soil Tillage Res. 2020, 196, 104488. [Google Scholar] [CrossRef]
  11. Calleja-Cervantes, M.E.; Fernández-González, A.J.; Irigoyen, I.; Fernández-López, M.; Aparicio-Tejo, P.M.; Menéndez, S. Thirteen Years of Continued Application of Composted Organic Wastes in a Vineyard Modify Soil Quality Characteristics. Soil Biol. Biochem. 2015, 90, 241–254. [Google Scholar] [CrossRef]
  12. Sa, E.; Ferreira, J.; Carvalho, A.; Borrego, C. Development of Current and Future Pollutant Emissions for Portugal. Atmos. Pollut. Res. 2015, 6, 849–857. [Google Scholar] [CrossRef]
  13. García Sepúlveda, J.L.; Cueto Wong, J.A.; Báez Pérez, A.; Saynes Santillán, V. Fertilización Nitrogenada y Emisión de N2O En La Producción de Maíz En La Comarca Lagunera. Rev. Mex. Cienc. Agrícolas 2021, 12, 991–1003. [Google Scholar] [CrossRef]
  14. Lu, Y.; Huang, Y.; Zou, J.; Zheng, X. An Inventory of N2O Emissions from Agriculture in China Using Precipitation-Rectified Emission Factor and Background Emission. Chemosphere 2006, 65, 1915–1924. [Google Scholar] [CrossRef] [PubMed]
  15. Aguilera, E.; Lassaletta, L.; Sanz-Cobena, A.; Garnier, J.; Vallejo, A. The Potential of Organic Fertilizers and Water Management to Reduce N2O Emissions in Mediterranean Climate Cropping Systems. A Review. Agric. Ecosyst. Environ. 2013, 164, 32–52. [Google Scholar] [CrossRef]
  16. Meijide, A.; Díez, J.A.; Sánchez-Martín, L.; López-Fernández, S.; Vallejo, A. Nitrogen Oxide Emissions from an Irrigated Maize Crop Amended with Treated Pig Slurries and Composts in a Mediterranean Climate. Agric. Ecosyst. Environ. 2007, 121, 383–394. [Google Scholar] [CrossRef]
  17. Dutaur, L.; Verchot, L.V. A Global Inventory of the Soil CH4 Sink. Global. Biogeochem. Cycles 2007, 21, 1–9. [Google Scholar] [CrossRef]
  18. Livesley, S.J.; Idczak, D.; Fest, B.J. Differences in Carbon Density and Soil CH4/N2O Flux among Remnant and Agro-Ecosystems Established since European Settlement in the Mornington Peninsula, Australia. Sci. Total Environ. 2013, 465, 17–25. [Google Scholar] [CrossRef] [PubMed]
  19. Garland, G.M.; Suddick, E.; Burger, M.; Horwath, W.R.; Six, J. Corrigendum to “Direct N2O Emissions Following Transition from Conventional till to No-till in a Cover Cropped Mediterranean Vineyard (Vitis Vinifera)” [Agric. Ecosyst. Environ. 141 (2011) 234–239]. Agric. Ecosyst. Environ. 2011, 144, 422. [Google Scholar] [CrossRef]
  20. Service-USDA. U.S.D. of A.N.R.C. Claves Para La Taxonomía de Suelos. Mdp. Edu. Ar. 2014, 339. Available online: https://www.nrcs.usda.gov/sites/default/files/2022-10/Spanish-Keys-to-Soil-Taxonomy.pdf (accessed on 20 August 2023).
  21. Timothy, B.P.; Rodney, T. Venterea USDA-ARS GRACEnet Project Protocols Chapter 3. Chamber-Based Trace Gas Flux Measurements. Flux 2010, 2010, 1–39. [Google Scholar]
  22. Garland, G.M.; Suddick, E.; Burger, M.; Horwath, W.R.; Six, J. Direct N2O Emissions from a Mediterranean Vineyard: Event-Related Baseline Measurements. Agric. Ecosyst. Environ. 2014, 195, 44–52. [Google Scholar] [CrossRef]
  23. Recio, J.; Vallejo, A.; Le-Noë, J.; Garnier, J.; García-Marco, S.; Álvarez, J.M.; Sanz-Cobena, A. The Effect of Nitrification Inhibitors on NH3 and N2O Emissions in Highly N Fertilized Irrigated Mediterranean Cropping Systems. Sci. Total Environ. 2018, 636, 427–436. [Google Scholar] [CrossRef] [PubMed]
  24. Marín-Martínez, A.; Sanz-Cobeña, A.; Bustamante, M.A.; Agulló, E.; Paredes, C. Effect of Organic Amendment Addition on Soil Properties, Greenhouse Gas Emissions and Grape Yield in Semi-Arid Vineyard Agroecosystems. Agronomy 2021, 11, 1477. [Google Scholar] [CrossRef]
  25. Pereira, J.; Figueiredo, N.; Goufo, P.; Carneiro, J.; Morais, R.; Carranca, C.; Coutinho, J.; Trindade, H. Effects of Elevated Temperature and Atmospheric Carbon Dioxide Concentration on the Emissions of Methane and Nitrous Oxide from Portuguese Flooded Rice Fields. Atmos. Environ. 2013, 80, 464–471. [Google Scholar] [CrossRef]
  26. Fangueiro, D.; Becerra, D.; Albarrán, Á.; Peña, D.; Sanchez-Llerena, J.; Rato-Nunes, J.M.; López-Piñeiro, A. Effect of Tillage and Water Management on GHG Emissions from Mediterranean Rice Growing Ecosystems. Atmos. Environ. 2017, 150, 303–312. [Google Scholar] [CrossRef]
  27. Raich, J.W.; Schlesinger, W.H. The Global Carbon Dioxide Flux in Soil Respiration and Its Relationship to Vegetation and Climate. Tellus. Ser. B 1992, 44, 81–99. [Google Scholar] [CrossRef]
  28. Sánchez-Navarro, V.; Shahrokh, V.; Martínez-Martínez, S.; Acosta, J.A.; Almagro, M.; Martínez-Mena, M.; Boix-Fayos, C.; Díaz-Pereira, E.; Zornoza, R. Perennial Alley Cropping Contributes to Decrease Soil CO2 and N2O Emissions and Increase Soil Carbon Sequestration in a Mediterranean Almond Orchard. Sci. Total Environ. 2022, 845, 157225. [Google Scholar] [CrossRef]
  29. Reicosky, D.C.; Dugas, W.A.; Torbert, H.A. Tillage-Induced Soil Carbon Dioxide Loss from Different Cropping Systems. Soil Tillage Res. 1997, 41, 105–118. [Google Scholar] [CrossRef]
  30. Six, J.; Elliott, E.T.; Paustian, K. Aggregate and Soil Organic Matter Dynamics under Conventional and No-Tillage Systems. Soil Sci. Soc. Am. J. 1999, 63, 1350–1358. [Google Scholar] [CrossRef]
  31. Calderón, F.J.; Jackson, L.E.; Scow, K.M.; Rolston, D.E. Short-Term Dynamics of Nitrogen, Microbial Activity, and Phospholipid Fatty Acids after Tillage. Soil Sci. Soc. Am. J. 2001, 65, 118–126. [Google Scholar] [CrossRef]
  32. Steenwerth, K.L.; Pierce, D.L.; Carlisle, E.A.; Spencer, R.G.M.; Smart, D.R. A Vineyard Agroecosystem: Disturbance and Precipitation Affect Soil Respiration under Mediterranean Conditions. Soil Sci. Soc. Am. J. 2010, 74, 231–239. [Google Scholar] [CrossRef]
  33. Marques, F.J.M.; Pedroso, V.; Trindade, H.; Pereira, J.L.S. Impact of Vineyard Cover Cropping on Carbon Dioxide and Nitrous Oxide Emissions in Portugal. Atmos. Pollut. Res. 2018, 9, 105–111. [Google Scholar] [CrossRef]
  34. Rey, A.; Petsikos, C.; Jarvis, P.G.; Grace, J. Effect of Temperature and Moisture on Rates of Carbon Mineralization in a Mediterranean Oak Forest Soil under Controlled and Field Conditions. Eur. J. Soil Sci. 2005, 56, 589–599. [Google Scholar] [CrossRef]
  35. Lampurlanés, J.; Plaza-Bonilla, D.; Álvaro-Fuentes, J.; Cantero-Martínez, C. Long-Term Analysis of Soil Water Conservation and Crop Yield under Different Tillage Systems in Mediterranean Rainfed Conditions. F Crop. Res. 2016, 189, 59–67. [Google Scholar] [CrossRef]
  36. López-Urrea, R.; Sánchez, J.M.; Montoro, A.; Mañas, F.; Intrigliolo, D.S. Effect of Using Pruning Waste as an Organic Mulching on a Drip-Irrigated Vineyard Evapotranspiration under a Semi-Arid Climate. Agric. For. Meteorol. 2020, 291, 108064. [Google Scholar] [CrossRef]
  37. Morell, F.J.; Álvaro-Fuentes, J.; Lampurlanés, J.; Cantero-Martínez, C. Soil CO2 Fluxes Following Tillage and Rainfall Events in a Semiarid Mediterranean Agroecosystem: Effects of Tillage Systems and Nitrogen Fertilization. Agric. Ecosyst. Environ. 2010, 139, 167–173. [Google Scholar] [CrossRef]
  38. Yu, O.T.; Greenhut, R.F.; O’Geen, A.T.; Mackey, B.; Horwath, W.R.; Steenwerth, K.L. Precipitation Events and Management Practices Affect Greenhouse Gas Emissions from Vineyards in a Mediterranean Climate. Soil Sci. Soc. Am. J. 2017, 81, 138–152. [Google Scholar] [CrossRef]
  39. Fernández-Rodríguez, D.; Fangueiro, D.P.; Abades, D.P.; Albarrán, Á.; Rato-Nunes, J.M.; López-Piñeiro, A. Direct and Residual Impacts of Olive-Mill Waste Application to Rice Soil on Greenhouse Gas Emission and Global Warming Potential under Mediterranean Conditions. Agronomy 2022, 12, 1344. [Google Scholar] [CrossRef]
  40. McKenney, D.J.; Wang, S.W.; Drury, C.F.; Findlay, W.I. Dentrification and Mineralization in Soil Amended with Legume, Grass, and Corn Residues. Soil Sci. Soc. Am. J. 1993, 57, 1013–1020. [Google Scholar] [CrossRef]
  41. Zhu, X.; Burger, M.; Doane, T.A.; Horwath, W.R. Ammonia Oxidation Pathways and Nitrifier Denitrification Are Significant Sources of N2O and NO under Low Oxygen Availability. Proc. Natl. Acad. Sci. USA 2013, 110, 6328–6333. [Google Scholar] [CrossRef]
  42. Galbally, I.E.; Kirstine, W.V.; Meyer, C.P.M.; Wang, Y.P. Soil-Atmosphere Trace Gas Exchange in Semiarid and Arid Zones. J. Environ. Qual. 2008, 37, 599–607. [Google Scholar] [CrossRef]
  43. Cowan, N.; Levy, P.; Maire, J.; Coyle, M.; Leeson, S.R.; Famulari, D.; Carozzi, M.; Nemitz, E.; Skiba, U. An Evaluation of Four Years of Nitrous Oxide Fluxes after Application of Ammonium Nitrate and Urea Fertilisers Measured Using the Eddy Covariance Method. Agric. For. Meteorol. 2020, 280, 107812. [Google Scholar] [CrossRef]
  44. Sander, B.O.; Samson, M.; Buresh, R.J. Methane and Nitrous Oxide Emissions from Flooded Rice Fields as Affected by Water and Straw Management between Rice Crops. Geoderma 2014, 235–236, 355–362. [Google Scholar] [CrossRef]
  45. Lazcano, C.; Gonzalez-Maldonado, N.; Yao, E.H.; Wong, C.T.F.; Merrilees, J.J.; Falcone, M.; Peterson, J.D.; Casassa, L.F.; Decock, C. Sheep Grazing as a Strategy to Manage Cover Crops in Mediterranean Vineyards: Short-Term Effects on Soil C, N and Greenhouse Gas (N2O, CH4, CO2) Emissions. Agric. Ecosyst. Environ. 2022, 327, 107825. [Google Scholar] [CrossRef]
  46. Heller, H.; Bar-Tal, A.; Tamir, G.; Bloom, P.; Venterea, R.T.; Chen, D.; Zhang, Y.; Clapp, C.E.; Fine, P. Effects of Manure and Cultivation on Carbon Dioxide and Nitrous Oxide Emissions from a Corn Field under Mediterranean Conditions. J. Environ. Qual. 2010, 39, 437–448. [Google Scholar] [CrossRef] [PubMed]
  47. Goldberg, S.D.; Gebauer, G. N2O and NO Fluxes between a Norway Spruce Forest Soil and Atmosphere as Affected by Prolonged Summer Drought. Soil Biol. Biochem. 2009, 41, 1986–1995. [Google Scholar] [CrossRef]
  48. Wolff, M.W.; Alsina, M.M.; Stockert, C.M.; Khalsa, S.D.S.; Smart, D.R. Minimum Tillage of a Cover Crop Lowers Net GWP and Sequesters Soil Carbon in a California Vineyard. Soil Tillage Res. 2018, 175, 244–254. [Google Scholar] [CrossRef]
  49. Ball, B.C.; Dobbie, K.E.; Parker, J.P.; Smith, K.A. The Influence of Gas Transport and Porosity on Methane Oxidation in Soils. J. Geophys. Res. Atmos. 1997, 102, 23301–23308. [Google Scholar] [CrossRef]
  50. Shvaleva, A.; Cruz, C.; Castaldi, S.; Rosa, A.P.; Chaves, M.M.; Pereira, J.S. Shvaleva Corrected Final Version 2E. Plant Soil Environ. 2011, 2011, 471–477. [Google Scholar]
  51. Cai, Y.; Chang, S.X.; Cheng, Y. Greenhouse Gas Emissions from Excreta Patches of Grazing Animals and Their Mitigation Strategies. Earth Sci. Rev. 2017, 171, 44–57. [Google Scholar] [CrossRef]
  52. Gao, B.; Ju, X.; Su, F.; Meng, Q.; Oenema, O.; Christie, P.; Chen, X.; Zhang, F. Nitrous Oxide and Methane Emissions from Optimized and Alternative Cereal Cropping Systems on the North China Plain: A Two-Year Field Study. Sci. Total Environ. 2014, 472, 112–124. [Google Scholar] [CrossRef]
  53. Smith, P.; Soussana, J.F.; Angers, D.; Schipper, L.; Chenu, C.; Rasse, D.P.; Batjes, N.H.; van Egmond, F.; McNeill, S.; Kuhnert, M.; et al. How to Measure, Report and Verify Soil Carbon Change to Realize the Potential of Soil Carbon Sequestration for Atmospheric Greenhouse Gas Removal. Glob. Chang. Biol. 2020, 26, 219–241. [Google Scholar] [CrossRef] [PubMed]
  54. Fiedler, S.; Höll, B.S.; Jungkunst, H.F. Methane Budget of a Black Forest Spruce Ecosystem Considering Soil Pattern. Biogeochemistry 2005, 76, 1–20. [Google Scholar] [CrossRef]
  55. Pu, C.; Chen, J.S.; Wang, H.D.; Virk, A.L.; Zhao, X.; Zhang, H.L. Greenhouse Gas Emissions from the Wheat-Maize Cropping System under Different Tillage and Crop Residue Management Practices in the North China Plain. Sci. Total Environ. 2022, 819, 153089. [Google Scholar] [CrossRef] [PubMed]
Figure 1. Precipitation (mm) during 2017, 2018, and 2019.
Agronomy 13 02199 g001
Figure 2. Temperature record in the years 2017, 2018, and 2019.
Agronomy 13 02199 g002
Figure 3. Soil moisture (% w/w) of the surface horizon (row and alley) in the year 2019.
Agronomy 13 02199 g003
Figure 4. Evolution of soil CO2 emissions (kg CO2 ha−1 day−1) during the period 2017–2019. Precipitation is represented as the sum of precipitation on the days prior to the measurement (l m−2). P = pruning; L = tillage; AM = mineral fertilization; C = digging rows; V = harvest; R = irrigation; E = organic amendment; * indicates significant differences between row and alley emissions for a given date at p < 0.05.
Agronomy 13 02199 g004
Figure 5. Evolution of soil N2O emissions (g N2O ha−1 day−1) during the period 2017–2019. Precipitation is represented as the sum of precipitation on the days prior to the measurement (l m−2). P = pruning; L = tillage; AM = mineral fertilization; C = digging rows; V = harvest; R = irrigation; E = organic amendment;.
Agronomy 13 02199 g005
Figure 6. Evolution of soil CH4 emissions (g CH4 ha−1 day−1) during the period 2017–2019. Precipitation is represented as the sum of precipitation on the days prior to the measurement (l m−2). P = pruning; L = tillage; AM = mineral fertilization; C = digging rows; V = harvest; R = irrigation; E = organic amendment; * indicates significant differences between row and alley emissions for a given date at p < 0.05.
Agronomy 13 02199 g006
Table 1. Physical and chemical characteristics of the vineyard soil.
Horiz.Depth (cm)Clay (%)Silt (%)Sand (%)OM (g kg−1)N (g kg−1)C/N RatioCarbonates (g kg−1)AL (g kg−1)pH (Water 1:5)EC (mmhos cm−1)
Ap5518.341.440.410.30.728.31133.039.08.40.12
Bwk17015.139.045.94.20.308.23160.046.08.70.10
Bwk21311.533.754.82.30.216.19137.033.08.80.14
Bwk36218.530.351.32.90.364.69125.042.08.70.24
Nomenclature abbreviations: OM, organic matters; N, nitrogen; C/N ratio, carbon/nitrogen ratio; AL, active limestone; EC, electrical conductivity.
Disclaimer/Publisher’s Note: The statements, opinions and data contained in all publications are solely those of the individual author(s) and contributor(s) and not of MDPI and/or the editor(s). MDPI and/or the editor(s) disclaim responsibility for any injury to people or property resulting from any ideas, methods, instructions or products referred to in the content.

